Nature Astronomy ( IF 12.9 ) Pub Date : 2020-04-06 , DOI: 10.1038/s41550-020-1060-0 Z. Brown , T. Koskinen , I. Müller-Wodarg , R. West , A. Jouchoux , L. Esposito
|
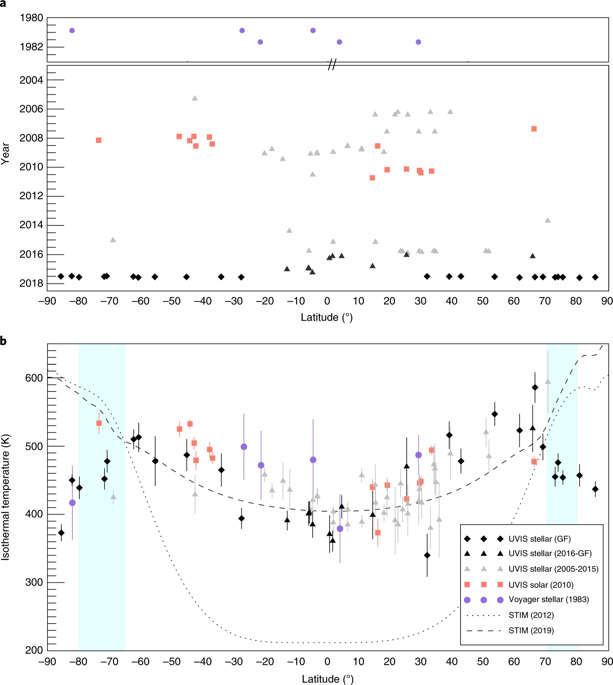
Temperatures of the outer planet thermospheres exceed those predicted by solar heating alone by several hundred degrees. Enough energy is deposited at auroral regions to heat the entire thermosphere, but models predict that equatorward distribution is inhibited by strong Coriolis forces and ion drag1,2. A better understanding of auroral energy deposition and circulation are critical to solving this so-called energy crisis. Stellar occultations observed by the Ultraviolet Imaging Spectrograph instrument during the Cassini Grand Finale were designed to map the thermosphere from pole to pole. We analyse these observations, together with earlier observations from 2016 and 2017, to create a two-dimensional map of densities and temperatures in Saturn’s thermosphere as a function of latitude and depth. The observed temperatures at auroral latitudes are cooler and peak at higher altitudes and lower latitudes than predicted by models, leading to a shallower meridional pressure gradient. Under modified geostrophy3, we infer slower westward zonal winds that extend to lower latitudes than predicted, supporting equatorward flow from approximately 70° to 30° latitude in both hemispheres. We also show evidence of atmospheric waves in the data that can contribute to equatorward redistribution of energy through zonal drag.
中文翻译:
根据卡西尼大结局数据,土星热圈的极间压力-温度图
外部行星热层的温度比仅靠太阳加热所预测的温度高数百度。足够的能量沉积在极光区域以加热整个热圈,但模型预测,强科里奥利力和离子阻力1,2抑制了赤道分布。更好地了解极光能量的沉积和循环对于解决这种所谓的能源危机至关重要。在卡西尼大结局期间,通过紫外线成像光谱仪观测到的恒星掩星被设计用于绘制极与极之间的热圈图。我们将这些观测数据与2016年和2017年的早期观测数据进行分析,以创建土星热圈密度和温度随纬度和深度变化的二维图。与模型所预测的相比,在极光纬度处观测到的温度更低,并且在更高的海拔和更低的纬度处达到峰值,从而导致子午压力梯度变浅。修改后的地球动力学3,我们推断出向西延伸的纬向风比预期的要慢,这支持了两个半球从约70°至30°的赤道流。我们还在数据中显示了大气波的证据,这些大气波可以通过纬向阻力来促进赤道能量的重新分配。


 京公网安备 11010802027423号