Our official English website, www.x-mol.net, welcomes your
feedback! (Note: you will need to create a separate account there.)
Trends in Diet Quality Among Youth in the United States, 1999-2016
JAMA ( IF 63.1 ) Pub Date : 2020-03-24 , DOI: 10.1001/jama.2020.0878 Junxiu Liu 1 , Colin D Rehm 2, 3 , Jennifer Onopa 1 , Dariush Mozaffarian 1
JAMA ( IF 63.1 ) Pub Date : 2020-03-24 , DOI: 10.1001/jama.2020.0878 Junxiu Liu 1 , Colin D Rehm 2, 3 , Jennifer Onopa 1 , Dariush Mozaffarian 1
Affiliation
|
Importance
Prior studies of dietary trends among US youth have evaluated major macronutrients or only a few foods or have used older data. Objective
To characterize trends in diet quality among US youth. Design, Setting, and Participants
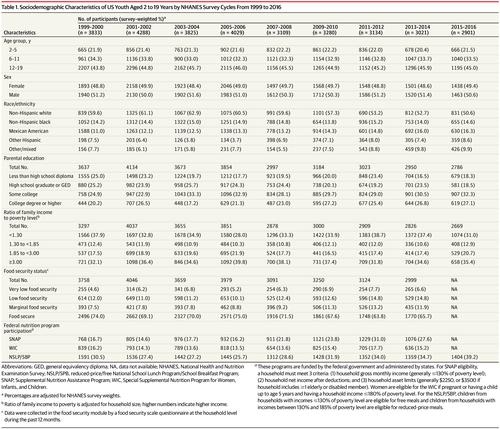
Serial cross-sectional investigation using 24-hour dietary recalls from youth aged 2 to 19 years from 9 National Health and Nutrition Examination Survey (NHANES) cycles (1999-2016). Exposures
Calendar year and population sociodemographic characteristics. Main Outcomes and Measures
The primary outcomes were the survey-weighted, energy-adjusted mean consumption of dietary components and proportion meeting targets of the American Heart Association (AHA) 2020 continuous diet score (range, 0-50; based on total fruits and vegetables, whole grains, fish and shellfish, sugar-sweetened beverages, and sodium). Additional outcomes were the AHA secondary score (range, 0-80; adding nuts, seeds, and legumes; processed meat; and saturated fat) and Healthy Eating Index (HEI) 2015 score (range, 0-100). Poor diet was defined as less than 40% adherence (scores, <20 for primary and <32 for secondary AHA scores); intermediate as 40% to 79.9% adherence (scores, 20-39.9 and 32-63.9, respectively); and ideal, as at least 80% adherence (scores, ≥40 and ≥64, respectively). Higher diet scores indicate better diet quality; a minimal clinically important difference has not been quantified. Results
Of 31 420 youth aged 2 to 19 years included, the mean age was 10.6 years; 49.1% were female. From 1999 to 2016, the estimated AHA primary diet score significantly increased from 14.8 (95% CI, 14.1-15.4) to 18.8 (95% CI, 18.1-19.6) (27.0% improvement), the estimated AHA secondary diet score from 29.2 (95% CI, 28.1-30.4) to 33.0 (95% CI, 32.0-33.9) (13.0% improvement), and the estimated HEI-2015 score from 44.6 (95% CI, 43.5-45.8) to 49.6 (95% CI, 48.5-50.8) (11.2% improvement) (P < .001 for trend for each). Based on the AHA primary diet score, the estimated proportion of youth with poor diets significantly declined from 76.8% (95% CI, 72.9%-80.2%) to 56.1% (95% CI, 51.4%-60.7%) and with intermediate diets significantly increased from 23.2% (95% CI, 19.8%-26.9%) to 43.7% (95% CI, 39.1%-48.3%) (P < .001 for trend for each). The estimated proportion meeting ideal quality significantly increased but remained low, from 0.07% (95% CI, 0.01%-0.49%) to 0.25% (95% CI, 0.10%-0.62%) (P = .03 for trend). Persistent dietary variations were identified across multiple sociodemographic groups. The estimated proportion of youth with a poor diet in 2015-2016 was 39.8% (95% CI, 35.1%-44.5%) for ages 2 to 5 years (unweighted n = 666), 52.5% (95% CI, 46.4%-58.5%) for ages 6 to 11 years (unweighted n = 1040), and 66.6% (95% CI, 61.4%-71.4%) for ages 12 to 19 years (unweighted n = 1195), with persistent differences across levels of parental education, household income, and household food security status. Conclusions and Relevance
Based on serial NHANES surveys from 1999 to 2016, the estimated overall diet quality of US youth showed modest improvement, but more than half of youth still had poor-quality diets.
中文翻译:

1999-2016年美国青少年饮食质量趋势
重要性 先前对美国年轻人饮食趋势的研究评估了主要的常量营养素或仅评估了少数食物,或者使用了较旧的数据。目的 描述美国年轻人饮食质量的趋势。设计、设置和参与者 使用来自 9 个国家健康和营养检查调查 (NHANES) 周期(1999-2016)的 2 至 19 岁青少年的 24 小时饮食回忆进行系列横断面调查。暴露年份和人口社会人口特征。主要成果和措施 主要成果是经调查加权、能量调整后的膳食成分平均消耗量以及满足美国心脏协会 (AHA) 2020 年连续饮食评分目标的比例(范围 0-50;基于水果和蔬菜总量) 、全谷物、鱼和贝类、含糖饮料和钠)。其他结果是 AHA 二级评分(范围,0-80;添加坚果、种子和豆类;加工肉类;和饱和脂肪)和健康饮食指数 (HEI) 2015 评分(范围,0-100)。不良饮食定义为遵守率低于 40%(AHA 初级评分 <20,次级 AHA 评分 <32);中间为 40% 至 79.9% 的依从性(分数分别为 20-39.9 和 32-63.9);理想的是至少 80% 的依从性(分数分别≥40 和 ≥64)。饮食得分越高表明饮食质量越好;尚未量化临床上最小的重要差异。结果 纳入31 420名2~19岁青少年,平均年龄10.6岁;49.1%为女性。从 1999 年到 2016 年,估计的 AHA 主要饮食评分从 14.8(95% CI,14.1-15.4)显着增加到 18.8(95% CI,18.1-19.6)(改善 27.0%),估计的 AHA 次要饮食评分从 29.2( 95% CI,28.1-30.4)至 33.0(95% CI,32.0-33.9)(改善 13.0%),估计 HEI-2015 分数从 44.6(95% CI,43.5-45.8)至 49.6(95% CI, 48.5-50.8)(改善 11.2%)(每个趋势 P < .001)。根据 AHA 主要饮食评分,饮食不良和饮食中等的青少年比例从 76.8%(95% CI,72.9%-80.2%)显着下降至 56.1%(95% CI,51.4%-60.7%)从 23.2% (95% CI, 19.8%-26.9%) 显着增加至 43.7% (95% CI, 39.1%-48.3%)(每个趋势 P < .001)。达到理想质量的估计比例显着增加,但仍然较低,从 0.07% (95% CI, 0.01%-0.49%) 到 0.25% (95% CI, 0.10%-0.62%)(趋势 P = 0.03)。在多个社会人口群体中发现了持续的饮食变化。2015-2016 年饮食不良的青少年比例估计为 39.8%(95% CI,35.1%-44.5%),2 至 5 岁(未加权 n = 666),52.5%(95% CI,46.4%- 6 至 11 岁(未加权 n = 1040)的这一比例为 58.5%),12 至 19 岁(未加权 n = 1195)的比例为 66.6%(95% CI,61.4%-71.4%),不同父母水平之间存在持续差异教育、家庭收入和家庭粮食安全状况。
更新日期:2020-03-24
中文翻译:
1999-2016年美国青少年饮食质量趋势
重要性 先前对美国年轻人饮食趋势的研究评估了主要的常量营养素或仅评估了少数食物,或者使用了较旧的数据。目的 描述美国年轻人饮食质量的趋势。设计、设置和参与者 使用来自 9 个国家健康和营养检查调查 (NHANES) 周期(1999-2016)的 2 至 19 岁青少年的 24 小时饮食回忆进行系列横断面调查。暴露年份和人口社会人口特征。主要成果和措施 主要成果是经调查加权、能量调整后的膳食成分平均消耗量以及满足美国心脏协会 (AHA) 2020 年连续饮食评分目标的比例(范围 0-50;基于水果和蔬菜总量) 、全谷物、鱼和贝类、含糖饮料和钠)。其他结果是 AHA 二级评分(范围,0-80;添加坚果、种子和豆类;加工肉类;和饱和脂肪)和健康饮食指数 (HEI) 2015 评分(范围,0-100)。不良饮食定义为遵守率低于 40%(AHA 初级评分 <20,次级 AHA 评分 <32);中间为 40% 至 79.9% 的依从性(分数分别为 20-39.9 和 32-63.9);理想的是至少 80% 的依从性(分数分别≥40 和 ≥64)。饮食得分越高表明饮食质量越好;尚未量化临床上最小的重要差异。结果 纳入31 420名2~19岁青少年,平均年龄10.6岁;49.1%为女性。从 1999 年到 2016 年,估计的 AHA 主要饮食评分从 14.8(95% CI,14.1-15.4)显着增加到 18.8(95% CI,18.1-19.6)(改善 27.0%),估计的 AHA 次要饮食评分从 29.2( 95% CI,28.1-30.4)至 33.0(95% CI,32.0-33.9)(改善 13.0%),估计 HEI-2015 分数从 44.6(95% CI,43.5-45.8)至 49.6(95% CI, 48.5-50.8)(改善 11.2%)(每个趋势 P < .001)。根据 AHA 主要饮食评分,饮食不良和饮食中等的青少年比例从 76.8%(95% CI,72.9%-80.2%)显着下降至 56.1%(95% CI,51.4%-60.7%)从 23.2% (95% CI, 19.8%-26.9%) 显着增加至 43.7% (95% CI, 39.1%-48.3%)(每个趋势 P < .001)。达到理想质量的估计比例显着增加,但仍然较低,从 0.07% (95% CI, 0.01%-0.49%) 到 0.25% (95% CI, 0.10%-0.62%)(趋势 P = 0.03)。在多个社会人口群体中发现了持续的饮食变化。2015-2016 年饮食不良的青少年比例估计为 39.8%(95% CI,35.1%-44.5%),2 至 5 岁(未加权 n = 666),52.5%(95% CI,46.4%- 6 至 11 岁(未加权 n = 1040)的这一比例为 58.5%),12 至 19 岁(未加权 n = 1195)的比例为 66.6%(95% CI,61.4%-71.4%),不同父母水平之间存在持续差异教育、家庭收入和家庭粮食安全状况。


 京公网安备 11010802027423号