当前位置:
X-MOL 学术
›
Comput. Graph. Forum
›
论文详情
Our official English website, www.x-mol.net, welcomes your
feedback! (Note: you will need to create a separate account there.)
Visual Analysis of Missing Values in Longitudinal Cohort Study Data
Computer Graphics Forum ( IF 2.7 ) Pub Date : 2019-05-21 , DOI: 10.1111/cgf.13662 S. Alemzadeh 1, 2 , U. Niemann 3 , T. Ittermann 4 , H. Völzke 4 , D. Schneider 5 , M. Spiliopoulou 3 , K. Bühler 2 , B. Preim 1
Computer Graphics Forum ( IF 2.7 ) Pub Date : 2019-05-21 , DOI: 10.1111/cgf.13662 S. Alemzadeh 1, 2 , U. Niemann 3 , T. Ittermann 4 , H. Völzke 4 , D. Schneider 5 , M. Spiliopoulou 3 , K. Bühler 2 , B. Preim 1
Affiliation
|
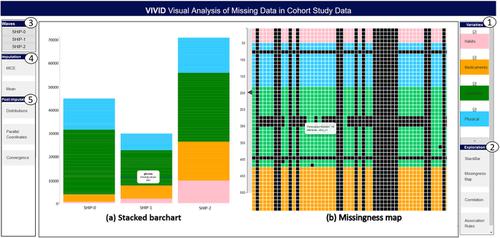
Attrition or dropout is the most severe missingness problem in longitudinal cohort study data where some participants do not show up for follow‐up examinations. Dropouts result in biased data and cause the reduction of 1ata set size. Moreover, they limit the power of statistical analysis and the validity of study findings. Visualization can play a strong role in analysing and displaying the missingness patterns. In this work, we present VIVID, a framework for the visual analysis of missing values in cohort study data. VIVID is inspired by discussions with epidemiologists and adds visual components to their current statistics‐based approaches. VIVID provides functions for exploration, imputation and validity check of imputations. The main focus of this paper is multiple imputation to fix the missing data.
中文翻译:

纵向队列研究数据中缺失值的可视化分析
流失或辍学是纵向队列研究数据中最严重的缺失问题,其中一些参与者没有出现在后续检查中。Dropouts 会导致有偏差的数据并导致 1ata 集大小的减少。此外,它们限制了统计分析的力量和研究结果的有效性。可视化可以在分析和显示缺失模式方面发挥重要作用。在这项工作中,我们提出了 VIVID,这是一个用于对队列研究数据中的缺失值进行可视化分析的框架。VIVID 的灵感来自与流行病学家的讨论,并将视觉组件添加到他们当前基于统计的方法中。VIVID 提供了对插补的探索、插补和有效性检查的功能。本文的主要重点是多重插补以修复缺失数据。
更新日期:2019-05-21
中文翻译:
纵向队列研究数据中缺失值的可视化分析
流失或辍学是纵向队列研究数据中最严重的缺失问题,其中一些参与者没有出现在后续检查中。Dropouts 会导致有偏差的数据并导致 1ata 集大小的减少。此外,它们限制了统计分析的力量和研究结果的有效性。可视化可以在分析和显示缺失模式方面发挥重要作用。在这项工作中,我们提出了 VIVID,这是一个用于对队列研究数据中的缺失值进行可视化分析的框架。VIVID 的灵感来自与流行病学家的讨论,并将视觉组件添加到他们当前基于统计的方法中。VIVID 提供了对插补的探索、插补和有效性检查的功能。本文的主要重点是多重插补以修复缺失数据。


 京公网安备 11010802027423号