当前位置:
X-MOL 学术
›
Atmos. Environ.
›
论文详情
Our official English website, www.x-mol.net, welcomes your
feedback! (Note: you will need to create a separate account there.)
Meteorological characteristics within boundary layer and its influence on PM2.5 pollution in six cities of North China based on WRF-Chem
Atmospheric Environment ( IF 4.2 ) Pub Date : 2020-05-01 , DOI: 10.1016/j.atmosenv.2020.117417 Zhe Lv , Wei Wei , Shuiyuan Cheng , Xiaoyan Han , Xiaoqi Wang
Atmospheric Environment ( IF 4.2 ) Pub Date : 2020-05-01 , DOI: 10.1016/j.atmosenv.2020.117417 Zhe Lv , Wei Wei , Shuiyuan Cheng , Xiaoyan Han , Xiaoqi Wang
|
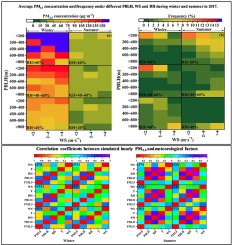
Abstract North China is recognized as one of the region with most severe air pollution in China, and the PM2.5 in six major cities (Beijing, Tianjin, Shijiazhuang, Taiyuan, Jinan and Zhengzhou) of this region was measured to be 108.7–186.0 μg m−3 in January 2017 and 39.2–56.3 μg m−3 in July 2017. This study conducts the meteorological and chemical simulations based on WRF-Chem, and explores the impacts of meteorology and emissions on PM2.5 (particulate matter with aerodynamic diameters ≤ 2.5 μm) pollutions. Simulations show a noticeable seasonal variation in planetary boundary layer height (PBLH) and relative humidity (RH), but a similar trend in wind speed (WS). Compared to PM2.5 good condition (≤75 μg m−3), daily PBLH decreased by 7.6–39.6% in January and 9.2–44.1% in July during PM2.5 polluted condition (75~150 μg m−3), and by 22.3–51.2% in January during severely polluted condition (≥150 μg m−3). PBLH is thought of as the key factor for PM2.5. Then, the synergy between PBLH and other meteorological factors are studied. For a 100 m failing in PBLH, the decrease in surface WS reaches 0.2–0.8 m s−1 0.1–0.3 m s−1 in January and July. It means a synergic effect of unfavorable horizontal and vertical dispersions, more adversely in January than in July. While, RH presents an increasing trend with PBLH falling, about +2.1~+3.2% in January and +2.7~+4.6% in July per 100 m falling in PBLH. Considering the improvement of high RH in heterogeneous chemistry to form the secondary PM2.5, we believe that the disadvantaged dispersion condition is always accompanied by enhanced secondary PM2.5 formation chemistry. Then, we summarize the average simulated PM2.5 under various combinations of PBLH, WS and RH, and find that under the same meteorological combination, PM2.5 in January was about 1.7–3.6 times that of July, which could be explained by the more emissions of PM2.5 and its precursors in January. Finally, we determine the unfavorable meteorology condition based on current regional emissions and China's standard (hourly PM2.5 40%) for January, high RH (>60%) & low-middle WS (
更新日期:2020-05-01


 京公网安备 11010802027423号