Our official English website, www.x-mol.net, welcomes your
feedback! (Note: you will need to create a separate account there.)
Changes in List Prices, Net Prices, and Discounts for Branded Drugs in the US, 2007-2018
JAMA ( IF 63.1 ) Pub Date : 2020-03-03 , DOI: 10.1001/jama.2020.1012 Inmaculada Hernandez 1, 2 , Alvaro San-Juan-Rodriguez 1, 2 , Chester B Good 2, 3, 4, 5 , Walid F Gellad 2, 3, 5
JAMA ( IF 63.1 ) Pub Date : 2020-03-03 , DOI: 10.1001/jama.2020.1012 Inmaculada Hernandez 1, 2 , Alvaro San-Juan-Rodriguez 1, 2 , Chester B Good 2, 3, 4, 5 , Walid F Gellad 2, 3, 5
Affiliation
|
Importance
Most studies that have examined drug prices have focused on list prices, without accounting for manufacturer rebates and other discounts, which have substantially increased in the last decade. Objective
To describe changes in list prices, net prices, and discounts for branded pharmaceutical products for which US sales are reported by publicly traded companies, and to determine the extent to which list price increases were offset by increases in discounts. Design, Setting, and Participants
Retrospective descriptive study using 2007-2018 pricing data from the investment firm SSR Health for branded products available before January 2007 with US sales reported by publicly traded companies (n = 602 drugs). Net prices were estimated by compiling company-reported sales for each product and number of units sold in the US. Exposures
Calendar year. Main Outcomes and Measures
Outcomes included list and net prices and discounts in Medicaid and other payers. List prices represent manufacturers' price to wholesalers or direct purchasers but do not account for discounts. Net prices represent revenue per unit of the product after all manufacturer concessions are accounted for (including rebates, coupon cards, and any other discount). Means of outcomes were calculated each year for the overall sample and 6 therapeutic classes, weighting each product by utilization and adjusting for inflation. Results
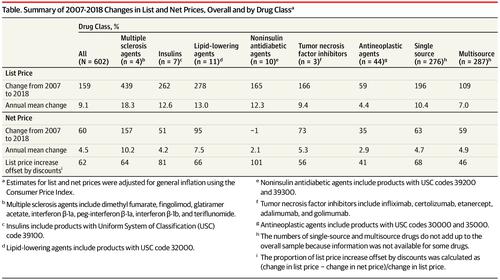
From 2007 to 2018, list prices increased by 159% (95% CI, 137%-181%), or 9.1% per year, while net prices increased by 60% (95% CI, 36%-84%), or 4.5% per year, with stable net prices between 2015 and 2018. Discounts increased from 40% to 76% in Medicaid and from 23% to 51% for other payers. Increases in discounts offset 62% of list price increases. There was large variability across classes. Multiple sclerosis treatments (n = 4) had the greatest increases in list (439%) and net (157%) prices. List prices of lipid-lowering agents (n = 11) increased by 278% and net prices by 95%. List prices of tumor necrosis factor inhibitors (n = 3) increased by 166% and net prices by 73%. List prices of insulins (n = 7) increased by 262%, and net prices by 51%. List prices of noninsulin antidiabetic agents (n = 10) increased by 165%, and net prices decreased by 1%. List price increases were lowest (59%) for antineoplastic agents (n = 44), but discounts only offset 41% of list price increases, leading to 35% increase in net prices. Conclusions and Relevance
In this analysis of branded drugs in the US from 2007 to 2018, mean increases in list and net prices were substantial, although discounts offset an estimated 62% of list price increases with substantial variation across classes.
中文翻译:

2007-2018年美国品牌药的标价、净价和折扣变化
重要性 大多数检查药品价格的研究都集中在标价上,没有考虑制造商回扣和其他折扣,这些折扣在过去十年中大幅增加。目的 描述上市公司在美国销售的品牌药品的标价、净价和折扣的变化,并确定标价增长被折扣增加抵消的程度。设计、设置和参与者 回顾性描述性研究使用来自投资公司 SSR Health 的 2007-2018 年定价数据,用于 2007 年 1 月之前可用的品牌产品,以及上市公司报告的美国销售额(n = 602 种药物)。净价格是通过编制公司报告的每种产品的销售额和在美国销售的单位数量来估算的。曝光 日历年。主要结果和措施 结果包括医疗补助和其他支付者的清单和净价格和折扣。标价代表制造商对批发商或直接购买者的价格,但不考虑折扣。净价代表计入所有制造商优惠(包括回扣、优惠券和任何其他折扣)后每单位产品的收入。每年计算总体样本和 6 个治疗类别的结果均值,通过使用情况对每种产品进行加权并根据通货膨胀进行调整。结果 从 2007 年到 2018 年,标价上涨了 159%(95% CI,137%-181%),即每年 9.1%,而净价上涨了 60%(95% CI,36%-84%),或每年 4.5%,2015 年至 2018 年净价格稳定。医疗补助的折扣从 40% 增加到 76%,其他付款人的折扣从 23% 增加到 51%。折扣的增加抵消了标价上涨的 62%。班级之间存在很大差异。多发性硬化症治疗 (n = 4) 的清单 (439%) 和净 (157%) 价格涨幅最大。降脂药的标价(n = 11)上涨了 278%,净价上涨了 95%。肿瘤坏死因子抑制剂(n = 3)的标价上涨了 166%,净价上涨了 73%。胰岛素的标价(n = 7)上涨了 262%,净价上涨了 51%。非胰岛素类抗糖尿病药(n = 10)的标价上涨了 165%,净价下降了 1%。抗肿瘤药物(n = 44)的标价涨幅最低(59%),但折扣仅抵消标价涨幅的 41%,导致净价上涨 35%。
更新日期:2020-03-03
中文翻译:
2007-2018年美国品牌药的标价、净价和折扣变化
重要性 大多数检查药品价格的研究都集中在标价上,没有考虑制造商回扣和其他折扣,这些折扣在过去十年中大幅增加。目的 描述上市公司在美国销售的品牌药品的标价、净价和折扣的变化,并确定标价增长被折扣增加抵消的程度。设计、设置和参与者 回顾性描述性研究使用来自投资公司 SSR Health 的 2007-2018 年定价数据,用于 2007 年 1 月之前可用的品牌产品,以及上市公司报告的美国销售额(n = 602 种药物)。净价格是通过编制公司报告的每种产品的销售额和在美国销售的单位数量来估算的。曝光 日历年。主要结果和措施 结果包括医疗补助和其他支付者的清单和净价格和折扣。标价代表制造商对批发商或直接购买者的价格,但不考虑折扣。净价代表计入所有制造商优惠(包括回扣、优惠券和任何其他折扣)后每单位产品的收入。每年计算总体样本和 6 个治疗类别的结果均值,通过使用情况对每种产品进行加权并根据通货膨胀进行调整。结果 从 2007 年到 2018 年,标价上涨了 159%(95% CI,137%-181%),即每年 9.1%,而净价上涨了 60%(95% CI,36%-84%),或每年 4.5%,2015 年至 2018 年净价格稳定。医疗补助的折扣从 40% 增加到 76%,其他付款人的折扣从 23% 增加到 51%。折扣的增加抵消了标价上涨的 62%。班级之间存在很大差异。多发性硬化症治疗 (n = 4) 的清单 (439%) 和净 (157%) 价格涨幅最大。降脂药的标价(n = 11)上涨了 278%,净价上涨了 95%。肿瘤坏死因子抑制剂(n = 3)的标价上涨了 166%,净价上涨了 73%。胰岛素的标价(n = 7)上涨了 262%,净价上涨了 51%。非胰岛素类抗糖尿病药(n = 10)的标价上涨了 165%,净价下降了 1%。抗肿瘤药物(n = 44)的标价涨幅最低(59%),但折扣仅抵消标价涨幅的 41%,导致净价上涨 35%。


 京公网安备 11010802027423号