Our official English website, www.x-mol.net, welcomes your
feedback! (Note: you will need to create a separate account there.)
Profitability of Large Pharmaceutical Companies Compared With Other Large Public Companies
JAMA ( IF 63.1 ) Pub Date : 2020-03-03 , DOI: 10.1001/jama.2020.0442 Fred D Ledley 1, 2 , Sarah Shonka McCoy 3, 4 , Gregory Vaughan 5 , Ekaterina Galkina Cleary 6
JAMA ( IF 63.1 ) Pub Date : 2020-03-03 , DOI: 10.1001/jama.2020.0442 Fred D Ledley 1, 2 , Sarah Shonka McCoy 3, 4 , Gregory Vaughan 5 , Ekaterina Galkina Cleary 6
Affiliation
|
Importance
Understanding the profitability of pharmaceutical companies is essential to formulating evidence-based policies to reduce drug costs while maintaining the industry's ability to innovate and provide essential medicines. Objective
To compare the profitability of large pharmaceutical companies with other large companies. Design, Setting, and Participants
This cross-sectional study compared the annual profits of 35 large pharmaceutical companies with 357 companies in the S&P 500 Index from 2000 to 2018 using information from annual financial reports. A statistically significant differential profit margin favoring pharmaceutical companies was evidence of greater profitability. Exposures
Large pharmaceutical vs nonpharmaceutical companies. Main Outcomes and Measures
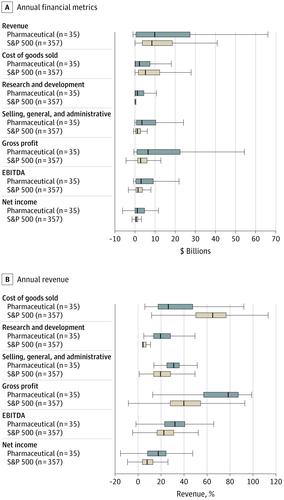
The main outcomes were revenue and 3 measures of annual profit: gross profit (revenue minus the cost of goods sold); earnings before interest, taxes, depreciation, and amortization (EBITDA; pretax profit from core business activities); and net income, also referred to as earnings (difference between all revenues and expenses). Profit measures are described as cumulative for all companies from 2000 to 2018 or annual profit as a fraction of revenue (margin). Results
From 2000 to 2018, 35 large pharmaceutical companies reported cumulative revenue of $11.5 trillion, gross profit of $8.6 trillion, EBITDA of $3.7 trillion, and net income of $1.9 trillion, while 357 S&P 500 companies reported cumulative revenue of $130.5 trillion, gross profit of $42.1 trillion, EBITDA of $22.8 trillion, and net income of $9.4 trillion. In bivariable regression models, the median annual profit margins of pharmaceutical companies were significantly greater than those of S&P 500 companies (gross profit margin: 76.5% vs 37.4%; difference, 39.1% [95% CI, 32.5%-45.7%]; P < .001; EBITDA margin: 29.4% vs 19%; difference, 10.4% [95% CI, 7.1%-13.7%]; P < .001; net income margin: 13.8% vs 7.7%; difference, 6.1% [95% CI, 2.5%-9.7%]; P < .001). The differences were smaller in regression models controlling for company size and year and when considering only companies reporting research and development expense (gross profit margin: difference, 30.5% [95% CI, 20.9%-40.1%]; P < .001; EBITDA margin: difference, 9.2% [95% CI, 5.2%-13.2%]; P < .001; net income margin: difference, 3.6% [95% CI, 0.011%-7.2%]; P = .05). Conclusions and Relevance
From 2000 to 2018, the profitability of large pharmaceutical companies was significantly greater than other large, public companies, but the difference was less pronounced when considering company size, year, or research and development expense. Data on the profitability of large pharmaceutical companies may be relevant to formulating evidence-based policies to make medicines more affordable.
中文翻译:

大型制药公司与其他大型上市公司相比的盈利能力
重要性 了解制药公司的盈利能力对于制定循证政策以降低药品成本同时保持行业创新和提供基本药物的能力至关重要。目的比较大型制药公司与其他大型公司的盈利能力。设计、设置和参与者 这项横断面研究使用年度财务报告中的信息,比较了 2000 年至 2018 年标准普尔 500 指数中 35 家大型制药公司和 357 家公司的年利润。有利于制药公司的统计显着差异利润率证明了更高的盈利能力。暴露大型制药公司与非制药公司。主要结果和衡量指标 主要结果是收入和 3 项年度利润衡量指标:毛利(收入减去销售成本);息税折旧摊销前利润(EBITDA;核心业务活动的税前利润);净收入,也称为收益(所有收入和支出之间的差额)。利润指标被描述为所有公司从 2000 年到 2018 年的累计或年利润作为收入的一部分(利润率)。结果 2000年至2018年,35家大型制药公司累计营收11.5万亿美元,毛利8.6万亿美元,EBITDA 3.7万亿美元,净利润1.9万亿美元,而标普500指数成份股357家公司累计营收130.5万亿美元,毛利1.9万亿美元42.1 万亿美元,EBITDA 22.8 万亿美元,净收入 9.4 万亿美元。在双变量回归模型中,制药公司的年利润率中位数显着高于标准普尔 500 指数公司(毛利率:76.5% vs 37.4%;差异,39.1% [95% CI,32.5%-45.7%];P < .001;EBITDA利润率:29.4% 与 19%;差异,10.4% [95% CI,7.1%-13.7%];P < .001;净收入利润率:13.8% 与 7.7%;差异,6.1% [95% CI,2.5% -9.7%];P < .001)。在控制公司规模和年份以及仅考虑报告研发费用的公司时,回归模型的差异较小(毛利率:差异,30.5% [95% CI,20.9%-40.1%];P < .001;EBITDA利润率:差异,9.2% [95% CI,5.2%-13.2%];P < .001;净收入利润率:差异,3.6% [95% CI,0.011%-7.2%];P = .05)。结论和相关性 从 2000 年到 2018 年,大型制药公司的盈利能力明显高于其他大型上市公司,但在考虑公司规模、年份或研发费用时,差异不那么明显。大型制药公司盈利能力的数据可能与制定循证政策有关,使药品更能负担得起。
更新日期:2020-03-03
中文翻译:
大型制药公司与其他大型上市公司相比的盈利能力
重要性 了解制药公司的盈利能力对于制定循证政策以降低药品成本同时保持行业创新和提供基本药物的能力至关重要。目的比较大型制药公司与其他大型公司的盈利能力。设计、设置和参与者 这项横断面研究使用年度财务报告中的信息,比较了 2000 年至 2018 年标准普尔 500 指数中 35 家大型制药公司和 357 家公司的年利润。有利于制药公司的统计显着差异利润率证明了更高的盈利能力。暴露大型制药公司与非制药公司。主要结果和衡量指标 主要结果是收入和 3 项年度利润衡量指标:毛利(收入减去销售成本);息税折旧摊销前利润(EBITDA;核心业务活动的税前利润);净收入,也称为收益(所有收入和支出之间的差额)。利润指标被描述为所有公司从 2000 年到 2018 年的累计或年利润作为收入的一部分(利润率)。结果 2000年至2018年,35家大型制药公司累计营收11.5万亿美元,毛利8.6万亿美元,EBITDA 3.7万亿美元,净利润1.9万亿美元,而标普500指数成份股357家公司累计营收130.5万亿美元,毛利1.9万亿美元42.1 万亿美元,EBITDA 22.8 万亿美元,净收入 9.4 万亿美元。在双变量回归模型中,制药公司的年利润率中位数显着高于标准普尔 500 指数公司(毛利率:76.5% vs 37.4%;差异,39.1% [95% CI,32.5%-45.7%];P < .001;EBITDA利润率:29.4% 与 19%;差异,10.4% [95% CI,7.1%-13.7%];P < .001;净收入利润率:13.8% 与 7.7%;差异,6.1% [95% CI,2.5% -9.7%];P < .001)。在控制公司规模和年份以及仅考虑报告研发费用的公司时,回归模型的差异较小(毛利率:差异,30.5% [95% CI,20.9%-40.1%];P < .001;EBITDA利润率:差异,9.2% [95% CI,5.2%-13.2%];P < .001;净收入利润率:差异,3.6% [95% CI,0.011%-7.2%];P = .05)。结论和相关性 从 2000 年到 2018 年,大型制药公司的盈利能力明显高于其他大型上市公司,但在考虑公司规模、年份或研发费用时,差异不那么明显。大型制药公司盈利能力的数据可能与制定循证政策有关,使药品更能负担得起。


 京公网安备 11010802027423号