当前位置:
X-MOL 学术
›
J. Geochem. Explor.
›
论文详情
Our official English website, www.x-mol.net, welcomes your
feedback! (Note: you will need to create a separate account there.)
Equivalence assessment and leveling of geochemical datasets to generate integrated geochemical maps: Application to mineral exploration
Journal of Geochemical Exploration ( IF 3.4 ) Pub Date : 2020-05-01 , DOI: 10.1016/j.gexplo.2020.106507 Amir Habibnia , Gholamreza Rahimipour , Hojjatollah Ranjbar
Journal of Geochemical Exploration ( IF 3.4 ) Pub Date : 2020-05-01 , DOI: 10.1016/j.gexplo.2020.106507 Amir Habibnia , Gholamreza Rahimipour , Hojjatollah Ranjbar
|
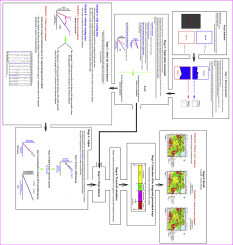
Abstract Merging geochemical datasets of a few adjacent areas (areas with uniform geology) originated from two or more independent geochemical surveys can be highly beneficial to generate the integrated geochemical maps. To merge two or more independent datasets that are somehow linked together and create a new combined dataset, the significance of the shift between these datasets must be determined. Method of sampling, sample preparation, and chemical analysis are among the factors that critically impact on the measurement of the element concentration, thus explaining the inconsistency in the concentration of the same elements in various geochemical surveys. Therefore, studying the presence of a shift between datasets and leveling them as a pre-processing stage are necessary to combine geochemical datasets of adjacent areas and generate the integrated geochemical map. The purpose of assessing the equivalence is to recognize if there is a significant shift between values of the same variables (elements in geochemical surveys) in several datasets. The assessment is done by different methods, such as Quantile-Quantile Dispersion (QQD) diagram and a visual method dependent on expert's judgment to be introduced in this study. In this study, the Fisher test, T-student test, and Quantile-Value Diagram (QVD), a valid method showing the least shift between multiple datasets, were applied for the equivalence assessment between two or more datasets. Fisher and T-student tests were run to compare the variances and means of the same elements in two datasets from adjacent areas. The aim of the study was to generate an integrated geochemical map out of two independent geochemical surveys, in the north of Sarduiyeh and south of Rayen geological sheets with uniform geology (southern part of Urmia–Dokhtar metallogenic belt of Iran), to identify new anomalous areas. The equivalence assessment was performed for twelve elements, including Zn, Pb, Ag, Ni, Bi, Cu, As, Sb, Co, W, MO, and Mn. Based on QQD diagram method, some elements of the two databases such as Pb, Ni, and Bi were considered as equivalent, yet the QVD method showed a significant shift for them. Fisher and T-student tests confirmed the results of QVD. All the chemical elements of this survey exhibited shift in the adjacent maps and therefore required to be adjusted. For so doing, QQD diagram was drawn based on quantile pairs of shifted and reference datasets. A linear regression equation fitted in quantile pairs determined the relationship between the shifted and reference datasets. To adjust, it is important to select the reference dataset, which is the one with the best analysis method. Yet, it is difficult to select the reference dataset when the analysis method of the two geochemical surveys is the same. To timely address the problem, one of the two datasets was selected as the reference and an integrated geochemical map was separately generated for each element. It is deduced that if the dataset with larger quantile values is selected as the reference, more anomalies are shown, and vise verse. This approach, however, is based on the expert's judgment and may lead to unreal and unusual results. In another approach, which is more objective and cost-effective, the dataset, the median of which is close to the average of continental crust or the regional background if available, is used as the reference. This led to just one integrated geochemical map. Median Absolute Deviation (MAD) method was then applied to calculate the threshold of elements in integrated geochemical maps.
中文翻译:

地球化学数据集的等效性评估和水准测量以生成综合地球化学图:在矿产勘探中的应用
摘要 合并来自两个或多个独立地球化学调查的几个相邻区域(具有均匀地质的区域)的地球化学数据集对于生成综合地球化学图非常有益。为了合并两个或多个以某种方式链接在一起的独立数据集并创建一个新的组合数据集,必须确定这些数据集之间转换的重要性。取样方法、样品制备和化学分析是影响元素浓度测量的关键因素,从而解释了各种地球化学调查中相同元素浓度的不一致。所以,研究数据集之间是否存在偏移并将它们整平作为预处理阶段对于结合相邻区域的地球化学数据集并生成综合地球化学图是必要的。评估等效性的目的是识别多个数据集中相同变量(地球化学调查中的元素)的值之间是否存在显着变化。评估是通过不同的方法完成的,例如分位数-分位数色散(QQD)图和本研究中将引入的依赖于专家判断的视觉方法。在本研究中,Fisher 检验、T-student 检验和分位数值图 (QVD)(一种显示多个数据集之间偏移最小的有效方法)被应用于两个或多个数据集之间的等效性评估。运行 Fisher 和 T-student 检验以比较来自相邻区域的两个数据集中相同元素的方差和均值。该研究的目的是从两个独立的地球化学调查中生成一个综合地球化学图,在 Sarduiyeh 以北和 Rayen 地质片以南,具有均匀的地质(伊朗乌尔米亚-Dokhtar 成矿带的南部),以确定新的异常领域。对 12 种元素进行了等效性评估,包括 Zn、Pb、Ag、Ni、Bi、Cu、As、Sb、Co、W、MO 和 Mn。基于 QQD 图方法,两个数据库中的一些元素如 Pb、Ni 和 Bi 被认为是等效的,但 QVD 方法显示它们有显着的转变。Fisher 和 T-student 测试证实了 QVD 的结果。本次调查的所有化学元素在相邻地图中均出现偏移,因此需要进行调整。为此,基于移位和参考数据集的分位数对绘制了 QQD 图。以分位数对拟合的线性回归方程确定了移位数据集和参考数据集之间的关系。要进行调整,重要的是选择参考数据集,这是具有最佳分析方法的数据集。然而,当两次地球化学调查的分析方法相同时,很难选择参考数据集。为了及时解决这个问题,选择了两个数据集之一作为参考,并为每个元素分别生成了综合地球化学图。推导出,如果选择分位数值较大的数据集作为参考,则显示出更多的异常,和虎钳诗。然而,这种方法是基于专家的判断,可能会导致不真实和不寻常的结果。在另一种更客观、更具成本效益的方法中,数据集的中值接近大陆地壳的平均值或区域背景(如果有)作为参考。这导致只有一张综合地球化学图。然后应用中值绝对偏差(MAD)方法计算综合地球化学图中元素的阈值。这导致只有一张综合地球化学图。然后应用中值绝对偏差(MAD)方法计算综合地球化学图中元素的阈值。这导致只有一张综合地球化学图。然后应用中值绝对偏差(MAD)方法计算综合地球化学图中元素的阈值。
更新日期:2020-05-01
中文翻译:
地球化学数据集的等效性评估和水准测量以生成综合地球化学图:在矿产勘探中的应用
摘要 合并来自两个或多个独立地球化学调查的几个相邻区域(具有均匀地质的区域)的地球化学数据集对于生成综合地球化学图非常有益。为了合并两个或多个以某种方式链接在一起的独立数据集并创建一个新的组合数据集,必须确定这些数据集之间转换的重要性。取样方法、样品制备和化学分析是影响元素浓度测量的关键因素,从而解释了各种地球化学调查中相同元素浓度的不一致。所以,研究数据集之间是否存在偏移并将它们整平作为预处理阶段对于结合相邻区域的地球化学数据集并生成综合地球化学图是必要的。评估等效性的目的是识别多个数据集中相同变量(地球化学调查中的元素)的值之间是否存在显着变化。评估是通过不同的方法完成的,例如分位数-分位数色散(QQD)图和本研究中将引入的依赖于专家判断的视觉方法。在本研究中,Fisher 检验、T-student 检验和分位数值图 (QVD)(一种显示多个数据集之间偏移最小的有效方法)被应用于两个或多个数据集之间的等效性评估。运行 Fisher 和 T-student 检验以比较来自相邻区域的两个数据集中相同元素的方差和均值。该研究的目的是从两个独立的地球化学调查中生成一个综合地球化学图,在 Sarduiyeh 以北和 Rayen 地质片以南,具有均匀的地质(伊朗乌尔米亚-Dokhtar 成矿带的南部),以确定新的异常领域。对 12 种元素进行了等效性评估,包括 Zn、Pb、Ag、Ni、Bi、Cu、As、Sb、Co、W、MO 和 Mn。基于 QQD 图方法,两个数据库中的一些元素如 Pb、Ni 和 Bi 被认为是等效的,但 QVD 方法显示它们有显着的转变。Fisher 和 T-student 测试证实了 QVD 的结果。本次调查的所有化学元素在相邻地图中均出现偏移,因此需要进行调整。为此,基于移位和参考数据集的分位数对绘制了 QQD 图。以分位数对拟合的线性回归方程确定了移位数据集和参考数据集之间的关系。要进行调整,重要的是选择参考数据集,这是具有最佳分析方法的数据集。然而,当两次地球化学调查的分析方法相同时,很难选择参考数据集。为了及时解决这个问题,选择了两个数据集之一作为参考,并为每个元素分别生成了综合地球化学图。推导出,如果选择分位数值较大的数据集作为参考,则显示出更多的异常,和虎钳诗。然而,这种方法是基于专家的判断,可能会导致不真实和不寻常的结果。在另一种更客观、更具成本效益的方法中,数据集的中值接近大陆地壳的平均值或区域背景(如果有)作为参考。这导致只有一张综合地球化学图。然后应用中值绝对偏差(MAD)方法计算综合地球化学图中元素的阈值。这导致只有一张综合地球化学图。然后应用中值绝对偏差(MAD)方法计算综合地球化学图中元素的阈值。这导致只有一张综合地球化学图。然后应用中值绝对偏差(MAD)方法计算综合地球化学图中元素的阈值。


 京公网安备 11010802027423号