当前位置:
X-MOL 学术
›
Atmos. Environ.
›
论文详情
Our official English website, www.x-mol.net, welcomes your
feedback! (Note: you will need to create a separate account there.)
VOC characteristics, chemical reactivity and sources in urban Wuhan, central China
Atmospheric Environment ( IF 4.2 ) Pub Date : 2020-03-01 , DOI: 10.1016/j.atmosenv.2020.117340 Lirong Hui , Xingang Liu , Qinwen Tan , Miao Feng , Junling An , Yu Qu , Yuanhang Zhang , Yijun Deng , Ruixiao Zhai , Zheng Wang
Atmospheric Environment ( IF 4.2 ) Pub Date : 2020-03-01 , DOI: 10.1016/j.atmosenv.2020.117340 Lirong Hui , Xingang Liu , Qinwen Tan , Miao Feng , Junling An , Yu Qu , Yuanhang Zhang , Yijun Deng , Ruixiao Zhai , Zheng Wang
|
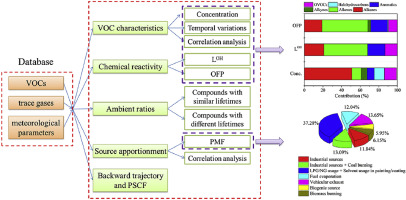
Abstract This paper presents the pollution levels, variation characteristics, chemical reactivity, source apportionment and potential source regions of 102 volatile organic compounds (VOCs) observed from 2017.4.26 to 2017.6.6 in urban Wuhan. The concentration of total VOCs (TVOCs) was 28.92 ± 20.10 ppbv, and the VOC composition was dominated by alkanes (51.14%). Propane, ethane and acetone were the most abundant VOC species. The results for the OH radical loss rate (LOH) and ozone formation potential (OFP) indicated that alkenes were responsible for much of the chemical reactivity and O3 formation, accounting for 47.02% and 49.52%, respectively, and the dominant VOC species were mainly associated with anthropogenic sources, such as vehicle emissions, the use of natural gas (NG) and liquefied petroleum gas (LPG), solvent usage and fuel evaporation. Ambient ratio data showed that VOCs were greatly affected by the pollution sources (such as emissions of NG and LPG, liquid gasoline and fuel evaporation sources, vehicle exhaust emissions, and biogenic sources), photochemical reaction processes and regional transport. Industrial sources (11.84%), industrial sources + coal burning (13.09%), LPG/NG usage + solvent usage in painting/coating (37.28%), fuel evaporation (12.04%), vehicle exhaust (13.65%), biogenic sources (5.95%) and biomass burning (6.15%) were determined by positive matrix factorization (PMF). Furthermore, LPG/NG usage, solvent usage in painting/coating and vehicle exhaust were the most important VOC sources, and their various contributions were affected by a combination of factors, including the emission strength of pollution sources, meteorological conditions and photochemical reaction processes. Backward trajectory analysis showed that VOC pollution was mainly derived from the south via short-distance transport. The potential source contribution function (PSCF) results indicated that the main sources affecting VOC pollution were the potential sources to the south and local sources within the city. This study provides evidence for local governments to formulate VOC control strategies during the transition from spring to summer.
中文翻译:

华中地区武汉市区VOC特征、化学反应性及来源
摘要 本文介绍了2017年4月26日至2017年6月6日武汉市区观测到的102种挥发性有机化合物(VOCs)的污染水平、变化特征、化学反应性、源解析和潜在源区。总VOCs(TVOCs)浓度为28.92±20.10ppbv,VOCs成分以烷烃为主(51.14%)。丙烷、乙烷和丙酮是最丰富的 VOC 种类。OH 自由基损失率 (LOH) 和臭氧形成潜能 (OFP) 的结果表明,烯烃是大部分化学反应性和 O3 形成的原因,分别占 47.02% 和 49.52%,主要的 VOC 物种主要是与人为来源有关,例如车辆排放、天然气 (NG) 和液化石油气 (LPG) 的使用、溶剂使用和燃料蒸发。环境比数据表明,VOCs受污染源(如天然气和液化石油气的排放、液态汽油和燃料蒸发源、汽车尾气排放、生物源)、光化学反应过程和区域运输的影响很大。工业来源(11.84%)、工业来源+燃煤(13.09%)、LPG/NG用量+涂装/涂层溶剂用量(37.28%)、燃料蒸发(12.04%)、汽车尾气(13.65%)、生物源( 5.95%) 和生物质燃烧 (6.15%) 由正矩阵分解 (PMF) 确定。此外,液化石油气/天然气的使用、油漆/涂料中的溶剂使用和汽车尾气是最重要的 VOC 来源,它们的各种贡献受到多种因素的综合影响,包括污染源的排放强度、气象条件和光化学反应过程。后向轨迹分析表明,VOC污染主要来自南方,通过短距离传输。潜在源贡献函数(PSCF)结果表明,影响VOC污染的主要源是城市南部的潜在源和本地源。本研究为地方政府制定春夏过渡期VOC控制策略提供了依据。
更新日期:2020-03-01
中文翻译:
华中地区武汉市区VOC特征、化学反应性及来源
摘要 本文介绍了2017年4月26日至2017年6月6日武汉市区观测到的102种挥发性有机化合物(VOCs)的污染水平、变化特征、化学反应性、源解析和潜在源区。总VOCs(TVOCs)浓度为28.92±20.10ppbv,VOCs成分以烷烃为主(51.14%)。丙烷、乙烷和丙酮是最丰富的 VOC 种类。OH 自由基损失率 (LOH) 和臭氧形成潜能 (OFP) 的结果表明,烯烃是大部分化学反应性和 O3 形成的原因,分别占 47.02% 和 49.52%,主要的 VOC 物种主要是与人为来源有关,例如车辆排放、天然气 (NG) 和液化石油气 (LPG) 的使用、溶剂使用和燃料蒸发。环境比数据表明,VOCs受污染源(如天然气和液化石油气的排放、液态汽油和燃料蒸发源、汽车尾气排放、生物源)、光化学反应过程和区域运输的影响很大。工业来源(11.84%)、工业来源+燃煤(13.09%)、LPG/NG用量+涂装/涂层溶剂用量(37.28%)、燃料蒸发(12.04%)、汽车尾气(13.65%)、生物源( 5.95%) 和生物质燃烧 (6.15%) 由正矩阵分解 (PMF) 确定。此外,液化石油气/天然气的使用、油漆/涂料中的溶剂使用和汽车尾气是最重要的 VOC 来源,它们的各种贡献受到多种因素的综合影响,包括污染源的排放强度、气象条件和光化学反应过程。后向轨迹分析表明,VOC污染主要来自南方,通过短距离传输。潜在源贡献函数(PSCF)结果表明,影响VOC污染的主要源是城市南部的潜在源和本地源。本研究为地方政府制定春夏过渡期VOC控制策略提供了依据。


 京公网安备 11010802027423号