Ecological Indicators ( IF 7.0 ) Pub Date : 2020-01-09 , DOI: 10.1016/j.ecolind.2019.105992 Miaomiao Xie , Jie Chen , Qinya Zhang , Hanting Li , Meichen Fu , Jürgen Breuste
|
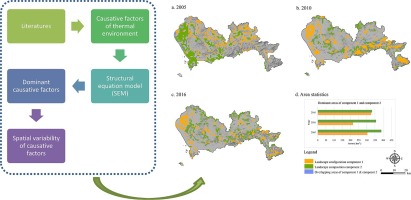
The urban thermal environment is one of the most important effects of urban landscape changes and significantly influences human health. For selecting dominant indicators and presenting the spatial variability of the causative factors of the urban thermal environment, a new modeling framework was constructed by structural equation model (SEM) and factor analysis. A highly urbanized city in China, Shenzhen, was chosen as a case area. We built different SEM models to select an appropriate model to describe the relationship between landscape indicators and surface temperature. The landscape character was described from landscape composition, spatial intensity of human activities, and spatial configuration aspects, including biophysical parameters, population density, energy-consumption, and landscape metrics based on remote-sensing and census data. Results demonstrated a structural correlation between landscape composition, spatial configuration and surface temperature, and showed that landscape composition contributed more than spatial configuration to surface temperature. The correlation coefficients between surface temperature and landscape composition were −0.59, −0.52 and −0.47 in the year of 2005, 2010 and 2016. The contribution of spatial configuration to surface temperature was very low for the entire urban scale. Five dominant landscape indicators (impervious surface area, normalized difference vegetation index, patch density, largest patch index and aggregation index) were selected to describe landscape composition and spatial configuration. Factor analysis showed significant spatial variability in the relationship between landscape indicators and surface temperature. The areas with more significant response to spatial configuration has been increasing from 2005 to 2016 and been gathered in the manufacturing industrial regions and the edge of mountain areas, where temperature can be regulated effectively by spatial configuration optimization. The findings will enhance the understanding of urban thermal environment and provide a methodological framework for studying the spatial variability of the relationship between landscape indicators and functions.


 京公网安备 11010802027423号