Nature ( IF 50.5 ) Pub Date : 2020-01-08 , DOI: 10.1038/s41586-019-1878-8
|
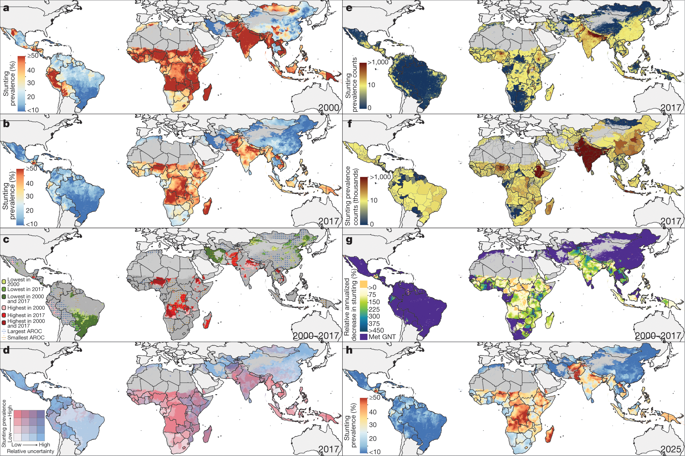
Childhood malnutrition is associated with high morbidity and mortality globally1. Undernourished children are more likely to experience cognitive, physical, and metabolic developmental impairments that can lead to later cardiovascular disease, reduced intellectual ability and school attainment, and reduced economic productivity in adulthood2. Child growth failure (CGF), expressed as stunting, wasting, and underweight in children under five years of age (0–59 months), is a specific subset of undernutrition characterized by insufficient height or weight against age-specific growth reference standards3,4,5. The prevalence of stunting, wasting, or underweight in children under five is the proportion of children with a height-for-age, weight-for-height, or weight-for-age z-score, respectively, that is more than two standard deviations below the World Health Organization’s median growth reference standards for a healthy population6. Subnational estimates of CGF report substantial heterogeneity within countries, but are available primarily at the first administrative level (for example, states or provinces)7; the uneven geographical distribution of CGF has motivated further calls for assessments that can match the local scale of many public health programmes8. Building from our previous work mapping CGF in Africa9, here we provide the first, to our knowledge, mapped high-spatial-resolution estimates of CGF indicators from 2000 to 2017 across 105 low- and middle-income countries (LMICs), where 99% of affected children live1, aggregated to policy-relevant first and second (for example, districts or counties) administrative-level units and national levels. Despite remarkable declines over the study period, many LMICs remain far from the ambitious World Health Organization Global Nutrition Targets to reduce stunting by 40% and wasting to less than 5% by 2025. Large disparities in prevalence and progress exist across and within countries; our maps identify high-prevalence areas even within nations otherwise succeeding in reducing overall CGF prevalence. By highlighting where the highest-need populations reside, these geospatial estimates can support policy-makers in planning interventions that are adapted locally and in efficiently directing resources towards reducing CGF and its health implications.
中文翻译:
绘制低收入和中等收入国家儿童生长障碍的地图
儿童营养不良与全球的高发病率和死亡率相关1 。营养不良的儿童更有可能出现认知、身体和代谢发育障碍,从而导致日后罹患心血管疾病、智力和学业成绩下降以及成年后经济生产力下降2 。儿童生长障碍 (CGF),表现为五岁以下(0-59 个月)儿童发育迟缓、消瘦和体重不足,是营养不良的一个特定子集,其特征是身高或体重低于特定年龄生长参考标准3, 4,5 .五岁以下儿童发育迟缓、消瘦或体重不足的发生率是指年龄别身高、身高别体重或年龄别体重z值分别超过两个标准的儿童的比例偏差低于世界卫生组织健康人群中位增长参考标准6 。国家以下地方的 CGF 估计值报告了各国内部的显着异质性,但主要在第一行政级别(例如州或省) 7 ; CGF 的地理分布不均匀促使人们进一步呼吁进行能够与许多公共卫生项目的当地规模相匹配的评估8 。 基于我们之前绘制非洲 CGF 的工作9 ,据我们所知,我们在此提供了第一个 2000 年至 2017 年 105 个低收入和中等收入国家 (LMIC) CGF 指标的高空间分辨率估计图,其中 99受影响儿童的百分比1 ,汇总到政策相关的第一和第二(例如区或县)行政级单位和国家级。尽管在研究期间营养水平显着下降,但许多中低收入国家仍远未达到世界卫生组织雄心勃勃的全球营养目标,即到 2025 年将发育迟缓率减少 40%,消瘦率减少到 5% 以下。国家之间和国家内部在患病率和进展方面存在巨大差异;我们的地图甚至在成功降低 CGF 总体流行率的国家内也确定了高流行区域。通过强调最需要人口居住的地方,这些地理空间估计可以支持政策制定者规划适合当地的干预措施,并有效地引导资源减少 CGF 及其对健康的影响。


 京公网安备 11010802027423号