当前位置:
X-MOL 学术
›
J. Chem. Educ.
›
论文详情
Our official English website, www.x-mol.net, welcomes your
feedback! (Note: you will need to create a separate account there.)
Incorporating Tactile Learning into Periodic Trend Analysis Using Three-Dimensional Printing
Journal of Chemical Education ( IF 2.5 ) Pub Date : 2018-10-29 00:00:00 , DOI: 10.1021/acs.jchemed.8b00592 Robert J. LeSuer 1
Journal of Chemical Education ( IF 2.5 ) Pub Date : 2018-10-29 00:00:00 , DOI: 10.1021/acs.jchemed.8b00592 Robert J. LeSuer 1
Affiliation
|
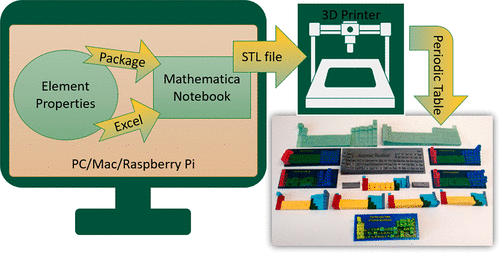
Consumer-grade manufacturing tools such as 3D printers are becoming increasingly prevalent in STEM education environments, especially as tools to develop inexpensive, tactile visualization models. Presented here is a workflow for creating 3D-printed periodic tables displaying a variety of trends from traditionally taught relationships such as atomic radius and ionization energies to less-frequently visualized distributions such as abundance in the human body and the number of stable isotopes. The process is facilitated by the use of Mathematica, which is used for both access to elemental data and generation of the file to be sent to the 3D printer. Since Mathematica is available for free for educational use on the Raspberry Pi, it is possible to use the procedures presented even under resource-limited conditions. An example group work activity is presented in order to demonstrate how the 3D-printed tables can be used in a classroom setting.
中文翻译:

使用三维打印将触觉学习纳入周期性趋势分析
诸如3D打印机之类的消费级制造工具在STEM教育环境中正变得越来越普遍,特别是作为开发廉价的触觉可视化模型的工具。这里介绍的是一个工作流,用于创建3D打印的周期表,以显示各种趋势,从传统的关系式(例如原子半径和电离能)到频率较低的可视化分布(例如人体中的丰度和稳定同位素的数量)。Mathematica的使用促进了该过程,该软件既用于访问基本数据,又用于生成要发送到3D打印机的文件。由于可以在Raspberry Pi上免费使用Mathematica进行教育,因此即使在资源有限的情况下也可以使用提供的步骤。
更新日期:2018-10-29
中文翻译:
使用三维打印将触觉学习纳入周期性趋势分析
诸如3D打印机之类的消费级制造工具在STEM教育环境中正变得越来越普遍,特别是作为开发廉价的触觉可视化模型的工具。这里介绍的是一个工作流,用于创建3D打印的周期表,以显示各种趋势,从传统的关系式(例如原子半径和电离能)到频率较低的可视化分布(例如人体中的丰度和稳定同位素的数量)。Mathematica的使用促进了该过程,该软件既用于访问基本数据,又用于生成要发送到3D打印机的文件。由于可以在Raspberry Pi上免费使用Mathematica进行教育,因此即使在资源有限的情况下也可以使用提供的步骤。


 京公网安备 11010802027423号