Analytical and Bioanalytical Chemistry ( IF 4.3 ) Pub Date : 2018-02-06 , DOI: 10.1007/s00216-018-0905-1 Steven J. Lehotay , Lijun Han , Yelena Sapozhnikova
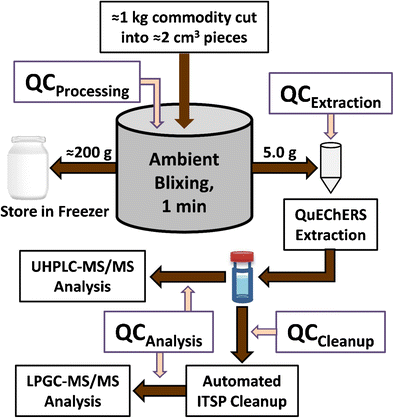
In routine monitoring of foods, reduction of analyzed test portion size generally leads to higher sample throughput, less labor, and lower costs of monitoring, but to meet analytical needs, the test portions still need to accurately represent the original bulk samples. With the intent to determine minimal fit-for-purpose sample size, analyses were conducted for up to 93 incurred and added pesticide residues in 10 common fruits and vegetables processed using different sample comminution equipment. The commodities studied consisted of apple, banana, broccoli, celery, grape, green bean, peach, potato, orange, and squash. A Blixer® was used to chop the bulk samples at room temperature, and test portions of 15, 10, 5, 2, and 1 g were taken for analysis (n = 4 each). Additionally, 40 g subsamples (after freezing) were further comminuted using a cryomill device with liquid nitrogen, and test portions of 5, 2, and 1 g were analyzed (n = 4 each). Both low-pressure gas chromatography-tandem mass spectrometry (LPGC-MS/MS) and ultrahigh-performance liquid chromatography (UHPLC)-MS/MS were used for analysis. An empirical approach was followed to isolate and estimate the measurement uncertainty contribution of each step in the overall method by adding quality control spikes prior to each step. Addition of an internal standard during extraction normalized the sample preparation step to 0% error contribution, and coefficients of variation (CVs) were 6–7% for the analytical steps (LC and GC) and 6–9% for the sample processing techniques. In practice, overall CVs averaged 9–11% among the different analytes, commodities, batches, test portion weights, and analytical and sample processing methods. On average, CVs increased up to 4% and bias 8–12% when using 1–2 g test portions vs. 10–15 g.
Efficient quality control approach to include sample processing
中文翻译:
在对水果和蔬菜中的农药残留进行分析的样品处理技术比较中,使用质量控制方法来评估测量不确定度
在食品的常规监控中,减少分析的测试部分的尺寸通常会导致更高的样品通量,更少的人工以及更低的监控成本,但是为了满足分析需求,测试部分仍然需要准确地代表原始的大块样品。为了确定最小的适用样本量,对使用不同样本粉碎设备处理的10种常见水果和蔬菜中多达93种已产生和添加的农药残留进行了分析。研究的商品包括苹果,香蕉,西兰花,芹菜,葡萄,绿豆,桃,马铃薯,橙和南瓜。使用Blixer®在室温下将大块样品切碎,然后取15 g,10 g,5 g,2 g和1 g的测试份进行分析(n = 4个)。此外,使用装有液态氮的冷冻磨碎机进一步粉碎40 g子样品(冷冻后),并分析5 g,2 g和1 g的测试部分(n = 4个)。低压气相色谱-串联质谱(LPGC-MS / MS)和超高效液相色谱(UHPLC)-MS / MS均用于分析。遵循经验方法,通过在每个步骤之前添加质量控制尖峰来隔离和估计整个方法中每个步骤的测量不确定性贡献。在萃取过程中添加内标将样品制备步骤归一化为0%的误差贡献,分析步骤(LC和GC)的变异系数(CV)为6-7%,而样品处理技术的变异系数为(CVs)6-9%。实际上,在不同的分析物,商品,批次,测试份数重量以及分析和样品处理方法中,总体CV平均为9-11%。平均而言,使用1-2 g的测试份比10–15 g的CV最多增加4%,偏差为8–12%。
高效的质量控制方法,包括样品处理


 京公网安备 11010802027423号