当前位置:
X-MOL 学术
›
ACS Energy Lett.
›
论文详情
Our official English website, www.x-mol.net, welcomes your feedback! (Note: you will need to create a separate account there.)
The Rationale for a Standardized Testing Protocol for Anion Exchange Membrane Water Electrolyzers
ACS Energy Letters ( IF 22.0 ) Pub Date : 2024-02-29 , DOI: 10.1021/acsenergylett.4c00239 Laura J. Titheridge 1 , Aaron T. Marshall 1
ACS Energy Letters ( IF 22.0 ) Pub Date : 2024-02-29 , DOI: 10.1021/acsenergylett.4c00239 Laura J. Titheridge 1 , Aaron T. Marshall 1
Affiliation
|
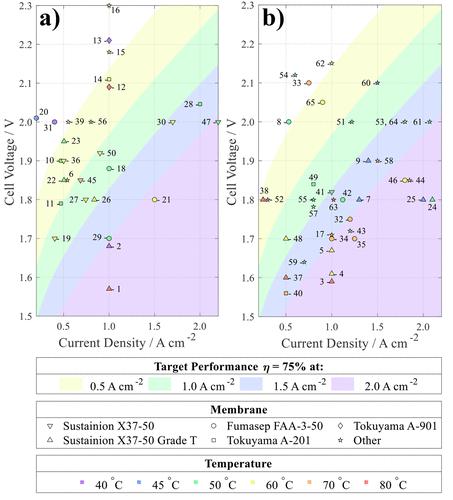
Hydrogen production by water electrolysis is an area of growing interest, especially when coupled to intermittent renewable energy generation. The green hydrogen produced is a versatile energy carrier and is essential for industrial decarbonization, playing a critical role in sectors where direct electrification is challenging. Among the different water electrolysis technologies, anion exchange membrane water electrolysis (AEMWE) is seen as especially attractive as it combines many of the positive features from both proton exchange membrane (PEM) and alkaline electrolysis. Specifically, by using an ion-conductive membrane as the electrode separator, AEMWE can be paired with variable renewable energy sources (similar to PEM). (1) Furthermore, as AEMWE operates in alkaline conditions, a much larger variety of catalyst materials can be used, especially non-PGM metal-based catalysts. (2) Despite these advantages, the most critical obstacle for the commercial viability of AEMWEs is their durability or the lifetime of the device. (3) The degradation of AEMWEs over time leads to increased operating cell voltages, thereby reducing efficiency and increasing hydrogen costs. While measuring the operating voltage before and after a period of operation may indicate the average cell degradation, it does not reveal which mechanism led to the voltage increase or whether the degradation behavior is linear or nonlinear over time. Although there are some excellent reviews detailing AEMWE technology, (4−9) to date, there is limited data highlighting currently achievable stability or cell lifetime. One issue with AEMWE research is the absence of an accepted standard for testing cell performance or degradation, a well-recognized problem in literature. (8−13) When assessing cell performance and stability, factors such as cell materials, catalyst loading, porous transport layers, and membrane electrode assembly (MEA) preparation techniques are all expected to influence the performance and durability of AEMWEs. Decoupling each effect is complex when no standards are available. For instance, comparing newly developed anode materials across different laboratories would be much easier if a standard membrane and cathode were employed. Furthermore, while exploring the optimization of all parameters is essential for developing high performance AEMWEs, their performance and durability also heavily depend on operational conditions (temperature, (14) circulating electrolyte flow rate, (15) and concentration (16)). Additionally, the electrochemical measurement techniques used in evaluating performance and stability. For example, generating a polarization curve via linear sweep voltammetry may misjudge the electrolyzer’s performance if steady-state operation is not reached. (17) Consequentially, variability in not only cell parameters but also operating conditions and measurement techniques complicates comparisons between research groups. In addition to the lack of standardization in cell testing protocols and components, there are few established performance targets for AEMWEs. IRENA has set AEMWE targets for 2050: >2 A cm–2 at <2 V, with a suggested target lifetime of 100,000 h. (18) The first aim was used to establish a thermoneutral voltage efficiency target of >75% at 2 A cm–2, and the second to establish a target voltage decay rate of <2 μV h–1. Despite these targets, the majority of AEMWE studies operate at much lower current densities and rarely provide enough evidence that the target lifetime is achievable. In this paper these issues are addressed and discussed by analyzing recent publications reporting AEMWE cell performance and/or stability. These have been analyzed to identify 1) performance trends and 2) stability trends as a function of operating conditions (current density, temperature, membrane, etc.), to highlight the complexity of comparing studies conducted under different operating or test conditions and to recommend a set of standardized testing protocols. Although reports exist for non-commercial membranes achieving 5.4–14.0 A cm–2 at 2 V, (19−23) they are excluded from this analysis. We chose to focus our comparison on electrolyzers utilizing commercial membranes due to their widespread availability, established performance characteristics, and ease of accessibility, ensuring a comprehensive and reliable assessment of current practices in the field. As a wide range of operating conditions are used when evaluating AEMWE performance, before analyzing trends in stability data, the performance single-cell AEMWEs are compared (Figure 1). Figure 1. Performances of 65 different single-cell AEMWE setups using a) non-PGM-based catalysts or b) PGM-based catalysts. The membrane and operating temperatures of the cell are included. The four shaded regions represent cell performances predicted to achieve the desired efficiency targets, based on a phenomenological model of the Nernst and Tafel relationships (see Supporting Information). The goal of this analysis is to highlight any common factors that might be responsible for high cell performance. Unfortunately, no clear trends relating the membrane type or operating conditions to the cell performance are immediately obvious, likely due to the influence of additional variables on cell performance. For example, the initial conditioning of the membrane is a crucial step for determining cell performance. A significant drop in performance occurs within the first few hours, so it is important that a stable cell condition is achieved prior to testing. Karacan et al. (24) recommended using a time-independent potentiostatic conditioning technique, where the conditioning step runs until the variation in current density decreases to less than 1% per hour. Moreover, some results ascribed to certain membrane types or operating temperature may be misleading if the catalyst material is not considered. For example, those meeting the 75% target at 2.0 A cm–2 mainly use the Fumasep FAA-3-50 or Sustainion X37-50 Grade T membrane. However, 69% of these results also utilize PGM-based electrocatalysts (Figure 1b). Furthermore, while AEMWEs would normally be assumed to perform better at elevated temperatures, (25) the literature reports which exhibit the best performance are found at a wide range of operating conditions (see Table S7). The lack of clear relationships between reported performances and operating conditions highlights the complexity of optimizing AEMWE cells. Several studies suggest a positive correlation between rising temperature and performance. (26−29) However, upon closer examination of a larger dataset, this apparent relationship fails to hold true (Figure 2a), despite the notable impact of temperature on cell performance when studied independently. While this does not necessarily call into question the relationship between temperature and AEMWE performance, these findings emphasize the importance of considering the broader research context and the inherent variations in testing conditions. Furthermore, they underscore the pressing need for standardization to decouple the multifaceted factors contributing to improved AEMWE performance. Figure 2. Performance of 65 different single-cell AEMWE setups at 1 A cm–2 a) at various temperatures and b) with commonly utilized electrolytes. The four shaded regions represent cell performances predicted to achieve the desired efficiency targets, based on a phenomenological model of the Nernst and Tafel relationships (see Supporting Information). Over half of all studies investigating the effect of electrolyte in AEMWEs find that 1 M KOH is most effective in achieving higher efficiency performances. (16,30) The analysis performed here aligns with this conclusion, with the studies utilizing 1.0 M KOH appearing to show better performance at 1 A cm–2 compared with other commonly utilized electrolytes (Figure 2b). Particularly, it is clear that using pure water or K2CO3 solutions in the AEM cells generally leads to poor performance. While it is common practice for most cells to circulate 1.0 M KOH electrolyte (18% of studies reviewed here utilize 1.0 M KOH), the substantial variation in flow rates, choice of materials, and device designs suggests that high-efficiency AEMWE outcomes cannot be solely attributed to this electrolyte, as some studies using 0.1 M KOH performed equally well as studies using 1.0 M KOH. The alkaline electrolyte is a core component of electrolyzer systems, affecting the properties at the electrode interface and the thermodynamic and kinetic properties of electrocatalytic reactions. The presence of metal impurities and inaccurate pH estimations can result in unreliable performance results. Although the inclusion of iron in nickel-based anodes contributes to achieving and sustaining low overpotentials, the presence of iron can lead to deactivation of PGM-based cathode catalysts. (31) To determine if the presence of Fe contributes to the observed inconsistencies, the performances of AEMWE systems with iron supplementing nickel-based anodes and those without are compared (Figure S1). The analysis found that, on average, nickel-based anodes that included iron achieved lower cell voltages at 1 A cm–2 than those that were iron-free (Figure S1a). Furthermore, nickel-based anodes containing iron suffered higher rates of cell degradation when the cathode utilized a PGM-based catalyst when compared to non-PGM cathode catalysts (Figure S1b). Xu et al. (32) found there to be a strong correlation between the catalyst’s electrical conductivity and AEMWE performance, with iron-containing species achieving higher performances in the AEMWE, attributing the improvement in performance to the increased intrinsic catalytic activity of iron-containing species and only moderately decreased electrical conductivity. Noting the significance of the dry catalyst electrical conductivity on full cell performance, dry conductivity measurements could be an effective technique for screening suitable catalysts for more efficient AEMWE systems. Additionally, in instances where the anolyte and catholyte can potentially mix via a shared electrolyte tank, researchers must decide on the optimal iron content in their system. Marquez et al. (33) advocated for the improvement of testing protocols and suggested the best practices for electrolyte preparation, removing Fe impurities, electrolyte standardization, determining composition by ICP-MS analysis, statistical quality control, and electrochemical testing, to validate the quality of alkaline electrolytes used in electrocatalytic systems. Additionally, they provided a general standard protocol for evaluating the electrocatalytic stability of lab-scale alkaline electrolyzers and a guideline for troubleshooting device operation and data acquisition. (34) The complexity deepens when attempting systematic comparisons due to the absence of a universally accepted benchmark AEMWE device; (8) instead, many studies propose their own baseline as a starting point for innovation (Tables S3 and S4, and Figure S4). As a potential solution to this issue, the adoption of benchmark AEMWE cells, as proposed by Faqeeh et al., (35) could become a pivotal component of a standardized testing protocol, facilitating more repeatable and coherent performance evaluations between research groups. In exploring the performance characteristics of AEMWEs, it becomes evident that the “best reported performance” polarization curves often showcase operations at higher temperatures and electrolyte concentrations along with higher current density ranges, in contrast to the conditions prevalent in durability studies. In fact, 64% of studies use lower current density, and 28% operate at lower temperatures for durability testing compared with the conditions used to determined the cell performance as reported in the studies abstract. While this highlights beneficial conditions for efficient hydrogen production, the translation for the devices suitability as a commercial technology is difficult to decipher. Marquez et al. (34) emphasized the importance of shifting the focus from achieving high performances, using impractical condition during testing, to understand the physical phenomena influencing cell behavior under realistic operational conditions. By prioritizing realistic testing conditions, researchers can bridge the intrinsic properties of materials with the electrolzer’s performance under similar environments representative of industrial usage. (36) Furthermore, it would foster a more transparent and standardized evaluation framework within the research community. Standardization has begun to develop for durability studies, with most evaluated at either 0.5 or 1.0 A cm–2. However, the lack of standard testing times means the degradation rate is typically evaluated across the whole operating period, which is not an accurate representation of the electrolyzer’s stability and degradation behavior, as it does not account for the variability in the degradation rate over time. For example, if the cell voltage increases >10% within the first 10 h but remained stable for 10,000 h, the system would look to be unstable if defined by average degradation. Standardizing long-term durability tests is complex, as they require extended periods to complete and can be resource intensive. As a result, some researchers may have limited scope for testing durability and conduct shorter-duration tests, which may not represent real-world operating conditions. The results from durability studies (Figure 3a) highlights devices to operate at lower efficiencies than those achieved in performance testing, no longer meeting their initial targets. Of the 13 studies that initially achieved 75% efficiency at 2 A cm–2 during performance testing (Figure 1), only 2 achieved that same target in stability measurements. In fact, 47% of results from stability tests no longer meet the efficiency target initially met in performance testing (see Figure S3). Additionally, it is worrying to see the majority of stability studies do not achieve an operating lifetime of even 1 week (Figure 3b). While these results can still be useful to indicate operating conditions or materials that incite higher degradation, unfortunately 45% of studies do not complete post-experiment characterizations or provide a hypothesis for what causes the cell’s instability. Figure 3. Stability test results from 54 different single-cell AEMWE setups. a) Current density and initial cell voltage. The four shaded regions represent cell performances predicted to achieve the desired efficiency targets, based on a phenomenological model of the Nernst and Tafel relationships. b) Time period used to determine the average voltage decay rate. The six shaded regions represent the decay rate predicted to achieve the desired performance retention targets, based on a first-order relationship between cell voltage and time. Surprisingly, the results show that as the current density used in chronoamperomtery studies increases, the cell degradation decreases (Figure 4a). This seems counter-intuitive, as higher current density operation typically results in extreme bubble evolution on the electrode surface, (37) which can result in membrane drying, (38) increasing degradation. (39) This trend may change at higher current densities; however, stability testing above 1 A cm–2 is uncommon. Furthermore, no observable trends were found between degradation and temperature (Figures 4b and S2b) or circulating flow rate (Figures 4c and S2a). Finally, it is noteworthy to observe that non-PGM catalysts, on average, demonstrate lower cell degradation compared to AEMWE cells using PGM-based catalysts (Figure 4d). This observation underscores the promising potential of cost-effective non-PGM catalysts for enhancing the longevity of AEMWE devices. Figure 4. Average degradation rate of 54 different single-cell AEMWE setups and their reported a) current density, b) circulating flow rate, and c) cell temperature. The six shaded regions represent the decay rate predicted to achieve the desired performance retention targets, based on a first-order relationship between cell voltage and time. Flow rate is known to impact electrolyzer performance, as higher flow rates effectively help remove product gases, (40) allowing for optimal use of the surface for electrochemical reactions (41) and minimizing the possibility of localized “hot-spots” which are known to damage the membrane. However, when using high electrode flow rates, increased forces acting on the catalyst layer and membrane may facilitate catalyst particle erosion and mechanical degradation or failure of the membrane, respectively. Despite this, the physical, systematic comparison of AEMWE flow rates and durability provides no clear relationship, adding to the complexities of device optimization. Moreover, the flow rate is an important aspect to consider regarding gas crossover. Specifically, it directly impacts the boundary layer thickness adjacent to the membrane surface. Higher flow rates lead to a thinner boundary layer, thereby reducing the concentration gradient of the gases near the membrane interface. Consequently, this lowers the driving force for gas diffusion across the membrane, ultimately reducing the gas crossover. (42) This reduction in gas crossover not only contributes to safer operation and enhanced performance, as underscored by Barros et al., (43) but also helps minimize cell degradation. Hydrogen crossover, a key factor in cell degradation, hampers overall cell efficiency by facilitating the hydrogen oxidation reaction, which generates HO• and HO2• radicals. These radicals not only contribute toward membrane degradation but can also poison electrode materials, leading to a decline in catalytic activity, compounding the detrimental effects on electrolyzer performance. (44) Aiming to foster the development of efficient, safe, and durable electrolysis systems, Park et al. (45) details three methods to measure gas permeability of ion-exchange membranes, providing the recommended standardized methodology for each. Furthermore, considering the limited thermal stability of AEMWEs is well known, (9) the lack of a relationship between temperature and durability suggests the variations between testing setups and procedures may be preventing such trends from being observed. Moreover, both porosity and compression have significant effects on fluid transport and resistance. Despite the critical role of porous transport layers in low-temperature water electrolysis technologies, there is notably less research to optimize these components compared to similar studies on gas diffusion layers in fuel cells. (46) To address this gap, Ouimet et al. (47) suggest implementing a set of standardized testing protocols to facilitate meaningful comparisons of porous transport layers between different institutions. As mentioned above, one notable issue with many long-term AEMWE durability studies is that 45% do not to provide any explanation for why the cell is stable or unstable, with only 33% of long-term durability studies conducting electrochemical impedance spectroscopy (EIS). Excluding EIS is a missed opportunity as it provides valuable insight into cell stability, including changes to the charge-transfer resistance, double-layer capacitance, and other parameters that are indicative of degradation. (27,48) Furthermore, by combining EIS with other techniques such as XPS, (49) XRD, (50) SEM/TEM, and FTIR, (51) researchers can gain a more complex understanding of a cells degradation mechanism. The importance of establishing a universal benchmark is underscored by the round robin testing for proton exchange membrane water electrolyzers by Bender et al. (52) In this study, five laboratories adopted identical materials, test cells, and testing frameworks. While the deviation between different laboratories was 2–3 times higher than the lowest deviation observed at a single lab, the highest deviations observed were only one-tenth of those extracted from similar material sets in the literature. The higher deviation in literature values is a result of the inherent heterogeneity of data compiled from various studies, each characterized by unique experimental conditions, methodologies, and reporting practices. This underscores the importance of establishing standard testing frameworks. Recently, the European Union Joint Research Centre called for the standardization of electrolyzer testing protocols and outlined test procedures and metrics for reporting AEMWE performance and durability, (53) obtaining polarization curves, (54) and recording electrochemical impedance spectra. (55) Amador et al. supplied a comprehensive assembly, operation, and testing protocol for bipolar membrane water electrolyzers, additionally providing the expected results from the setup. By establishing the expected outcome for a benchmark setup, researchers can effectively identify deviations in their electrolyzer’s performance, signaling potential issues or deficiencies. This proactive approach enables researchers to recognize when their device is operating below expectations, prompting them to initiate troubleshooting measures. (56) The results from this review reveal no considerable relationships between operating conditions, materials, or assembly variables and performance and durability when compared against wider literature. Due to the lack of standardized testing procedures, results of electrolyzer testing vary significantly and cannot be directly compared. To enable reliable comparisons of single-cell AEMWE performances, there is a pressing need to establish and universally adopt a testing protocol and benchmark system configuration. See the Supporting Information for the standard testing procedure and recommended testing protocols for each step (Table S1), additional standard testing procedures for specific measurements (e.g., dry catalyst conductivity measurements, porous transport layer porosity measurements, gas permeability measurements) (Table S2), a benchmark study recommendation with guidelines for metric reporting (Table S5), and recommended characterization techniques to determine the degradation mechanism for catalysts, membranes, and ionomers (Table S6). The Supporting Information is available free of charge at https://pubs.acs.org/doi/10.1021/acsenergylett.4c00239. Phenomenological model used for establishing performance targets; Fe content effect on AEMWE performance; stability of 65 different single-cell setups at various flow rates and temperatures; variation between performance and stability testing; recommended testing protocols and benchmark study; recommended post-experiment characterization techniques; and a detailed table of electrolyzer setups from the literature (PDF) Most electronic Supporting Information files are available without a subscription to ACS Web Editions. Such files may be downloaded by article for research use (if there is a public use license linked to the relevant article, that license may permit other uses). Permission may be obtained from ACS for other uses through requests via the RightsLink permission system: http://pubs.acs.org/page/copyright/permissions.html. This work was supported by the New Zealand Ministry of Business, Innovation and Employment via Catalyst Strategic Fund funding (UOCX2118). This article references 56 other publications. This article has not yet been cited by other publications. Figure 1. Performances of 65 different single-cell AEMWE setups using a) non-PGM-based catalysts or b) PGM-based catalysts. The membrane and operating temperatures of the cell are included. The four shaded regions represent cell performances predicted to achieve the desired efficiency targets, based on a phenomenological model of the Nernst and Tafel relationships (see Supporting Information). Figure 2. Performance of 65 different single-cell AEMWE setups at 1 A cm–2 a) at various temperatures and b) with commonly utilized electrolytes. The four shaded regions represent cell performances predicted to achieve the desired efficiency targets, based on a phenomenological model of the Nernst and Tafel relationships (see Supporting Information). Figure 3. Stability test results from 54 different single-cell AEMWE setups. a) Current density and initial cell voltage. The four shaded regions represent cell performances predicted to achieve the desired efficiency targets, based on a phenomenological model of the Nernst and Tafel relationships. b) Time period used to determine the average voltage decay rate. The six shaded regions represent the decay rate predicted to achieve the desired performance retention targets, based on a first-order relationship between cell voltage and time. Figure 4. Average degradation rate of 54 different single-cell AEMWE setups and their reported a) current density, b) circulating flow rate, and c) cell temperature. The six shaded regions represent the decay rate predicted to achieve the desired performance retention targets, based on a first-order relationship between cell voltage and time. This article references 56 other publications. The Supporting Information is available free of charge at https://pubs.acs.org/doi/10.1021/acsenergylett.4c00239. Phenomenological model used for establishing performance targets; Fe content effect on AEMWE performance; stability of 65 different single-cell setups at various flow rates and temperatures; variation between performance and stability testing; recommended testing protocols and benchmark study; recommended post-experiment characterization techniques; and a detailed table of electrolyzer setups from the literature (PDF) Most electronic Supporting Information files are available without a subscription to ACS Web Editions. Such files may be downloaded by article for research use (if there is a public use license linked to the relevant article, that license may permit other uses). Permission may be obtained from ACS for other uses through requests via the RightsLink permission system:
http://pubs.acs.org/page/copyright/permissions.html.
更新日期:2024-02-29


 京公网安备 11010802027423号