当前位置:
X-MOL 学术
›
Environ. Sci.: Processes Impacts
›
论文详情
Our official English website, www.x-mol.net, welcomes your
feedback! (Note: you will need to create a separate account there.)
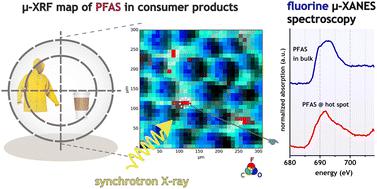
Taking a look at the surface: μ-XRF mapping and fluorine K-edge μ-XANES spectroscopy of organofluorinated compounds in environmental samples and consumer products
Environmental Science: Processes & Impacts ( IF 4.3 ) Pub Date : 2023-05-26 , DOI: 10.1039/d3em00107e Philipp Roesch 1 , Christian Vogel 1 , Philipp Wittwer 1 , Thomas Huthwelker 2 , Camelia N Borca 2 , Thomas Sommerfeld 3 , Stephanie Kluge 3 , Christian Piechotta 3 , Ute Kalbe 1 , Franz-Georg Simon 1
Environmental Science: Processes & Impacts ( IF 4.3 ) Pub Date : 2023-05-26 , DOI: 10.1039/d3em00107e Philipp Roesch 1 , Christian Vogel 1 , Philipp Wittwer 1 , Thomas Huthwelker 2 , Camelia N Borca 2 , Thomas Sommerfeld 3 , Stephanie Kluge 3 , Christian Piechotta 3 , Ute Kalbe 1 , Franz-Georg Simon 1
Affiliation
|
For the first time, μ-X-ray fluorescence (μ-XRF) mapping combined with fluorine K-edge μ-X-ray absorption near-edge structure (μ-XANES) spectroscopy was applied to depict per- and polyfluoroalkyl substance (PFAS) contamination and inorganic fluoride in sample concentrations down to 100 μg kg−1 fluoride. To demonstrate the matrix tolerance of the method, several PFAS contaminated soil and sludge samples as well as selected consumer product samples (textiles, food contact paper and permanent baking sheets) were investigated. μ-XRF mapping allows for a unique element-specific visualization at the sample surface and enables localization of fluorine containing compounds to a depth of 1 μm. Manually selected fluorine rich spots were subsequently analyzed via fluorine K-edge μ-XANES spectroscopy. To support spectral interpretation with respect to inorganic and organic chemical distribution and compound class determination, linear combination (LC) fitting was applied to all recorded μ-XANES spectra. Complementarily, solvent extracts of all samples were target-analyzed via LC-MS/MS spectrometry. The detected PFAS sum values range from 20 to 1136 μg kg−1 dry weight (dw). All environmentally exposed samples revealed a higher concentration of PFAS with a chain length > C8 (e.g. 580 μg kg−1 dw PFOS for Soil1), whereas the consumer product samples showed a more uniform distribution with regard to chain lengths from C4 to C8. Independent of quantified PFAS amounts via target analysis, μ-XRF mapping combined with μ-XANES spectroscopy was successfully applied to detect both point-specific concentration maxima and evenly distributed surface coatings of fluorinated organic contaminants in the corresponding samples.
中文翻译:

观察表面:环境样品和消费品中有机氟化化合物的 μ-XRF 测绘和氟 K 边 μ-XANES 光谱
首次将μ-X射线荧光(μ-XRF)图谱与氟K边μ-X射线吸收近边结构(μ-XANES)光谱相结合来描绘全氟烷基物质和多氟烷基物质(PFAS) ) 污染和样品中无机氟化物浓度低至 100 μg kg -1氟化物。为了证明该方法的基质耐受性,对一些 PFAS 污染的土壤和污泥样品以及选定的消费品样品(纺织品、食品接触纸和永久性烤盘)进行了研究。μ-XRF 绘图可在样品表面实现独特的特定元素可视化,并能够将含氟化合物定位到 1 μm 的深度。随后通过氟 K 边 μ-XANES 光谱分析手动选择的富氟点。为了支持无机和有机化学分布和化合物类别确定的光谱解释,对所有记录的 μ-XANES 光谱应用了线性组合 (LC) 拟合。作为补充,所有样品的溶剂提取物均通过LC-MS/MS 光谱法进行目标分析。检测到的 PFAS 总和值范围为 20 至 1136 μg kg -1干重 (dw)。所有暴露于环境的样品均显示出链长 > C 8的 PFAS 浓度较高(例如,土壤 1 含有580 μg kg -1 dw PFOS),而消费品样品的链长从 C 4到 C的分布更加均匀8 . 与通过目标分析量化的 PFAS 量无关,μ-XRF 绘图与 μ-XANES 光谱法相结合,成功应用于检测相应样品中氟化有机污染物的特定点浓度最大值和均匀分布的表面涂层。
更新日期:2023-05-26
中文翻译:
观察表面:环境样品和消费品中有机氟化化合物的 μ-XRF 测绘和氟 K 边 μ-XANES 光谱
首次将μ-X射线荧光(μ-XRF)图谱与氟K边μ-X射线吸收近边结构(μ-XANES)光谱相结合来描绘全氟烷基物质和多氟烷基物质(PFAS) ) 污染和样品中无机氟化物浓度低至 100 μg kg -1氟化物。为了证明该方法的基质耐受性,对一些 PFAS 污染的土壤和污泥样品以及选定的消费品样品(纺织品、食品接触纸和永久性烤盘)进行了研究。μ-XRF 绘图可在样品表面实现独特的特定元素可视化,并能够将含氟化合物定位到 1 μm 的深度。随后通过氟 K 边 μ-XANES 光谱分析手动选择的富氟点。为了支持无机和有机化学分布和化合物类别确定的光谱解释,对所有记录的 μ-XANES 光谱应用了线性组合 (LC) 拟合。作为补充,所有样品的溶剂提取物均通过LC-MS/MS 光谱法进行目标分析。检测到的 PFAS 总和值范围为 20 至 1136 μg kg -1干重 (dw)。所有暴露于环境的样品均显示出链长 > C 8的 PFAS 浓度较高(例如,土壤 1 含有580 μg kg -1 dw PFOS),而消费品样品的链长从 C 4到 C的分布更加均匀8 . 与通过目标分析量化的 PFAS 量无关,μ-XRF 绘图与 μ-XANES 光谱法相结合,成功应用于检测相应样品中氟化有机污染物的特定点浓度最大值和均匀分布的表面涂层。


 京公网安备 11010802027423号