当前位置:
X-MOL 学术
›
Anal. Chim. Acta
›
论文详情
Our official English website, www.x-mol.net, welcomes your
feedback! (Note: you will need to create a separate account there.)
Nocturnal hypoglycemic alarm based on near-infrared spectroscopy: In vitro simulation studies
Analytica Chimica Acta ( IF 5.7 ) Pub Date : 2017-09-01 , DOI: 10.1016/j.aca.2017.08.035 Sanjeewa R. Karunathilaka , Gary W. Small
Analytica Chimica Acta ( IF 5.7 ) Pub Date : 2017-09-01 , DOI: 10.1016/j.aca.2017.08.035 Sanjeewa R. Karunathilaka , Gary W. Small
|
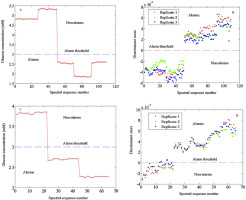
An alarm algorithm for detecting episodes of nocturnal hypoglycemia is demonstrated in simulation studies that incorporate the use of a tissue phantom. Based on transmission spectra collected in the near-infrared combination region of 4000-5000 cm-1, pattern recognition methods are used to classify spectra into alarm and non-alarm data classes on the basis of whether or not they signify a glucose excursion below a user-defined hypoglycemic alarm threshold. A reference spectrum and corresponding glucose concentration are acquired at the start of the monitoring period, and absorbance values of subsequent spectra are computed relative to this reference. The resulting differential spectra reflect differential glucose concentrations that correspond to the differences in concentration between each spectrum and the reference. Given the alarm threshold, a database of calibration differential spectra are partitioned into those above and below the threshold. Piecewise linear discriminant analysis is then used to compute a classification model that can be applied to differential spectra collected during the monitoring period in order to identify spectra that signal glucose concentrations in the hypoglycemic range. This alarm algorithm is demonstrated in two multiple-day dynamic studies that incorporate a tissue phantom composed of films of keratin and collagen that approximate the thicknesses of the corresponding proteins found in human tissue.
中文翻译:

基于近红外光谱的夜间低血糖报警:体外模拟研究
在结合使用组织模型的模拟研究中,展示了一种用于检测夜间低血糖发作的警报算法。基于在 4000-5000 cm-1 的近红外组合区域收集的透射光谱,模式识别方法用于根据光谱是否表示低于用户定义的低血糖报警阈值。在监测期开始时获取参考光谱和相应的葡萄糖浓度,并相对于该参考计算后续光谱的吸光度值。得到的差分光谱反映了不同的葡萄糖浓度,对应于每个光谱和参考之间的浓度差异。给定报警阈值,校准差分光谱的数据库被划分为高于和低于阈值的那些。然后使用分段线性判别分析来计算分类模型,该模型可应用于监测期间收集的差分光谱,以识别在低血糖范围内发出葡萄糖浓度信号的光谱。这种警报算法在两项为期多天的动态研究中得到了证明,这些研究结合了一个由角蛋白和胶原蛋白薄膜组成的组织模型,其厚度近似于人体组织中发现的相应蛋白质的厚度。然后使用分段线性判别分析来计算分类模型,该模型可应用于监测期间收集的差分光谱,以识别在低血糖范围内发出葡萄糖浓度信号的光谱。这种警报算法在两项为期多天的动态研究中得到了证明,这些研究结合了一个由角蛋白和胶原蛋白薄膜组成的组织模型,其厚度近似于人体组织中发现的相应蛋白质的厚度。然后使用分段线性判别分析来计算分类模型,该模型可应用于监测期间收集的差分光谱,以识别在低血糖范围内发出葡萄糖浓度信号的光谱。这种警报算法在两项为期多天的动态研究中得到了证明,这些研究结合了一个由角蛋白和胶原蛋白薄膜组成的组织模型,其厚度近似于人体组织中发现的相应蛋白质的厚度。
更新日期:2017-09-01
中文翻译:
基于近红外光谱的夜间低血糖报警:体外模拟研究
在结合使用组织模型的模拟研究中,展示了一种用于检测夜间低血糖发作的警报算法。基于在 4000-5000 cm-1 的近红外组合区域收集的透射光谱,模式识别方法用于根据光谱是否表示低于用户定义的低血糖报警阈值。在监测期开始时获取参考光谱和相应的葡萄糖浓度,并相对于该参考计算后续光谱的吸光度值。得到的差分光谱反映了不同的葡萄糖浓度,对应于每个光谱和参考之间的浓度差异。给定报警阈值,校准差分光谱的数据库被划分为高于和低于阈值的那些。然后使用分段线性判别分析来计算分类模型,该模型可应用于监测期间收集的差分光谱,以识别在低血糖范围内发出葡萄糖浓度信号的光谱。这种警报算法在两项为期多天的动态研究中得到了证明,这些研究结合了一个由角蛋白和胶原蛋白薄膜组成的组织模型,其厚度近似于人体组织中发现的相应蛋白质的厚度。然后使用分段线性判别分析来计算分类模型,该模型可应用于监测期间收集的差分光谱,以识别在低血糖范围内发出葡萄糖浓度信号的光谱。这种警报算法在两项为期多天的动态研究中得到了证明,这些研究结合了一个由角蛋白和胶原蛋白薄膜组成的组织模型,其厚度近似于人体组织中发现的相应蛋白质的厚度。然后使用分段线性判别分析来计算分类模型,该模型可应用于监测期间收集的差分光谱,以识别在低血糖范围内发出葡萄糖浓度信号的光谱。这种警报算法在两项为期多天的动态研究中得到了证明,这些研究结合了一个由角蛋白和胶原蛋白薄膜组成的组织模型,其厚度近似于人体组织中发现的相应蛋白质的厚度。


 京公网安备 11010802027423号