

Abstract
The atmospheric pressure multi-plasma jet produces an array of individual plasma jets which originate from the branching of a single ionization wave (IW). The use of arrays of such plasma jets could enable treatment of larger surface areas than is possible with a single plasma jet. In this paper, we discuss results from a combined experimental and two-dimensional modeling investigation of the behavior of IWs in an atmospheric pressure plasma multi-jet device. In this multi-jet, a rare gas is flowed through a tube having a line of holes, producing gas jets into the ambient from each of the holes. A primary ionization wave (PIW) propagates through the tube which launches a series of secondary ionization waves (SIWs) propagating out each hole through the plumes of the individual gas jets. The propagation of the SIWs is more intense using a positive polarity voltage pulse due to the higher electric field at the ionization front. The diameter of the holes determines the delay of the SIW after passage of the PIW past the hole, with smaller holes resulting in larger delays. The larger delay results from a smaller view angle for photoionization outside the tube from photons originating in the PIW. Higher helium flow rates result in a greater tendency for SIW propagation because the air concentrations in the individual gas jets outside the tube are lower and so the electron temperature is higher. The interaction between SIWs is primarily electrostatic, and is a sensitive function of geometric parameters including proximity of ground planes and the spacing between the holes through which these SIWs emerge.
Export citation and abstract BibTeX RIS
1. Introduction
Atmospheric pressure plasma jets (APPJs) are low temperature plasma sources which generate fluxes of reactive oxygen and nitrogen species for treatment of surfaces. These reactive species are of interest for medical applications such as wound healing and cancer treatment, and industrial applications such as the functionalization of polymers [1–5]. APPJs have additional flexibility compared to dielectric barrier discharges (DBDs), another common plasma source for biomedical applications operating in air, due to the ability to tailor the reactive species produced in APPJs by controlling the gas composition [6, 7]. However, APPJs typically treat only a small area at a time (on the order of mm2) compared to DBDs that can treat many cm2 (or larger) surfaces. Rapidly treating large surfaces with APPJs can be accomplished using arrays of APPJs, however this mode of operation can be complicated by interactions between individual plasma jets as observed in experimental studies [4, 8–12]. The plasma in repetitively pulsed APPJs is produced by the propagation of a guided ionization wave (IW) which occurs with each voltage pulse [13, 14]. These IWs contain space charge which disturbs the electrical potential of nearby IWs if spaced too closely.
Since APPJs are accompanied by a gas flow, the gas composition outside of the APPJ is influenced by nearby APPJs. Fang et al reported on the effect of gas flow rate on the modes of a honeycomb array of 7 APPJs operating in Ar flowing into air [15]. For low flow rate, only the center APPJ generated a plasma which extended to the surface being treated. When the flow rate was increased, the IW from each individual APPJ reached the surface. Stancampiano et al observed this same mode transition in a honeycomb cluster of plasma jets and measured an increase in negative ion fluxes from the conjoined single IW using molecular beam mass spectrometry [9]. Zhang et al observed a less intense IW propagating through the center jet of an array of three jets, a non-uniformity (i.e. interactions between jets) that was greater with positive polarity than negative polarity [8]. This non-uniformity could be mitigated by a 0.1% O2 admixture which provided an increase in ionization due to Penning processes.
Kim et al observed electrostatic interactions in a linear array of APPJs, where jets on the end of the array diverged from other jets while producing increased optical emission [12]. Babaeva and Kushner computationally investigated the effects of electrostatic, hydrodynamic, and some photolytic coupling of arrays of up to 3 APPJs [16]. When jets were placed close together, their electrostatic interaction became particularly significant, resulting in the propagation through the central jet to dominate.
There has also been progress in generating arrays of APPJs, including jets operating in a glow discharge mode [17]. In this case, Cao et al showed that with proper electrical ballasting of each jet, the array can treat the surface of three-dimensional objects with better uniformity than could be achieved by scanning a single jet along the surface. Lee et al used a 3 × 3 array of microplasma jets to deactivate bacteria and treat wounds. In this particular device, interaction between the individual jets was not observed [18]. Although some arrays of APPJs have been reasonably successful at uniformity [17–19], a more systemic understanding of interactions between the APPJs would aid in designing such sources.
Other designs have also been investigated to increase the area of plasma treated surfaces. Nayak et al studied a microhollow DBD array in dry air as a means to increase the area of plasma treated surfaces [20]. O'Connor et al used a larger tube downstream of several APPJs which enabled the individual IWs to merge to have a larger cross sectional area and a more diffuse plasma [21]. Li et al investigated a device in which an IW expands to fill a larger tube (15 mm diameter) which is capped at the end [11]. Individual IWs propagated out from holes in the bottom of the downstream chamber.
Another potential design for generating an array of IWs is the multi-jet APPJ in which a single primary ionization wave (PIW) launches several secondary ionization waves (SIWs). This device, introduced by Robert et al [22], consists of a dielectric tube with a series of holes along one side. A PIW is launched from one side of the tube from a pair of coaxial electrodes in a DBD configuration. The primary IW propagates through the dielectric tube and, when passing over the holes, launches SIWs which propagate through the holes. An advantage of this the multi-APPJ is its ability to simultaneously treat large areas of surface by increasing the number of SIWs (i.e. more holes in a longer tube) all of which are produced by the same primary IW generated by a single voltage source [22]. The single multi-hole capillary device obviates the need for a bench of individual plasma reactors and power supplies.
The sensitivity of IW dynamics in a multi-jet device to geometric and operational parameters was investigated through experiments and modeling. We found that the interaction between adjacent SIWs during their propagation is primarily electrostatic, although perturbations in the electrical potential as the earlier launched secondary IWs contact the grounded target also impact propagation of subsequent secondary IWs. Propagation of positive polarity IWs through holes on the order of hundreds of μm is highly dependent on the aspect ratio of the hole due to the view angle for photoionization through the hole of photons originating from the primary IW in the tube. Larger helium flow rates produced plumes emanating from the holes which have lower mole fractions of air, resulting in a greater tendency for IW propagation. Closer ground planes producing more intense vacuum electric fields outside the tube result in the formation of a more conductive channel when the IWs contact the target, which can disturb propagation of later secondary IWs, but reduces the effect of electrostatic interaction between adjacent secondary IWs.
The experimental setup is described in section 2, and the two-dimensional computational model is described in section 3. The results of both experimental and modeling are discussed in section 4. The base case of a positive polarity, multi-jet with five SIWs is discussed in detail. Then a simplified geometry containing only one SIW is discussed to facilitate analysis of electric field and IW behavior. The other parameters investigated include the voltage polarity, gas flow rate, hole diameter, the distance between the holes, and the distance to a grounded surface.
2. Description of the experiment
A schematic of the experimental setup is in figure 1(a). The multi-jet device used in this investigation is similar to that reported in [22]. The multi-jet consists of a dielectric tube with an inner diameter of 4 mm and an outer diameter of 6 mm having two segments which have a total length of 19 cm. The first segment is a straight quartz tube 12 cm long and houses the high voltage and grounded electrodes, and through which gas in introduced. This length of tube is required to ensure a laminar gas flow is established before the first hole. The second segment is the multi-jet tube made of Delrin® having the same inner-and outer diameters as the quartz assembly. The Delrin® tube has a row of five holes along one side and is capped at the end with 20 mm thick Delrin®. For the base case the holes are 800 μm in diameter with a 5 mm gap between the holes. A grounded target is placed below the row of holes, 1.5 cm away except where otherwise indicated. He (99.999% purity) is flowed through the device at 1 slm, exiting out the five holes and mixing with the surrounding ambient air.

Figure 1. The experimental multi-jet device. (a) Schematic of the multi-jet device with the plasma indicated as the pink shading. (b) The voltage pulse used in the experiment.
Download figure:
Standard image High-resolution imageThe electrodes consist of an annular powered metal tube inside the quartz tube, and a ground electrode ring wrapped around the outside of the tube. This configuration was selected due to its ability to generate IWs which propagate over large distances. The annular powered electrode was 2 cm long, with an outer diameter of 4 mm, and an inner diameter of 2.4 mm. The ground electrode is a 5 mm wide ring electrode which overlaps the powered electrode by 3.75 mm. The applied voltage waveform, shown in figure 1(b), had a maximum of 14 kV, and a rise time of about 2 μs, operated at 1 kHz. A positive polarity pulse was used, unless otherwise indicated, which produces an IW which propagates from the high voltage electrode, along the tube, and out each of the holes.
The experimental diagnostics used to assess this system include intensified charge-coupled device (ICCD) imaging, probe measurements of electric field, and Schlieren imaging of the gas flow field. An ICCD Pimax3 gated camera was used to image the plasma propagation. An EOS Kapteos probe leveraging the Pockels effect measured the components of the electric field in the vicinity of the plasma [23]. This fiber-like probe contains an isotropic crystal which is 5 mm in diameter and 1 mm long, and is probed with a 0.5 mm diameter laser beam. Schlieren imaging (using the setup described in [24].) was used to quantify the mixing of helium with the humid air. These measurements were used to ensure that the flow field computed by the model flow is consistent with that of the experiment which may be disturbed by gas heating or the ion wind that can occur at long timescales and over many pulses.
3. Description of the model
non-PDPSIM, a two-dimensional plasma hydrodynamics model utilizing an unstructured mesh, was used in this investigation. The equations and solution methods used in non-PDPSIM are described in detail by Norberg et al [25] The structure of the model is shown in figure 2. The model contains modules for solving charged species transport using Scharfetter–Gummel fluxes, surface charging on dielectric materials and electric potential by solving Poisson's equation. Stationary solutions of Boltzmann's equations provide the electron energy distribution (EED) and reaction rate coefficients at many values of the reduced electric field, E/N, where E is the electric field and N is the number density of neutral gas particles. These rate coefficients are then placed into a table as a function of mean electron energy or electron temperature, Te. The electron energy equation is solved for the electron temperature, and rate coefficients of electron impact reactions are interpolated from the table based on the local electron temperature, which is often referred to as the local mean energy approximation. Even though Te is used as the lookup variable in the table of rate coefficients, different values of E/N are used to generate the table. This disparity results from E/N being the independent variable in solution of Boltzmann's equation while Te is a derived value. A sufficient number of values of E/N are used to generate the table so that the resulting values of Te and rate coefficients are reasonably spaced and smooth.
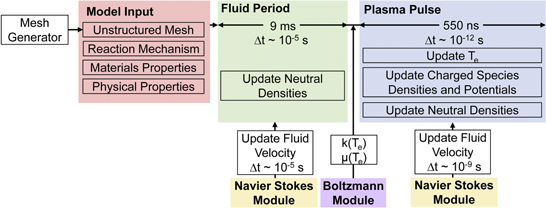
Figure 2. Schematic of non-PDPSIM, the two-dimensional hydrodynamics model used in this work.
Download figure:
Standard image High-resolution imageCompressible Navier–Stokes equations are solved for a single advective fluid velocity, with a mass density that is calculated based on the average molecular weight of species at each node. Individual species then diffuse within the advective flow field. The method of accounting for mixing between the He in the jet and the air in the ambient is discussed in [25]. Photoionization is calculated by a Green's function operator for a selected number of UV/VUV transitions.
Procedurally, a simulation begins by first computing the gas dynamic flow field. This is accomplished by specifying the mole fractions and flow rate at the inlet, and a pressure on the outlet boundary. The Navier–Stokes equations are then integrated until achieving a steady state. Since absorption and photoionization of the UV/VUV radiation is only weakly dependent on the small mole fractions of excited states and molecular products generated by the IWs, the Green's functions used for radiation transport are then pre-computed based on this initial flow field. The voltage is then applied, and the full simulation is started.
3.1. Solving Boltzmann's equation for varying conditions across the mesh
In order to better represent the variation in EEDs that occur in the mixing zone of helium and air, the method of defining zones for solutions to Boltzmann's equation was improved for this study. Zones are regions of the mesh that share similar properties such as total gas density and mole fractions. Boltzmann's equation is solved using a two-term spherical harmonic expansion for the average gas composition in a given zone. This generates a lookup table for each zone that relates many values of the reduced electric field (E/N) to the electron temperature (Te) and the rate coefficient for each reaction. The electron energy equation is solved at each numerical mesh point to produce Te. Using this value of Te, rate and transport coefficients at that mesh point are then interpolated from the table for the appropriate zone. These lookup tables will provide significantly different rate coefficients in a portion of the mesh that is composed of pure helium compared to humid air. Previously the grouping of nodes into zones was defined explicitly in the model geometry. If there were not enough zones to capture gradations in mole fractions, discontinuities might occur in the IW propagation due to discontinuities in rate coefficients for inelastic processes across zone boundaries.
To better address the continuous gradation of mole fraction from, for example, the core of the He plume into ambient air, the spatially based zones for which Boltzmann's equation was solved were replaced with zones based on the mole fraction of air in He (including impurities). After the initial fluid simulation has reached its steady state, computational nodes are binned in zones by the mole fraction of a specified species. With prior knowledge of the dependence of the EED on the specified mole fractions, the binning of zones could be, for example, a linear or log-scale list of mole fractions. In the case of a molecular gas (air) mixing with an atomic gas (He), the EED is highly sensitive to small mole fractions of the molecular gas due to the low threshold energy of electron impact excitation to rotational and vibrational modes. For this type of mixing, the Boltzmann zones are best defined based on a log scale in molecular gas mole fraction. In this investigation, the mole fraction of N2 was used to assign zones for solving Boltzmann's equation and making rate-coefficient lookup tables. This assignment is based on the assumption that the mole fraction of N2 in the humid air mixing with the He does not deviate significantly from its value in the ambient. The computational domain was divided into 50 Boltzmann zones distributed on a log scale in mole fraction. The first Boltzmann zone includes nodes with an N2 mole fraction from 0 to 10−6, and the last zone includes nodes with an N2 mole fraction from 0.754 to 0.795. Boltzmann's equation was solved in each zone for the average gas composition (including He, N2, H2O, and O2). The number of zones was selected to produce a lookup table that has a smooth transition in rate coefficients as a function of N2 mole fraction.
Using this method means that updates to the Boltzmann lookup tables during the simulation are typically not required. In the geometrically defined zones previously used, electron-density weighted mole fractions of gases were used to define the mole fractions in zones and updates were required as the IW propagates and the spatial distribution of electron density changed. This method required updates to the Boltzmann tables as frequently as every 0.1 ns, which becomes a computational burden and motivates having a small number of zones. When using mole-fraction based zones and the changes in gas composition are not significant (i.e. dissociation and ionization fractions are low), updates to the lookup tables are not required as frequently or at all. This reduces the computational cost of the additional zones, thereby enabling a large number of zones.
3.2. Geometry, initial conditions, and reaction mechanism
The base case geometry used in this study uses a two-dimensional Cartesian geometry as shown in figure 3(a). (The depth of the mesh is 1 mm, which is only relevant for specifying gas flow rates.) The computational mesh, shown in figures 3(b), (c), contains 13 286 nodes, 9540 of which are in the plasma region. The powered electrode is inside the dielectric tube with the grounded electrode on the outside. The relative dielectric constant of the tube is ε/ε0 = 4, appropriate for both quartz and Delrin®. Electrical ground planes were placed 15 cm above the tube assembly and 10 cm to the right of the end of the tube. Following parametric studies, these distances were chosen to be far enough from the jet so that moving the ground plane further away did not significantly affect the IW dynamics. Moving the ground plane boundaries closer to the jet would affect the IW dynamics. Although an extensive parameterization was not performed, moving ground planes close to the tube generally increases the intensity and speed of the IW.
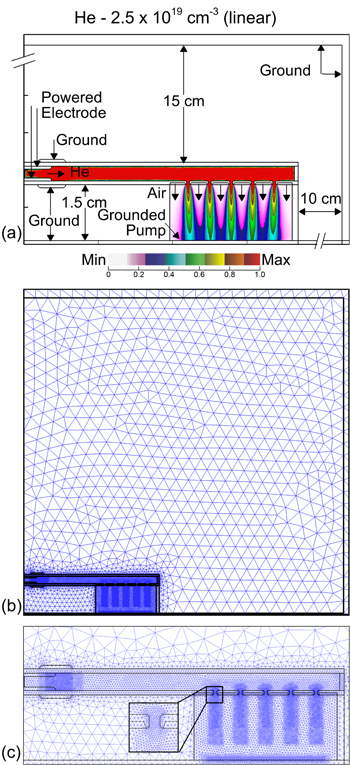
Figure 3. The geometry used to model the multi-jet device. (a) Schematic of the Cartesian geometry. Note the axes are broken to show the distant ground planes. The contour plot shows the density of helium flowing out of the holes and mixes with the humid air. (b) The computational mesh for the entire domain. (c) The refinement regions of the mesh for the regions where the plasma propagates, and more refined regions as the plasma propagates inside of the holes and interacts with electrodes. The vertical lines below the tube on either side of the holes separate the region in which the full plasma simulation was performed and the material having ε/εr = 1 where only Poisson's equation is solved.
Download figure:
Standard image High-resolution imageHe with impurities (H2O/N2/O2 = 1002.9/4.7/2.4 ppm) was flowed at 1 slm through the tube. Since the experimental setup was not operated in a vacuum system or heated to eliminate water vapor impurities, it was assumed that the He contained water impurities of 0.1% in addition to impurities that are expected from the gas bottle based on gas supplier specifications. A pressure boundary condition is applied to the grounded pump faces, thereby enabling the gas to exit the computational domain. This is necessary to exhaust the gas in the 2D simulation, whereas in the experiment the gas exhausts perpendicular to the jets in all directions. Outside the tube, regions above the tube and beyond the holes in the tube were modeled as a dielectric with ε/εr = 1 to represent air, with fore-knowledge that plasma does not occur in these volumes.
In the computational geometry, the distance from the powered electrode to the first hole is 3.625 cm, which is less than in the experiment. Experiments were performed varying the distance between the electrodes and the first hole. No critical differences were observed in the IW propagation, and so this length was reduced in the model to reduce the computational burden.
The actual three-dimensional device has circular holes which produce gas jets that entrain air from all sides that comes from a nearly inexhaustible source—the surrounding ambient. In our two-dimensional simulation the gas jets and IWs are slots (as opposed to circular jets) which can only entrain air between the jets which is not replenished from the ambient. To enable replenishment of the ambient air in the computational geometry, nozzles were included on the surface of the tube between the holes to account for air entrainment which occurs in three-dimensional space. The flow rate of humid air from these nozzles (N2/O2/H2O = 79.5/20/0.5) was adjusted to 3 slm to achieve qualitative agreement with Schlieren imaging of the He jets leaving the holes, shown in figure 4(a). Since disturbances in the flow have been observed after igniting the plasma, the Schlieren imaging was performed while the plasma discharge was on. The simulated Schlieren imaging, calculated by taking the spatial derivative of the mass density of the gas, is shown in figure 4(b) for comparison. The agreement is generally good, with differences attributable to the two-dimensional calculation representing a three-dimensional flow field. The Boltzmann zones generated based on this steady state flow profile are shown in figure 4(c).
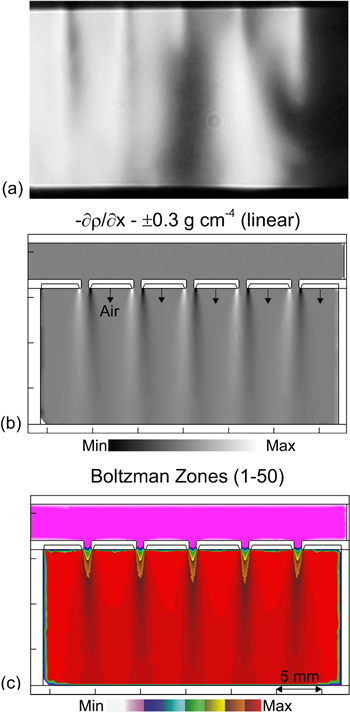
Figure 4. The gas flow and resulting Boltzmann zones. (a) Experimentally measured Schlieren imaging of the mixing of He with the surrounding air in the base case. (b) Simulated Schlieren imaging based with a total of 3 slm of air flowing between the holes. (c) The 50 zones for which Boltzmann's equation is solved for the average gas composition. The zones are determined by the mole fraction of N2 on a log scale.
Download figure:
Standard image High-resolution imageA +28 kV pulse with a 5 ns rise time was applied to the powered electrode. This voltage amplitude is double that used in the experiments, based on the differences in IW propagation in an infinite channel (modeled in two-dimensions here) compared to cylindrically symmetric tubes (which occurs in the experiments) [26]. This discrepancy originates from the increased electric field enhancement that occurs in three-dimensions. The rise time is shorter in the model to account for the fact that the IW in the experiment reaches the first hole at a later time because it has a greater distance to travel compared to the model. By this time, the voltage is already near its maximum value. The discharge is initialized with two small electron clouds near the top and bottom edges of the powered electrode each having a diameter of 80 μm and a peak density of 1012 cm−3. This choice of initial conditions is based on past experiences in modeling similar devices. In general, the time to launch the IW scales with the magnitude of the plasma density in the initial spot, but otherwise the IW dynamics are not significantly affected. The IW wave dynamics are different if the entire volume is initialized with a uniform plasma density. In particular, the IW dynamics in the holes will be different. For example, since the gas flow speed through the holes is high, it is not expected that there would be any plasma density remaining in the holes by the time of the next pulse in a repetitive device.
The reaction mechanism used in this study is a reduced version of that discussed by Norberg et al, to limit the scale of the simulation [27]. The mechanism has 36 species, including 12 charged species. The total number of reactions, including 4 photoionization reactions, is 483. The electronically excited states of He, He(23S), He(21S), He(23P), and He(21P) are treated explicitly, and more energetic excited states are lumped as He(3P) and He(3S). All of the He excimers are lumped into a single state, He2*. Two electronically excited states of N2 are included: N2* includes N2(A3Σ), N2(B3Π), N2(W3Δ), N2(B'3Σ), N2(a'1Σ), N2(a1Π), and N2(w1Δ), and N2** includes N2(C3Π) and N2(E3Σ). The other electronically excited states include O2* [O2(1Δ)] and O* [O(1D)]. The dissociation products of N2, O2, and H2O are included, but the species that typically form many microseconds after the discharge pulse, or only after many pulses are not included in the mechanism. For example, NO2, NO3, and HNOx are not in the reaction mechanism since their densities are negligibly small during the time of the simulation and chemistry in the afterglow is not a focus of this study. The complete reaction mechanism is in table S1 of the supplementary information, which is available online at stacks.iop.org/PSST/28/125009/mmedia.
Photoionization in the reaction mechanism includes ionization of N2, O2 and H2O by emission from He2*. The ionization cross sections are, respectively, 2.5 × 10⁻¹⁷, 1.5 × 10⁻¹⁷, and 2.0 × 10⁻¹⁷ cm2. In order for propagation of the SIW outside of the tube to occur, it was also necessary to include ionization processes in the ambient air, which consisted of N2** emission ionizing O2 with a cross section of 5 × 10⁻¹⁸ cm2. Air diffusing into the He plume is also excited by the SIW passing through the plume, which produces critical seed ionization that helps to sustain the SIW. The photoelectron emission coefficient of the tube was 1% for all photon species. The maximum photon path was 3 cm. That is, radiation transport was followed for a maximum of 3 cm from the site of photon emission.
4. IWs in multi-jets
4.1. Base case
The initialization of the IW propagation in the base case is shown by the electron impact ionization source term (Se) in figure 5(a) and the electron density (ne) in figure 5(b). This IW propagating from left to right through the tube will be referred to as the PIW. The electron impact ionization source term (Se) indicates the IW. The discharge begins near the powered electrode, as the initial seed electrons accelerate toward the positive polarity electrode. An intense surface IW (Se ∼ 1024 cm−3 s−1) develops along the inner surface of the tube adjacent to the ground electrode, producing an electron density as high as 1.6 × 1015 cm−3 in this region. Here the tube serves as a capacitor which rapidly charges due to the high conductivity of the adjacent plasma. Upon charging this surface, the IW begins to propagate along the walls of the tube, transitioning from a surface IW to a volume filling IW at the center of the tube. When the IW propagates beyond the edge of the grounded electrode, the effective capacitance of the wall decreases, leading to more rapid charging of the wall. The fully charged wall capacitance is less able to support a surface IW. With the small mole fraction of impurities, the primary ionization mechanism in the IW is electron impact ionization of He, contributing more than 97% of the generation of electrons. After the initial IW passes, the electric field behind the PIW decreases and Se becomes negative, meaning attachment and electron–ion recombination exceed electron impact ionization. The electron density continues to increase during this time, however, as the generation of electrons (∼1019 cm−3 s−1) by Penning ionization (He* + H2O → He + H2O+ + e) is greater than the losses of electrons. The electron density in the bulk of the PIW is much less than that in the vicinity of the powered electrode, reaching approximately 5 × 1012 cm−3.
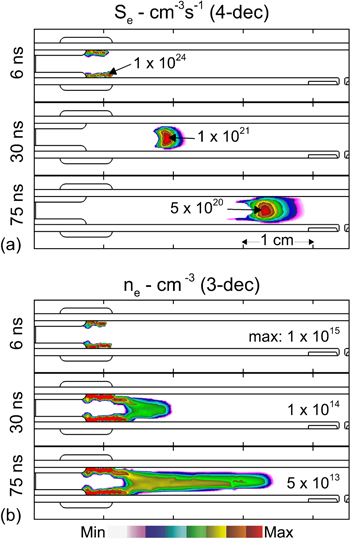
Figure 5. The initial breakdown at the powered electrode and development of an ionization wave inside the tube. (a) Electron impact ionization source term (Se) plotted on a four-decade log scale, with the maximum value in each frame indicated on the figure. (b) Electron density (ne) plotted on a three-decade log scale, with the maximum value indicated on each frame. Note the asymmetry due to the closer proximity of the lower ground plane.
Download figure:
Standard image High-resolution imageThe dominant ion in the tube is He+ for about 10 ns after the PIW passes, after which H2O+ becomes the dominant ion due to charge exchange with He+ and Penning ionization by excited states. Approximately 30 ns after the PIW has passed, the most abundant ion in the tube transitions to H3O+ due to the reaction H2O+ + H2O → H3O+ + OH.
The PIW continues to propagate into the region of the tube containing the holes, as shown in the experimental imaging in figure 6 and the modeling results in figures 7 and 8. (Animations of the ICCD imaging from the experiment, and animations of the electron impact ionization rate, electron density, and potential in the model are available in the supplementary information.) In the ICCD imaging, when the PIW reaches the first hole, a SIW propagates through the hole and downward towards the grounded target. After the SIW contacts the grounded surface, light emission from just above and below the hole in the conductive channel significantly increases. Based on the results in figure 6 at 370 ns and 410 ns, there appears to be a short delay between the time the PIW reaches a hole, and the SIW appears below the hole. The SIW speed through the hole is slower than that of the main PIW due to increased charged particle losses owing to the larger surface-to-volume ratio of the holes compared to the tube and the beginning of encroachment of the ambient air. The SIWs continue to propagate out each subsequent hole and contact the grounded surface, but the intensity of the light emission decreases with each subsequent SIW.
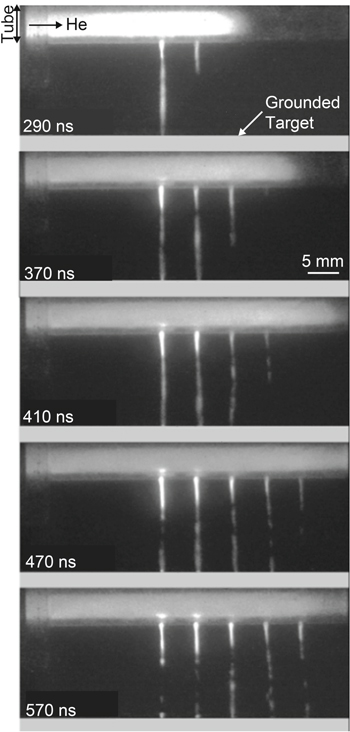
Figure 6. ICCD imaging of IW propagation in the base case. The camera gate was 10 ns, and the images are accumulated over 100 pulses. The times indicated in the figure are measured from the moment the PIW is visible in the camera frame, which is 2.3 μs after the start of the voltage pulse.
Download figure:
Standard image High-resolution image
Figure 7. Ionization wave propagation out of the holes in the base case. The electron impact ionization source term (Se) is plotted on a four-decade log scale. Electric potential contours are labeled with potential in kV. The propagation of secondary ionization waves disturbs the potential profile of neighboring holes.
Download figure:
Standard image High-resolution image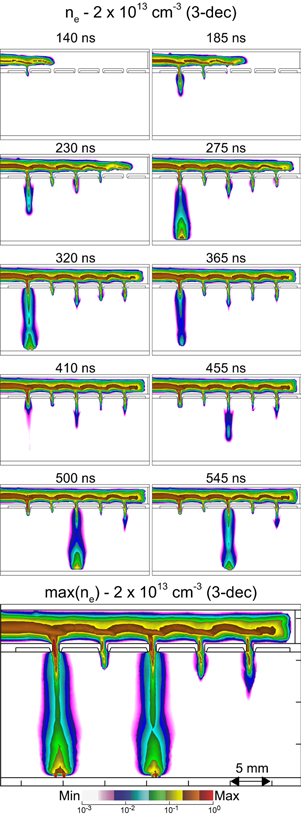
Figure 8. Electron density (ne) as a function of time for the base case. The electron density in the tube remains elevated after the primary ionization wave (PIW) passes. Secondary ionization waves (SIWs) propagate through each of the holes, but only reach the surface through the first and third holes. Outside of the tube, thermal electron attachment to O2 results in the electron density dropping more rapidly after the SIW passes. The bottom frame shows the maximum electron density that occurs during the simulation at each computational node. This mode of display [max(ne)] records time history of propagation of the SIWs.
Download figure:
Standard image High-resolution imageIn the modeling results (figure 7), the PIW reaches the end of the tube after 260 ns, and continues to produce electron impact ionization until the surface of the end cap is electrically charged. As the PIW propagates past each hole, SIWs propagate through the holes and downward towards the grounded pump surface. These SIWs experience a brief delay of approximately 10 ns from the time that the PIW reaches the top of a hole, to the time that the SIW emerges from the bottom of the hole. During this delay, Se inside the hole reaches 1 × 1020 cm−3 s−1, but is non-uniform. Se in the first SIW as it propagates towards the target is initially large in the region of high helium concentration (9 × 1020 cm−3 s−1), but decreasing by more than an order of magnitude (2 × 1019 cm−3 s−1) as the SIW propagates into regions having a higher air concentration. As electron energy is more rapidly lost in collisions with N2 and O2 due to rotational and vibrational excitation, and low lying electronic states, there is less ionization at a given E/N. As the SIW forms a conductive channel, the E/N decreases behind the ionization front which, for constant total voltage, increases the electric field in front of the SIW which helps to sustain the SIW. When the SIW is within 5 mm of the grounded surface, this increase in electric field results in a progressive increase in Se as the SIW approaches the ground (figure 7, 260 ns). As the SIW begins to contact the surface the enhancement in electric field is at a maximum, and there is brief increase in Se to 1 × 1021 cm−3 s−1 which is aided by secondary electron emission from the surface. Once the conductive channel bridges the entire gap, E/N decreases at the surface while increasing throughout the remainder of the channel. There is then a second instance of electron-impact ionization, shown in figure 7, for the first hole at 285 ns and the third hole at 500 ns. This behavior will be referred to as a potential rebound, because the lines of electric potential are redistributed in the conductive channel after the SIW contacts the ground, as shown in figure 7 (285 and 500 ns). The mechanism is analogous to that of a restrike, but because of the non-uniform gas composition and complex geometry, it is not significant enough to produce net ionization at every point in the conductive channel. In much of the conductive channel Se is negative after passage of the SIW and becomes less negative during the potential rebound. However in certain regions of the channel, ionization rates exceed attachment and recombination rates, and there is a net production of electrons.
As the first SIW propagates and produces a conductive channel, the E/N is reduced in the channel which reduces the voltage drop between the hole and the head of the SIW. This shorting of the potential in the path of the adjacent SIW limits the field enhancement that can occur ahead of the second SIW. This is essentially an electrostatic interaction between the SIWs. This electrostatic interaction affects all subsequent SIWs, resulting in more intense propagation for the first, third, and fifth SIWs compared to the second and fourth SIWs. This SIW-to-SIW interaction is over-emphasized in the simulations compared to the experiments. In the 2D simulation, the plasma columns are computationally sheets of conductivity which affect the electric potential to greater distances than the cylinders of conductivity that occur in the experiment.
The electron density in the multi-jet is shown in figure 8. Inside the tube, the electron density remains elevated with values of 4 × 1012 cm−3 after the PIW has passed. While Se has become negative, the electron density continues to increase due to Penning ionization. Outside of the tube, after the SIW passes and the electron temperature decreases, rapid attachment of the electrons to O2 and H2O from the surrounding air results in the electron density decreasing from 1 × 10¹² to 4 × 1010 cm−3 over 120 ns. In the regions of highest helium concentration, just outside the holes, the mole fraction of air is small, attachment does not occur as rapidly and the electron density remains elevated, remaining above 4 × 1012 cm−3 for 120 ns. Outside the tube, O2+ is the most abundant positive ion. Initially O2+ balances the charge of the electrons. After the SIW passes, OH− begins to accumulate as the system transitions to an ion-ion plasma.
The dynamics of the multi-jet are complex in both space and time, which in turn require time and space resolved imaging, experimentally and computationally, to properly investigate. These approaches produce large amounts of data which cannot be exhaustively displayed in this paper. (See, for example, the experimental and computational animations in the supplementary information.) A more compact method of presenting computed dynamics of the SIWs was necessary for discussion and comparison to experiments. This more compact form is to record the maximum value of the electron density that occurs at each position as time proceeds. This value, designated 'max(ne)', is also shown in figure 8 along with the real time dependent densities. The max(ne) is a useful metric for comparisons with time-integrated ICCD imaging.
The propagation of the PIW is sustained by photoionization which produces an electron density of 5 × 108 cm−3 approximately 5 mm in front of the PIW. These electrons are accelerated in the electric field back towards the PIW, which facilitates the propagation. The sources of electrons due to photoionization, Sphoto, at t = 155 ns are shown in figure 9 for each of the photoionization reactions included in the model. The main impurity in the He is H2O, and so the primary source of photoionization generated electrons ahead of the SIW in the tube is photoionization of H2O by excimer radiation from He2*, shown in figure 9(c). Outside of the tube, where the helium mixes with humid air, other photoionization reactions are also significant. The dominant photoionization reaction outside the tube is due to photons emitted by N2** ionizing O2. This photoionization reaction is essential for propagation of the SIW, which occurs in regions of higher air concentration where He2* is not generated or is rapidly quenched by reactions with N2 and O2. In these regions, a lower Te results in less He* production, the precursor to He2*, and the He density is lower, which reduces the rate of the 3 body process that forms He2*. Both of these conditions result in a lower density of He2*,
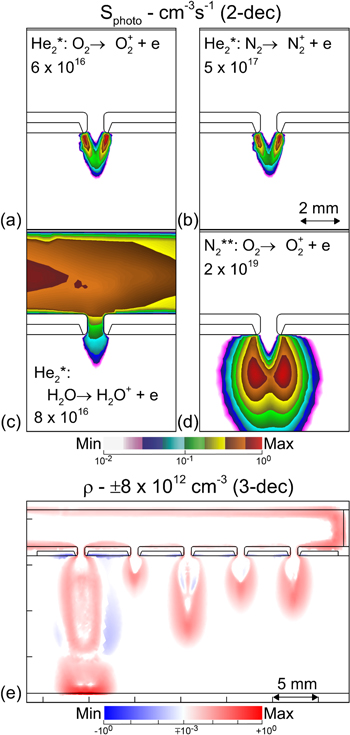
Figure 9. Photoionization rate and space charge as the ionization waves propagate through the holes. (a)–(d) The photoionization source term (Sphoto) at 155 ns at the first hole, plotted on a two-decade log scale with the maximum value indicated on each frame. Values of Sphoto are shown resulting from each emitter-absorber pair included in the model: (a) photoionization of O2 by photons emitted by He2*, (b) photoionization of N2 by photons emitted by He2*, (c) photoionization of H2O by photons emitted by He2*, (d) photoionization of O2 by photons emitted by N2**. (e) The total space charge density at 430 ns. The positive and negative space charge are each plotted on three-decade log scales.
Download figure:
Standard image High-resolution imageAt t = 155 ns, when the photoionization rates are shown in figure 9, the SIW at the first hole has already developed and propagated 2.5 mm outside of the tube. At this time, the rate of photoionization by N2** outside the tube (2 × 1019 cm−3 s−1) is much greater than that of the He2* (3 × 1017 cm−3 s−1). However, the role of photoionization outside the tube by excimer radiation from He2* is essential before 140 ns when the SIW is first emerging from the hole. Since the excimer emission is not radiation trapped, the photons are lost only through absorption by impurities. The long absorption mean free path for excimer emission from He2* (2 cm in He with 0.1% H2O) enables photons emitted by He2* inside the tube to propagate through the hole and illuminate the air molecules diffusing into the He plume (something of an excimer flashlight). The excimer radiation is then abruptly absorbed by the infusing air, producing ionization outside of the tube. These seed electrons produced by photoionization (5 × 107 cm−3) facilitate SIW propagation through the hole.
Photoelectron emission from the surfaces of the tube also provides a source of electrons ahead of the PIW and in the holes for the SIW. For an estimated photoemission probability of 0.01, the VUV photons striking surfaces produce an electron source as high as 3 × 1015 cm−3 s−1 at nodes adjacent to the surface, which is comparable to the contribution by direct photoionization. However, because the source of electrons by photoemission is limited to one mean free path for electron collisions from the surface, the total volume of the plasma benefiting from photoelectron emission is small. (In the model, the electrons produced by photoemission are placed in the numerical node next to the surface.) The integrated contributions from photoionization in the bulk gas phase are more significant for both PIW and SIW propagation.
The surface and volumetric space charge is shown in figure 9(e) at t = 430 ns. As the PIW propagates, the inner surface of the dielectric tube charges positively (1 × 1011 cm−3) because of the positive polarity of the applied voltage. Inside the holes, the surface charge is also positive, with a larger magnitude of approximately 1 × 1012 cm−3. As the SIW propagates out of the hole, the front of the SIW contains space charge as large as 7 × 1012 cm−3. This region of positive space charge results in a reduction of the electric field in the bulk plasma, and an enhancement of the electric field in the front region of the space charge. This localized field enhancement facilitates the local ionization which occurs in SIW propagation.
Although there is generally good qualitative agreement between the model and experiment, there are several quantitative differences between the propagation of the IWs in the experiment compared to the model. The speed of the PIW propagation in the experiment is approximately 0.9 × 107 cm s−1 compared to 2 × 107 cm s−1 in the model, a discrepancy of a factor of 2. This discrepancy is a result of the increased voltage used in the model used to approximate the propagation of a three-dimensional IW (which naturally has more electric field enhancement in the head of the IW) in two-dimensions. Other sources of discrepancy include differences in the level of impurities in the helium (the experimental value is not well known) and ignoring photoionization by resonant He photons which can be significant. As discussed earlier, the electrical interaction between SIWs is overestimated in the model due to the limitations of the two-dimensional framework. In the model, the SIWs are approximated as sheets of plasma, which produces a greater disturbance in the potential for neighboring SIWs. In the experiment, each SIW is a column of plasma, which limits its effect on the potential of adjacent SIWs.
4.2. Single hole assembly
Although having an array of SIWs is the goal of the multi-jet, having multiple SIWs exiting the holes and contacting the grounded target at different times complicates the dynamics of the electric field and complicates interpretation of both experimental and computed results. In this section, the plasma properties of a multi-jet assembly having a single hole are discussed to better isolate the transition from PIW to SIW. An 800 μm hole was used and the helium flow rate was reduced to 0.2 slm, so that the amount of gas flowing through the hole was the same as in the base case. The air flow rate is the same as that of the base case, 3 slm. In this section, time-resolved measurements of electric field for a jet having a single hole are first compared to the modeling results at several axial locations around the device for the tube being 1.5 cm above the grounded pump. Then the effect of changing the distance between the tube and the ground plane will be discussed.
The IW behavior predicted by the model is shown by Se and ne in figure 10. The qualitative behavior of the PIW and SIW are the same as the propagation of the first SIW in the base case multi-jet having 5 holes. When the SIW reaches the grounded target, E/N in the tube to the left of the hole increases from 7 × 10⁻¹⁸ V cm2 to 4 × 10⁻¹⁷ V cm2 (0.7–4 Td). There is a second pulse of ionization up to 2 × 1019 cm3 s−1 in some regions of the conductive channel (compared to 1 × 1020 cm3 s−1 the SIW) which travels faster than the SIW (8 × 107 cm s−1 compared to 1 × 107 cm s−1). This potential rebound propagating in the reverse direction is analogous to that which occurs in a restrike [28]. After the SIW reaches the target, there is spreading of plasma along the surface of the target. Since the target is metal, this spreading of the plasma is not a classical surface IW which requires differential charging of the surface and bending of electric field lines. (Electric field lines are perpendicular to a metal surface.) The appearance of a surface IW results from bending of electric field lines in the bulk plasma by the adjacent conductive column of the SIW.
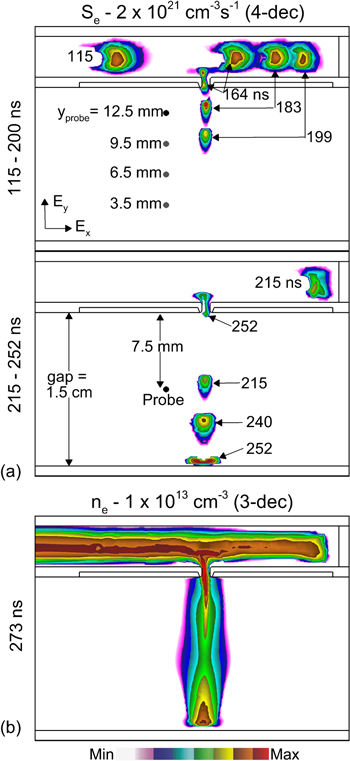
Figure 10. A summary of IW propagation in a multi-jet assembly with a single hole and single secondary ionization wave. (a) The electron impact ionization source term (Se) is shown for four sequent moments in time on a four-decade log scale. The time corresponding to each position of the IW is indicated on the frame. The positions at which electric field measurements were made with the electrooptic probe shown in figure 11 are in the upper frame. The probe positions for the measurements plotted in figure 12 are indicated in the lower frame. (b) The electron density at 273 ns, 172 ns after the secondary ionization wave has contacted the grounded pump surface.
Download figure:
Standard image High-resolution imageExperimental measurements by the electric field probe in this configuration were made at locations labeled in figure 10. For comparison to the experimental measurements, the electric field calculated in the model was averaged over the volume of the probe to emulate the signal produced by the probe. Perturbations to the electric field that might occur by the presence of the probe were not accounted for in the model. The x-components of electric field (parallel to the tube), Ex, measured in the experiment and predicted by the model at several vertical positions are shown in figure 11 as a function of time. The y-components of the electric field (perpendicular to the tube), Ey are shown in figure 12.

Figure 11. The horizontal components of the electric field (Ex) for 4 vertical positions 1 mm to the left of the hole, as indicated on figure 10. The position above the grounded target surface is indicated for each line. Values of Ex are shown (a) calculated in the model and (b) measured in the experiment. The modeling results are averaged over the volume of the probe. In the experiment the distance from the electrode to the first hole is larger and so the experimental timing has been shifted to align with the modeling results.
Download figure:
Standard image High-resolution image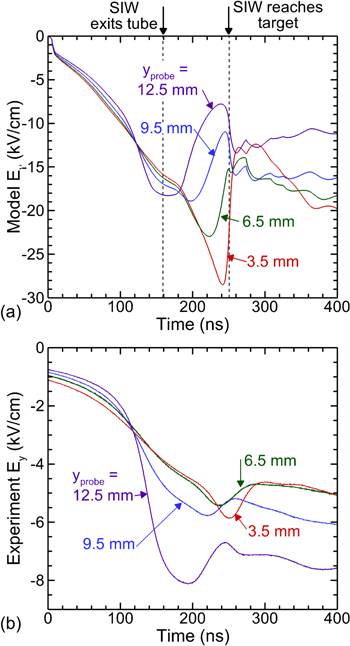
Figure 12. The vertical components of the electric field (Ey) for 4 vertical positions 1 mm to the left of the hole, as indicated on figure 10. The position above the grounded target is indicated for each line. Values of Ey are shown (a) calculated in the model and (b) measured in the experiment. The modeling results are averaged over the volume of the probe. In the experiment the distance from the electrode to the first hole is larger and so the experimental timing has been shifted to align with the modeling results.
Download figure:
Standard image High-resolution imageThe vacuum values of Ex would be positive for all of the probe positions. As the PIW passes above the probe in the tube Ex increases (positive) due to the shorting of the positive potential in the plasma column, which extends the anode potential closer to the probe, and due to the positive space charge in the head of the PIW. This electric field has the largest magnitude at the probe position closest to the tube, 2.5 kV cm−1. When the SIW propagates through the hole and outside the tube, positive potential and positive space charge are produced to the right of the probe, which reduces Ex and eventually reversing the direction of Ex to point to the left (negative). As the SIW passes to the right of the probe locations, the value of Ex is maximum, −1.5 kV cm−1 at the top probe point.
The positive space charge contained in the head of the SIW appears to be a point-like positive potential translating from top to bottom. As this point-like positive potential passes by the probe, an electric field component pointing to the left (negative) is produced. The most negative value of Ex tends to increase at probe positions closer to the grounded target reaching −3 kV cm−1 when the probe is at 6.5 mm. The negative increase in Ex is due to progressively more positive potential (and positive space charge) being produced to the right of the probes as the conductive column extends further from the tube. There is a delay in the negative maximum due to the finite propagation time of the SIW. For example, between probe positions 12.5 mm and 6.5 mm there is a delay of 31 ns, corresponding to a propagation speed of 2 × 107 cm s−1. The most negative value of Ex occurs at approximately the same time for the 3.5 and 6.5 mm probe positions. The time response and subsequent averaging of the probe response results in the 3.5 mm signal appearing earlier in time. The near coincidence of the times at 3.5 and 6.5 mm is also shown by the model. After the SIW contacts the target, there is a rapid decrease in the magnitude of Ex as the potential of the conductive channel drops. As the potential of the plasma increases after the SIW contacts the ground, much of the potential drop becomes confined to the cathode fall layer at the grounded surface, and the magnitude of Ex increases again.
Results from the model reproduce all of these systematic trends, with the exception of the magnitude of the electric field. The magnitude of the electric field in the model is larger than that measured in the experiment. First, the voltage applied in the model is larger than in the experiment to compensate for the slot (model)-versus-cylinder (experiment) nature of the SIWs. However, much of the overestimate results from the two-dimensional nature of the model compared to the three-dimensional experiment. In the experiment, the region of largest space charge at the SIW front is, to first order, a small sphere of charge. In the model, the region of largest space charge at the head of the SIW is, to first order, a cylinder of charge of infinite length. These two space charge configurations produce quite different behavior in the electric field as the probe is moved away from the SIW. For a sphere of charge, the electric field is proportional to 1/r2 (r is distance from the charge) whereas for a cylinder of charge, the electric field is proportional to 1/r. Said otherwise, there is more geometric electric field enhancement around a sphere compared to the cylinder but only within a radii or two of the space charge. For probe positions that are outside the field enhancement for the passing space charge (beyond a few radii of the space charge), electric fields will be smaller for the sphere (experiment) compared to the cylinder (model). The probe is measuring the electric field as much as 3.5 mm from the SIW which is much larger that the diameter of the space charge region (∼650 μm). These geometric effects can explain the higher predicted electric fields in the model while being able to reproduce the systematic trends. Since the voltage pulse in the experiment has a longer rise time than in the model, the applied voltage may not be at its maximum value as the SIWs exit the tube which could also contribute to the overestimation of the electric field in the model.
Ey in the model and the experiment is shown in figure 12. As the PIW passes above the probe, Ey < 0 with a magnitude which is increasing, as is the case with the vacuum electric field. With the positive potential produced by the PIW above the probe, there is an increasing downward pointing component of the electric field. In the modeling results, Ey is approximately the same for all probe positions, before the SIW exits the tube. In the experimental measurements, the magnitude of Ey is significantly higher when the probe is closer to the tube. This discrepancy is again a result of the three-dimensional nature of this device. In the experiment, the anode potential that is extended by the PIW through the tube is, to first order, a cylinder of charge, which would have a potential which decreases as 1/r. In the model, the anode potential extended by the PIW is a sheet of charge, which would produce a uniform axial electric field. As the SIW approaches each probe position, the electric field enhancement in front of the SIW results in an increasingly negative Ey if the head of the SIW is above the probe. As the SIW passes the probe position, the contribution to Ey from the positive space charge in the head of the SIW flips to being positive, resulting in a decrease in the magnitude of Ey. The consequences of the space charge produced are more pronounced in model due to the previously discussed discrepancies between 2D and 3D.
The gap between the tube and the grounded target was varied in both the experiment and the model using the single hole configuration. The center of the probe was placed 7.5 mm below the tube, indicated in figure 10(a). The time evolution of the x-components of the electric field for different gap sizes of 10–24 mm is shown in figure 13. Ex generally increases as the gap increases because when the gap is small, the electric field is more strictly vertical. As the gap increases, the speed of the PIW and SIW decrease due to an overall lower electric field. The maximum electric field therefore occurs later in time for a larger gap, and has a smaller maximum magnitude. As the SIW exits the tube and passes the probe, the minimum (most negative) value of Ex is relatively consistent because the potential of the SIW is not sensitive to the gap size. In the model, for gaps larger than 18 mm, the SIW does not reach the target. In both the experiment and the model, the electric field remains at its minimum (most negative) value for a longer time when the gap is larger. There are two components of this delay. For a larger gap, the SIW takes longer to travel the greater distance between the probe and the target. Then the disturbance in the potential that occurs after the contact is delayed in propagating from the target back up to the probe location. This potential rebound, propagating in the reverse direction is analogous to that which occurs in a restrike [28].

Figure 13. The electric field measurements at 3.5 mm to the left of the hole and 7.5 mm below the tube for different gap distances between the tube and the ground. (a) Ex in the model (gap distances of 10, 12, 14, 16, 18, 20, 22, and 24 mm) and (b) Ex in the experiment (gap distances of 10, 13, 16, 19, and 22 mm).
Download figure:
Standard image High-resolution image4.3. Voltage polarity
The voltage polarity is the parameter that most significantly affects the character of the SIW propagation in the multi-jet. Time-resolved ICCD images, averaged over 100 pulses, for positive and negative polarity pulses are shown in figure 14. For negative applied voltage, the SIWs do not reach the grounded target. The SIWs extinguish where the humid air diffusing into the He channel becomes significant (a mole fraction of about 20%), as the SIWs cannot be sustained at high molecular gas concentration. The SIWs for negative polarity stop emitting light before the PIW reaches the end of the tube. Under the same conditions, but for positive polarity, the SIWs do reach the grounded target and remain illuminated as the PIW reaches the end of the tube. The speed of the PIW is also approximately a factor of 2 slower for negative polarity, 9 × 106 cm s−1 compared to 2 × 107 cm s−1.
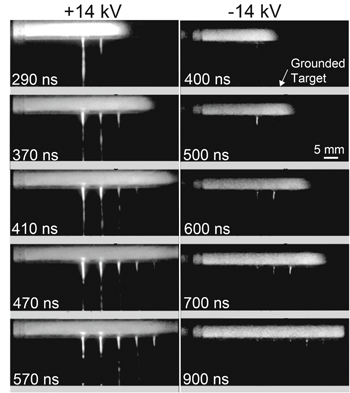
Figure 14. ICCD imaging ionization wave propagation in a multi-jet with (left) +14 kV positive polarity and (right) −14 kV negative polarity. The imaging gate was 10 ns and the images are averaged over 100 pulses.
Download figure:
Standard image High-resolution imageThis sensitivity to polarity also occurs in the modeling results shown in figure 15. The PIW for positive polarity (base case) was concentrated at the center of the tube, as electrons that are generated from photoemission or photoionization are accelerated toward the IW. With negative polarity, electrons generated by electron impact ionization in the bulk plasma are directed ahead of the IW by the applied electric field. As a result, the electron impact ionization rate, Se, was maximum at the lower surface of the tube the opposite direction of the applied vacuum electric field. This asymmetry inside the tube occurs before the PIW reaches the holes, and is a result of a lower electrical ground being closer to the tube (1.5 cm) than the upper electrical ground (15 cm). This closer proximity produces a larger acceleration for electrons in the vacuum electric field downwards than upwards. This asymmetry is also consistent with the ICCD imaging, where the light emission on the lower surface of the tube is greater for negative polarity.
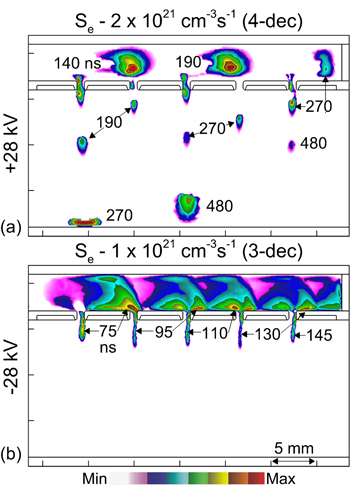
Figure 15. The effect of polarity on ionization wave propagation, shown by the electron impact ionization source term, Se computed with the model. Se is plotted at several moments in time, with the time in ns indicated near each source term. (a) Se for a +28 kV applied voltage, plotted on a four-decade log scale. (b) Se for a −28 kV applied voltage, plotted on a three-decade log scale.
Download figure:
Standard image High-resolution imageWith positive polarity, SIWs reach the surface and whereas with negative polarity SIWs extinguish upon contacting regions exceeding 20% mole fraction of air. This difference is a result of the amount of field enhancement which occurs ahead of the IW for each polarity. With a positive polarity, electrons accelerating toward the IW produces a sharper gradient in potential. The space charge in the head of the IW is comparable for the positive polarity (3.4 × 10¹¹ ∣q∣ cm−3) and negative polarity (−4.0 × 10¹¹ ∣q∣ cm−3). However because the shape of the PIW is different for the positive polarity, being confined to a smaller diameter, E/N in the PIW is 125 Td for positive polarity and 54 Td for negative polarity. The lower E/N with the negative polarity is not sufficient to produce avalanche with significant fractions of air in He.
The speed of the PIW is overestimated in the model compared to the experiments. For both polarities, the same voltage was applied in the model, which was higher than in the experiment to approximate three-dimensional effects. However, in the experiment this three-dimensional electric field enhancement is expected to be greater for positive polarity, because of the smaller diameter of the avalanche front of the PIW. In the modeling results, the PIW is faster for negative polarity which is different from the experimental trend. This disparity results from the positive polarity PIW in the two-dimensional model having less electric field enhancement than produced in the three-dimensional experimental PIW. The positive PIW is more sensitive to electric field in the ionization front.
In several experiments, disturbances of the bulk gas flow in APPJs by the plasma have been observed. These disturbances have been well documented in single APPJs but also occur in multi-jets, and typically depend on the polarity of the applied voltage [22, 29]. In the modeling results, the initial flow conditions were the same for both polarities, and qualitatively match the experiment. Therefore the observed differences in the SIW behavior are not simply a result of the change in gas composition, but a more fundamental feature of the IWs.
4.4. Gas flow rate
Varying the He flow rate changes the mole fraction of air in the path of the SIW. Higher flow rates extend the length of the gas plume that is dominated by He. With lower flow rates the in-diffusion of air results in larger mole fractions of air nearer the hole. To investigate these effects, the He flow rate was varied from 0.5 to 2 slm for positive polarity discharges while keeping the air flow constant a 3 slm. As the flow rate is increased, the experimental ICCD imaging in figure 16 indicates more intense SIWs, but greater decrease in the SIW intensity with each subsequent hole. For 2 slm, the light emitted from the fifth SIW is small compared to that from the first SIW. With increasing flow rate, the brightest region of the SIWs, which occurs at the outlet of the hole, is elongated as the region of high helium mole fraction is extended.
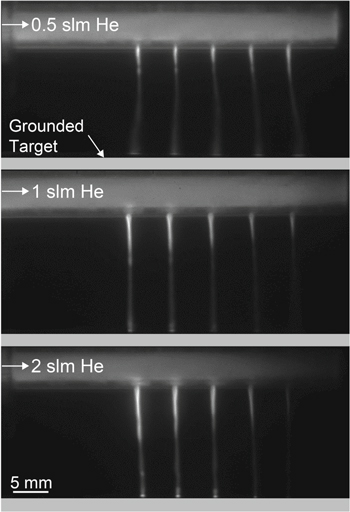
Figure 16. ICCD imaging of total emission as a function of helium flow rate. The gate was 10 ns and the images are averaged over 100 pulses.
Download figure:
Standard image High-resolution imageThese features can be explained based on results from the model shown in figures 17 and 18. The maximum electron density at each computational node is shown in figure 17 for He flow rates of 0.5, 1.0 and 2.0 slm. The N2 density, electron temperature and ionization source in the vicinity of the first holes are show in figure 18 for the same He flow rates. The gas is essentially stationary on the timescales of the IW propagation (500 ns), and the pressure variation among flow rates is negligible. As a result, He flow rate likely affects the SIW through variation in the gas composition outside of the tube, as shown for the first hole in figure 18, as opposed to a flow induced instability.
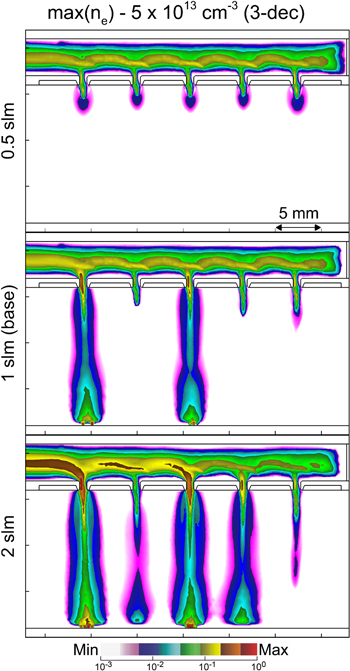
Figure 17. The maximum electron density [max(ne)] at each numerical mesh point computed with the model as a function of He flow rates, 0.5–2.0 slm. Densities are plotted on a three-decade log scale.
Download figure:
Standard image High-resolution image
Figure 18. IW propagation through the first hole as a function of helium flow rate. (Left) N2 density with a steady state flow, plotted on a four-decade log scale. (Center) Electron temperature as the IW exits the hole and begins to interact with in-diffusing air, plotted on a linear scale. (Right) Electron impact ionization source of the SIW at the same position, plotted on a four-decade log scale. The speed at which the SIW develops outside of the tube was sensitive to He flow rate and so results are when the SIW is at approximately the same position. The time at which Te and Se are plotted is indicated at the left.
Download figure:
Standard image High-resolution imageThe spatial extent of Se in the SIWs increases with He gas flow rate because there is a lower concentration of air in the He plume further from the hole. Air, being composed of molecular gas, results in greater rates of electron energy loss due to vibrational and rotational excitation, and lower lying electronic states compared to He. At higher He flow rates, air concentrations are lower in the plume, resulting in a higher Te for a given E/N. Te in the SIW increased from 3.1 to 4.7 eV as the flow rate was increased from 0.5 to 2 slm. As a result Se increased from 1 × 10¹⁹ to 5 × 1020 cm−3 s−1. The extended region of the plumes having small air mole fractions with higher flow rates produced the elongated brighter regions in the ICCD images.
The PIW attenuates as it passes each hole and sequentially launches SIWs. This attenuation is indicated by the decreasing electron density in the tube shown in figure 17 for a He flow rate of 2 slm. The lower concentration of air in the plume at higher He flow rates enables a more intense SIW which produces a more conductive channel. For example, the electron density in the conductive channel increases from 4 × 1011 cm−3 for 1 slm to 1 × 1012 cm−3 for 2 slm. The higher conductivity in the channel produced by the SIW results in a more intense potential rebound when the SIW contacts ground, and so a larger potential drop occurs in the tube. As a result, E/N in the PIW inside the tube decreases as each successive SIW contacts the grounded target. The ICCD brightness of the PIW near the end of the tube decreases with increasing flow rate because of this decrease in E/N in the PIW. In time-resolved ICCD imaging, at larger flow rates, the PIW speed slows with the propagation of each successive SIW (data not shown). In both the experiment and the model, increasing the flow rate in a negative polarity multi-jet also elongated the SIWs by reducing the diffusion of air into the He plume (data not shown). In the modeling results, the SIWs reached the target for He flow rates above 2 slm.
The influence of polarity of the voltage on the mixing of air into the He plume was not investigated in detail here. However, in prior studies on single plasma jets, we found that polarity can affect mixing [24]. In those studies, for some conditions with negative polarity, a stable cylindrical helium channel extended to the target. However, using a positive polarity produced a disturbed flow.
At low He flow rate, the diffusion of air into the He plumes occurs within a few mm of the holes, as shown in figure 18. The SIWs fail to propagate beyond an air mole fraction of about 20%–25% and a conduction channel to ground is not formed, shown in figure 17. As a result, there is no conduction current that connects the powered electrode to ground, and no potential rebound. Current continuity from the powered electrode is maintained by displacement current, either directly to ground through the air as the SIWs successively penetrate through the holes, or by displacement current through the dielectric tube. With there being no power dissipation by the successive waves through formation of a conductive channel, the electron density inside the tube remains nearly constant as each SIW is launched.
The interaction between the SIWs is more significant in the model than in the experiment, which is expected based on the two-dimensional approximation of the device. It is likely for this reason that in the experiment, the SIW for 0.5 slm propagates (though very weakly) to the ground plane whereas the SIW does not propagate in the modeling results. At the same time, this interaction may be underestimated in the ICCD imaging as these images are the average of 100 pulses. So if stochastic behavior resulted in a different SIW failing to propagate with each pulse, this isolated behavior would not be visible in the pulsed averaged images.
4.5. Hole diameter
The diameters of the holes on the multi-jet greatly affect the propagation of SIWs out of the holes. A comparison of experimental ICCD imaging for SIWs propagating through 200 and 800 μm holes is shown in figure 19. Results from the model for electron density for hole sizes of 200, 500 and 800 μm are shown in figure 20. The computed N2 density, photoionization source and electron impact ionization source for these holes are shown in figure 21. The delay between the PIW passing above a hole and the SIW appearing outside of the tube increases as the holes decrease in size. Experimentally, with 200 μm holes, the first SIW does not exit the tube until approximately 250 ns after the PIW reaches the end of the tube. With 800 μm holes, the SIW propagates out the first hole 20 ns after the PIW passes above the hole (180 ns before the PIW reaches the end of the tube). This increase in delay is also observed in the model. The first SIW emerges from the hole 105 ns after the PIW passes for d = 200 μm while having a delay of only 15 ns for d = 800 μm.
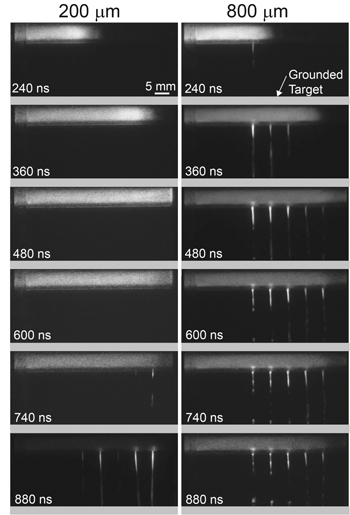
Figure 19. ICCD imaging of IW propagation for a multi-jet with 200 and 800 μm diameter holes. The camera gate was 10 ns, and images are averaged over 100 pulses. The time indicated on the figure is measured from the moment the PIW is visible in the camera frame.
Download figure:
Standard image High-resolution image
Figure 20. The maximum electron density [max(ne)] for hole diameters of 200, 500, and 800 μm, plotted on a three-decade log scale.
Download figure:
Standard image High-resolution image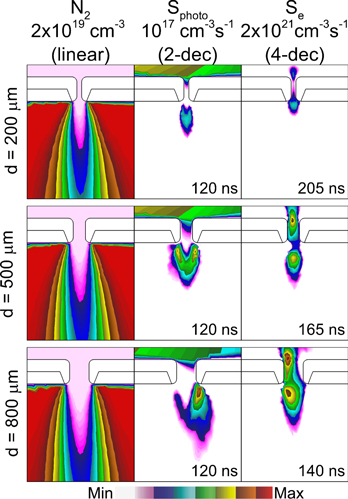
Figure 21. Mechanisms of IW propagation through the first hole of a multi-jet for different hole diameters. (Left) N2 density for a steady state flow, plotted on a four-decade log scale. (Center) Total photoionization rate, Sphoto, at t = 120 ns, before the IW has exited the tube on a two-decade log-scale. (Right) Electron impact ionization rate, Se, on a four-decade log-scale after the IW has propagated through the hole for the IW being at approximately the same location. The SIW initiates later for smaller holes and the time for each image is shown.
Download figure:
Standard image High-resolution imageThe SIW propagates more quickly through larger holes due to the combined effects of gas composition and photoionization. The maximum photoionization source outside of the tube is 103–104 smaller in magnitude than the electron impact ionization source. However, this photoionization is critical to providing the initial electrons which enable the SIW to develop. The number of photons emitted by He2* in the PIW which pass through the hole to reach the outside of the tube depends on the aspect ratio of the hole. For a smaller diameter hole, the aspect ratio is larger, the view angle is smaller, and fewer photons reach the outside of the tube to produce photoionization. As a result, the rate of photoionization outside the tube before the SIW emerges increases from 6 × 10¹⁵ to 3 × 10¹⁶ with increasing hole diameter (200–800 μm), as shown in figure 21.
The ability of the SIW to fully develop and bridge the tube-to-ground gap in part depends on the diffusion of air into the plume of He exiting the holes. Air diffuses into the He plume more rapidly with smaller holes which have larger concentration gradients. This large concentration of air in the He plume results in more inelastic, non-ionizing electron energy losses and attachment in the plume with smaller holes. The result is that SIWs have lower electron densities and do not reach the target with 200 μm holes, while only the last SIW reaches the target with 500 μm holes.
In the experiment, the SIWs propagate out the fifth hole at the end of the tube first with 200 μm holes. In the model, the SIWs first propagated out of the first hole. The precise timing and sequencing of the SIW are sensitive to the location of ground planes around the tube. For example, there is an effective ground plane in the experiment on the right-hand side of the jet, which in the model was assumed to be 10 cm away. This ground plane location produces a small increase in E/N when the PIW reaches the end of the hole, but the capacitance is too small to produce significant ionization. If the effective ground is closer, a stronger potential rebound may occur as the end of the tube charges, producing a more dense plasma near the fifth hole, and more photoionization as a result.
4.6. Spacing between holes
It is expected that electrostatic interactions between SIWs should decrease as the spacing between the holes increases. The maximum electron densities are shown in figure 22 for hole spacings of 3–10 mm with 800 μm holes. For the smallest spacing, none of the SIWs reach the target. If the spacing is increased to 5 mm (the base case) the SIWs do not reach the target for the second, fourth, and fifth hole, but do so for the first and third. When the spacing is increased to 10 mm, the SIWs reach the grounded target in all cases. With the 10 mm spacing, the pulse duration was increased to 700 ns, to allow time for the PIW to propagate through the longer tube before the end of the voltage pulse.
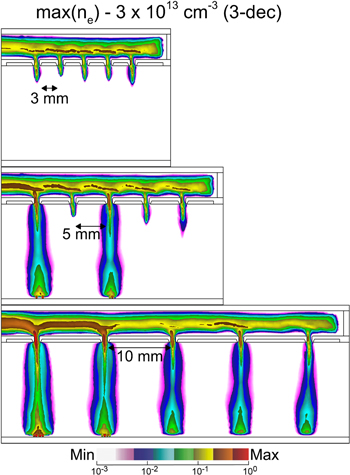
Figure 22. The maximum electron density [max(ne)] for 3, 5, and 10 mm spacing between the holes in a multi-jet for hole diameters of 800 μm. The densities are plotted on a three-decade log scale.
Download figure:
Standard image High-resolution imageWhen the holes are closer together, the interaction between SIWs is not only closer in space, but also closer in time. The delay between the SIW exiting the first hole to exiting the second hole is approximately 15 ns for a 3 mm spacing, 25 ns for a 5 mm spacing, and 45 ns for a 10 mm spacing. For a 10 mm spacing, the first SIW has almost reached the grounded surface when the second SIW begins to emerge from its hole. As a result, the second SIW cannot electrostatically interfere with the propagation of the first SIW (though there can be residual interference of the first SIW with the second). When there is only 3 mm between the holes, the first SIW is still developing and has propagated less than 1.5 mm from the hole when the second SIW begins to emerge from its hole. As a result, the propagation of the first SIW is affected electrostatically by the second SIW, and similarly for the 2nd to 3rd SIW.
In a previous study of a multi-jet by Darny et al, a metal multi-jet assembly (rather than the dielectric tube) was used to generate SIWs which were synchronized in time [22]. Those results suggest that the interactions between SIWs are more pronounced when SIWs are simultaneously generated, compared to a dielectric multi-jet where the SIWs are staggered in time.
The 3 mm spacing represents a qualitative lower limit of hole separation which must be exceeded to uniformly treat a surface by the plasma produced in the multi-jet. This limit of hole spacing is smaller in the experimental device, because the disturbance in potential surrounding the SIW is less in three-dimensions than in two-dimensions. For example, SIWs contacted the surface with a 3 mm spacing in the experimental results discussed in [22]. The design goal of this device is to produce more spatially uniform treatment. To achieve this goal, a larger separation between the holes is needed, so that a SIW does not emerge until the previous SIW is close to the surface.
4.7. Distance to grounded target
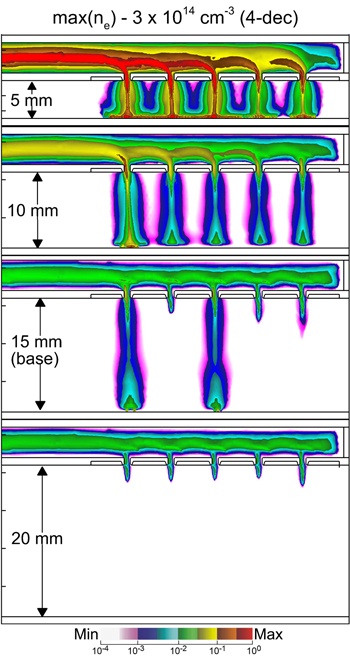
The distance from the tube to the lower ground plane significantly affects the propagation of both the PIW and SIWs. For example, the maximum electron density is shown in figure 23 for tube-to-lower ground plane gaps of 5–20 mm. Before the PIW reaches the first hole, its propagation is affected by the lower ground plane. A closer ground plane results in a higher electric field, larger capacitance and charging of the tube, and higher PIW speeds before the first hole. When the grounded target is 5 mm from the tube, the PIW reaches the first hole after 65 ns, compared to 140 ns for a 20 mm gap (the average speed decreasing from 5.7 × 10⁷ to 2.6 × 107 cm s−1). The electron impact ionization rate decreases from 2.5 × 1021 cm−3 s−1 for a 5 mm gap to 1.8 × 1020 cm−3 s−1 for a 20 mm gap, producing electron densities in the tube of 5 × 1014 cm−3 to 4 × 1012 cm−3.
Figure 23. The maximum electron density [max(ne)] for tube-to-grounded target gaps of 5–20 mm. The electron density is plotted on a four-decade log scale.
Download figure:
Standard image High-resolution image
The SIWs are affected by the tube-to-ground gap through both the electric field and the gas composition. As the SIW exits the tube, there is an initially higher electric field if the gap is smaller. As the SIW approaches the grounded target, electric field enhancement in the ionization front increases due to the shorting of the electric field in the trailing conductive channel. This effect is larger with a smaller gap as the initial vacuum electric field is larger. The SIW therefore propagates toward the ground faster with a smaller gap. The SIW crosses from hole to ground plane in less than 10 ns for a 5 mm gap while requiring and 150 ns for 15 mm gap. The amount of air in the path of the SIW through the He plume increases with distance from the hole to the ground plane, which additionally contributes to the SIW slowing and eventually stalling.
The consequences of an SIW contacting the grounded target are more severe when the grounded target is closer. If the multi-jet is close to the grounded target, the SIWs contact the grounded surface while still propagating through a He plume with a low fraction of air. The electron density and conductivity of the plasma channel are higher, and as a result the disturbances in potential due to the potential rebound are more significant. For small gaps, the potential rebound can occur before the PIW reaches the next hole. The potential rebound decreases E/N in the PIW front after each SIW reaches the ground. The PIW therefore slows as it propagates through the tube for closer ground planes. For example, with the 5 mm gap, the PIW has an initial speed (before the first hole) of 6 × 107 cm s−1 and a final speed (at the last hole) of 1 × 107 cm s−1. As a result the PIWs reach the end of the tube within about 45 ns of each other for all gaps, in spite of the PIW with the 5 mm gap having a higher initial speed. With the electric field in the PIW decreasing as each SIW contacts ground and with the PIW slowing down, the intensity of the PIW decreases with each subsequent SIW. For the 5 mm gap, the maximum electron density in the tube decreases from 1 × 1014 cm−3 above the first hole to 3 × 1010 cm−3 above the last hole. This decrease in electron density inside the tube is less significant for the 15 mm gap where the density decreases from 5 × 10¹² at the first hole to 4 × 1012 cm−3 at the last hole. The decrease in intensity of the PIW translates to decrease in maximum electron density with each successive SIW. For the 5 mm gap, the maximum electron density in the SIW decreases from 2 × 1014 cm−3 at the first hole to 4 × 1013 cm−3 at the last hole.
The electrostatic interaction between SIWs decreases when the ground plane is closer because the vertical electric field is larger. However, the decrease in intensity of successive SIWs also intensifies with smaller gaps, implying that there is a maximum number of holes that will support SIWs for a given gap and voltage.
With a tube-to-target gap of 10 mm, the maximum electron density in the first SIW (1 × 1013 cm−3) is higher that than in the following SIWs, all of which have approximately the same maximum electron density (2 × 1012 cm−3). The first SIW reaches the target as the second SIW emerges from the hole, which reduces the electrostatic interaction between the SIWs and may improve the uniformity of the multi-jet treating surfaces. For the computational conditions, between gaps of 10–15 mm, electrostatic interactions between the SIWs intensify to the point of preventing propagation of SIWs from adjacent holes.
When the gap increases to 20 mm, none of the SIWs reach the target—the vertical electric field is smaller and the electrostatic interaction between SIWs is greater. The electrostatic interaction increases due to the relative timing of the SIWs. With the vertical electric field being smaller, the first SIW propagates only ∼1 mm outside the hole by the time the second SIW begins to form. The electrostatic interaction between the SIWs can be reduced by increasing the spacing between the holes. Computational experiments confirmed that for a 20 mm gap, increasing the spacing of holes to 10 mm reduced the electrostatic interactions. However, increasing the likelihood for all SIWs reaching the ground plane is best accomplished by decreasing the tube-to-ground plane gap. Having said that, the computed multi-jet performance as a function of tube-to-target gap suggests that there is an optimum gap for a given voltage, gas flow rate, hole diameter and spacing. Increasing the gap decreases perturbations in potential that occurs when SIWs contact the ground plane that affect subsequent SIWs, however the magnitude of perturbations are in turn functions of these operational parameters. These interactions are expected to be less severe when treating a dielectric surface, where the impact of the SIW contacting the surface is limited by the charging of the surface.
5. Concluding remarks
A multi-jet, a device that produces an array of APPJs from a single initial IW was investigated through experiments and modeling. The design objectives of this device include providing large-area, relatively uniform plasma treatment of materials and tissues. Critical design parameters were investigated with this objective in mind. There are likely two limits to the total number of SIWs that can be produced First, the power supply has a finite capacitance which limits the total charge that can be transferred per pulse. If the total charge transfer through the conductive channels of the SIWs exceeds the capacitive limit of the power supply, the applied voltage will decrease. The result is that propagation of the PIW and SIWs may stall, and new SIWs may not be launched. Second, between the powered electrode and the fronts of the PIW and SIW, there is a finite electric field and so there is a decrease in the electric potential at the fronts of these waves. As the length of the tube and the number of SIWs increase, the electric field at the front of the PIW may be insufficient for further propagation or launching of new SIWs.
The most important parameter in device performance is the polarity of the voltage pulse which determines the nature of the breakdown and IW dynamics. A positive polarity pulse provides more electric field enhancement at the front of the IW, but is more sensitive to radiation transport including ionization of impurities. Propagation of the positive SIWs rely on photoionization by photons emitted by both He2* and N2**. The excimer radiation from He2* produced in the PIW and propagating through the holes is most influential in initiating the SIWs. Photoionization resulting from emission by N2** is most influential in sustaining the SIWs. As a result, the SIWs reach the grounded target with a positive polarity while not reaching the target for the same conditions with a negative polarity. The positive polarity discharges may therefore be preferable for direct surface treatment.
A single hole device was used to qualitatively validate the modeling results and provide a geometry in which to interpret experimental electric field measurements. The trends for the time and spatial dynamics of the electric field and IWs generally agree between the experiment and the model, with the computed magnitude of the field being larger than experiment due to the two-dimensional geometry used in the model.
Increasing the He flow rate promotes propagation of SIWs by increasing the helium mole fraction outside of the tube and thereby reducing electron energy losses to air diffusing into the He plume. Increasing He gas flow rate enables SIW propagation with lower electric fields (e.g. larger tube-to-substrate gap). Decreasing the hole diameter results in a longer delay between passage of the PIW and the SIW emerging from each hole. This delay is primarily due to a reduced view angle for photoionization outside the tube which is required to initialize the propagation of positive SIWs.
The relative timing of SIW propagation is also critical to the interactions between the SIWs. If the spacing between holes is small, the likelihood for SIWs reaching the target is smaller. For these conditions, subsequent SIWs emerge from the hole while the previous SIW is still at a similar height. The resulting perturbation of the electric field by the conductivity and space charge of the adjacent SIWs disturb the propagation of both SIWs. The proximity of the multi-jet to the grounded target is an important control mechanism. Decreasing the tube-to-target gap increases the effects of the potential rebound when SIWs contact the ground, but decreases the likelihood of electrostatic interactions that might interfere with propagation of subsequent SIWs. A moderate distance, in this case a 10 mm gap, provides a tradeoff in which the PIW minimally fades with each subsequent SIW, while electrostatic interactions do not prevent subsequent SIWs from reaching the surface.
Acknowledgments
This work was supported by the US Department of Energy Office of Fusion Energy Science (DE-SC0001319, DE-SC0014132), the National Science Foundation (PHY-1519117) and the NSF Graduate Research Fellowship Program. X D acknowledges his grant funding from Thermofisher Scientific INEL/Région Centre Val de Loire.