Plasma Homocysteine and Polymorphisms of Genes Involved in Folate Metabolism Correlate with DNMT1 Gene Methylation Levels


Abstract
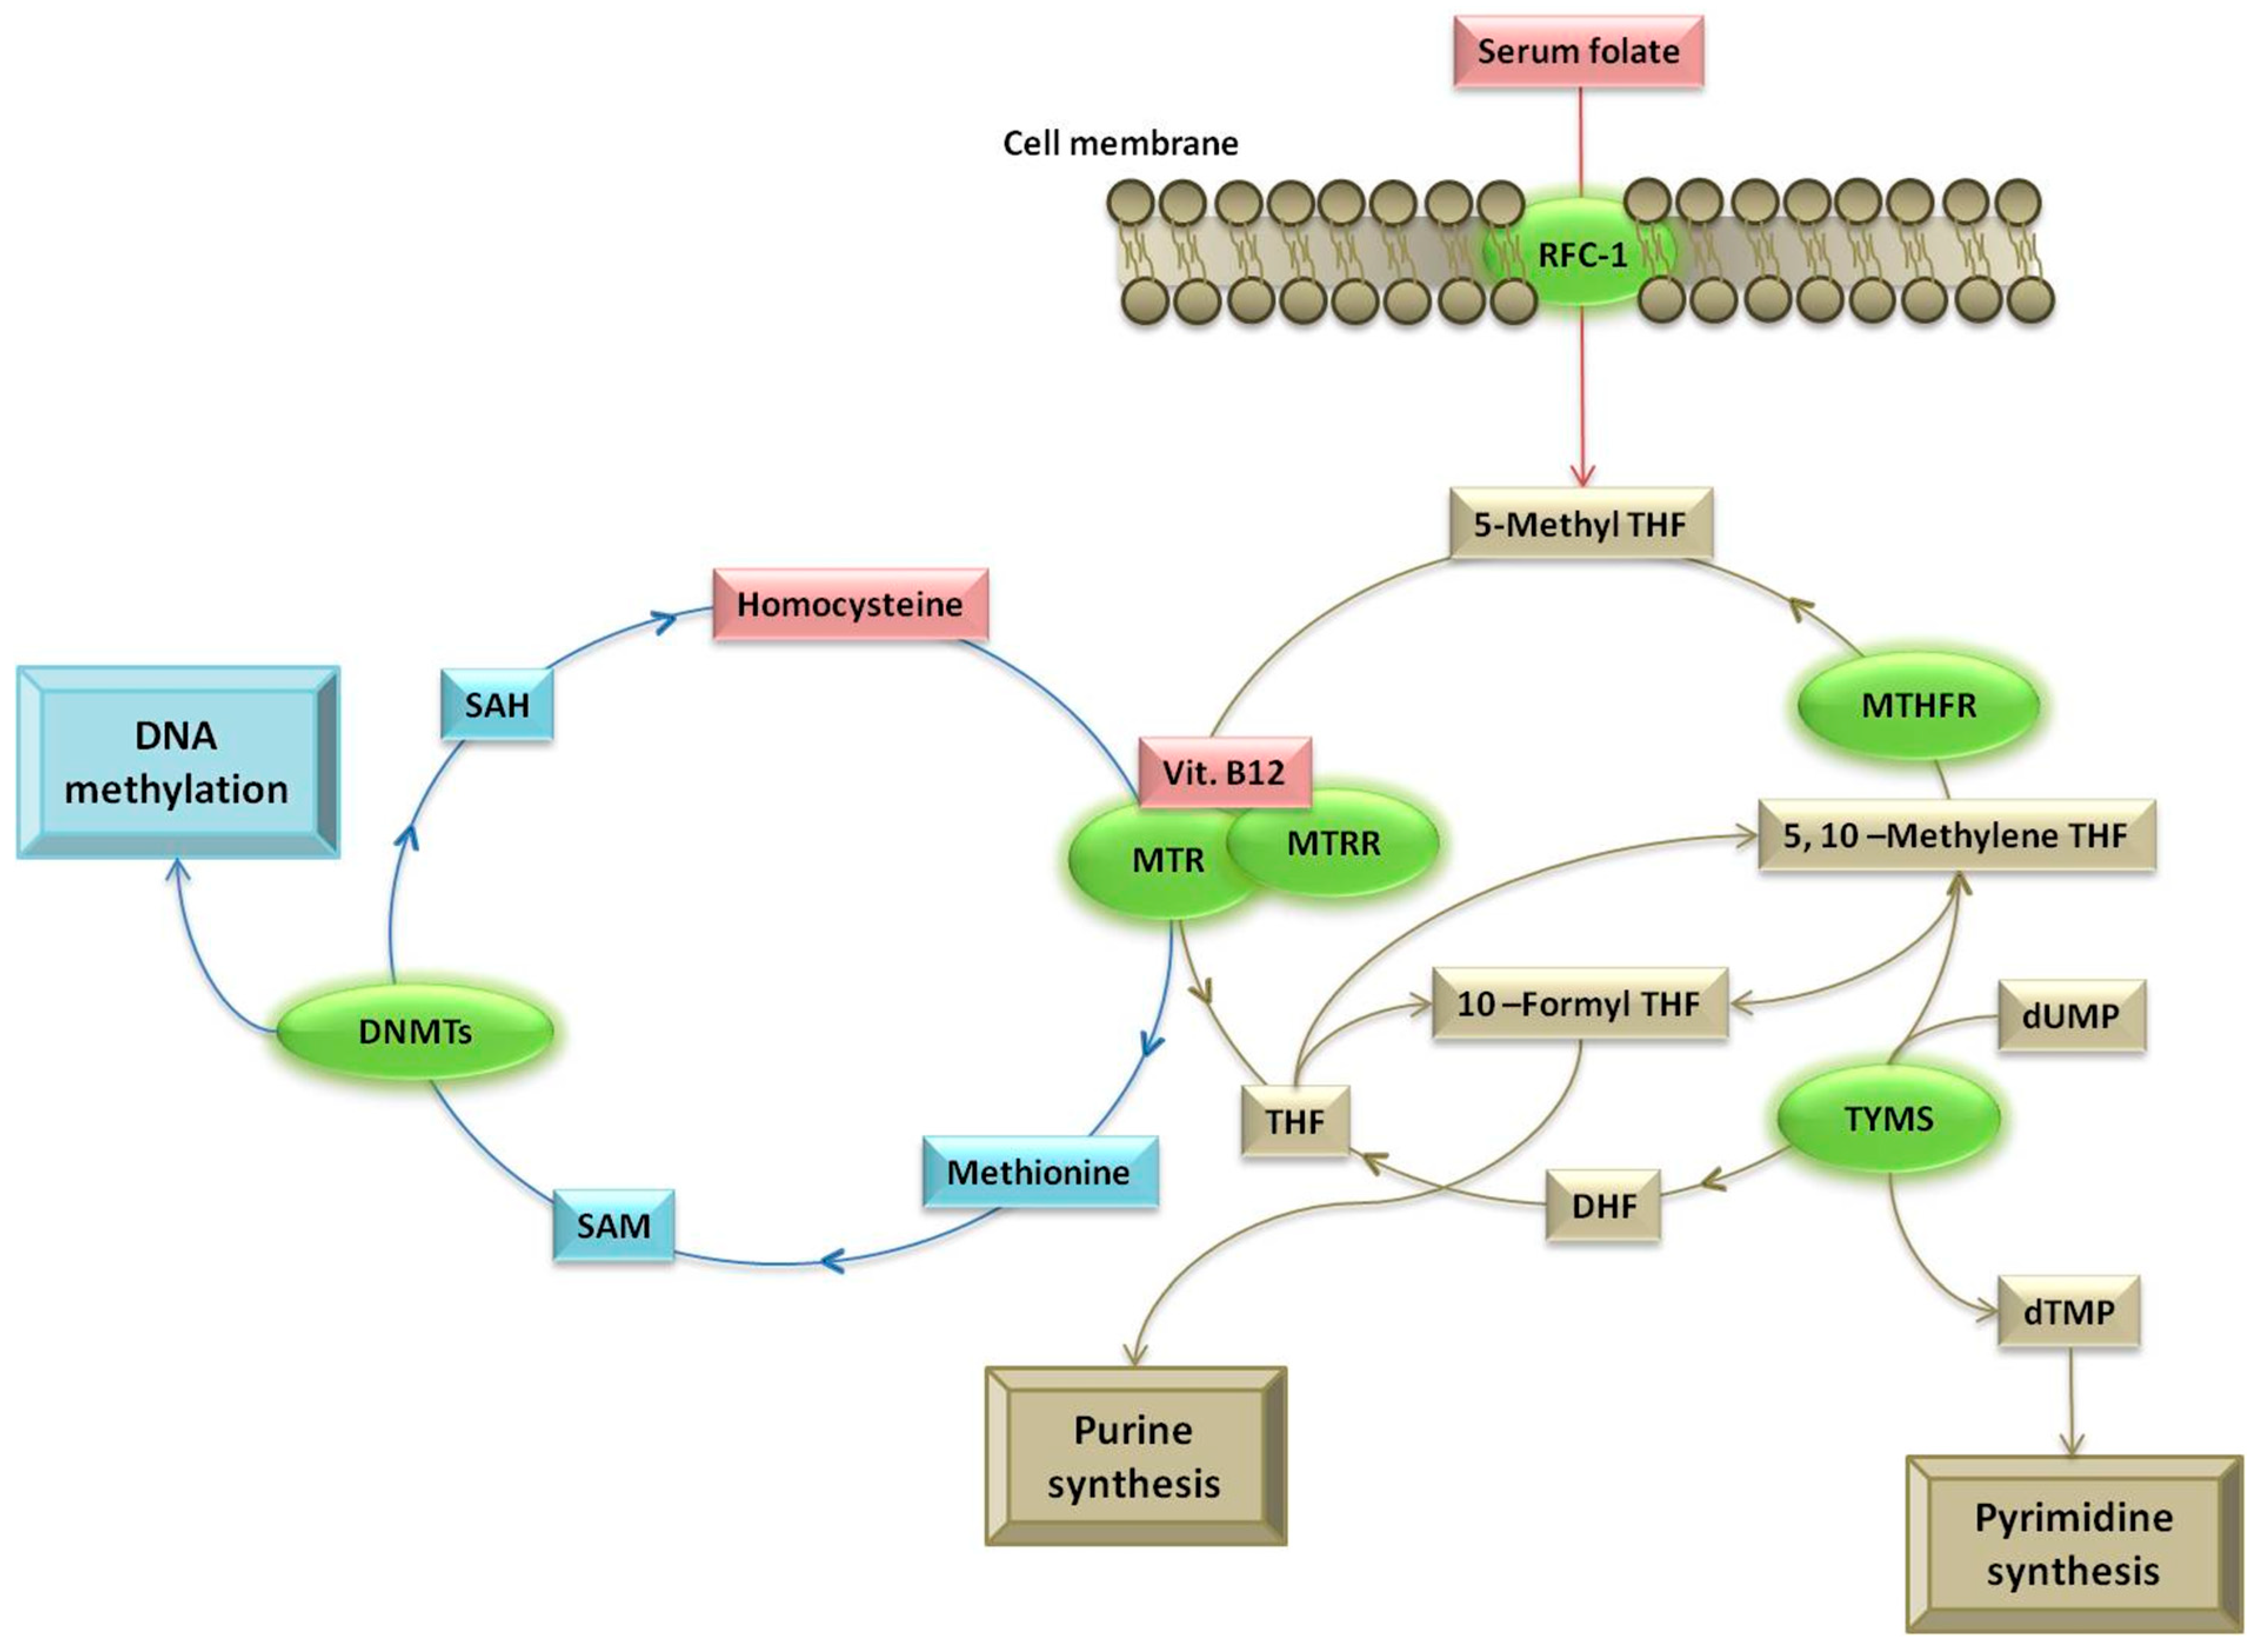
:1. Introduction
2. Results
2.1. Distribution of the Investigated Variables in the Study Population
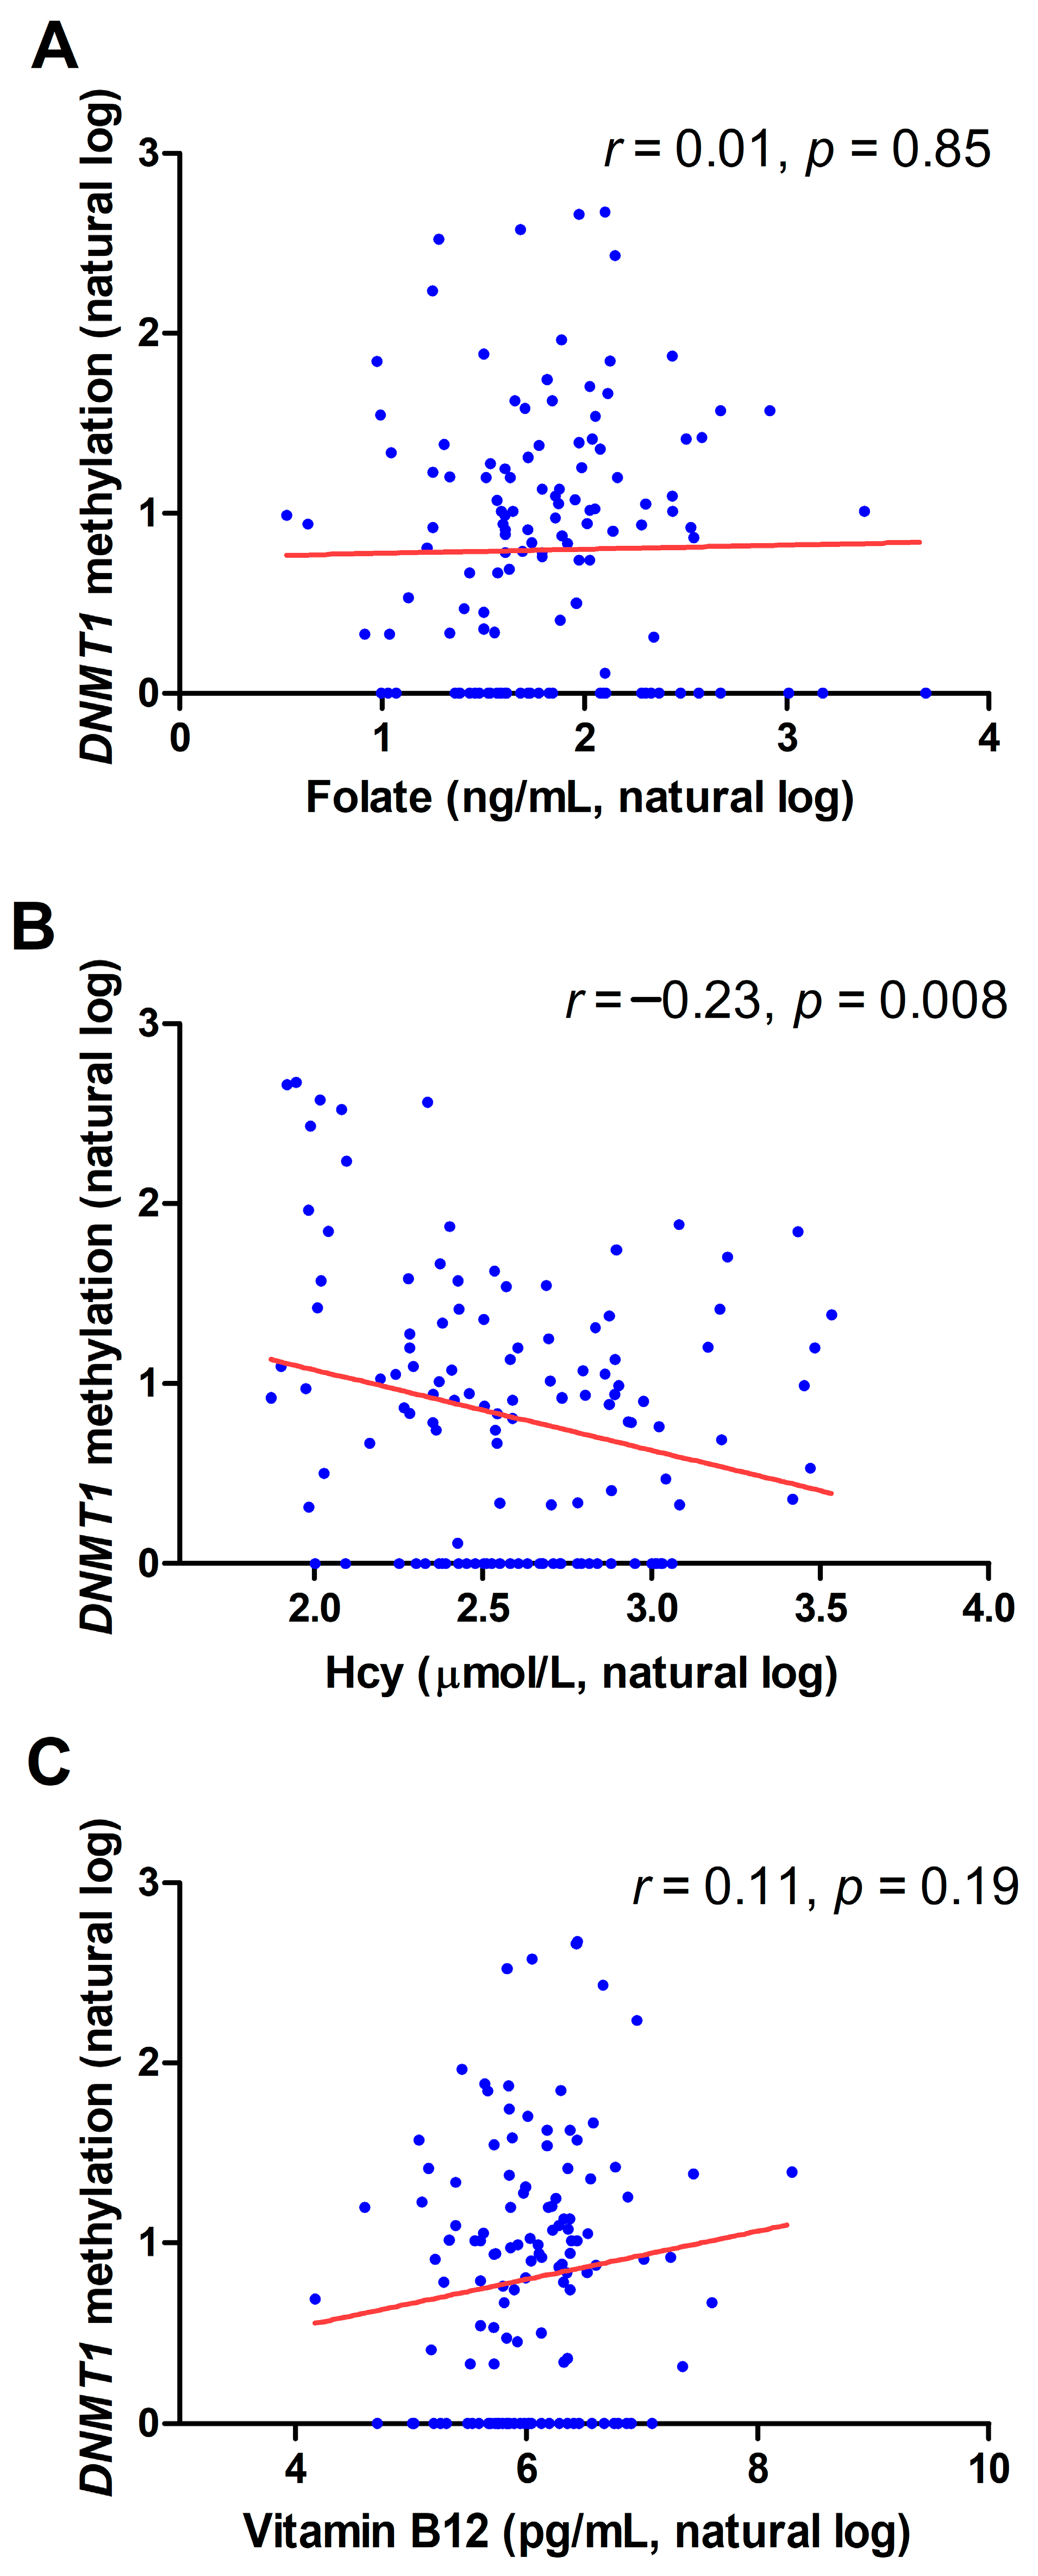
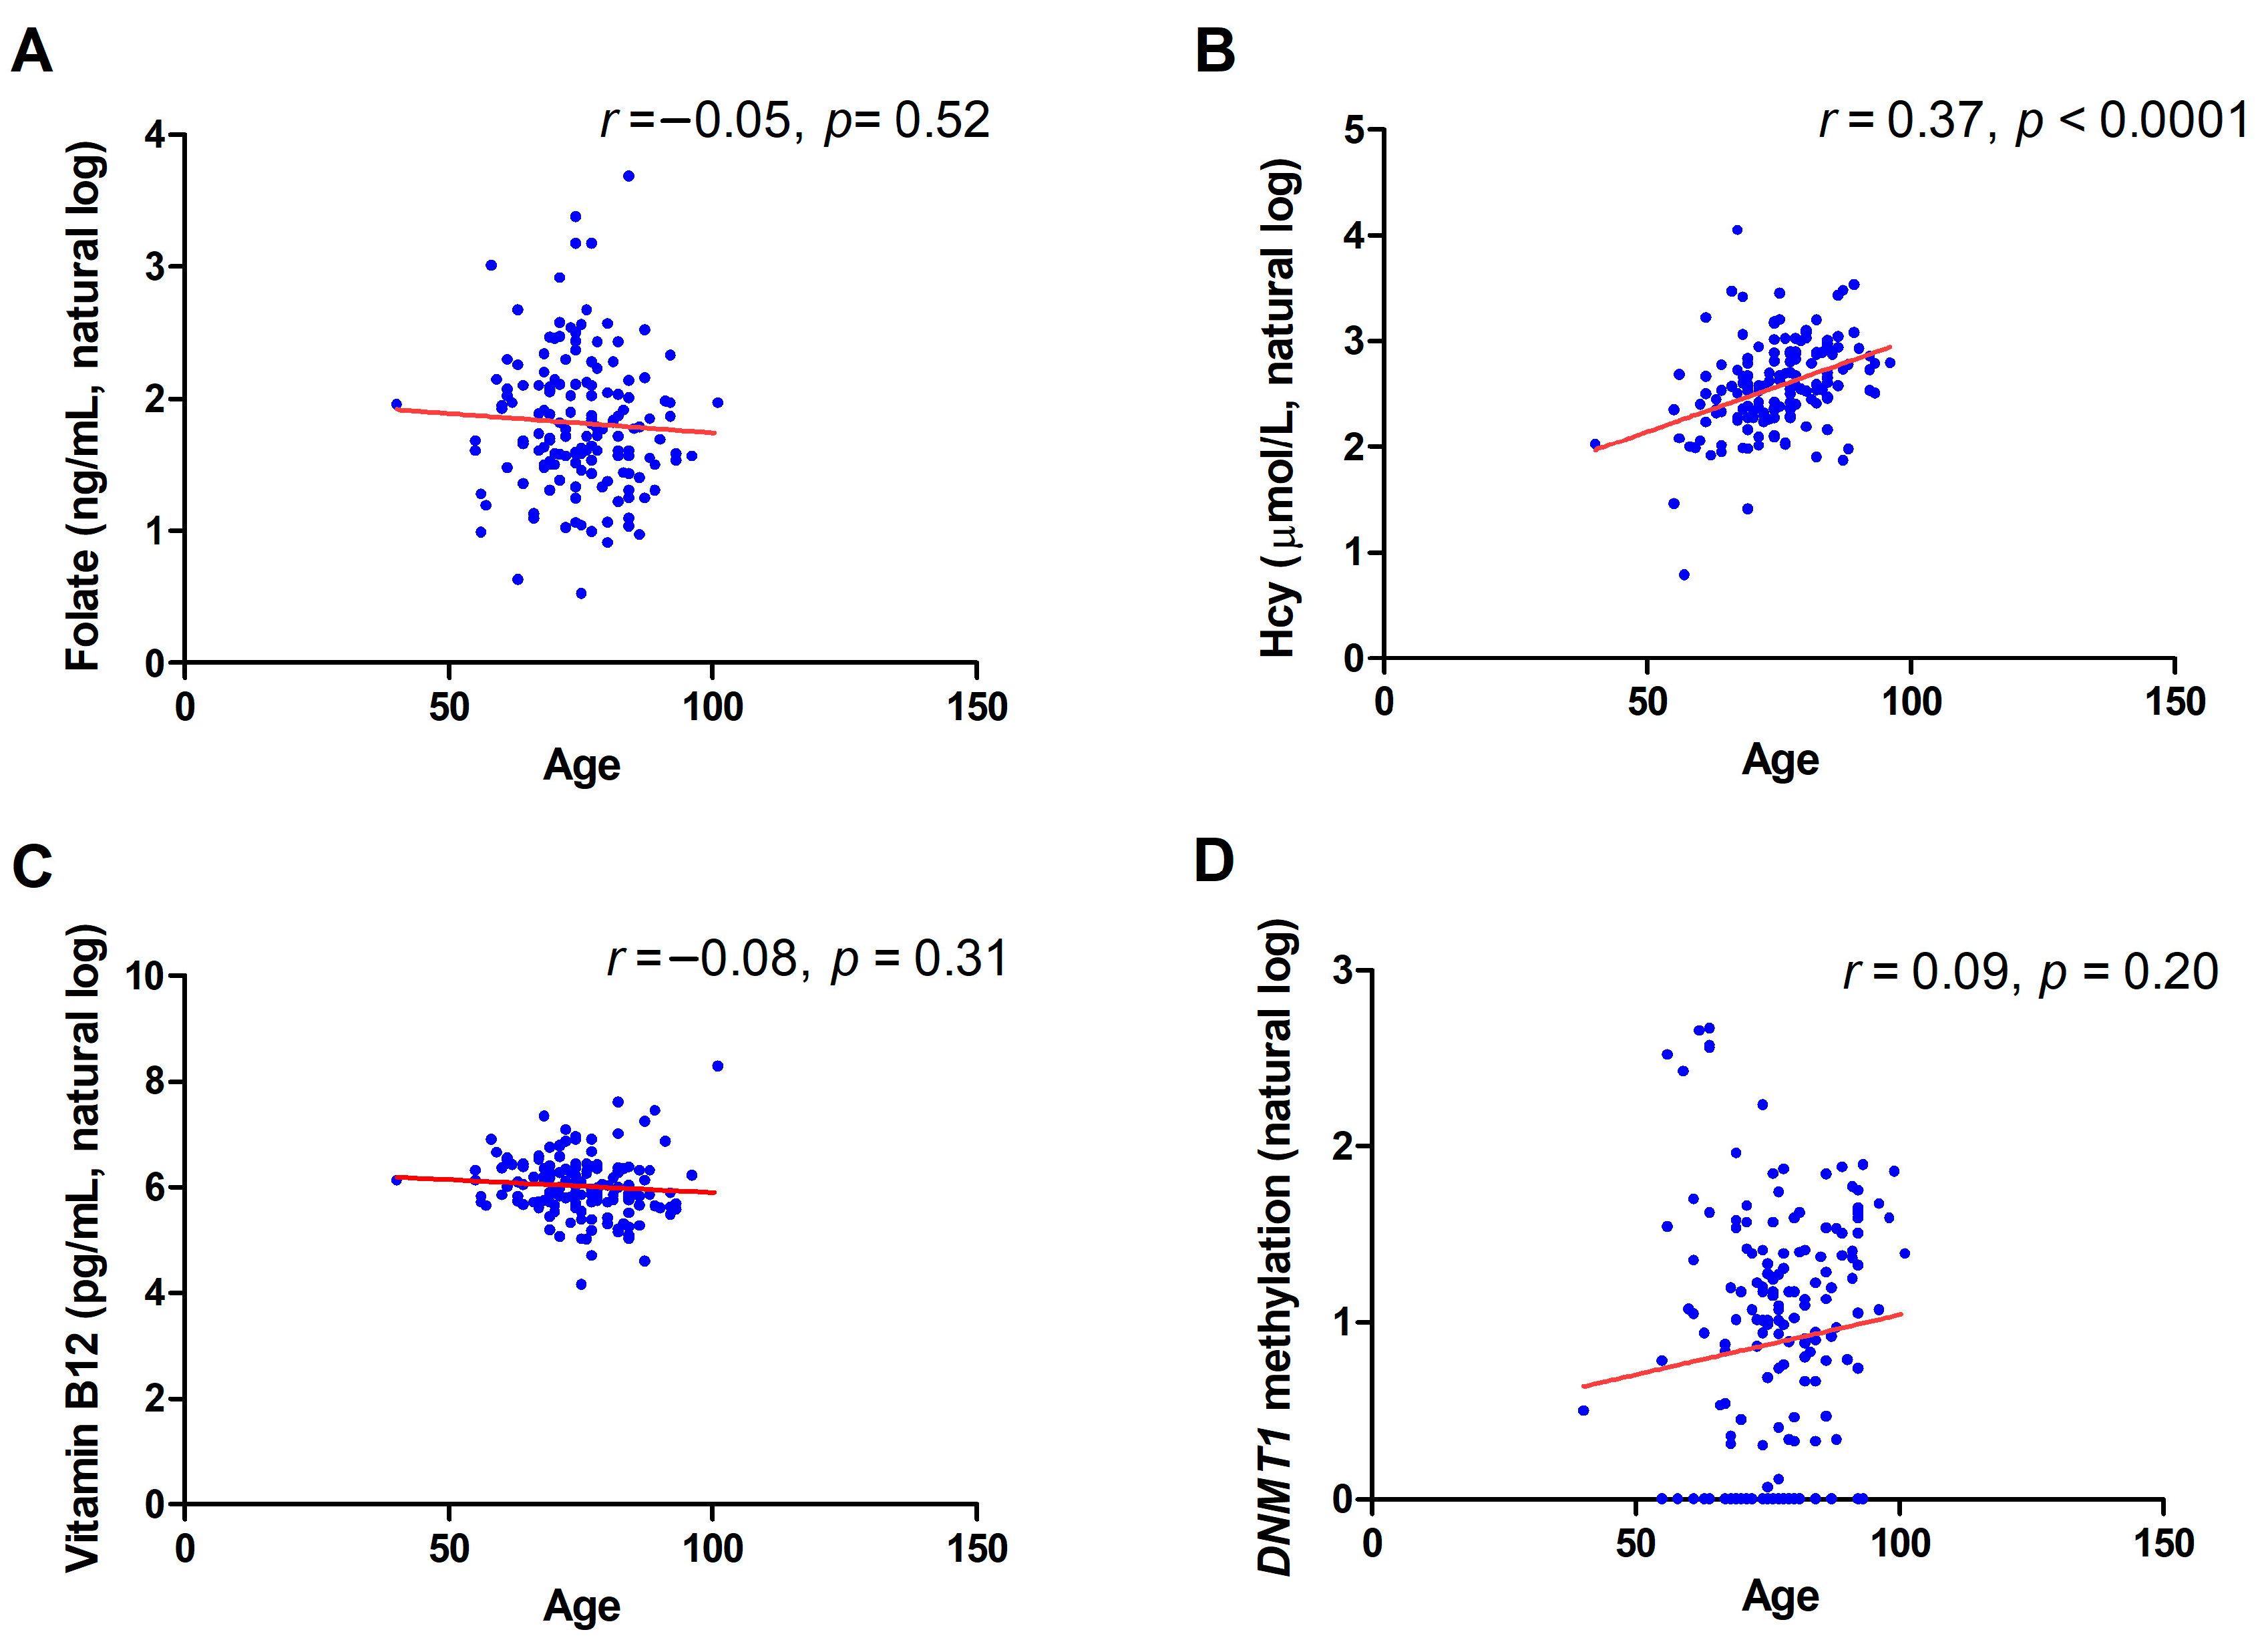
2.2. Correlation between DNMT1 Methylation and Biochemical Variables
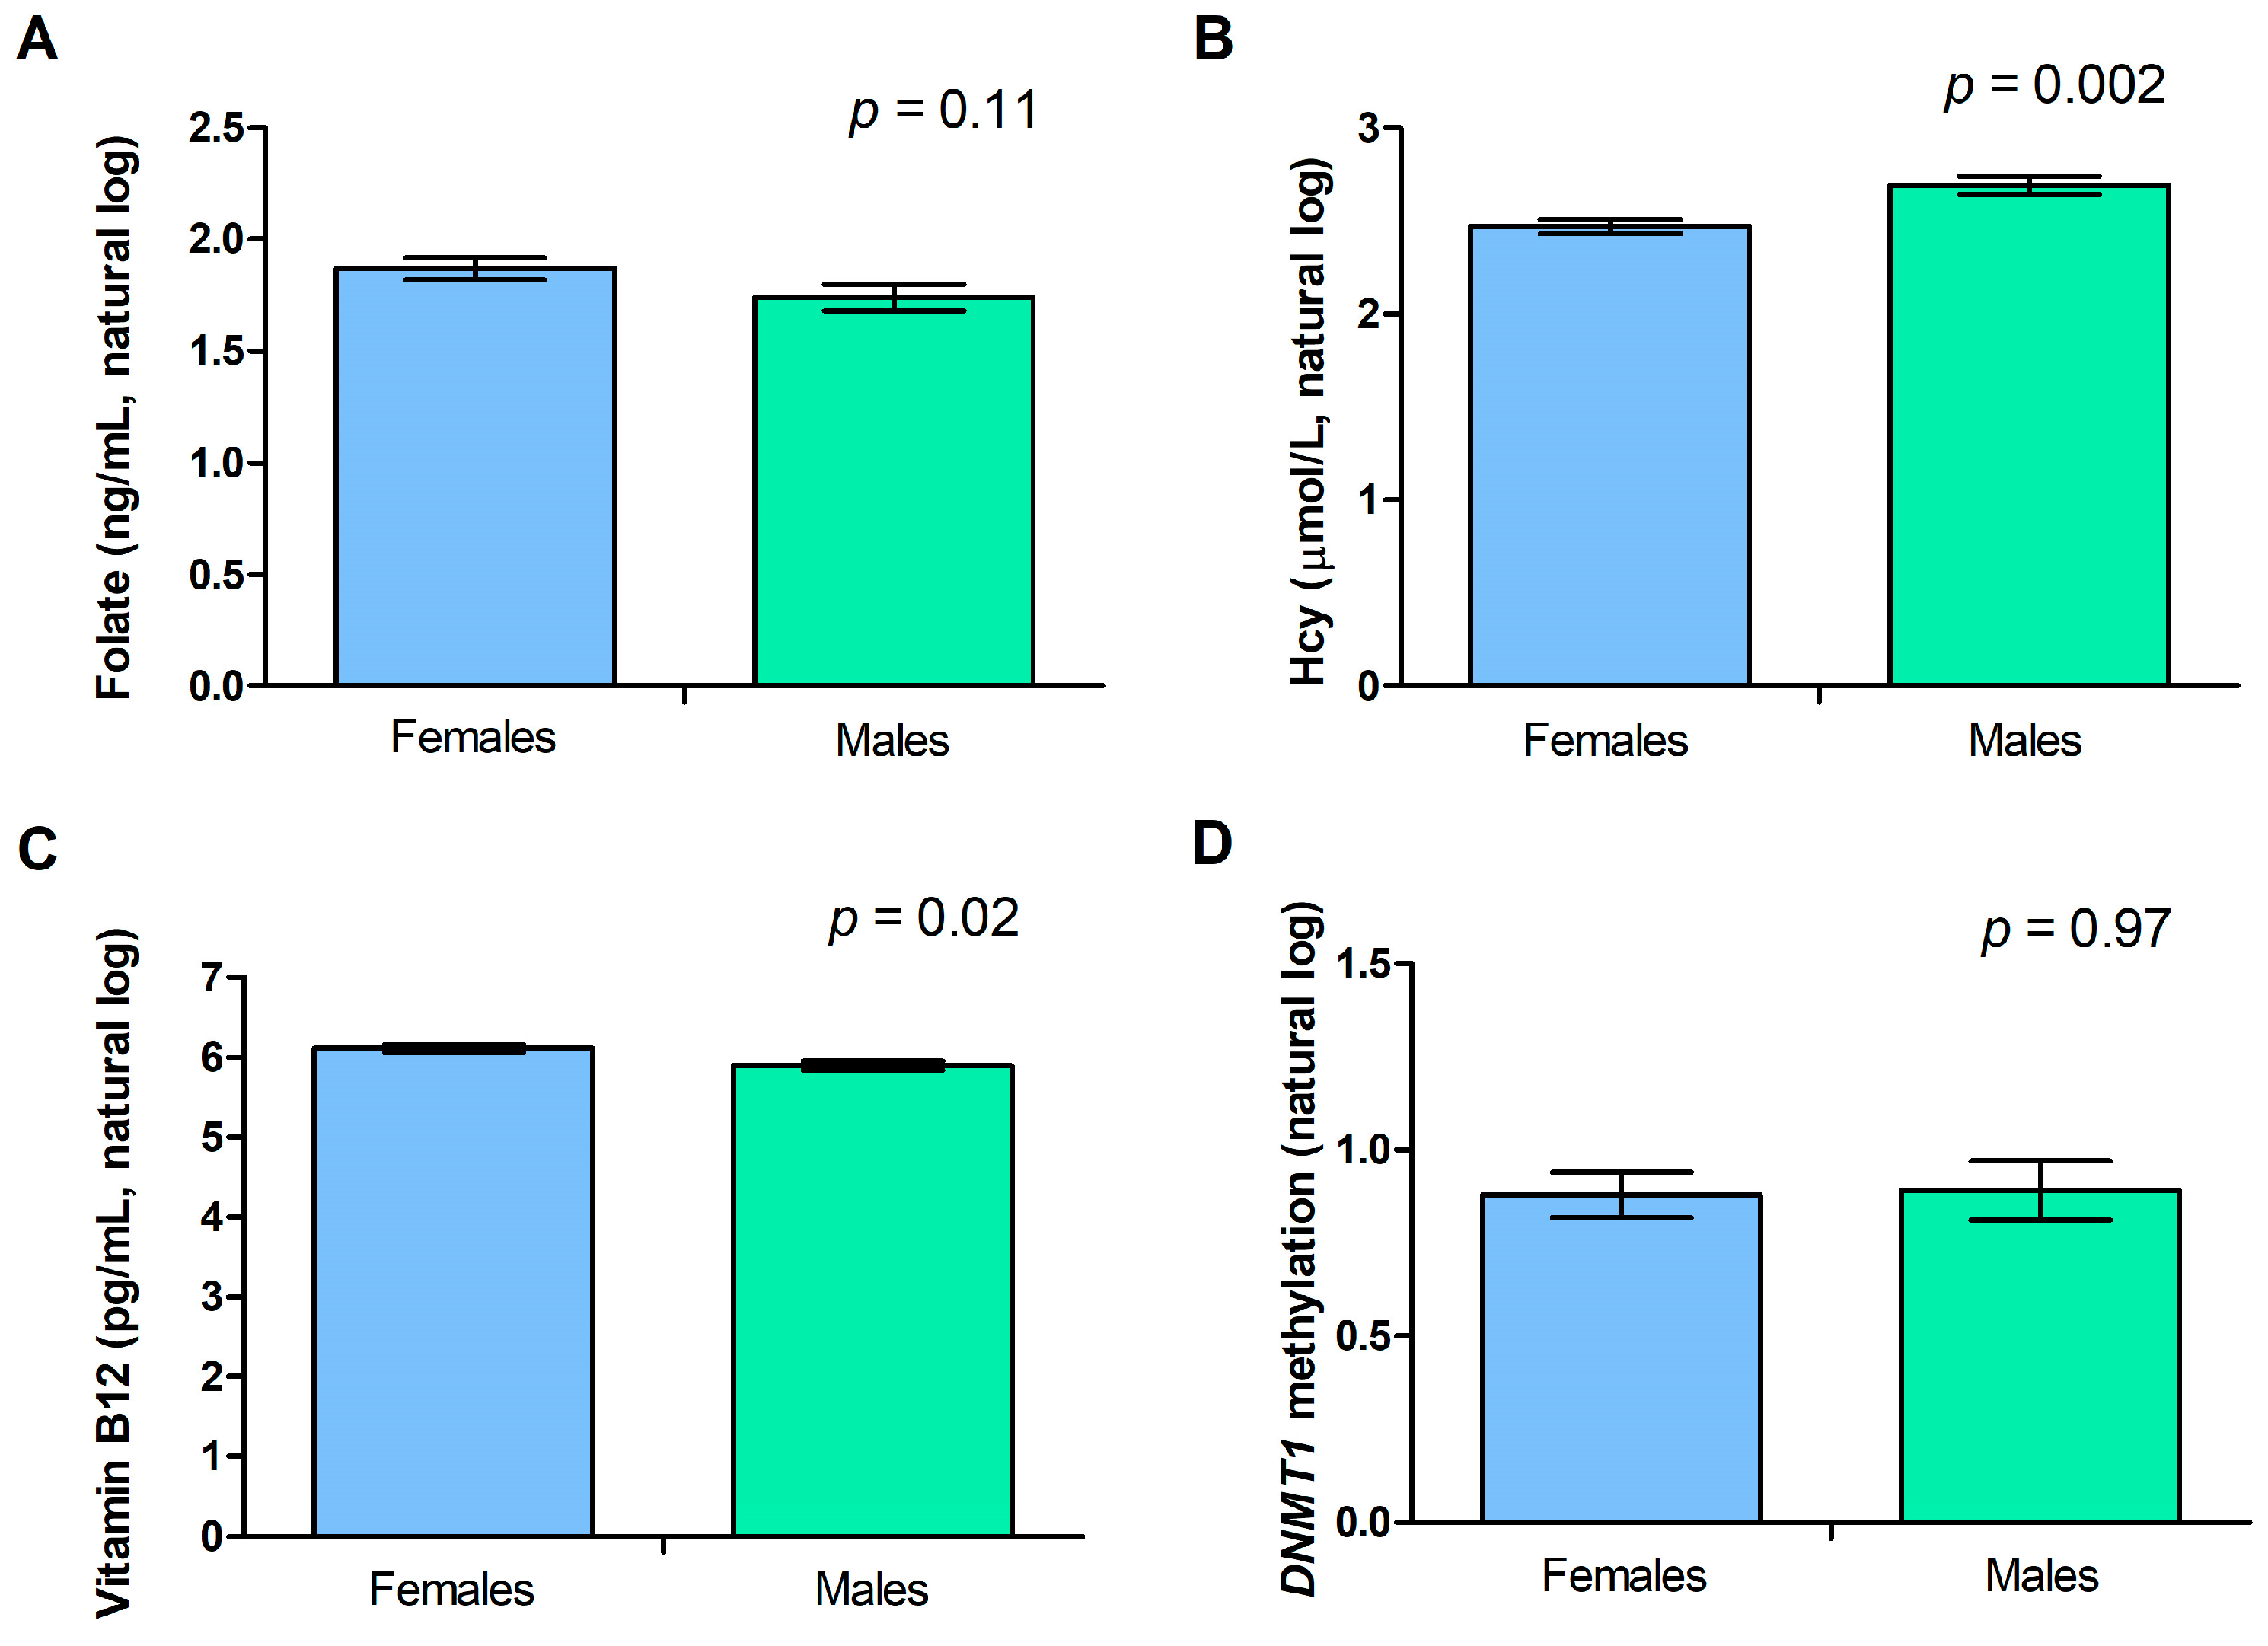
2.3. Gender and Age Effect on DNMT1 Methylation Levels and Biochemical Variables
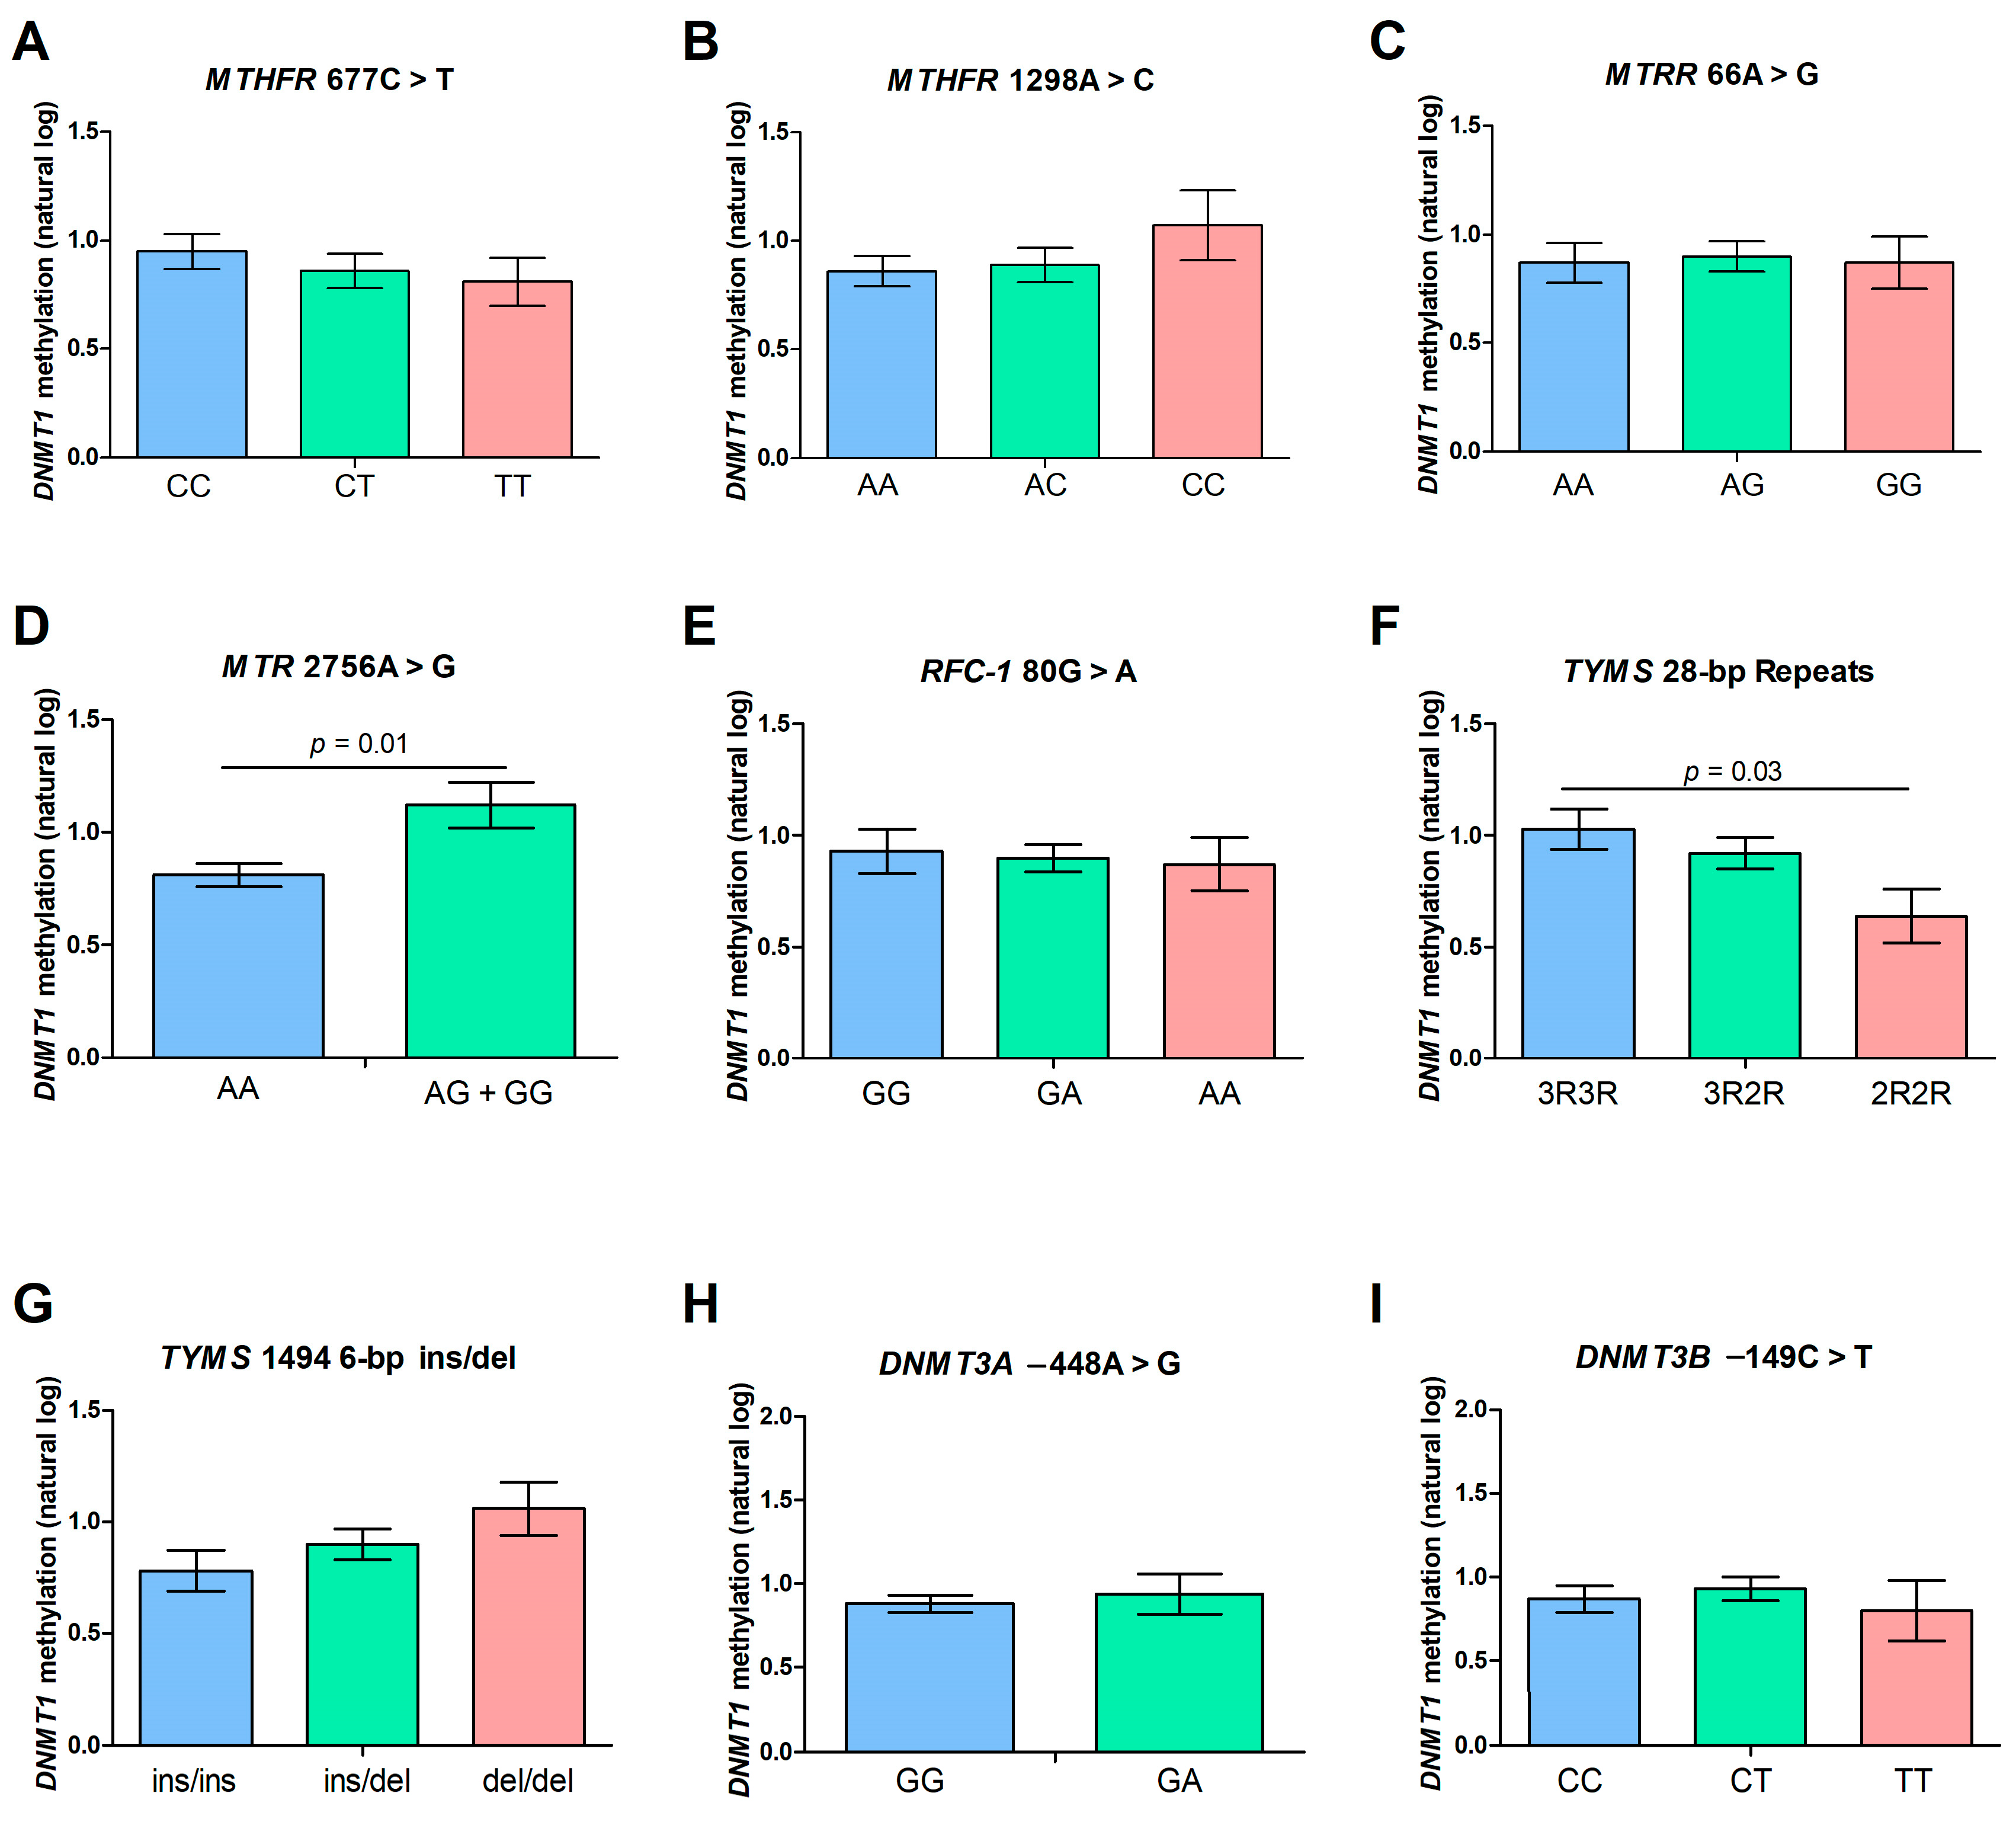
2.4. DNMT1 Methylation Levels and Polymorphisms of the Folate Pathway Genes
3. Discussion
4. Materials and Methods
4.1. Study Population
4.2. Collection of DNA Samples
4.3. Biochemical Analyses
4.4. Genotyping for Common Polymorphisms in Genes of the Folate Metabolic Pathway
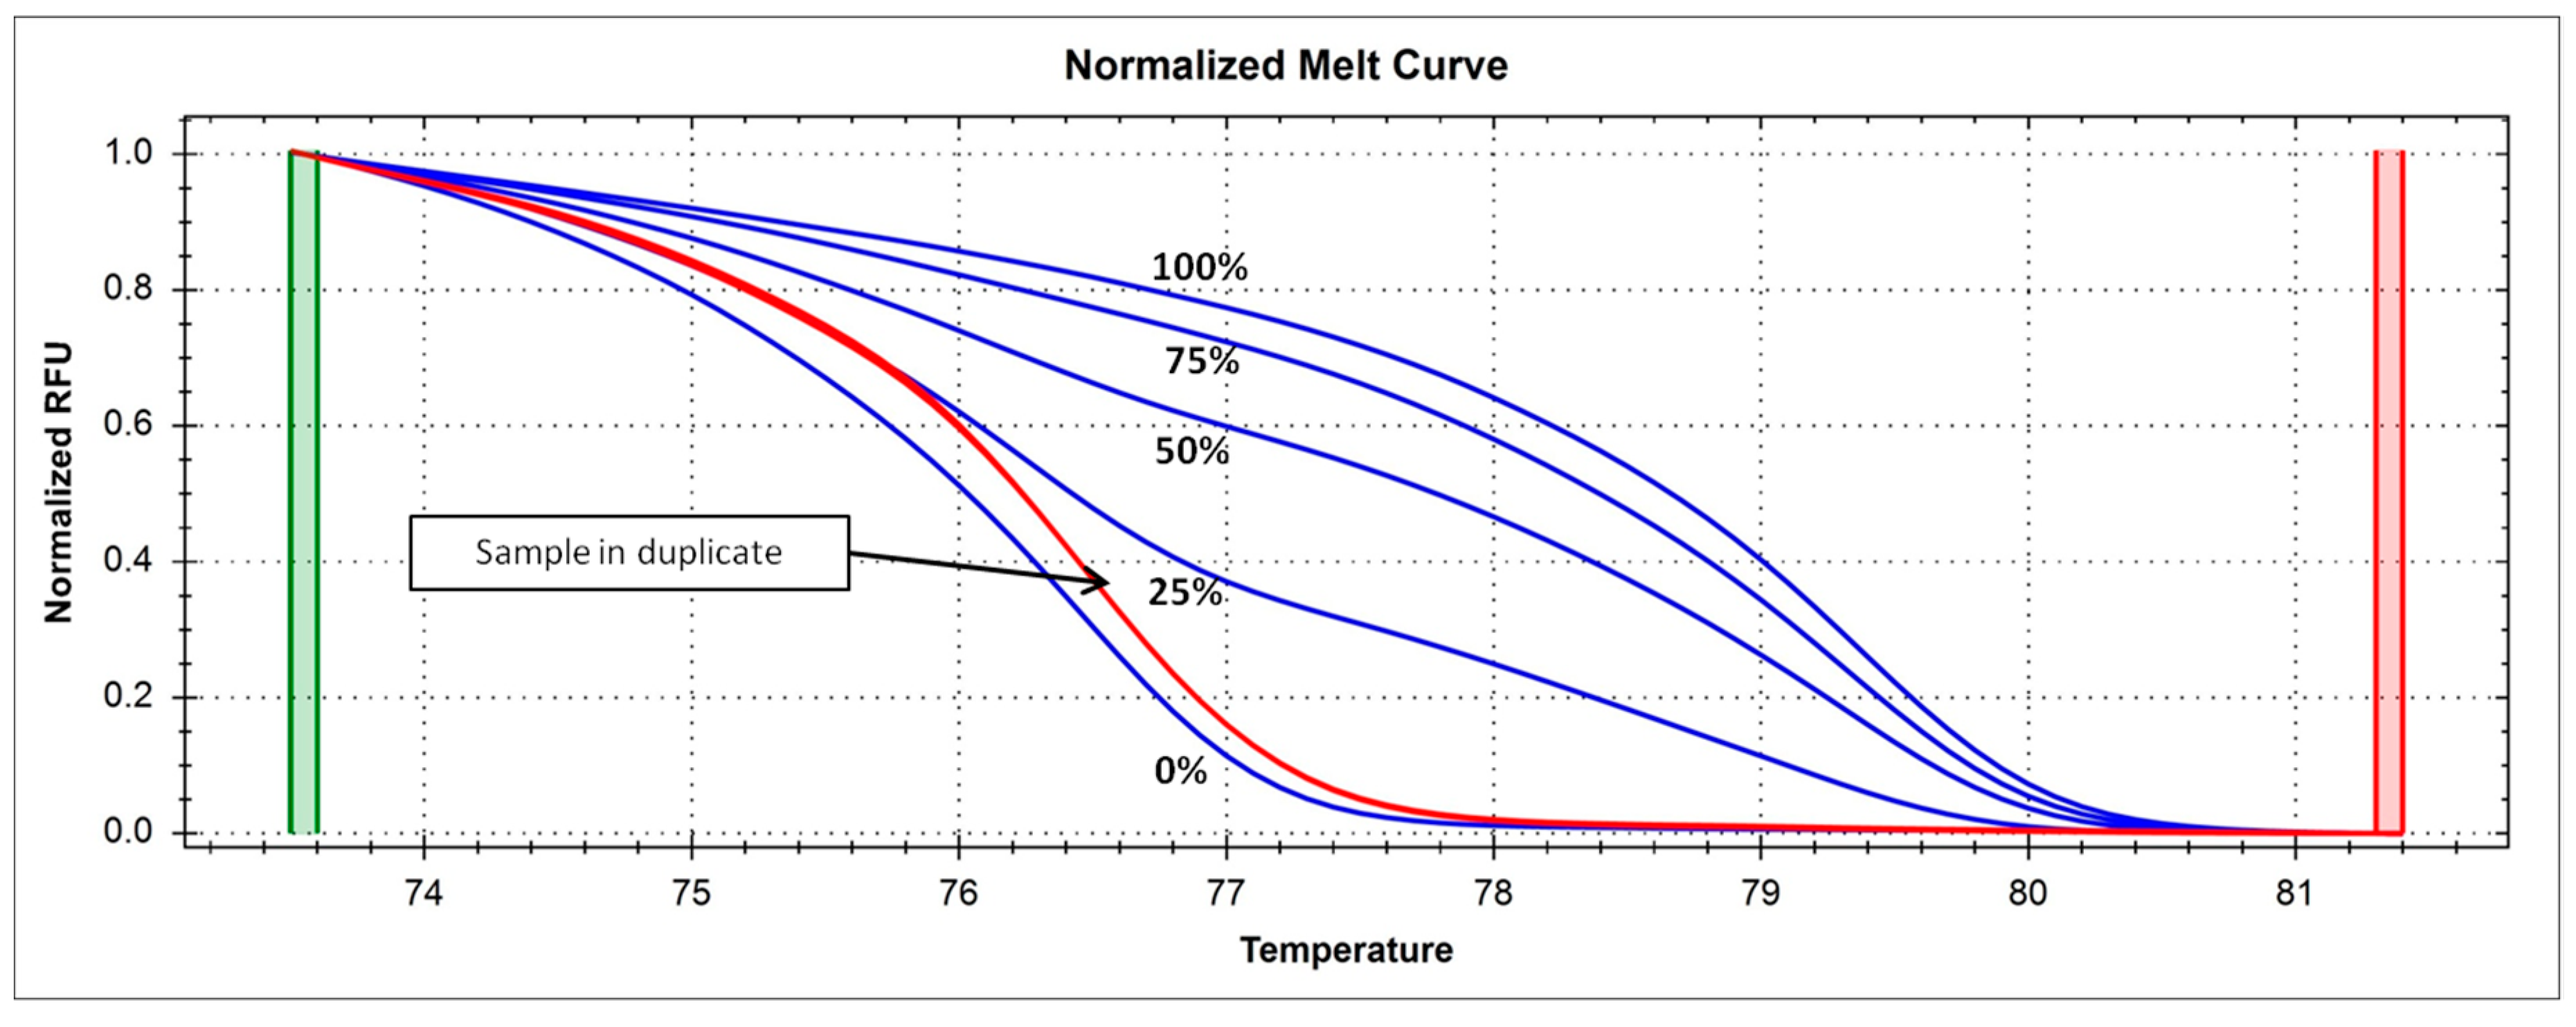
4.5. Analysis of DNMT1 Methylation Levels
4.6. Statistical Analyses
Author Contributions
Funding
Acknowledgments
Conflicts of Interest
References
- Morgan, A.E.; Davies, T.J.; Mc Auley, M.T. The role of DNA methylation in ageing and cancer. Proc. Nutr. Soc. 2018, 77, 412–422. [Google Scholar] [CrossRef]
- Moore, L.D.; Le, T.; Fan, G. DNA methylation and its basic function. Neuropsychopharmacology 2013, 38, 23–38. [Google Scholar] [CrossRef] [PubMed] [Green Version]
- Lyko, F. The DNA methyltransferase family: A versatile toolkit for epigenetic regulation. Nat. Rev. Genet. 2018, 19, 81–92. [Google Scholar] [CrossRef] [PubMed]
- Coppedè, F. The genetics of folate metabolism and maternal risk of birth of a child with Down syndrome and associated congenital heart defects. Front. Genet. 2015, 6, 223. [Google Scholar] [CrossRef] [PubMed] [Green Version]
- Aslani, S.; Mahmoudi, M.; Garshasbi, M.; Jamshidi, A.R.; Karami, J.; Nicknam, M.H. Evaluation of DNMT1 gene expression profile and methylation of its promoter region in patients with ankylosing spondylitis. Clin. Rheumatol. 2016, 35, 2723–2731. [Google Scholar] [CrossRef] [PubMed]
- Huang, Y.H.; Chen, K.D.; Lo, M.H.; Cai, X.Y.; Chang, L.S.; Kuo, Y.H.; Huang, W.D.; Kuo, H.C. Decreased DNA methyltransferases expression is associated with coronary artery lesion formation in Kawasaki disease. Int. J. Med. Sci. 2019, 16, 576–582. [Google Scholar] [CrossRef] [PubMed] [Green Version]
- Zhang, P.; Su, Y.; Chen, H.; Zhao, M.; Lu, Q. Abnormal DNA methylation in skin lesions and PBMCs of patients with psoriasis vulgaris. J. Dermatol. Sci. 2010, 60, 40–42. [Google Scholar] [CrossRef] [PubMed]
- Rahmani, T.; Azad, M.; Chahardouli, B.; Nasiri, H.; Vatanmakanian, M.; Kaviani, S. Patterns of DNMT1 Promoter Methylation in Patients with Acute Lymphoblastic Leukemia. Int. J. Hematol. Oncol. Stem Cell Res. 2017, 11, 172–177. [Google Scholar]
- Honeywell, R.J.; Sarkisjan, D.; Kristensen, M.H.; de Klerk, D.J.; Peters, G.J. DNA methyltransferases expression in normal tissues and various human cancer cell lines, xenografts and tumors. Nucleosides Nucleotides Nucleic Acids 2018, 37, 696–708. [Google Scholar] [CrossRef] [Green Version]
- Verma, M.; Chattopadhyay, B.D.; Paul, B.N. Epigenetic regulation of DNMT1 gene in mouse model of asthma disease. Mol. Biol. Rep. 2013, 40, 2357–2368. [Google Scholar] [CrossRef]
- Zhang, W.; Xu, J. DNA methyltransferases and their roles in tumorigenesis. Biomark. Res. 2017, 5, 1. [Google Scholar] [CrossRef] [PubMed] [Green Version]
- Shin, E.; Lee, Y.; Koo, J.S. Differential expression of the epigenetic methylation-related protein DNMT1 by breast cancer molecular subtype and stromal histology. J. Transl. Med. 2016, 14, 87. [Google Scholar] [CrossRef] [PubMed] [Green Version]
- Jahangiri, R.; Mosaffa, F.; Emami Razavi, A.; Teimoori-Toolabi, L.; Jamialahmadi, K. Altered DNA methyltransferases promoter methylation and mRNA expression are associated with tamoxifen response in breast tumors. J. Cell. Physiol. 2018, 233, 7305–7319. [Google Scholar] [CrossRef] [PubMed]
- Grossi, E.; Stoccoro, A.; Tannorella, P.; Migliore, L.; Coppedè, F. Artificial Neural Networks Link One-Carbon Metabolism to Gene-Promoter Methylation in Alzheimer’s Disease. J. Alzheimers Dis. 2016, 53, 1517–1522. [Google Scholar] [CrossRef] [Green Version]
- McKay, J.A.; Groom, A.; Potter, C.; Coneyworth, L.J.; Ford, D.; Mathers, J.C.; Relton, C.L. Genetic and non-genetic influences during pregnancy on infant global and site specific DNA methylation: Role for folate gene variants and vitamin B12. PLoS ONE 2012, 7, e33290. [Google Scholar] [CrossRef]
- Haggarty, P.; Hoad, G.; Horgan, G.W.; Campbell, D.M. DNA methyltransferase candidate polymorphisms; imprinting methylation, and birth outcome. PLoS ONE 2013, 8, e68896. [Google Scholar] [CrossRef] [Green Version]
- Coppedè, F.; Migheli, F.; Lopomo, A.; Failli, A.; Legitimo, A.; Consolini, R.; Fontanini, G.; Sensi, E.; Servadio, A.; Seccia, M.; et al. Gene promoter methylation in colorectal cancer and healthy adjacent mucosa specimens: Correlation with physiological and pathological characteristics, and with biomarkers of one-carbon metabolism. Epigenetics 2014, 9, 621–633. [Google Scholar] [CrossRef] [Green Version]
- Llanos, A.A.; Marian, C.; Brasky, T.M.; Dumitrescu, R.G.; Liu, Z.; Mason, J.B.; Makambi, K.H.; Spear, S.L.; Kallakury, B.V.; Freudenheim, J.L.; et al. Associations between genetic variation in one-carbon metabolism and LINE-1 DNA methylation in histologically normal breast tissues. Epigenetics 2015, 10, 727–735. [Google Scholar] [CrossRef]
- Coppedè, F.; Stoccoro, A.; Tannorella, P.; Gallo, R.; Nicolì, V.; Migliore, L. Association of Polymorphisms in Genes Involved in One-Carbon Metabolism with MTHFR Methylation Levels. Int. J. Mol. Sci. 2019, 20, 3754. [Google Scholar] [CrossRef] [Green Version]
- Wang, S.C.; Oelze, B.; Schumacher, A. Age-specific epigenetic drift in late-onset Alzheimer’s disease. PLoS ONE 2008, 3, e2698. [Google Scholar] [CrossRef] [Green Version]
- Lopomo, A.; Ricciardi, R.; Maestri, M.; De Rosa, A.; Melfi, F.; Lucchi, M.; Mussi, A.; Coppedè, F.; Migliore, L. Gene-Specific Methylation Analysis in Thymomas of Patients with Myasthenia Gravis. Int. J. Mol. Sci. 2016, 17, 2121. [Google Scholar] [CrossRef] [Green Version]
- Angelini, S.; Ravegnini, G.; Nannini, M.; Bermejo, J.L.; Musti, M.; Pantaleo, M.A.; Fumagalli, E.; Venturoli, N.; Palassini, E.; Consolini, N.; et al. Folate-related polymorphisms in gastrointestinal stromal tumours: Susceptibility and correlation with tumour characteristics and clinical outcome. Eur. J. Hum. Genet. 2015, 23, 817–823. [Google Scholar] [CrossRef] [Green Version]
- Mandaviya, P.R.; Stolk, L.; Heil, S.G. Homocysteine and DNA methylation: A review of animal and human literature. Mol. Genet. Metab. 2014, 113, 243–252. [Google Scholar] [CrossRef]
- Perła-Kaján, J.; Jakubowski, H. Dysregulation of Epigenetic Mechanisms of Gene Expression in the Pathologies of Hyperhomocysteinemia. Int. J. Mol. Sci. 2019, 20, 3140. [Google Scholar] [CrossRef] [Green Version]
- Jia, L.; Zeng, Y.; Hu, Y.; Liu, J.; Yin, C.; Niu, Y.; Wang, C.; Li, J.; Jia, Y.; Hong, J.; et al. Homocysteine impairs porcine oocyte quality via deregulation of one-carbon metabolism and hypermethylation of mitochondrial DNA. Biol. Reprod. 2019, 100, 907–916. [Google Scholar] [CrossRef]
- Xu, L.; Hao, H.; Hao, Y.; Wei, G.; Li, G.; Ma, P.; Xu, L.; Ding, N.; Ma, S.; Chen, A.F.; et al. Aberrant MFN2 transcription facilitates homocysteine-induced VSMCs proliferation via the increased binding of c-Myc to DNMT1 in atherosclerosis. J. Cell. Mol. Med. 2019, 23, 4611–4626. [Google Scholar] [CrossRef]
- Zhang, H.P.; Wang, Y.H.; Ma, S.C.; Zhang, H.; Yang, A.N.; Yang, X.L.; Zhang, M.H.; Sun, J.M.; Hao, Y.J.; Jiang, Y.D. Homocysteine inhibits endothelial progenitor cells proliferation via DNMT1-mediated hypomethylation of Cyclin A. Exp. Cell. Res. 2018, 362, 217–226. [Google Scholar] [CrossRef]
- Ebrahimi, A.; Hosseinzadeh Colagar, A.; Karimian, M. Association of Human Methionine Synthase-A2756G Transition With Prostate Cancer: A Case-Control Study and in Silico Analysis. Acta Med. Iran. 2017, 55, 297–303. [Google Scholar]
- Karimian, M.; Hosseinzadeh Colagar, A. Methionine synthase A2756G transition might be a risk factor for male infertility: Evidences from seven case-control studies. Mol. Cell. Endocrinol. 2016, 425, 1–10. [Google Scholar] [CrossRef]
- Weiner, A.S.; Boyarskikh, U.A.; Voronina, E.N.; Mishukova, O.V.; Filipenko, M.L. Methylenetetrahydrofolate reductase C677T and methionine synthase A2756G polymorphisms influence on leukocyte genomic DNA methylation level. Gene 2014, 533, 168–172. [Google Scholar] [CrossRef]
- Bleich, S.; Semmler, A.; Frieling, H.; Thumfart, L.; Muschler, M.; Hillemacher, T.; Kornhuber, J.; Kallweit, U.; Simon, M.; Linnebank, M. Genetic variants of methionine metabolism and DNA methylation. Epigenomics 2014, 6, 585–591. [Google Scholar] [CrossRef] [Green Version]
- Ni, G.; Qin, J.; Chen, Z.; Li, H.; Zhou, J.; Huang, M.; Zhou, L. Associations between genetic variation in one-carbon metabolism and leukocyte DNA methylation in valproate-treated patients with epilepsy. Clin. Nutr. 2018, 37, 308–312. [Google Scholar] [CrossRef]
- Coppedè, F.; Grossi, E.; Lopomo, A.; Spisni, R.; Buscema, M.; Migliore, L. Application of artificial neural networks to link genetic and environmental factors to DNA methylation in colorectal cancer. Epigenomics 2015, 7, 175–186. [Google Scholar] [CrossRef] [PubMed]
- Ma, L.M.; Yang, H.P.; Yang, X.W.; Ruan, L.H. Methionine synthase A2756G polymorphism influences pediatric acute lymphoblastic leukemia risk: A meta-analysis. Biosci. Rep. 2019, 39, BSR20181770. [Google Scholar] [CrossRef] [PubMed]
- Schraw, J.M.; Yiu, T.T.; Lupo, P.J.; Tsavachidis, S.; Rau, R.; Bondy, M.L.; Rabin, K.R.; Shen, L.; Scheurer, M.E. Maternal folate genes and aberrant DNA hypermethylation in pediatric acute lymphoblastic leukemia. PLoS ONE 2018, 13, e0197408. [Google Scholar] [CrossRef]
- Salimi, S.; Keshavarzi, F.; Mohammadpour-Gharehbagh, A.; Moodi, M.; Mousavi, M.; Karimian, M.; Sandoughi, M. Polymorphisms of the folate metabolizing enzymes: Association with SLE susceptibility and in silico analysis. Gene 2017, 637, 161–172. [Google Scholar] [CrossRef]
- Shao, H.B.; Ren, K.; Gao, S.L.; Zou, J.G.; Mi, Y.Y.; Zhang, L.F.; Zuo, L.; Okada, A.; Yasui, T. Human methionine synthase A2756G polymorphism increases susceptibility to prostate cancer. Aging (Albany NY) 2018, 10, 1776–1788. [Google Scholar] [CrossRef]
- Jiang-Hua, Q.; De-Chuang, J.; Zhen-Duo, L.; Shu-de, C.; Zhenzhen, L. Association of methylenetetrahydrofolate reductase and methionine synthase polymorphisms with breast cancer risk and interaction with folate, vitamin B6, and vitamin B 12 intakes. Tumour Biol. 2014, 35, 11895–11901. [Google Scholar] [CrossRef]
- Surace, A.E.A.; Hedrich, C.M. The Role of Epigenetics in Autoimmune/Inflammatory Disease. Front. Immunol. 2019, 10, 1525. [Google Scholar] [CrossRef] [Green Version]
- Lightfoot, T.J.; Skibola, C.F.; Willett, E.V.; Skibola, D.R.; Allan, J.M.; Coppede, F.; Adamson, P.J.; Morgan, G.J.; Roman, E.; Smith, M.T. Risk of non-Hodgkin lymphoma associated with polymorphisms in folate-metabolizing genes. Cancer Epidemiol. Biomark. Prev. 2005, 14, 2999–3003. [Google Scholar] [CrossRef] [Green Version]
- Weng, Y.; Zhang, J.; Tang, X.; Xie, X.; Chen, G. Thymidylate synthase polymorphisms and hematological cancer risk: A meta-analysis. Leuk. Lymphoma 2012, 53, 1345–1351. [Google Scholar] [CrossRef]
- Wang, J.; Wang, B.; Bi, J.; Di, J. The association between two polymorphisms in the TYMS gene and breast cancer risk: A meta-analysis. Breast Cancer Res. Treat. 2011, 128, 203–209. [Google Scholar] [CrossRef]
- Lopomo, A.; Ricciardi, R.; De Rosa, A.; Guida, M.; Maestri, M.; Lucchi, M.; Melfi, F.; Mussi, A.; Migliore, L.; Coppedè, F. The thymidylate synthase enhancer region (TSER) polymorphism increases the risk of thymic lymphoid hyperplasia in patients with Myasthenia Gravis. Gene 2018, 642, 376–380. [Google Scholar] [CrossRef] [PubMed]
- Rupasree, Y.; Naushad, S.M.; Rajasekhar, L.; Kutala, V.K. Epigenetic modulation of RFC1, MHC2TA and HLA-DR in systemic lupus erythematosus: Association with serological markers and six functional polymorphisms of one-carbon metabolic pathway. Gene 2014, 536, 45–52. [Google Scholar] [CrossRef]
- Childebayeva, A.; Jones, T.R.; Goodrich, J.M.; Leon-Velarde, F.; Rivera-Chira, M.; Kiyamu, M.; Brutsaert, T.D.; Dolinoy, D.C.; Bigham, A.W. LINE-1 and EPAS1 DNA methylation associations with high-altitude exposure. Epigenetics 2019, 14, 1–15. [Google Scholar] [CrossRef] [Green Version]
- Karpinski, P.; Myszka, A.; Ramsey, D.; Misiak, B.; Gil, J.; Laczmanska, I.; Grzebieniak, Z.; Sebzda, T.; Smigiel, R.; Stembalska, A.; et al. Polymorphisms in methyl-group metabolism genes and risk of sporadic colorectal cancer with relation to the CpG island methylator phenotype. Cancer Epidemiol. 2010, 34, 338–344. [Google Scholar] [CrossRef] [Green Version]
- Song, M.A.; Brasky, T.M.; Marian, C.; Weng, D.Y.; Taslim, C.; Llanos, A.A.; Dumitrescu, R.G.; Liu, Z.; Mason, J.B.; Spear, S.L.; et al. Genetic variation in one-carbon metabolism in relation to genome-wide DNA methylation in breast tissue from heathy women. Carcinogenesis 2016, 37, bgw030. [Google Scholar] [CrossRef] [Green Version]
- Coppedè, F.; Tannorella, P.; Pezzini, I.; Migheli, F.; Ricci, G.; Caldarazzo lenco, E.; Piaceri, I.; Polini, A.; Nacmias, B.; Monzani, F.; et al. Folate, homocysteine, vitamin B12, and polymorphisms of genes participating in one-carbon metabolism in late-onset Alzheimer’s disease patients and healthy controls. Antioxid. Redox Signal. 2012, 17, 195–204. [Google Scholar] [CrossRef]
- Coppedè, F.; Grossi, E.; Buscema, M.; Migliore, L. Application of artificial neural networks to investigate one-carbon metabolism in Alzheimer’s disease and healthy matched individuals. PLoS ONE 2013, 8, e74012. [Google Scholar] [CrossRef]
- Tannorella, P.; Stoccoro, A.; Tognoni, G.; Bonuccelli, U.; Migliore, L.; Coppedè, F. Association study between the DNMT3A -448A > G polymorphism and risk of Alzheimer’s disease in Caucasians of Italian origin. Am. J. Neurodegener. Dis. 2016, 5, 85–93. [Google Scholar]
- Tannorella, P.; Stoccoro, A.; Tognoni, G.; Petrozzi, L.; Salluzzo, M.G.; Ragalmuto, A.; Siciliano, G.; Haslberger, A.; Bosco, P.; Bonuccelli, U.; et al. Methylation analysis of multiple genes in blood DNA of Alzheimer’s disease and healthy individuals. Neurosci. Lett. 2015, 600, 143–147. [Google Scholar] [CrossRef]
- Migheli, F.; Stoccoro, A.; Coppedè, F.; Wan Omar, W.A.; Failli, A.; Consolini, R.; Seccia, M.; Spisni, R.; Miccoli, P.; Mathers, J.C.; et al. Comparison study of MS-HRM and pyrosequencing techniques for quantification of APC and CDKN2A gene methylation. PLoS ONE 2013, 8, e52501. [Google Scholar] [CrossRef] [PubMed]


| Number of Subjects | Age (Years) Mean ± SD | Gender | Folate * (ng/mL) Mean ± SD (SEM) | Hcy * (μmol/L) Mean ± SD (SEM) | Vitamin B12 * (pg/mL) Mean ± SD (SEM) | DNMT1 Methylation (%) Mean ± SD (SEM) |
|---|---|---|---|---|---|---|
| Total: N = 215 | 76.4 ± 9.6 | M: 85 F: 130 | - | - | - | 2.2 ± 2.5 (SEM = 0.2) |
| Subgroup with biochemical data: N = 158 | 74.9 ± 9.3 | M: 69 F: 89 | 7.16 ± 4.86 (SEM = 0.39) | 14.36 ± 7.1 (SEM = 0.56) | 495.6 ± 404.3 (SEM = 32.3) | 2.1 ± 2.7 (SEM = 0.2) |
| Polymorphism | Genotypes: N of Subjects (%) |
|---|---|
| MTHFR 677C > T | CC: 77 (35.8%), CT: 94 (43.7%), TT: 44 (20.5%) |
| MTHFR 1298A > C | AA: 101 (47%), AC: 92 (42.8%), CC: 22 (10.2%) |
| MTRR 66A > G | AA: 63 (29.3%), AG: 116 (54.0%), GG: 36 (16.7%) |
| MTR 2756A > G | AA: 164 (76.3%), AG: 48 (22.3 %), GG: 3 (1.4%) |
| RFC-1 80G > A | GG: 60 (27.9%), GA: 119 (55.3%), AA: 36 (16.8%) |
| TYMS 28-bp Repeats | 3R3R: 60 (27.9%), 3R2R: 116 (53.9%), 2R2R: 39 (18.2%) |
| TYMS 1494 6-bp indel | in/in: 67 (31.2%), in/del: 114 (53.0%), del/del: 34 (15.8%) |
| DNMT3A -448A > G | GG: 173 (80.4%), GA: 42 (19.6%), AA: 0 (0.0%) |
| DNMT3B -149C > T | CC: 89 (41.4%), CT: 107 (49.7%), TT: 19 (8.9%) |
| Primer Sequences | Ta | Amplicon Length | Region Respect to TSS | CpG Sites | Accession Number and Nucleotide Position |
|---|---|---|---|---|---|
| F: 5′–GGTATCGTGTTTATTTTTTAGTAA–3′ R: 5′–ACGAAACCAACCATACCCAA–3′ | 52 °C | 114 bp | From −106 to +8 | 9 | NG_028016.3 41101–41215 |
© 2019 by the authors. Licensee MDPI, Basel, Switzerland. This article is an open access article distributed under the terms and conditions of the Creative Commons Attribution (CC BY) license (http://creativecommons.org/licenses/by/4.0/).
Share and Cite
Coppedè, F.; Stoccoro, A.; Tannorella, P.; Migliore, L. Plasma Homocysteine and Polymorphisms of Genes Involved in Folate Metabolism Correlate with DNMT1 Gene Methylation Levels. Metabolites 2019, 9, 298. https://doi.org/10.3390/metabo9120298
Coppedè F, Stoccoro A, Tannorella P, Migliore L. Plasma Homocysteine and Polymorphisms of Genes Involved in Folate Metabolism Correlate with DNMT1 Gene Methylation Levels. Metabolites. 2019; 9(12):298. https://doi.org/10.3390/metabo9120298
Chicago/Turabian StyleCoppedè, Fabio, Andrea Stoccoro, Pierpaola Tannorella, and Lucia Migliore. 2019. "Plasma Homocysteine and Polymorphisms of Genes Involved in Folate Metabolism Correlate with DNMT1 Gene Methylation Levels" Metabolites 9, no. 12: 298. https://doi.org/10.3390/metabo9120298