
Abstract
With the increasing advance of computer and information technologies, numerous research papers have been published online as well as offline, and as new research fields have been continuingly created, users have a lot of trouble in finding and categorizing their interesting research papers. In order to overcome the limitations, this paper proposes a research paper classification system that can cluster research papers into the meaningful class in which papers are very likely to have similar subjects. The proposed system extracts representative keywords from the abstracts of each paper and topics by Latent Dirichlet allocation (LDA) scheme. Then, the K-means clustering algorithm is applied to classify the whole papers into research papers with similar subjects, based on the Term frequency-inverse document frequency (TF-IDF) values of each paper.
Introduction
Numerous research papers have been published online as well as offline with the increasing advance of computer and information technologies, which makes it difficult for users to search and categorize their interesting research papers for a specific subject [1]. Therefore, it is desired that these huge numbers of research papers are systematically classified with similar subjects so that users can find their interesting research papers easily and conveniently. Typically, finding research papers on specific topics or subjects is time consuming activity. For example, researchers are usually spending a long time on the Internet to find their interesting papers and are bored because the information they are looking for is not retrieved efficiently due to the fact that the papers are not grouped in their topics or subjects for easy and fast access.
The commonly-used analysis for the classification of a huge number of research papers is run on large-scale computing machines without any consideration on big data properties. As time goes on, it is difficult to manage and process efficiently those research papers that continue to quantitatively increase. Since the relation of the papers to be analyzed and classified is very complex, it is also difficult to catch quickly the subject of each research paper and, moreover hard to accurately classify research papers with the similar subjects in terms of contents. Therefore, there is a need to use an automated processing method for such a huge number of research papers so that they are classified fast and accurately.
The abstract is one of important parts in a research paper as it describes the gist of the paper. Typically, it is a next most part that users read after paper title. Accordingly, users tend to read firstly a paper abstract in order to catch the research direction and summary before reading contents in the body of a paper. In this regard, the core words of research papers should be written in the abstract concisely and interestingly. Therefore, in this paper, we use the abstract data of research papers as a clue to classify similar papers fast and correct.
To classify a huge number of papers into papers with similar subjects, we propose the paper classification system based on term frequency-inverse document frequency (TF-IDF) [2,3,4] and Latent Dirichlet allocation (LDA) [5] schemes. The proposed system firstly constructs a representative keyword dictionary with the keywords that user inputs, and with the topics extracted by the LDA. Secondly, it uses the TF-IDF scheme to extract subject words from the abstract of papers based on the keyword dictionary. Then, the K-means clustering algorithm [6,7,8] is applied to classify the papers with similar subjects, based on the TF-IDF values of each paper.
To extract subject words from a set of massive papers efficiently, in this paper, we use the Hadoop Distributed File Systems (HDFS) [9, 10] that can process big data rapidly and stably with high scalability. We also use the map-reduce programming model [11, 12] to calculate the TF-IDF value from the abstract of each paper. Moreover, in order to demonstrate the validation and applicability of the proposed system, this paper evaluates the performance of the proposed system, based on actual paper data. As the experimental data of performance evaluation, we use the titles and abstracts of the papers published on Future Generation Compute Systems (FGCS) journal [13] from 1984 to 2017. The experimental results indicate that the proposed system can well classify the whole papers with papers with similar subjects according to the relationship of the keywords extracted from the abstracts of papers.
The remainder of the paper is organized as follows: In “Related work” section, we provide related work on research paper classification. “System flow diagram” section presents a system flow diagram for our research paper classification system. “Paper classification system” section explains the paper classification system based on TF-IDF and LDA schemes in detail. In “Experiments” section, we carry out experiments to evaluate the performance of the proposed paper classification system. In particular, Elbow scheme is applied to determine the optimal number of clusters in the K-means clustering algorithm, and Silhouette schemes are introduced to show the validation of clustering results. Finally, “Conclusion” section concludes the paper.
Related work
This section briefly reviews the literature on paper classification methods related on the research subject of this paper.
Document classification has direct relation with the paper classification of this paper. It is a problem that assigns a document to one or more predefined classes according to a specific criterion or contents. The representative application areas of document classification are follows as:
-
News article classification: The news articles are generally massive, because they are tremendously issued in daily or hourly. There have been lots of works for automatic news article classification [14].
-
Opinion mining: It is very important to analyze the information on opinions, sentiment, and subjectivity in documents with a specific topic [15]. Analysis results can be applied to various areas such as website evaluation, the review of online news articles, opinion in blog or SNS, etc. [16].
-
Email classification and spam filtering: Its area can be considered as a document classification problem not only for spam filtering, but also for classifying messages and sorting them into a specific folder [17].
A wide variety of classification techniques have been used to document classification [18]. Automatic document classification can be divided into two methods: supervised and unsupervised [19,20,21]. In the supervised classification, documents are classified on the basis of supervised learning methods. These methods generally analyze the training data (i.e., pair data of predefined input–output) and produce an inferred function which can be used for mapping other examples. On the other hand, unsupervised classification groups documents, based on similarity among documents without any predefined criterion. As automatic document classification algorithms, there have been developed various types of algorithms such as Naïve Bayes classifier, TF-IDF, Support Vector Machine (SVM), K-Nearest Neighbors (KNN), Decision Tree, and so on [22, 23].
Meanwhile, as works related on paper classification, Bravo-Alcobendas et al. [24] proposed a document clustering algorithm that extracts the characteristics of documents by Non-negative matrix factorization (NMF) and that groups documents by K-means clustering algorithm. This work mainly focuses on the reduction of high-dimensional vector formed by word counts in documents, not on a sophisticated classification in terms of a variety of subject words.
In [25], Taheriyan et al. proposed the paper classification method based on a relation graph using interrelationships among papers, such as citations, authors, common references, etc. This method has better performance as the links among papers increase. It mainly focuses on interrelationships among papers without any consideration of paper contents or subjects. Thus, the papers can be misclassified regardless of subjects.
In [26], Hanyurwimfura et al. proposed the paper classification method based on research paper’s title and common terms. In [27], Nanbo et al. proposed the paper classification method that extracts keywords from research objectives and background and that groups papers on the basis of the extracted keywords. In these works, the results achieved on using important information such as paper’s subjects, objectives, background were promising ones. However, they does not consider frequently occurring keywords in paper classification. Paper title, research objectives, and research background provide only limited information, leading to inaccurate decision [28].
In [29], Nguyen et al. proposed the paper classification method based on Bag-of-Word scheme and KNN algorithm. This method extracts topics from all contents of a paper without any consideration for the reduction of computational complexity. Thus, it suffers from extensive computational time when data volume sharply increases.
Different from the above mentioned methods, our method uses three kinds of keywords: keywords that users input, keywords extracted from abstracts, and topics extracted by LDA scheme. These keywords are used to calculate the TF-IDF of each paper, with an aim to considering an importance of papers. Then, the K-means clustering algorithm is applied to classify the papers with similar subjects, based on the TF-IDF values of each paper. Meanwhile, our classification method is designed and implemented on Hadoop Distributed File System (HDFS) to efficiently process the massive research papers that have the characteristics of big data. Moreover, map-reduce programming model is used for the parallel processing of the massive research papers. To our best knowledge, our work is the first to use the analysis of paper abstracts based on TF-IDF and LDA schemes for paper classification.
System flow diagram
The paper classification system proposed in this paper consists of four main processes (Fig. 1): (1) Crawling, (2) Data Management and Topic Modeling, (3) TF-IDF, and (4) Classification. This section describes a system flow diagram for our paper classification system.

System flow diagram
Detailed flows for the system flow diagram shown in Fig. 1 are as follows:
- Step 1:
-
It automatically collects keywords and abstracts data of the papers published during a given period. It also executes preprocessing for these data, such as the removal of stop words, the extraction of only nouns, etc.
- Step 2:
-
It constructs a keyword dictionary based on crawled keywords. Because total keywords of whole papers are huge, this paper uses only top-N keywords with high frequency among the whole keywords
- Step 3:
-
It extracts topics from the crawled abstracts by LDA topic modeling
- Step 4:
-
It calculates paper lengths as the number of occurrences of words in the abstract of each paper
- Step 5:
-
It calculates a TF value for both of the keywords obtained by Step 2 and the topics obtained by Step 3
- Step 6:
-
It calculates an IDF value for both of the keywords obtained by Step 2 and the topics obtained by Step 3
- Step 7:
-
It calculates a TF-IDF value for each keyword using the values obtained by Steps 4, 5, and 6
- Step 8:
-
It groups the whole papers into papers with a similar subject, based on the K-means clustering algorithm
In the next section, we provide a detailed description for the above mentioned steps.
Paper classification system
Crawling of abstract data
The abstract is one of important parts in a paper as it describes the gist of the paper [30]. Typically, next a paper title, the next most part of papers that users are likely to read is the abstract. That is, users tend to read firstly a paper abstract in order to catch the research direction and summary before reading all contents in the paper. Accordingly, the core words of papers should be written concisely and interestingly in the abstract. Because of this, this paper classifies similar papers based on abstract data fast and correct.
As you can see in the crawling step of Fig. 1, the data crawler collects the paper abstract and keywords according to the checking items of crawling list. It also removes stop words in the crawled abstract data and then extracts only nouns from the data. Since the abstract data have large-scale volume and are produced fast, they have a typical characteristic of big data. Therefore, this paper manages the abstract data on HDFS and calculates the TF-IDF value of each paper using the map-reduce programming model. Figure 2 shows an illustrative example for the abstract data before and after the elimination of stop words and the extraction of nouns are applied.

Abstract data before and after preprocessing
After the preprocessing (i.e., the removal of stop words and the extraction of only nouns), the amount of abstract data should be greatly reduced. This will result to enhancing the processing efficiency of the proposed paper classification system.
Managing paper data
The save step in Fig. 1 constructs the keyword dictionary using the abstract data and keywords data crawled in crawling step and saves it to the HDFS.
In order to process lots of keywords simply and efficiently, this paper categorizes several keywords with similar meanings into one representative keyword. In this paper, we construct 1394 representative keywords from total keywords of all abstracts and make a keyword dictionary of these representative keywords. However, even these representative keywords cause much computational time if they are used for paper classification without a way of reducing computation. To alleviate this suffering, we use the keyword sets of top frequency 10, 20, and 30 among these representative keywords, as shown in Table 1.
Topic modeling
Latent Dirichlet allocation (LDA) is a probabilistic model that can extract latent topics from a collection of documents. The basic idea is that documents are represented as random mixtures over latent topics, where each topic is characterized by a distribution over words [31, 32].
The LDA estimates the topic-word distribution \(P(t|z)\) and the document-topic distribution \(P(z|d)\) from an unlabeled corpus using Dirichlet priors for the distributions with a fixed number of topics [31, 32]. As a result, we get \(P(z|d)\) for each document and further build the feature vector as
In this paper, using LDA scheme, we extract topic sets from the abstract data crawled in crawling step. Three kinds of topic sets are extracted, each of which consists of 10, 20, and 30 topics, respectively. Table 2 shows topic sets with 10 topics and the keywords of each topic. The remaining topic sets with 20 and 30 topics are omitted due to space limitations.
TF-IDF
The TF-IDF has been widely used in the fields of information retrieval and text mining to evaluate the relationship for each word in the collection of documents. In particular, they are used for extracting core words (i.e., keywords) from documents, calculating similar degrees among documents, deciding search ranking, and so on.
The TF in TF-IDF means the occurrence of specific words in documents. Words with a high TF value have an importance in documents. On the other hand, the DF implies how many times a specific word appears in the collection of documents. It calculates the occurrence of the word in multiple documents, not in only a document. Words with a high DF value do not have an importance because they commonly appear in all documents. Accordingly, the IDF that is an inverse of the DF is used to measure an importance of words in all documents. The high IDF values mean rare words in all documents, resulting to the increase of an importance.
Paper length
The paper length step of Fig. 1 calculates a total number of occurrences of words after separating words in a given abstract using white spaces as a delimiter. The objective of this step is to prevent unbalancing of TF values caused by a quantity of abstracts. Figure 3 shows a map-reduce algorithm for the calculation of paper length. In this figure, DocName and wc represents a paper title and a paper length, respectively.
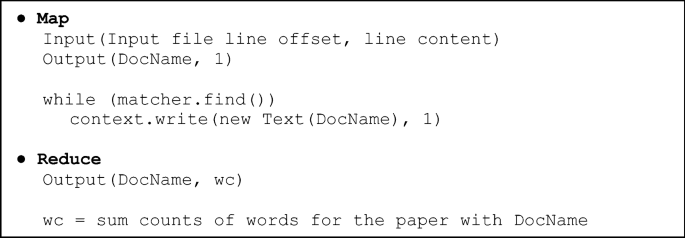
Map-reduce algorithm for the calculation of paper length
Word frequency
The TF calculation step in Fig. 1 counts how many times the keywords defined in a keyword dictionary and the topics extracted by LDA appear in abstract data. The TF used in this paper is defined as
where, \(n_{i,j}\) represents the number of occurrences of word \(t_{i}\) in document \(d_{j}\) and \(\sum\limits_{k} {n_{k,j} }\) represents a total number of occurrences of words in document \(d_{j}\). K and D are the number of keywords and documents (i.e., papers), respectively.
Figure 4 illustrates TF calculation for 10 keywords of top frequency. The abstract data in this figure have the paper length of 64. As we can see in this figure, the keywords ‘cloud computing’, ‘Internet of Things’, and ‘Big Data’ have the TF value of 0.015 because of one occurrence in the abstract data. The keyword ‘cloud computing’ has the TF value of 0.03 because of two occurrences. Figure 5 shows map-reduce algorithm to calculate word frequency (i.e., TF). In this figure, n represents the number of occurrences of a keyword in a document with a paper title of DocName.

An illustrative example of TF calculation
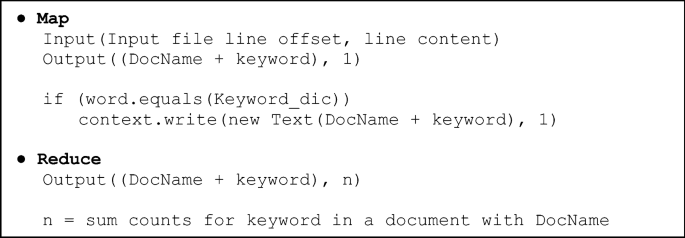
Map-reduce algorithm for the calculation of word frequency
Document frequency
While the TF means the number of occurrences of each keyword in a document, the DF means how many times each keyword appears in the collection of documents. In the DF calculation step in Fig. 1, the DF is calculated by dividing the total number of documents by the number of documents that contain a specific keyword. It is defined as
where, \(\left| D \right|\) represents total number of documents and \(\left| {d_{j} \in D:t_{j} \in d_{j} } \right|\) represents the number of documents that keyword \(t_{j}\) occurs. Figure 6 shows an illustrative example when four documents are used to calculate the DF value.

An illustrative example of DF calculation
Figure 7 shows the map-reduce algorithm to calculate the DF of each paper.

Map-reduce algorithm for the calculation of document frequency
TF-IDF
Keywords with a high DF value cannot have an importance because they commonly appear in the most documents. Accordingly, the IDF that is an inverse of the DF is used to measure an importance of keywords in the collection of documents. The IDF is defined as
Using Eqs. (2) and (4), the TF-IDF is defined as
The TF-IDF value increases when a specific keyword has high frequency in a document and the frequency of documents that contain the keyword among the whole documents is low. This principle can be used to find the keywords frequently occurring in documents. Consequently, using the TF-IDF calculated by Eq. (5), we can find out what keywords are important in each paper.
Figure 8 shows the map-reduce algorithm for the TF-IDF calculation of each paper.
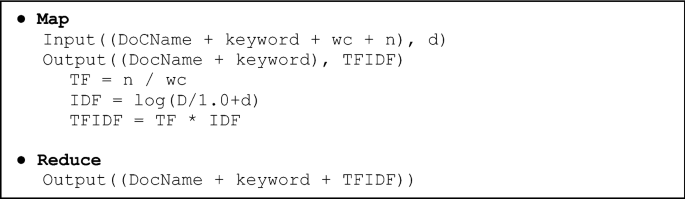
Map-reduce algorithm for TF-IDF calculation
K-means clustering
Typically, clustering technique is used to classify a set of data into classes of similar data. Until now, it has been applied to various applications in many fields such as marketing, biology, pattern recognition, web mining, analysis of social networks, etc. [33]. Among various clustering techniques, we choose the k-means clustering algorithm, which is one of unsupervised learning algorithm, because of its effectiveness and simplicity. More specifically, the algorithm is to classify the data set of N items based on features into k disjoint subsets. This is done by minimizing distances between data item and the corresponding cluster centroid.
Mathematically, the k-means clustering algorithm can be described as follows:
where, k is the number of clusters, \(x_{j}\) is the jth data point in the ith cluster \(C_{i}\), and \(c_{i}\) is the centroid of \(C_{i}\). The notation \(\left\| {x_{j} - c_{i} } \right\|^{2}\) stands for the distance between \(x_{j}\) and \(c_{i}\), and Euclidean distance is commonly used as a distance measure. To achieve a representative clustering, a sum of squared error function, E, should be as small as possible.
The advantage of the K-means clustering algorithm is that (1) dealing with different types of attributes; (2) discovering clusters with arbitrary shape; (3) minimal requirements for domain knowledge to determine input parameters; (4) dealing with noise and outliers; and (5) minimizing the dissimilarity between data [34].
The TF-IDF value represents an importance of the keywords that determines characteristics of each paper. Thus, the classification of papers by TF-IDF value leads to finding a group of papers with similar subjects according to the importance of keywords. Because of this, this paper uses the K-means clustering algorithm, which is one of most used clustering algorithm, to group papers with similar subjects. The K-means clustering algorithm used in this paper calculates a center of the cluster that represents a group of papers with a specific subject and allocates a paper to a cluster with high similarity, based on a Euclidian distance between the TF-IDF value of the paper and a center value of each cluster.
The K-means clustering algorithm is computationally faster than the other clustering algorithms. However, it produces different clustering results for different number of clusters. So, it is required to determine the number of clusters (i.e., K value) in advance before clustering. To overcome the limitations, we will use the Elbow scheme [35] that can find a proper number of clusters. Also, we will use the Silhouette scheme [36, 37] to validate the performance of clustering results by K-means clustering scheme. The detailed descriptions of the two schemes will be provided in next section with performance evaluation.
Experiments
Experimental environment
The paper classification system proposed by this paper is based on the HDFS to manage and process massive paper data. Specifically, we build the Hadoop cluster composed of one master node, one sub node, and four data nodes. The TF-IDF calculation module is implemented with Java language on Hadoop-2.6.5 version. We also implemented the LDA calculation module using Spark MLlib in python. The K-means clustering algorithm is implemented using Scikit-learn library [38].
Meanwhile, as experimental data, we use the actual papers published on Future Generation Computer System (FGCS) journal [13] during the period of 1984 to 2017. The titles, abstracts, and keywords of total 3264 papers are used as core data for paper classification. Figure 9 shows overall system architecture for our paper classification system.

Overall system architecture for our paper classification system
The keyword dictionaries used for performance evaluation in this paper are constructed with the three methods shown in Table 3. The constructed keyword dictionaries are applied to Elbow and Silhouette schemes, respectively, to compare and analyze the performance of the proposed system.
Experimental results
Applying Elbow scheme
When using K-means clustering algorithm, users should determine a number of clusters before the clustering of a dataset is executed. One method to validate the number of clusters is to use the Elbow scheme [35]. We perform Elbow scheme to find out an optimal number of clusters, changing the value ranging from 2 to 100.
Table 4 shows the number of clusters obtained by Elbow scheme for the three methods shown in Table 3.
As we can see in the results of Table 4, the number of clusters becomes more as the number of keywords increases. It is natural phenomenon because the large number of keywords results in more elaborate clustering for the given keywords. However, on comparing the number of clusters of three methods, we can see that Method 3 has the lower number of clusters than other two methods. This is because Method 3 can complementarily use the advantages of the remaining two methods when it groups papers with similar subjects. That is, Method 1 depends on the keywords input by users. It cannot be guaranteed that these keywords are always correct to group papers with similar subjects. The reason is because users can register incorrect keywords for their own papers. Method 2 makes up for the disadvantage of Method 1 using the topics automatically extracted by LDA scheme. Figure 10 shows elbow graph when Method 3 are used. In this figure, an upper arrow represents the optimal number of clusters calculated by Elbow scheme.

Elbow graph for Method 3
Applying Silhouette scheme
The silhouette scheme is one of various evaluation methods as a measure to evaluate the performance of clustering [36, 37]. The silhouette value becomes higher as two data within a same cluster is closer. It also becomes higher as two data within different clusters is farther. Typically, a silhouette value ranges from − 1 to 1, where a high value indicates that data are well matched to their own cluster and poorly matched to neighboring clusters. Generally, the silhouette value more than 0.5 means that clustering results are validated [36, 37].
Table 5 shows an average silhouette value for each of the three methods shown in Table 3. We can see from results of this table that the K-means clustering algorithm used in the paper produces good clustering when 10 and 30 keywords are used. It is should be noted that the silhouette values of more than 0.5 represent valid clustering. Figure 11 shows the silhouette graph for each of 10, 20, and 30 keywords when Method 3 are used. In this figure, a dashed line represents the average silhouette value. We omit the remaining silhouette graphs due to space limitations.

Silhouette graph for Method 3
Analysis of classification results
Table 6 shows an illustrative example for classification results. In this table, the papers in cluster 1 indicate that they are grouped by two keywords ‘cloud’ and ‘bigdata’ as a primary keyword. For cluster 2, two keywords ‘IoT’ and ‘privacy’ have an important role in grouping the papers in this cluster. For cluster 3, three keywords ‘IoT’, ‘security’ and ‘privacy’ have an important role. In particular, according to whether or not the keyword ‘security’ is used, the papers in cluster 2 and cluster 3 are grouped into different clusters.
Figure 12 shows a TF-IDF value and a clustering result for some papers. In this figure, ‘predict’ means cluster number, whose cluster contains a paper with the title denoted in first column. In Fig. 12a, we can observe that all papers have the same keyword ‘scheduling’, but they are divided into two clusters according to a TF-IDF value of the keyword. Figure 12b indicates that all papers have the same keyword ‘cloud’, but they are grouped into different clusters (cluster 7 and cluster 8) according whether or not a TF-IDF value of the keyword ‘cloud storage’ exists.

Illustrative examples of clustering results
Figure 13 shows an analysis result for the papers belonging to the same cluster. In this figure, we can see that three papers in cluster 11 have four common keywords ‘cloud’, ‘clustering’, ‘hadoop’, and ‘map-reduce’ as a primary keyword. Therefore, we can see from this figure that the papers are characterized by these four common keywords.

Clustering results by common keywords
Figures 14 and 15 show abstract examples for first and second papers among the four ones shown in Fig. 13, respectively. From these figures, we can see that four keywords (‘cloud’, ‘clustering’, ‘hadoop’, and ‘map-reduce’) are properly included in the abstracts of the two papers.

An abstract example for [39]

An abstract example for [40]
Evaluation on the accuracy of the proposed classification system
The accuracy the proposed classification systems has been evaluated by using the well-known F-Score [41] which measure how good paper classification is when compared with reference classification. The F-Score is a combination of the precision and recall values used in information extraction. The precision, recall, and F-Score are defined as follows.
In the above equations, TP, TN, FP, and FN represents true positive, true negative, false positive, and false negative, respectively. We carried out our experiments on 500 research papers randomly selected among the total 3264 ones used for our experiments. This experiment is run 5 times and the average of F-Score values is recorded.
Figure 16 shows the F-Score values of the three methods to construct keyword dictionaries shown in Table 3.

F-score values of three methods (TF-IDF, LDA, TF-IDF + LDA)
As we can see in the results of Fig. 16, the F-score value of Method 3 (the combination of TF-IDF and LDA) is higher than that of other methods. The main reason is that Method 3 can complementarily use the advantages of the remaining two methods. That is, TF-IDF can extract only the frequently occurring keywords in research papers and LDA can extract only the topics which are latent in research papers. On the other hand, the combination of TF-IDF and LDA can lead to the more detailed classification of research papers because frequently occurring keywords and the correlation between latent topics are simultaneously used to classify the papers.
Conclusion
We presented a paper classification system to efficiently support the paper classification, which is essential to provide users with fast and efficient search for their desired papers. The proposed system incorporates TF-IDF and LDA schemes to calculate an importance of each paper and groups the papers with similar subjects by the K-means clustering algorithm. It can thereby achieve correct classification results for users’ interesting papers. For the experiments to demonstrate the performance of the proposed system, we used actual data based on the papers published in FGCS journal. The experimental results showed that the proposed system can classify the papers with similar subjects according to the keywords extracted from the abstracts of papers. In particular, when a keyword dictionary with both of the keywords extracted from the abstracts and the topics extracted by LDA scheme was used, our classification system has better clustering performance and higher F-Score values. Therefore, our classification systems can classify research papers in advance by both of keywords and topics with the support of high-performance computing techniques, and then the classified research papers will be applied to search the papers within users’ interesting research areas, fast and efficiently.
This work has been mainly focused on developing and analyzing research paper classification. To be a generic approach, the work needs to be expanded into various types of datasets, e.g. documents, tweets, and so on. Therefore, future work involves working upon various types of datasets in the field of text mining, as well as developing even more efficient classifiers for research paper datasets.
Availability of data and materials
Not applicable.
References
Bafna P, Pramod D, Vaidya A (2016) Document clustering: TF-IDF approach. In: IEEE int. conf. on electrical, electronics, and optimization techniques (ICEEOT). pp 61–66
Ramos J (2003) Using TF-IDF to determine word relevance in document queries. In: Proc. of the first int. conf. on machine learning
Havrlant L, Kreinovich V (2017) A simple probabilistic explanation of term frequency-inverse document frequency (TF-IDF) heuristic (and variations motivated by this explanation). Int J Gen Syst 46(1):27–36
Trstenjak B, Mikac S, Donko D (2014) KNN with TF-IDF based framework for text categorization. Procedia Eng 69:1356–1364
Yau C-K et al (2014) Clustering scientific documents with topic modeling. Scientometrics 100(3):767–786
Balabantaray RC, Sarma C, Jha M (2013) Document clustering using K-means and K-medoids. Int J Knowl Based Comput Syst 1(1):7–13.
Gupta H, Srivastava R (2014) K-means based document clustering with automatic “K” selection and cluster refinement. Int J Comput Sci Mob Appl 2(5):7–13
Gurusamy R, Subramaniam V (2017) A machine learning approach for MRI brain tumor classification. Comput Mater Continua 53(2):91–108
Nagwani NK (2015) Summarizing large text collection using topic modeling and clustering based on MapReduce framework. J Big Data 2(1):1–18
Kim J-J (2017) Hadoop based wavelet histogram for big data in cloud. J Inf Process Syst 13(4):668–676
Dean J, Ghemawat S (2008) MapReduce: simplified data processing on large clusters. Commun ACM 51(1):107–113
Cho W, Choi E (2017) DTG big data analysis for fuel consumption estimation. J Inf Process Syst 13(2):285–304
FGCS Journal. https://www.journals.elsevier.com/future-generation-computer-systems. Accessed 15 Aug 2018.
Gui Y, Gao G, Li R, Yang X (2012) Hierarchical text classification for news articles based-on named entities. In: Proc. of int. conf. on advanced data mining and applications. pp 318–329
Singh J, Singh G, Singh R (2017) Optimization of sentiment analysis using machine learning classifiers. Hum-cent Comput Inf Sci 7:32
Mahendran A et al (2013) “Opinion Mining for text classification,” Int. J Sci Eng Technol 2(6):589–594
Alsmadi I, Alhami I (2015) Clustering and classification of email contents. J King Saud Univ Comput Inf Sci. 27(1):46–57
Rossi RG, Lopes AA, Rezende SO (2016) Optimization and label propagation in bipartite heterogeneous networks to improve transductive classification of texts. Inf Process Manag 52(2):217–257
Barigou F (2018) Impact of instance selection on kNN-based text categorization. J Inf Process Syst 14(2):418–434
Baker K, Bhandari A, Thotakura R (2009) An interactive automatic document classification prototype. In: Proc. of the third workshop on human-computer interaction and information retrieval. pp 30–33
Xuan J et al. (2017) Automatic bug triage using semi-supervised text classification. arXiv preprint arXiv:1704.04769
Aggarwal CC, Zhai CX (2012) A survey of text classification algorithms. In: Mining text data, Springer, Berlin, pp 163–222
Duda RO, Hart PE, Stork DG (2012) Pattern classification. Wiley, Hoboken
Bravo-Alcobendas D, Sorzano COS (2009) Clustering of biomedical scientific papers. In: 2009 IEEE Int. symp. on intelligent signal processing. pp 205–209
Taheriyan M (2011) Subject classification of research papers based on interrelationships analysis. In: ACM proc. of the 2011 workshop on knowledge discovery, modeling and simulation. pp 39–44
Hanyurwimfura D, Bo L, Njagi D, Dukuzumuremyi JP (2014) A centroid and Relationship based clustering for organizing research papers. Int J Multimed Ubiquitous Eng 9(3):219–234
Nanba H, Kando N, Okumura M (2011) Classification of research papers using citation links and citation types: towards automatic review article generation. Adv Classif Res Online 11(1):117–134
Mohsen T (2011) Subject classification of research papers based on interrelationships analysis. In: Proceeding of the 2011 workshop on knowledge discovery, modeling and simulation. pp 39–44
Nguyen TH, Shirai K (2013) Text classification of technical papers based on text segmentation. In: Int. conf. on application of natural language to information systems. pp 278–284
Gurung P, Wagh R (2017) A study on topic identification using K means clustering algorithm: big vs. small documents. Adv Comput Sci Technol 10(2):221–233
Blei DM, Ng AY, Jordan MI (2003) Latent Dirichlet allocation. J Mach Learn Res 3:993–1022
Jiang Y, Jia A, Feng Y, Zhao D (2012) Recommending academic papers via users’ reading purposes. In: Proc. of the sixth ACM conf. on recommender systems. pp 241–244
Xu R, Wunsch D (2008) Clustering. Wiley, Hoboken
Gan G, Ma C, Wu J (2007) Data clustering: theory, algorithms, and applications. SIAM, Alexandria
Kodinariya TM, Makwana PR (2013) Review on determining number of cluster in K-means clustering. Int J Adv Res Comput Sci Manag Stud 1(6):90–95
Oliveira GV et al (2017) Improving K-means through distributed scalable metaheuristics. Neurocomputing 246:45–57
Rousseeuw PJ (1987) Silhouettes: a graphical aid to the interpretation and validation of cluster analysis. J Comput Appl Math 20:53–65
Scikit-Learn. http://scikit-learn.org/stable/modules/classes.html. Accessed 15 Aug 2018.
Veiga J, Exposito RR, Taboada GL, Tounno J (2016) Flame-MR: an event-driven architecture for MapReduce applications. Future Gener Comput Syst 65:46–56
Ibrahim S, Phan T-D, Carpen-Amarie A, Chihoub H-E, Moise D, Antoniu G (2016) Governing energy consumption in Hadoop through CPU frequency scaling: an analysis. Future Gener Comput Syst 54:219–232
Visentini I, Snidaro L, Foresti GL (2016) Diversity-aware classifier ensemble selection via F-score. Inf Fus 28:24–43
Acknowledgements
This work was supported by research grants from Daegu Catholic University in 2017.
Funding
Not applicable.
Author information
Authors and Affiliations
Contributions
SWK proposed a main idea for keyword analysis and edited the manuscript. JMG was a major contributor in writing the manuscript and carried out the performance experiments. Both authors read and approved the final manuscript.
Corresponding author
Ethics declarations
Competing interests
The authors declare that they have no competing interests.
Additional information
Publisher's Note
Springer Nature remains neutral with regard to jurisdictional claims in published maps and institutional affiliations.
Rights and permissions
Open Access This article is distributed under the terms of the Creative Commons Attribution 4.0 International License (http://creativecommons.org/licenses/by/4.0/), which permits unrestricted use, distribution, and reproduction in any medium, provided you give appropriate credit to the original author(s) and the source, provide a link to the Creative Commons license, and indicate if changes were made.
About this article

Cite this article
Kim, SW., Gil, JM. Research paper classification systems based on TF-IDF and LDA schemes. Hum. Cent. Comput. Inf. Sci. 9, 30 (2019). https://doi.org/10.1186/s13673-019-0192-7
Received:
Accepted:
Published:
DOI: https://doi.org/10.1186/s13673-019-0192-7