
Abstract
Cirrhosis is a liver disease that is considered to be among the most common diseases in healthcare. Due to its non-invasive nature, ultrasound (US) imaging is a widely accepted technology for the diagnosis of this disease. This research work proposed a method for discriminating the cirrhotic liver from normal liver through US images. The liver US images were obtained from the radiologist. The radiologist also specified the region of interest (ROI) from these images, and then the proposed method was applied to it. Two parameters were extracted from the US images through differences in intensity of neighboring pixels. Then, these parameters can be used to train a classifier by which cirrhotic region of test patient can be detected. A 2-D array was created by the difference in intensity of the neighboring pixels. From this array, two parameters were calculated. The decision was taken by checking these parameters. The validation of the proposed tool was done on 80 images of cirrhotic and 30 images of normal liver, and classification accuracy of 98.18% was achieved. The result was also verified by the radiologist. The results verified its possibility and applicability for high-performance cirrhotic liver discrimination.
1 Introduction
World Health Organization (WHO) states that hepatitis C caused by hepatitis C virus is a liver disease. Chronic hepatitis C infection infected globally approx. 130–150 million people. A significant number of people will develop liver cirrhosis due to poor medical attention. The last phase of chronic hepatopathies is considered to be cirrhosis which often moves towards hepatocellular carcinoma. This disease is diagnosed by checking at the liver parenchyma’s structure, i.e., granular, and the liver surface’s aspects such as its roughness and contours [1].
Biopsy is observed as the “golden standard” method which is used for diagnosing and treatment of all liver diseases. It is not easily accepted by the patients due to in vivo nature [2, 3]. When all non-invasive techniques were observed, out of these, US is the most general and maximally used imaging modality for diagnosing the liver disease because (a) it is not expensive, (b) it has no harmful radiation emitted from it, (c) it is easily and widely available, and (d) it has high sensitivity. The main drawback of it is the dependency on the knowledge and experience of the operator, i.e., the radiologist [4]. The additional techniques or systems are being developed as computer-aided diagnosis systems (CAD) which will reduce the dependency of the operator to get reproducible results [5,6,7,8,9,10]. Therefore, developing CAD systems is so much important as it detects liver disease at an early stage. Due to this system, patients could save their life from unwanted nervousness, the probability of improvement increased, and the cost required for offering such treatments for advanced liver diseases reduced [11].
Therefore, the main preferred inspection for screening is ultrasonography. Here, the radiologist also described that the texture of the body tissues gave a significant visible property in the classification of results in their radiological importance [12,13,14]. Texture of an image can be categorized by coarseness, roughness, granulation in surface, randomness, and irregularity. All these features were described by intensity and a spatial array of pixels in the textural US images [15, 16]. As shown in Fig. 1, the normal liver has regular texture and cirrhosis liver has an irregular texture. This irregularity occurred due to sores, eruption, and roughness on the surface of cirrhotic liver.

a Normal liver. b Cirrhotic liver. Given by NIDDKD, National Institutes of Health [17]
The scar tissue distorted the architecture of normal liver, which joined the perivenous and periportal areas through the group of connecting tissues. This process may move towards to complete cirrhosis. Now, it is very a difficult work to detect the change when ultrasound screening or scanning happens. Radiologist requires a very serious study to discriminate between the normal and cirrhosis [18, 19]. If a technique can be designed based on the theory of image processing, then early detection of disease is possible.
In this paper, a tool is developed for the characterization of cirrhotic and normal liver through US images. In this, texture of US images is analyzed by proposed parameters and results are validated by support vector machine classifier. The results are also validated by the radiologist.
2 Literature survey
Yeh et al. [20] presented a technique to distinguish the images of steatosis and non-steatosis liver by using ultrasound of high frequency. Two features were extracted, i.e., gray level co-occurrence matrix (GLCM) and non-separable wavelet transform features. Support vector machine (SVM) classifier was used on these features, and accuracy of 90.5% was obtained. Kadah et al. [21] proposed features to differentiate the normal, cirrhosis, and fatty US images. These features were numerical quantitative at first and also the second gray level parameters. The K-nearest neighbor (KNN) classifier was used, and 100% sensitivity and 88.9% specificity were obtained. Graif et al. [22] presented an automatic algorithm that calculated the decrease in back scatters echo amplitude. This amplitude was the function of beam depth. This automatic algorithm is called far-field slope algorithm. The evaluation of this algorithm was done on the normal and diffuse liver disease US images. These images were non-compensated. Sensitivity of 67% and specificity of 77% were obtained by this algorithm. In radio frequency study [23], the two images were extracted from the signal generated by US probe. These two images were speckle image and despeckle image with anatomic details. The despeckled images filter to find the intensity features, and speckle images filter to find the two texture features. Bayes classifier was used on dataset of ten normal liver and ten fatty liver samples, and 95% accuracy was obtained.
Wu et al. [24] proposed a system that was evolution based on hierarchical features of fusion system. Among multiple features vector, the dominant features were selected for characterization of ultrasonic liver tissue. In this system, KNN classifier was used and 95.05% accuracy was obtained. Wu et al. [25] proposed an optimization algorithm that designed the features. It helped in the automatic liver cirrhosis diagnosis. The feature selection and extraction through US images were done by the self-organization properties of genetic algorithm. An AdaBoost classifier is used to detect liver cirrhosis based on patient’s database and US image. Murala et al. [26] proposed three parameters to distinguish the fibrosis and healthy subgroups in liver tissues. These three parameters were US speed, attenuation, and coefficient and integrated backscatter coefficient (IBC). Then, a discriminated analysis was done on these parameters to detect fibrotic groups. Lucieer et al. [27] proposed CAD system in which features were derived through US images of the liver and accompanying spleens. The statistical analysis had been improved by incorporating all the old techniques, i.e., dimension reduction, fractal dimension, non-parametric methods, to discriminate rules by kernel density estimation and classification trees. Virmani et al. [28] presented CAD system for focal liver lesions in which B-mode US images were used. This system was evaluated on the images of hemangioma and metastatic carcinoma lesion, small and large hepatocellular carcinoma lesions, typical and atypical cases of cyst, and normal liver tissue [29]. The texture features were extracted through inside and outside regions of lesions. Principal component analysis (PCA) was used on the feature set for finding the optimal principal components [30, 31]. The components were classified by SVM.
Kyriacou et al. [32] presented 11 features to detect the normal, fatty, and cirrhosis liver through US images. These features were gray level difference statistics (GLDS), gray level run length statistics (RUNL), spatial gray level dependence matrices (SGLDM), and fractal dimension texture analysis (FDTA). The region of interest had the size of 32 × 32 pixels. The KNN classifier was used on the combination of FDTA and SGLDM features and obtained 82.2% accuracy. The author added one more dataset in this same study, i.e., set of hepatoma images [33]. Then, investigators got 80% accuracy with KNN classifier by using a combination of three parameters, i.e., RUNL, SGLDM, and FDTA. With the use of neural network classifier, 82.67% accuracy was obtained.
Badawi et al. [34] presented eight features to distinguish between the normal cirrhotic and fatty liver US images. These features were contrast, entropy, angular second moment, mean gray level, correlation, percentile 10%, attenuation, and speckle separation. In this study, fuzzy classifier was used to classify and all these parameters acted as input to this classifier. This study was evaluated on dataset of 140 cases of US liver images and obtained 96% sensitivity for the fatty liver classification. Jiuqing and Sirui proposed wavelet packet transform (WPT) of the cirrhosis and normal US liver images [35]. By using of WPT, a total of 32 features were extracted. The dataset was of 200 cirrhosis and 390 normal livers US images. SVM classifier was used to classify the data and obtained 85.79% accuracy. By using wavelet transform features on the same group of images, the methods provided only 77.65% accuracy. Lee et al. [36] presented fractal feature vector based on wavelet transform of M-band. The three sets of US liver images were used for this feature vector that was normal, cirrhosis, and hepatoma. Hierarchical classifier was used and claimed about 96.7% accuracy in the classification of abnormal and normal liver US images. Acharya et al. [37] proposed the features through the liver US images which were based on the combination of higher-order statistics (HOS), discrete wavelet transform (DWT), and image texture features. Accuracy of 93.3% was achieved through these significant features by decision trees classifier for normal and FLD-affected abnormal livers classification. Yan et al. [38] proposed a FASTroke keypoint extractor which is fast and stroke-specific for Uyghur text. Uyghur characters in images are distinct from backgrounds in color, intensity, and texture. Compared with the MSER detector, FASTroke produces less than double the amount of components and identifies at least 10% more characters.
Literature emphasizes that liver textural characterization and surface morphology are the most effective US features in cirrhotic liver diagnosis. Many of the authors extracted the SGLDM, GLDS, FDTA, and RUNL features and used this features for calculating the accuracy. However, the visual inspection and analysis of these patterns are difficult, prone to error, and operator dependent. There is a need of some other parameters to analyze the texture that makes the system more accurate and feasible.
3 Methodology
The US images were taken from the Radiology Department of Rajindra Hospital, Patiala, Punjab, under the guidance of a skilled radiologist. The radiologist also specified the areas or regions in every US image which belongs to cirrhosis/normal as shown in Fig. 2. These areas are called region of interest (ROI). These selected regions were taken as templates of dimension 50 × 50 pixels from every US image of both cirrhotic/normal livers as in Fig. 2a–d, and then the proposed method was applied on it.

a US image of normal liver. b ROI from normal liver. c US image of cirrhotic liver. d ROI from cirrhotic liver
The total liver US images were 110. Out of these, there are 80 images of cirrhotic patients and 30 images of normal liver patients. The images were categorized into two categories, i.e., cirrhotic and normal liver having dimension of 381 by 331 in JPG format. Every image was taken from one US instrument to abolish the property of alter in texture values and dimensions on the image. The difference in the dimensions of the images can be well observed if they were captured by different sources. The US probe having 15 cm depth and 5 MHz frequency is used for acquiring these images.
A novel tool is developed that will help to differentiate the US image of the liver between cirrhotic and normal.
US image of the normal liver has regular texture or smooth surface and cirrhotic liver has irregular texture or rough surface. In regular texture, the intensity difference between neighboring pixels is very much less, while irregular texture having intensity difference is high among neighboring pixels. To keep this in mind, an intensity difference technique is developed.
In this technique, the difference has been found out between the two neighbor pixels. To start with the first row in ROI, the difference of the first and the second pixel became the first element in 2-D array. Then, the difference of the second and third pixel became the second element. Similarly, the difference of the third and fourth pixel became the third element and so on. Through this, the first row is created in the 2-D array. Similarly, the difference of the pixels from the second row became the second row and third row and so on. Due to this, a 2-D array was created.
The mean and standard deviation are calculated from this array. The mean showed the average of all the pixel intensity in the ROI. These two values become the threshold values. The standard deviation showed the variation of the pixel intensity in the ROI. It means how much intensity varies. So, the first threshold value is the mean of the array and the second one is the standard deviation of the array.
The array elements are checked with these threshold values. With the use of the first threshold value, all the array elements are checked and counted the array elements from the whole array which have value greater than the threshold value. If the counted array elements are less in number, it depicts that the difference between the pixel intensity is small then the image is uniform or having regular texture. While if the number is high, i.e., the difference between the pixels is high, then the image is having irregular texture or rough surface. So, one parameter is extracted called array elements.
Now, the value of the array elements is checked. If the element value is higher than the threshold value, then replace both pixel intensity values (minuend and subtrahend) by 255 in the original ROI image. But if it is lower, then there is no change in both pixel intensities (minuend and subtrahend) as shown in Fig. 5. Due to this, resultant image is formed. From this image, the second parameter is calculated called area covered.
By using these two parameters, judgment is taken that the US image of the liver is having regular or irregular texture, i.e., normal and cirrhosis. The complete process is shown in Fig. 3.

Flow chart of the proposed approach
To validate the results, support vector machine classifier is used. The leave-M-out cross-validation was used. The two parameters, i.e., array elements and area covered, were used with different threshold value for SVM classification.
Algorithm:
-
1.
Image taken of both cirrhotic and normal liver.
-
2.
ROI selection: manually and automatically. In manually, just select the region from the US image of liver. (Manual selection will be done under supervision of person that knows about the US images of liver as shown in Fig.4 (a)).
Fig. 4 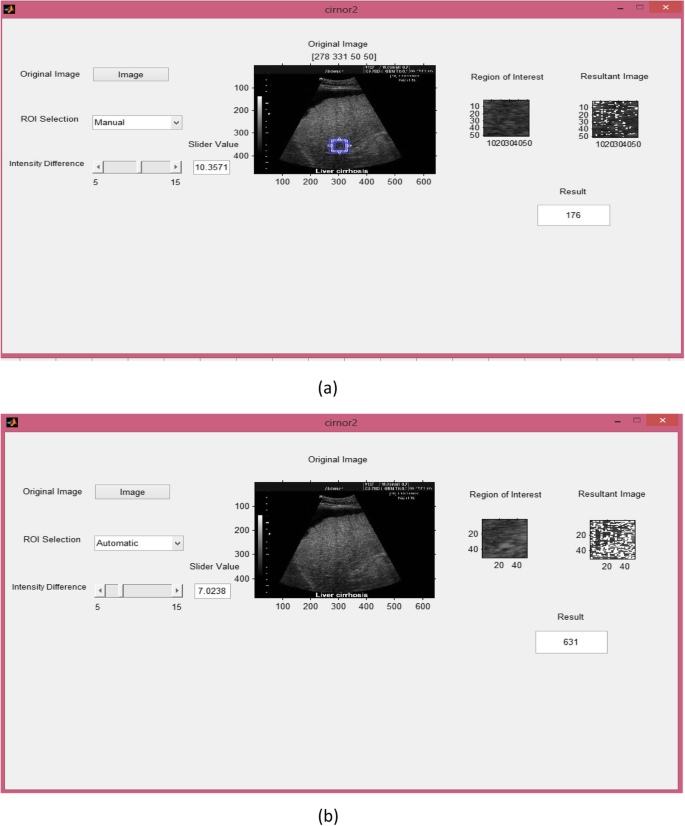
a GUI for manual ROI selection. b GUI for automatic selection
ROI will be automatically selected as specified the region by radiologist as shown in Fig.4 (b).
-
3.
After ROI selection, intensity difference technique applied on it.
-
4.
Due to this technique, a 2-D array created that having the elements i.e. difference of neighbor pixels intensity.
-
5.
Count the elements in the array that is greater than threshold value. Threshold value is mean and standard deviation of the array.
-
6.
If array element is greater than threshold then change the both pixels intensity (minuend and subtrahend) to 255 in the original image from where difference greater than threshold is found. But if is not greater than threshold then both pixel intensities (minuend and subtrahend) in the original image will remain same. Due to this, resultant image formed.
-
7.
From the array, the total array elements are counted that are greater than 15 i.e standard deviation and from the resultant image, area covered is calculated.
-
8.
By using this value and area, decision is taken that US image of liver is of cirrhosis and normal.

In this, there is an image button from where the US image of the liver is selected. US images of the liver from the radiologist act as input. There are 80 images of cirrhotic and 30 images of normal liver. Any image can be selected from these images that will act as input. There is also an image window that will show the selected image as shown in Fig. 4a, b.
Then, the next step is region of interest (ROI) selection from this US image. There is top down list which has two options, one is manual and other is automatic. From this list, any method can be selected.
In manual method, ROI selection is done by the person itself. The person can just select appropriate region from the US images of the liver with their knowledge. It might be defected. The person can just click on the region and 50 × 50 size ROI is ejected from the image. In automatic method, region specified by the radiologist in the image that belongs to the cirrhotic is automatically ejected. There is also another ROI window that will show the selected ROI from the image.
As the threshold value is selected from this slider, intensity difference technique is applied on the ROI. This technique gives three things: one is an array having elements of difference between neighboring pixels, second is the formation of new resultant image, and third is sum value. There is also another resultant image window that will show the resultant image. This sum value box shows the sum value, i.e., how many elements in the array are greater than the threshold value.
In the resultant image, the both pixel intensities in the original ROI (minuend and subtrahend) become “255” which have the difference more than threshold value and remaining pixels will be same.
This “255” pixel intensity in the resultant image depicts the cirrhotic area. In the cirrhotic image, the surface is rough or irregular, i.e., difference between neighborhood pixel intensity will be large. So, almost full ROI will be enclosed by pixel intensity “255.” While in normal image, the surface is regular, i.e., the difference between neighborhood pixels will be very low. So, pixel intensity “255” in the ROI will be very less. So, area covered as well as array elements becomes the most appropriate parameter to differentiate the liver that is cirrhotic and normal.
4 Results and discussion
ROI of size 50 × 50 has been selected as templates. Therefore, one ROI was chosen from one US image, i.e., a total of 30 templates from 30 normal liver images and 80 templates were chosen from 80 cirrhosis liver images.
Through the intensity difference technique, an array of difference and a resultant image were generated as shown in Fig. 5.

Intensity difference technique
This array contains the differences among the neighboring pixels. If the difference is small, it means the variation of intensity between adjacent pixels is small. If there is a small variation in the intensity of the pixel in the ROI image, then the image is smooth or surface is regular. If the differences in the array are high, then it shows that the variation of intensities in the ROI image is high. If there is high variation in pixel intensities in the ROI image, then it shows that the image is rough or the surface is irregular. To check the differences, array was checked and counted the elements having value greater than the threshold value.
Threshold value is nothing, but it creates a level. Below this level, image is regular, and above this level, image is irregular. For that, two threshold values are taken from the array. The first one is the mean of the array. The mean is just the average of the array elements. It shows the average intensity difference between the neighboring pixels. If the complete array has small values, then the mean of this array is also small. The array elements having value greater than the mean of the array depict the irregularity of the surface, and the array elements having value smaller than the mean of the array depict the regularity in the surface. The second threshold value is a standard deviation of the array. It shows the deviation of intensity from their neighboring pixel.
The number of array elements that are greater than the threshold value will represent that the image is rough or smooth and image belongs to cirrhotic or normal. If the number is high, it means that the image belongs to cirrhotic or vice versa.
In the resultant image, this 255 pixel intensity shows the difference more than the threshold. In normal image, intensity difference between neighboring pixels will be very less. So, pixel intensity 255 will be very much less. While in cirrhotic image, the surface is irregular or rough, i.e., the intensity difference between neighboring pixels will be high. So, pixel intensity 255 will be covered by almost complete ROI. If the area is covered by pixel intensity 255 is high, then the liver belongs to cirrhotic, and if area covered is less, then the liver is normal.
In this paper, two parameters generated from ROI image are used to characterize cirrhotic liver and normal liver for 110 patient’s evaluation. Two parameters, i.e., array elements and area covered, are extracted for two different threshold values. However, combination of one parameter for two threshold values leads to promising classification results. Parameters with higher value in each threshold value have higher impact on cirrhotic liver side.
For statistical interpretation, a widely accepted classifier is used, i.e., support vector machine (SVM) classifier. It classifies data by decision of the best hyperplane that separates the data points from one class to another class.
Accuracy of this classifier will justify our methodology and decision.
To make sure our classification is unbiased toward parameter value through the cirrhotic ROIs, normal ROIs are also incorporated in our examination. For 80 cirrhotic patients, 80 cirrhotic ROIs, and for 30 normal patients, 30 normal ROIs were selected. The proposed technique in this research work is performed well to characterize the cirrhotic and normal liver.
SVM classifier was applied to individual parameter with two different threshold values. A total of 110 US images of the liver were analyzed. Both values of area covered and array elements with two threshold values were taken from all images and then SVM was applied to these values.
For array elements:
In this classification, as shown in Fig. 6, pink plus symbol “+” belongs to the normal and blue plus symbol “+” belongs to the cirrhotic liver. In this, the value of array elements with one threshold value is on x-axis and value of array elements with the second threshold value is on y-axis. The line separates the area of the normal and cirrhotic liver. Out of 80 cirrhotic liver images, 79 images are predicted correct and 1 is classified wrong. On the other side, out of 30 normal images, 29 images were predicted correct and 1 was classified wrong. So, accuracy of 98.18%, sensitivity of 98.75%, and specificity of 96.67% were obtained as shown in Table 1.

SVM classification for array elements
For area covered:
In this classification, as shown in Fig. 7, pink plus symbol “+” belongs to the normal liver and blue plus symbol “+” belongs to the cirrhotic liver. In this, the value of area covered with one threshold value is on x-axis and the value of area covered with the second threshold value is on y-axis. The line separates the area of the normal and cirrhotic liver. Out of 80 cirrhotic liver images, 79 images are predicted correct and 1 is classified wrong. On the other side, out of 30 normal images, 29 images are predicted correct and 1 is classified wrong. So, accuracy of 98.18%, sensitivity of 98.75%, and specificity of 96.67% were obtained as shown in Table 1.

SVM classification for area covered
The classification accuracy obtained from this proposed technique is higher than the results obtained from previous methods as in the literature survey.
5 Conclusion
Liver US images have been used to characterize the normal and cirrhotic disease. In this research paper, an intensity difference technique has been proposed which depends on the intensity variation of the pixels. This technique provides two characterization parameters, i.e., counted array elements and area covered. The parameters are extracted from the images which categorize the images as cirrhotic/normal. The accuracy of 98.18%, sensitivity of 98.75%, and specificity of 96.67% were achieved through these two parameters to detect the tested images. This promising or good result makes this technique more feasible and realistic. In this research, normal and cirrhosis liver US images are classified. The treatment can be more proper if there is good knowledge of the stages of cirrhosis, i.e., between normal to cirrhosis. It also reduces over diagnosis. Future work will concern on more stages of cirrhosis.
Availability of data and materials
Database (ultrasound images of Cirrhotic liver) was collected from Govt. Medical College with prior permission from Medical Supdt.
Abbreviations
- CAD:
-
Computer-aided diagnosis
- DWT:
-
Discrete wavelet transform
- FDTA:
-
Fractal dimension texture analysis
- FLD:
-
Fatty liver disease
- GLCM:
-
Gray level co-occurrence matrix
- GLDS:
-
Gray level difference statistics
- HOS:
-
Higher order statistics
- IBC:
-
Integrated backscatter coefficient
- KNN:
-
K-nearest neighbor
- PCA:
-
Principal component analysis
- ROI:
-
Region of interest
- RUNL:
-
Gray level run length statistics
- SGLDM:
-
Spatial gray level dependence matrices
- SVM:
-
Support vector machine
- US:
-
Ultrasound
- WHO:
-
World Health Organization
- WPT:
-
Wavelet packet transform
References
J. Virmani, V. Kumar, N. Kalra, et al., Prediction of cirrhosis based on singular value decomposition of gray level co-occurrence matrix and a neural network classifier. Proc IEEE conf. Developments in E-systems Engineering., 146–151 (2011)
K. Aggarwal, M.S. Bhamrah, H.S. Ryait, The identification of liver cirrhosis with modified LBP grayscaling and Otsu binarization. SpringerPlus. 5, 1–15 (2016)
S.A. Masson, A. Nakib, Real-time assessment of bone structure positions via ultrasound imaging. J Real Time Image Processing. 13, 135–145 (2017)
S. Strauss, E. Gavish, P. Gottlieb, et al., Interobserver and intraobserver variability in the sonographic assessment of fatty liver. Am J Roentgenol. 189, W320–W323 (2007)
Doi K. (2005). Current status and future potential of computer-aided diagnosis in medical imaging. Br J Radiology. 2005;78: s3-19.
H. Fujita, Y. Uchiyama, T. Nakagawa, et al., Computer-aided diagnosis: the emerging of three CAD systems induced by Japanese health care needs. Computer Methods Programs Biomedicine. 92, 238–248 (2008)
A.M. Hashem, M.E. Rasmy, K.M. Wahba, et al., Single stage and multistage classification models for the prediction of liver fibrosis degree in patients with chronic hepatitis C infection. Computer Methods Programs Biomedicine. 105, 194–209 (2012)
K. Polat, S. Günes, A hybrid approach to medical decision support systems: combining feature selection, fuzzy weighted pre-processing and AIRS. Computer Methods Programs Biomedicine. 88, 164–174 (2007)
J.S. Sartakhti, M.H. Zangooei, K. Mozafari, Hepatitis disease diagnosis using a novel hybrid method based on support vector machine and simulated annealing (SVM-SA). Computer Methods Programs Biomedicine. 108, 570–579 (2012)
Y. Wang, L. Ma, P. Liu, Feature selection and syndrome prediction for liver cirrhosis in traditional Chinese medicine. Computer Methods Programs Biomedicine. 95, 249–257 (2009)
L.A. Adams, P. Angulo, K.D. Lindor, Nonalcoholic fatty liver disease. Cana Med Assoc J. 172, 899–905 (2005)
R.M. Hawlick, Statistical and structural approaches to texture. Proc IEEE 67, 786–808 (1979)
N. Abramov, M. Fradkin, L. Rouet, et al., Configurable real-time motion estimation for medical imaging: application to X-ray and ultrasound. J Real Time Image Processing. 13, 147–160 (2017)
G. Castellano, L. Bonilha, L.M. Li, et al., Texture analysis of medical images. Clinical Radiology. 59, 1061–1069 (2004)
P. Filipczuk, T. Fevens, A. Krzyżak, Computer-aided breast cancer diagnosis based on the analysis of cytological images of fine needle biopsies. IEEE Trans on Medical Imaging. 32, 2169–2178 (2013)
F. Chaieb, T.B. Said, S. Mabrouk, et al., Accelerated liver tumor segmentation in four-phase computed tomography images. J Real Time Image Processing. 13, 121–133 (2017)
NIDDK. (2010) <http://digestive.niddk.nih.gov/ddiseases/pubs/cirrhosis_ez>
D. Grangier, S. Bengio, A discriminative kernel-based approach to rank images from text queries. IEEE Trans Pattern Analysis and Machine Intelligence. 30, 1371–1384 (2008)
C.A.S.J. Gulo, H.F. De Arruda, A.F. De Araujo, et al., Efficient parallelization on GPU of an image smoothing method based on a variational model. J Real Time Image Processing., 1–13 (2016)
W.C. Yeh, Y.M. Jeng, C.H. Li, et al., Liver steatosis classification using high-frequency ultrasound. Ultrasound Med Biol. 31, 599–605 (2005)
Y.M. Kadah, A.A. Farag, J.M. Zurada, et al., Classification algorithms for quantitative tissue characterization of diffuse liver disease from ultrasound images. IEEE Trans Med Imaging. 15, 466–478 (1996)
M. Graif, M. Yanuka, M. Baraz, et al., Quantitative estimation of attenuation in ultrasound video images: correlation with histology in diffuse liver disease. Invest Radiology. 35, 319–324 (2000)
R. Ribeiro, J. Sanches, Fatty liver characterization and classification by ultrasound. Pattern Recognition Image Analysis. LNCS 5524, 354–361 (2009)
C.C. Wu, W.L. Lee, Y.C. Chen, et al., Evolution-based hierarchical feature fusion for ultrasonic liver tissue characterization. IEEE J Bio Health Informatics. 17, 967–976 (2013)
C.C. Wu, W.L. Lee, Y.C. Chen, et al., Ultrasonic liver tissue characterization by feature fusion. Expert Systems with Applications. 39, 9389–9397 (2012)
S. Murala, Q.M. Jonathan, Local mesh patterns versus local binary patterns: biomedical image indexing and retrieval. IEEE J Bio Health Informatics. 18, 929–938 (2014)
A. Lucieer, A. Stein, P. Fisher, Multivariate texture-based segmentation of remotely sensed imagery for extraction of objects and their uncertainty. Int J Remote Sens. 26, 2917–2936 (2005)
J. Virmani, V. Kumar, N. Kalra, et al., SVM-based characterization of liver ultrasound images using wavelet packet texture descriptors. Springer J Digital Imaging. 26, 530–543 (2013)
A.K. Chaou, A. Mekhaldi, M. Teguar, Elaboration of novel image processing algorithm for arcing discharges recognition on HV polluted insulator model. IEEE Trans on Dielectrics and Electrical Insulation. 22, 990–999 (2015)
M. Heikkila, M. Pietikainen, A texture-based method for modeling the background and detecting moving objects. IEEE Trans Pattern Analysis and Machine Intelligence. 28, 657–662 (2006)
N. Otsu, A threshold selection method from gray-level histograms. IEEE Transactions on Systems, Man and Cybernetics. 9, 62–66 (1979)
E. Kyriacou, S. Pavlopoulos, G. Konnis, et al., Computer assisted characterization of diffused liver disease using image texture analysis techniques on B-scan images. IEEE Nucl Sci Symp. 2, 1479–1483 (1997)
S. Pavlopoulos, E. Kyriacou, D. Koutsouris, et al., Fuzzy neural network-based texture analysis of ultrasonic images. IEEE Eng Med Biol Mag. 19, 39–47 (2000)
A.M. Badawi, A.S. Derbala, A.M. Youssef, (1999). Fuzzy logic algorithm for quantitative tissue characterization of diffuse liver diseases from ultrasound images. Int J Med Inform. 55, 135–147 (1999)
W. Jiuqing, Z. Sirui, Features extraction based on wavelet packet transform for B-mode ultrasound liver images. 3rd International Congress on. Image and Signal Processing. 2, 949–955 (2010)
W.L. Lee, Y.C. Chen, K.S. Hsieh, Ultrasonic liver tissues classification by fractal feature vector based on m-band wavelet transform. IEEE Trans Med Imaging. 22, 382–392 (2003)
U.R. Acharya, S.V. Sree, R. Ribeiro, et al., Data mining framework for fatty liver disease classification in ultrasound: a hybrid feature extraction paradigm. Med Phys. 39, 4255–4264 (2012)
C. Yan, H. Xie, J. Chen, Z. Zha, X. Hao, Y. Zhang, Q. Dai, A fast Uyghur text detector for complex background images. IEEE Trans Multimedia. 20, 3389–3398 (2018)
Funding
There is no funding.
Author information
Authors and Affiliations
Contributions
Our contributions in this paper were that the first author (KA) carried out the study of image processing, participated in the design and analysis, and drafted the manuscript. The second author (MSB) participated in the designing of the technique and performed the statistical analysis. The third one (HSR) conceived of the study and participated in its design and coordination and helped to draft the manuscript. All authors read and approved the final manuscript.
Authors’ information
Karan Aggarwal received his M.Tech in Electronics & Communication Engineering from Punjab Technical University, Punjab, India, in 2013. He is currently a Ph.D research scholar in Punjabi University, Patiala. His research interests include biomedical image processing
Dr. Hardeep Singh Ryait received his Ph.D in Electrical & Instrumentation Engineering from Thapar University, Patiala, in 2011. He is currently the Dean of the Research Department in Baba Banda Singh Bahadur Engineering College. His research interests include medical electronics and imaging and networking.
Dr. Manjit Singh Bhamrah received his Ph.D in Electronics & Communication Engineering from Punjab Technical University, Punjab, in 2010. He is currently a Professor in ECE Department, Patiala University, Patiala. His research interests include wireless mobile communication and fiber optics communication.
Corresponding author
Ethics declarations
Competing interests
The authors declare that they have no competing interests.
Additional information
Publisher’s Note
Springer Nature remains neutral with regard to jurisdictional claims in published maps and institutional affiliations.
Rights and permissions
Open Access This article is distributed under the terms of the Creative Commons Attribution 4.0 International License (http://creativecommons.org/licenses/by/4.0/), which permits unrestricted use, distribution, and reproduction in any medium, provided you give appropriate credit to the original author(s) and the source, provide a link to the Creative Commons license, and indicate if changes were made.
About this article

Cite this article
Aggarwal, K., Bhamrah, M.S. & Ryait, H.S. Detection of cirrhosis through ultrasound imaging by intensity difference technique. J Image Video Proc. 2019, 80 (2019). https://doi.org/10.1186/s13640-019-0482-z
Received:
Accepted:
Published:
DOI: https://doi.org/10.1186/s13640-019-0482-z