

Surface Water (SW) and Shallow Groundwater (SGW) Nutrient Concentrations in Riparian Wetlands of a Mixed Land-Use Catchment


1
Division of Forestry and Natural Resources, Davis College of Agriculture, Natural Resources and Design, West Virginia University, Morgantown, WV 26506, USA
2
James C. Kennedy Waterfowl and Wetlands Conservation Center, Belle W. Baruch Institute of Coastal Ecology and Forest Science, Georgetown, SC 29442, USA
*
Author to whom correspondence should be addressed.
Land 2024, 13(4), 409; https://doi.org/10.3390/land13040409
Submission received: 18 February 2024
/
Revised: 16 March 2024
/
Accepted: 21 March 2024
/
Published: 23 March 2024
(This article belongs to the Special Issue Where Land Meets Sea: Terrestrial Influences on Coastal Environments)
Abstract
:Precipitation patterns, water flow direction, and local land-use practices affect surface water (SW) and shallow groundwater (SGW) nutrient concentrations in riparian wetlands. Given physical process complexities, spatiotemporal quantification of nutrients and physical factors influencing nutrient concentrations are needed to advance wetland water resource management. To address these needs, a study was conducted in riparian wetlands of a mixed land-use catchment in West Virginia (WV), USA. Observed data included SW–SGW levels and nutrient concentrations, including nitrate (NO3-N), nitrite (NO2-N), ammonium (NH4-N), orthophosphate (PO43-P), total nitrogen (total_N), and total phosphorus (total_P) from January 2020 to December 2021. Water samples were collected monthly from stream gauge sites (n = 4) and co-located piezometers (n = 13). Results showed that, on average, gaining stream conditions were observed in upstream sites, and losing stream conditions were observed in downstream sites. Observed nutrient profiles between SW and SGW included SW exhibiting a higher average NO3-N concentration (0.42 mg/L), while SGW displayed an elevated NH4-N concentration (1.55 mg/L) relative to other nitrogen species. Significantly high (p < 0.05) SW NO3- concentrations in summer and fall were attributed to increased precipitation and corresponding water level and, therefore, pressure head and transport fluctuations. Principal Component Analysis (PCA) showed differences in nutrient concentrations based on the water source type and catchment land use, explaining 65% of data variability. Spearman correlation analysis illustrated the correlation among nutrient concentrations, land use, and water level changes in SW and SGW environments. This study provides needed baseline data on nutrient dynamics for a riparian wetland in a mixed land-use catchment, supplying science-based information to advance land and water management practices in the study watershed and similar physiographic watersheds globally.
1. Introduction
Nutrients are essential for surface water (SW) and shallow groundwater (SGW) aquatic food web status and resilience [1,2,3]. However, excess nutrient concentrations in SW and SGW can cause eutrophication, hypoxia, and degraded water quality and impact public health [1,4,5]. Furthermore, the nutrient inputs to freshwater resources have increased globally during the 20th century, making this issue a growing concern [4,6]. Due to the risks associated with increased nutrient loading, spatiotemporal assessment of nutrient dynamics in SW and SGW systems is necessary to make informed management decisions and improve water quality remediation strategies [1,4,7,8].
Riparian wetlands serve as a zone of transition between aquatic and terrestrial environments [8,9,10]. As runoff and SGW generally flow through riparian zones before entering SW, these areas typically function as buffer zones for reducing nutrient concentrations, including total nitrogen (total_N) in SW and SGW [1,11,12,13,14,15]. Total_N includes nitrate (NO3-N), nitrite (NO2-N), ammonium (NH4-N), and organic N [5,15], among which NO3-N is typically of greatest concern due to its high mobility and susceptibility to leaching [16,17]. However, riparian wetlands generally have high water tables and anaerobic conditions, facilitating higher denitrification-to-nitrification ratios [15,18,19]. As a result, NO3-N concentrations are lower, and NH4-N tends to accumulate in wetland soil [15,18,19]. In addition, forest and grassland vegetation use most of the NO3-N in wetland soils. Therefore, NO3-N transport rates to SW and SGW in riparian wetlands tend to be relatively slow [9,15]. Similar to N, there is generally less total phosphorus (total_P) leaching in wetland SW and SGW due to absorption into soil, sediments, and water columns [20]. Despite advances in understanding nutrient cycling in riparian wetlands, a great deal of work is needed to advance science-based decisions in managing these areas [9,16,18].
Although riparian wetlands generally act as buffer zones, riparian system nutrient reduction efficiency depends on precipitation patterns and highly spatially and temporally variable SW and SGW mixing processes [8,16,21,22,23,24]. For example, Chinnasamy and Hubbart [24] showed an increase of NH4-N and PO43-P concentrations from an upstream riparian area toward the stream in Missouri, USA. They further provided evidence that riparian zones may not always attenuate nutrients and concluded that accounting for the relative position of the riparian zone to SGW flow direction is necessary to advance riparian nutrient management practices [24]. Similarly, in a study investigating a riparian wetland in Maryland, Jordan et al. [23] showed that riparian zones did not effectively remove SGW PO43-P inputs from adjacent agricultural activities. Many recent studies have concluded that the SW and SGW nutrient dynamics of a riparian wetland depend on several factors, including catchment land-use activities and flow paths [13,14,16,25]. For example, Kwon et al. [16] highlighted elevated P levels in SGW within riparian zones adjacent to paddy fields, establishing SGW discharge into SW as the principal source of P in the stream. Similarly, Banner et al. [25] suggested that reducing cropland with permanent vegetation near buffer zones may reduce nutrient concentrations in stream water. Ultimately, previous work indicates an ongoing need for additional research in different geographic locations to understand nutrient dynamics in SW and SGW of riparian wetlands in relation to catchment land use, water level change, and water flow direction.
To address the complexity of nutrient transport and SW and SGW processes, recent authors used principal component analysis (PCA) and correlation analysis to analyze nutrient dynamics relative to land use, water level change, and flow paths. For example, Gootman and Hubbart [26] conducted a study in Moore’s Run Watershed, WV, that showed distinct differences between SW and SGW nutrient concentrations using PCA and concluded that variations based on water source types (i.e., SW and SGW) imply potential for influencing non-point pollutant loading. Gorgoglione et al. [27] similarly used PCA and Spearman correlation analysis to understand the influence of land-use on SW quality in Uruguay. They concluded that such multivariate exploratory tools help analyze space and time nutrient dynamics and draw conclusions on water quality factors and land use. Li et al. [10] used PCA and correlation analysis in a riparian buffer zone of Han River Basin, China. They concluded that N pollution was linked to the entire catchment’s urban and agricultural land use, and the forested 100 m riparian buffer could not reliably mitigate pollutant loads to water bodies.
Water is a major natural asset of the Appalachian Mountain range of the northeastern United States, and therefore, ensuring the quality of water resources is needed for cities and rural communities within and around the region [28,29,30]. Thus, research has been performed to understand the nutrient dynamics and its connections to variable land use. For example, Merriam et al. [28] suggested that even though the Monongahela River in West Virginia (WV) is less vulnerable to high nutrient loadings, potential changes in future land use can increase the vulnerability of the river. In addition, Webster et al. [30] suggested that the high N in Southern Appalachia’s water resources was associated with agriculture or development in the riparian area or the entire catchment. However, Flite et al. [29] observed N depletion from wastewater effluent in forested riparian wetlands in Appalachia, emphasizing the role of SGW as a nitrogen sink in the study area. The authors suggested that further analysis of riparian wetlands in similar physiographic regions is important as riparian nutrient concentrations depend on localized factors (water flow direction, water table depth, land use). Therefore, analyzing nutrient fluctuations over time in the Appalachian regions of WV will contribute valuable insights to the existing literature and guide conservation efforts.
The overarching objective of this research was to examine the spatiotemporal variations in N and P (and species) concentrations in SW and SGW in the riparian wetlands of a mixed land-use watershed in WV, USA. Sub-objectives included (a) quantifying spatial and temporal SW and SGW levels and delineating gaining or losing stream conditions, (b) analyzing concentrations of nutrients, including (NO3-N), nitrite (NO2-N), ammonium (NH4-N), orthophosphate (PO43-P), total nitrogen (total_N), and total phosphorus (total_N) in SW and SGW grab samples, (c) quantitatively comparing inter- and intra-site (among co-located piezometers in each monitoring site) spatiotemporal nutrient concentration change, and (d) describing correlations of nutrient concentration change relative to land use, water level change, and water source type (SW and SGW). Results provide new information to the scientific literature and science-based information for land management decisions about nutrient dynamics in riparian wetlands of mixed land-use watersheds.
2. Materials and Methods
2.1. Site Descriptions
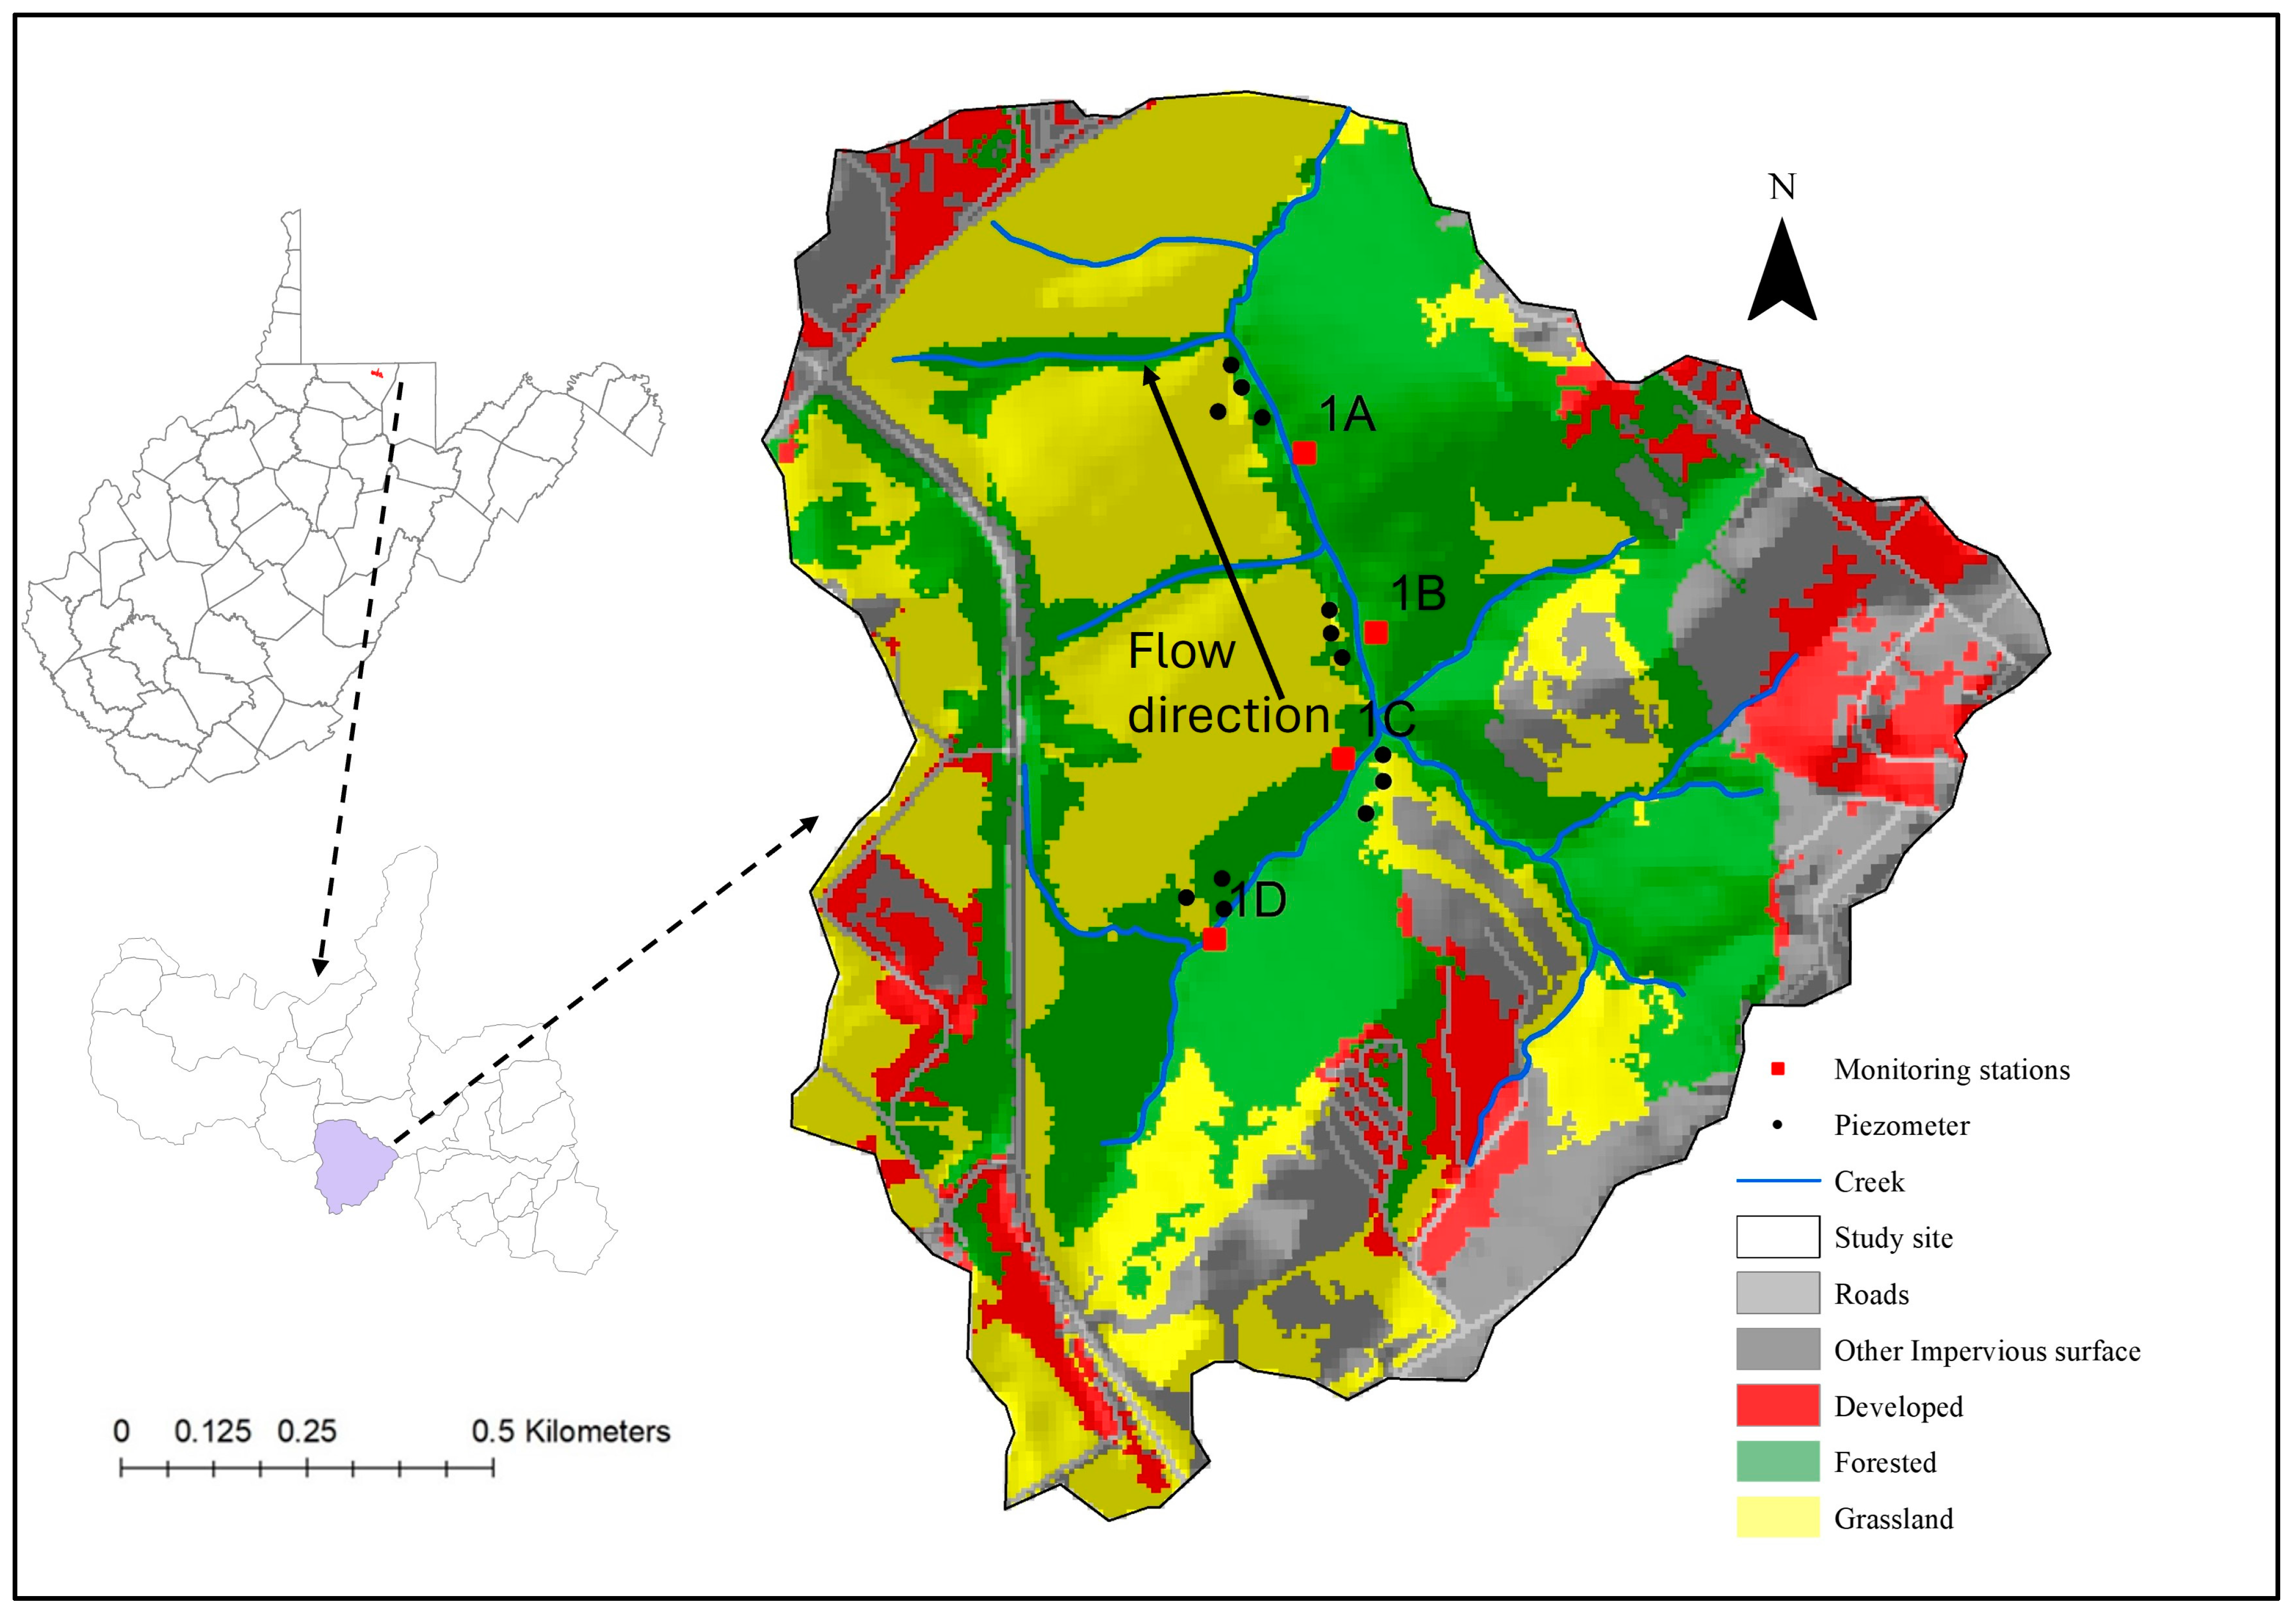
The study was conducted in seasonally flooded palustrine emergent riparian wetlands of a second-order reach in the West Run Watershed (WRW) located in northeastern Morgantown, West Virginia (WV), USA (Figure 1). The study reach drains into the third-order West Run Creek, a Monongahela River tributary [31]. The soil texture of the study reach was predominantly sandy, and the observed average saturated hydraulic conductivity (Ksat) ranged from 35.90 to 169.64 m/d [31]. The soil’s average dry bulk density, porosity, and degree of saturation were 1.27 g/cm3, 0.57, and 0.94, respectively [31]. The elevation of the study reach decreased from 327.67 m to 310.48 m in the downstream direction (Table 1).
The study reach was instrumented with four stream stage monitoring sites designated 1A, 1B, 1C, and 1D (Figure 1). Site 1A had four co-located piezometers, and all other sites had three co-located piezometers, resulting in 13 total piezometers. This study design followed a similar scale-nested and paired experimental study design used in previous studies [32,33,34]. Site 1A and 1B encompassed approximately 34% (0.42 km2) of the study area, while sites 1C and 1D encompassed 13.47% (0.17 km2) and 17.93% (0.21 km2) of the study area, respectively (Table 1). The contributing drainage area associated with monitoring site 1B had the highest residential area (55.39%), and 1C had the lowest residential area (2.44%) (Table 1). The residential areas primarily consisted of parking lots, roads, and buildings [34]. Site 1C was highly forested (68.29%), and 1A had more grasslands (43.48%) compared to other sub-catchments (Table 1). Forested areas were primarily Oak dominated [34]. Aside from periodic cattle grazing in the summer and fall months, there were no agricultural activities or fertilizer use in the study area. Thus, most of the study area was undeveloped at the time of this study, with notable residential expansion on the northeastern side (Figure 1), as confirmed by field observations.
2.2. Observed Stream Stage and SGW Level
Stream stage was monitored (at 30 min intervals) at four stream gauging stations (1A, 1B, 1C, and 1D) located on the study reach (January 2020 to December 2021) (Figure 1). Gauging stations included Solinst Levelogger pressure transducers [35] installed in 5 cm polyvinyl chloride (PVC) stilling wells. The current study focused on analyzing nutrient concentration dynamics in relation to flow direction and water level (head) changes. Thus, streamflow data were not collected as it was beyond the fiscal scope of the study. The average observed stream depth was 0.34 m [34]. SGW level was monitored using Solinist Levelogger Junior Edge pressure transducers [36] placed in the bottom of each piezometer that sensed and stored water depth data at 30 min intervals. The water depth data were measured from the soil surface [36]. To compare SGW and SW levels, the water depth was converted to water level elevation above the WGS 1984 datum by subtracting water depth from land elevation (Table A1) [16,36]. The gaining and losing conditions of the stream were defined by comparing the surface water level with the adjacent groundwater level at each piezometer. Precipitation data were obtained from a National Oceanic and Atmospheric Administration (NOAA) weather station approximately five kilometers from the study reach at Morgantown Municipal Airport [37].
2.3. Water Sample Collection
The grab sample method [24,26,38] was used to collect monthly water samples. SW samples were collected from four stream monitoring stations (n = 4 per month), resulting in 96 SW samples for the study period (2020–2021). Samples were collected with polyethylene 1000 mL wide-mouth sample bottles after rinsing the bottle three times with site water. The bottle mouth was plunged vertically downward to approximately 60% stream depth [24,26,38]. The bottle was then turned so that the opening pointed upstream. The sample was collected carefully to avoid disruption of the streambed, which might confound the results [38]. SGW samples were collected monthly from the co-located piezometers (n = 13 per month), resulting in a total of 312 SGW samples for the study period. Piezometers were purged approximately three days before SGW sampling using a peristaltic pump (Cole-Parmer Masterflex L/S Portable Sampling Pump) [39] to ensure that freshwater samples were collected on the day of sampling, thereby avoiding testing stagnant water, as per the United States Geological Survey (USGS) [38]. Both stream and SGW samples were collected on the first Tuesday of each month to maintain temporal consistency and facilitate comparative analysis.
2.4. Nutrient Analysis
Nutrient concentrations, including nitrate (NO3-N), nitrite (NO2-N), ammonium (NH4-N), orthophosphate (PO43-P), total nitrogen (total_N), and total phosphate (total_P) were analyzed within 24 h of grab sample collection. A DR 3900 Laboratory Spectrophotometer [40] and HACH TNTPlusTM [41] analytes were used following standard HACH analytical methods [42].
2.5. Statistical Analysis
Descriptive statistics were developed from the observed data, including average, minimum and maximum values of observed SW stage, SGW depth, and nutrient concentrations for SGW and SW grab samples. A two-way ANOVA was performed for inter- and intra-site spatial analysis to assess average nutrient concentration differences by water source type (SW and SGW) and monitoring sites for the study period [26,33,43,44]. ANOVA was followed by Tukey–Kramer honest significant difference (HSD) tests to identify significant differences in nutrient concentrations (CI = 95%, p < 0.05) across all possible combinations of monitoring sites in SW or SGW [26,43,44]. For temporal analysis, two-way ANOVA and Tukey–Kramer HSD tests were used to detect significant seasonal differences in nutrients (CI = 95%, p < 0.05) [44] at monitoring sites separately for SW and SGW environments.
Principal component analysis (PCA) was conducted to identify interrelationships between nutrient concentrations, water source type (SW and SGW), catchment land use, and water level changes [3,16,26,33,44]. Data were standardized to ensure consistency among variables with different measurement units or scales, with a mean of 0 and a standard deviation of 1, before performing PCA and correlation analysis [38]. Spearman’s correlation test [38] was conducted separately for SW and SGW, quantifying correlations among nutrients, catchment land use, and water level changes [3,16,26,33,44].
3. Results and Discussion
3.1. SW–SGW Level and Precipitation Changes during the Study
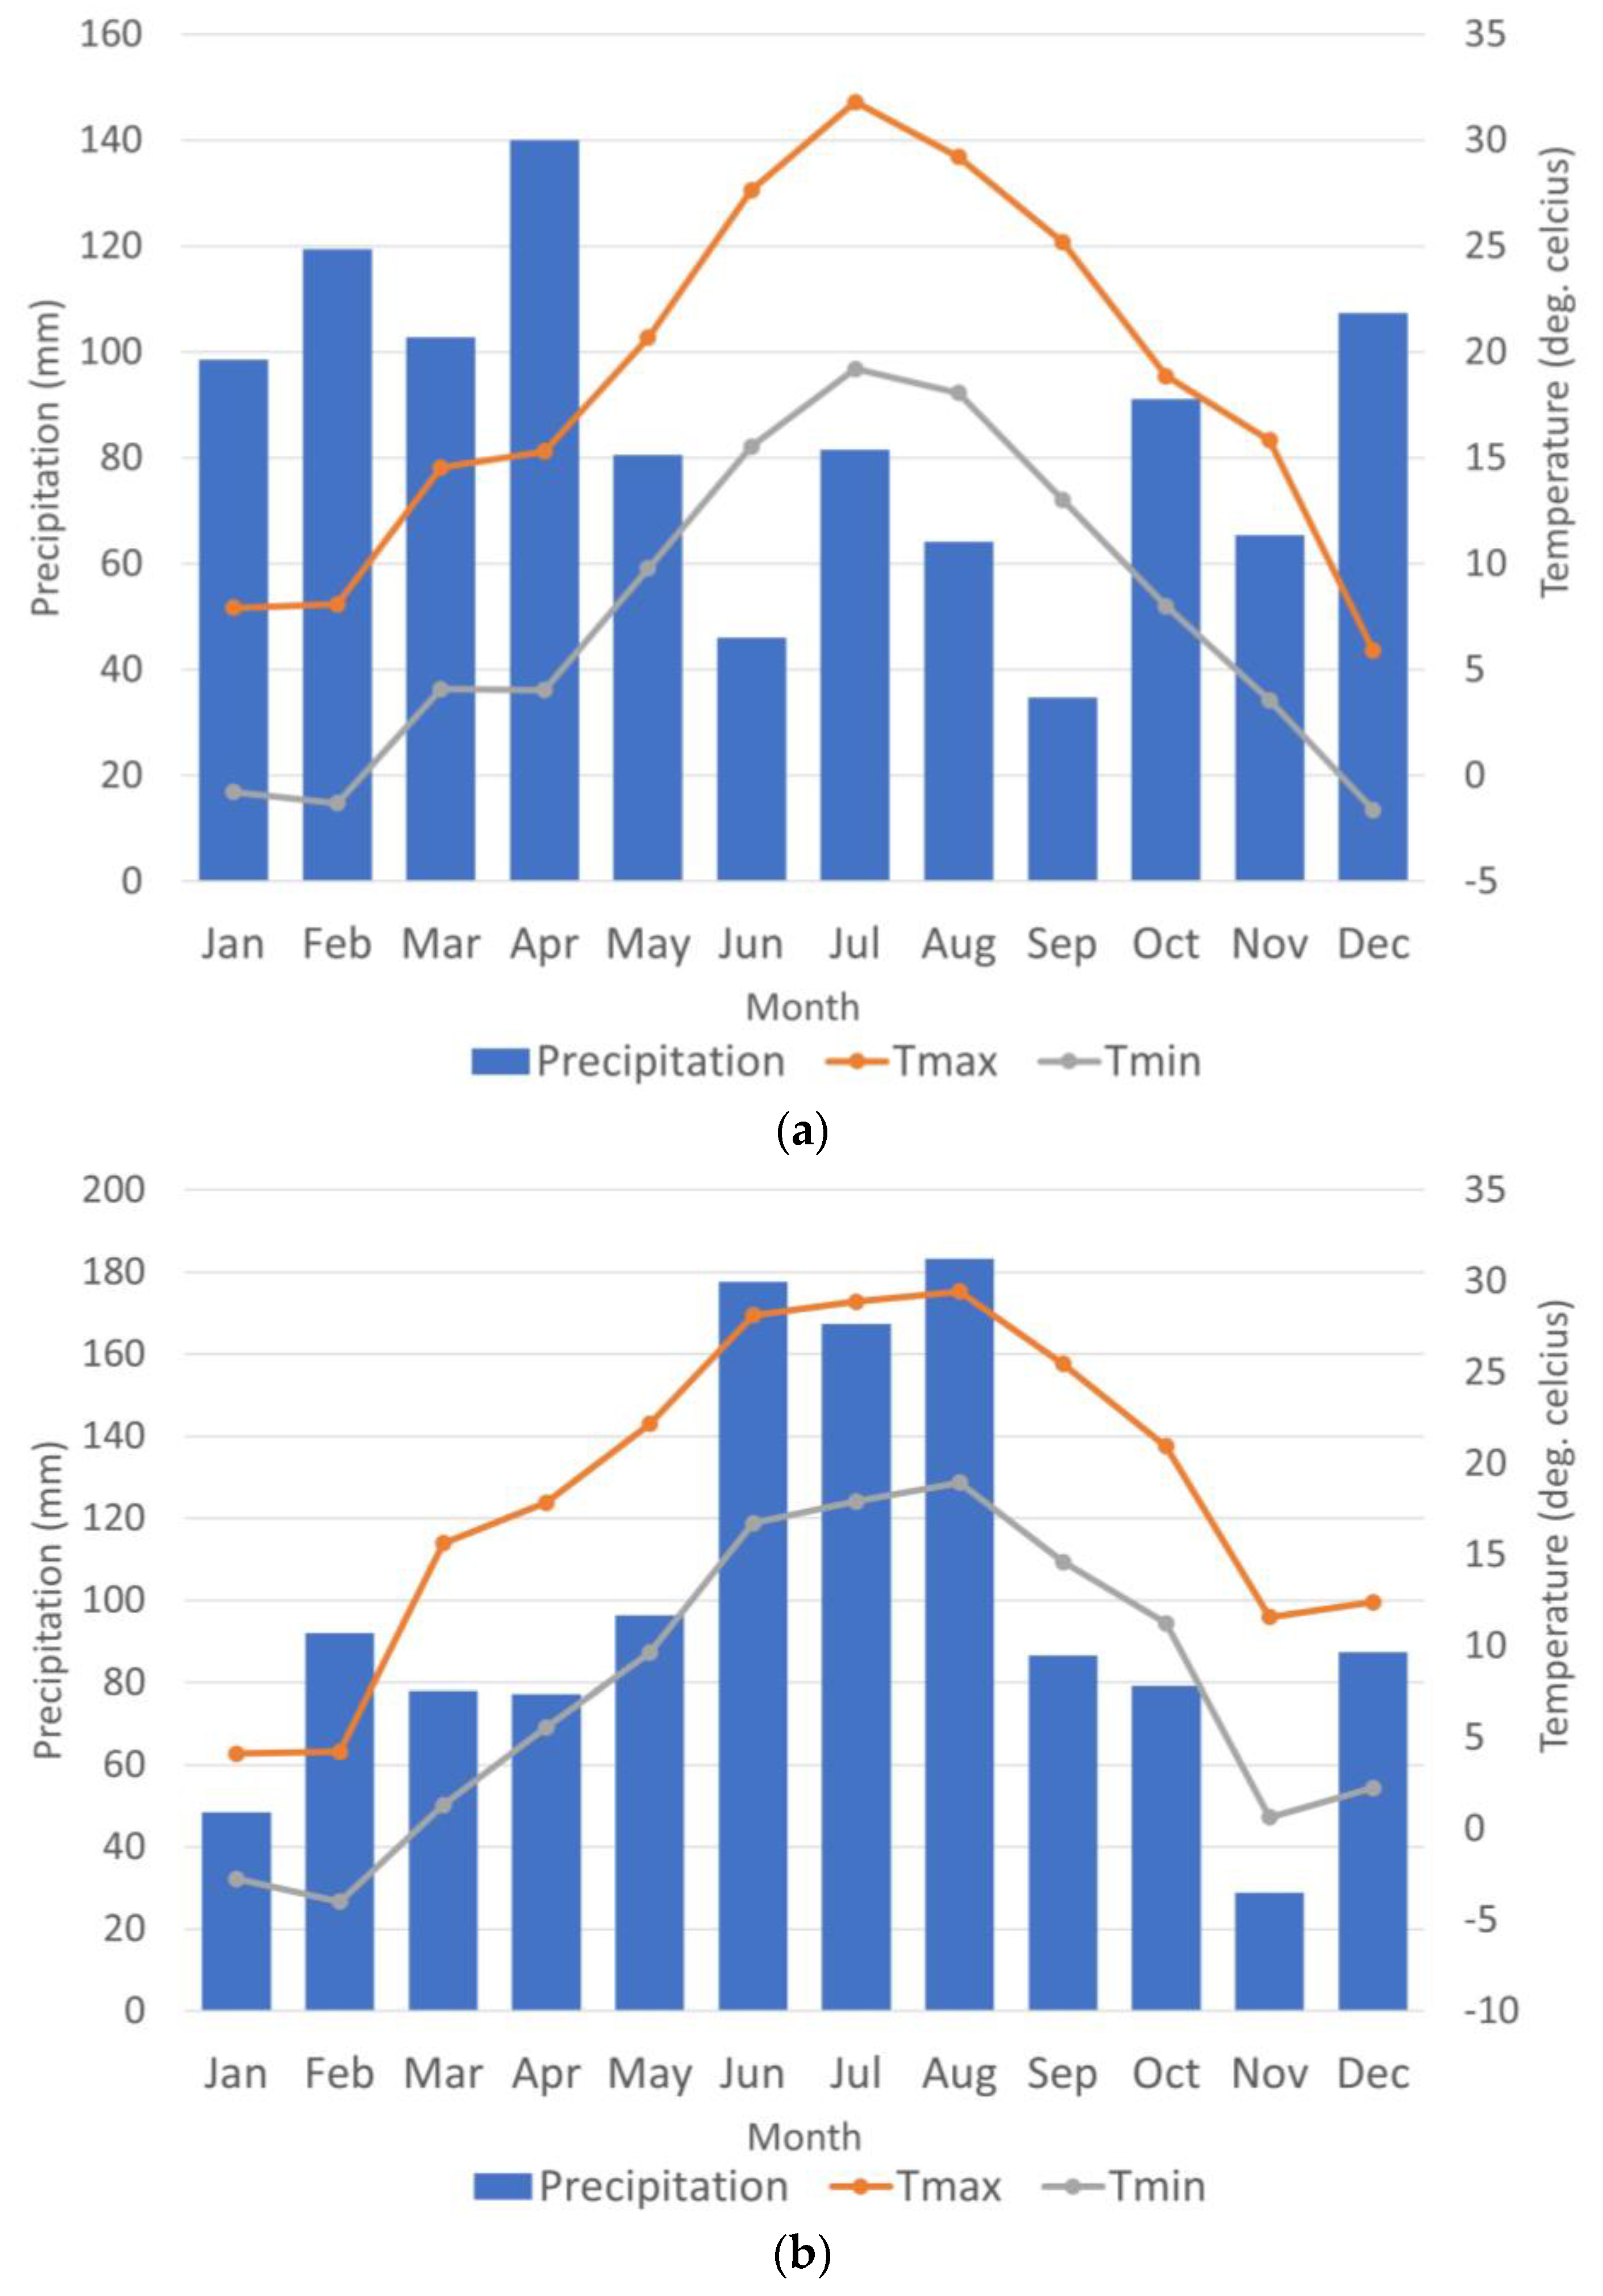
The average annual precipitation for 2020–2021 was 1117 mm, with 2021 (1202 mm) experiencing a 16% increase over 2020 (1031 mm). Based on monthly averages, April was the wettest month of 2020 (119 mm), while August was the wettest month of 2021 (183 mm) (Figure 2). September (35 mm) and November (29 mm) were the driest months of 2020 and 2021, respectively. Temperatures for both 2020 and 2021 showed a similar pattern with high temperatures (20 deg. C to 29 deg. C) from May to August (Figure 2). The lowest maximum (Tmax) and minimum temperature (Tmin) were 8 deg. C and −0.8 deg. C, respectively, for January 2020 (Figure 2). Similarly, in January 2021, the lowest maximum (4 deg. C) and minimum temperature (−2 deg. C) were observed.
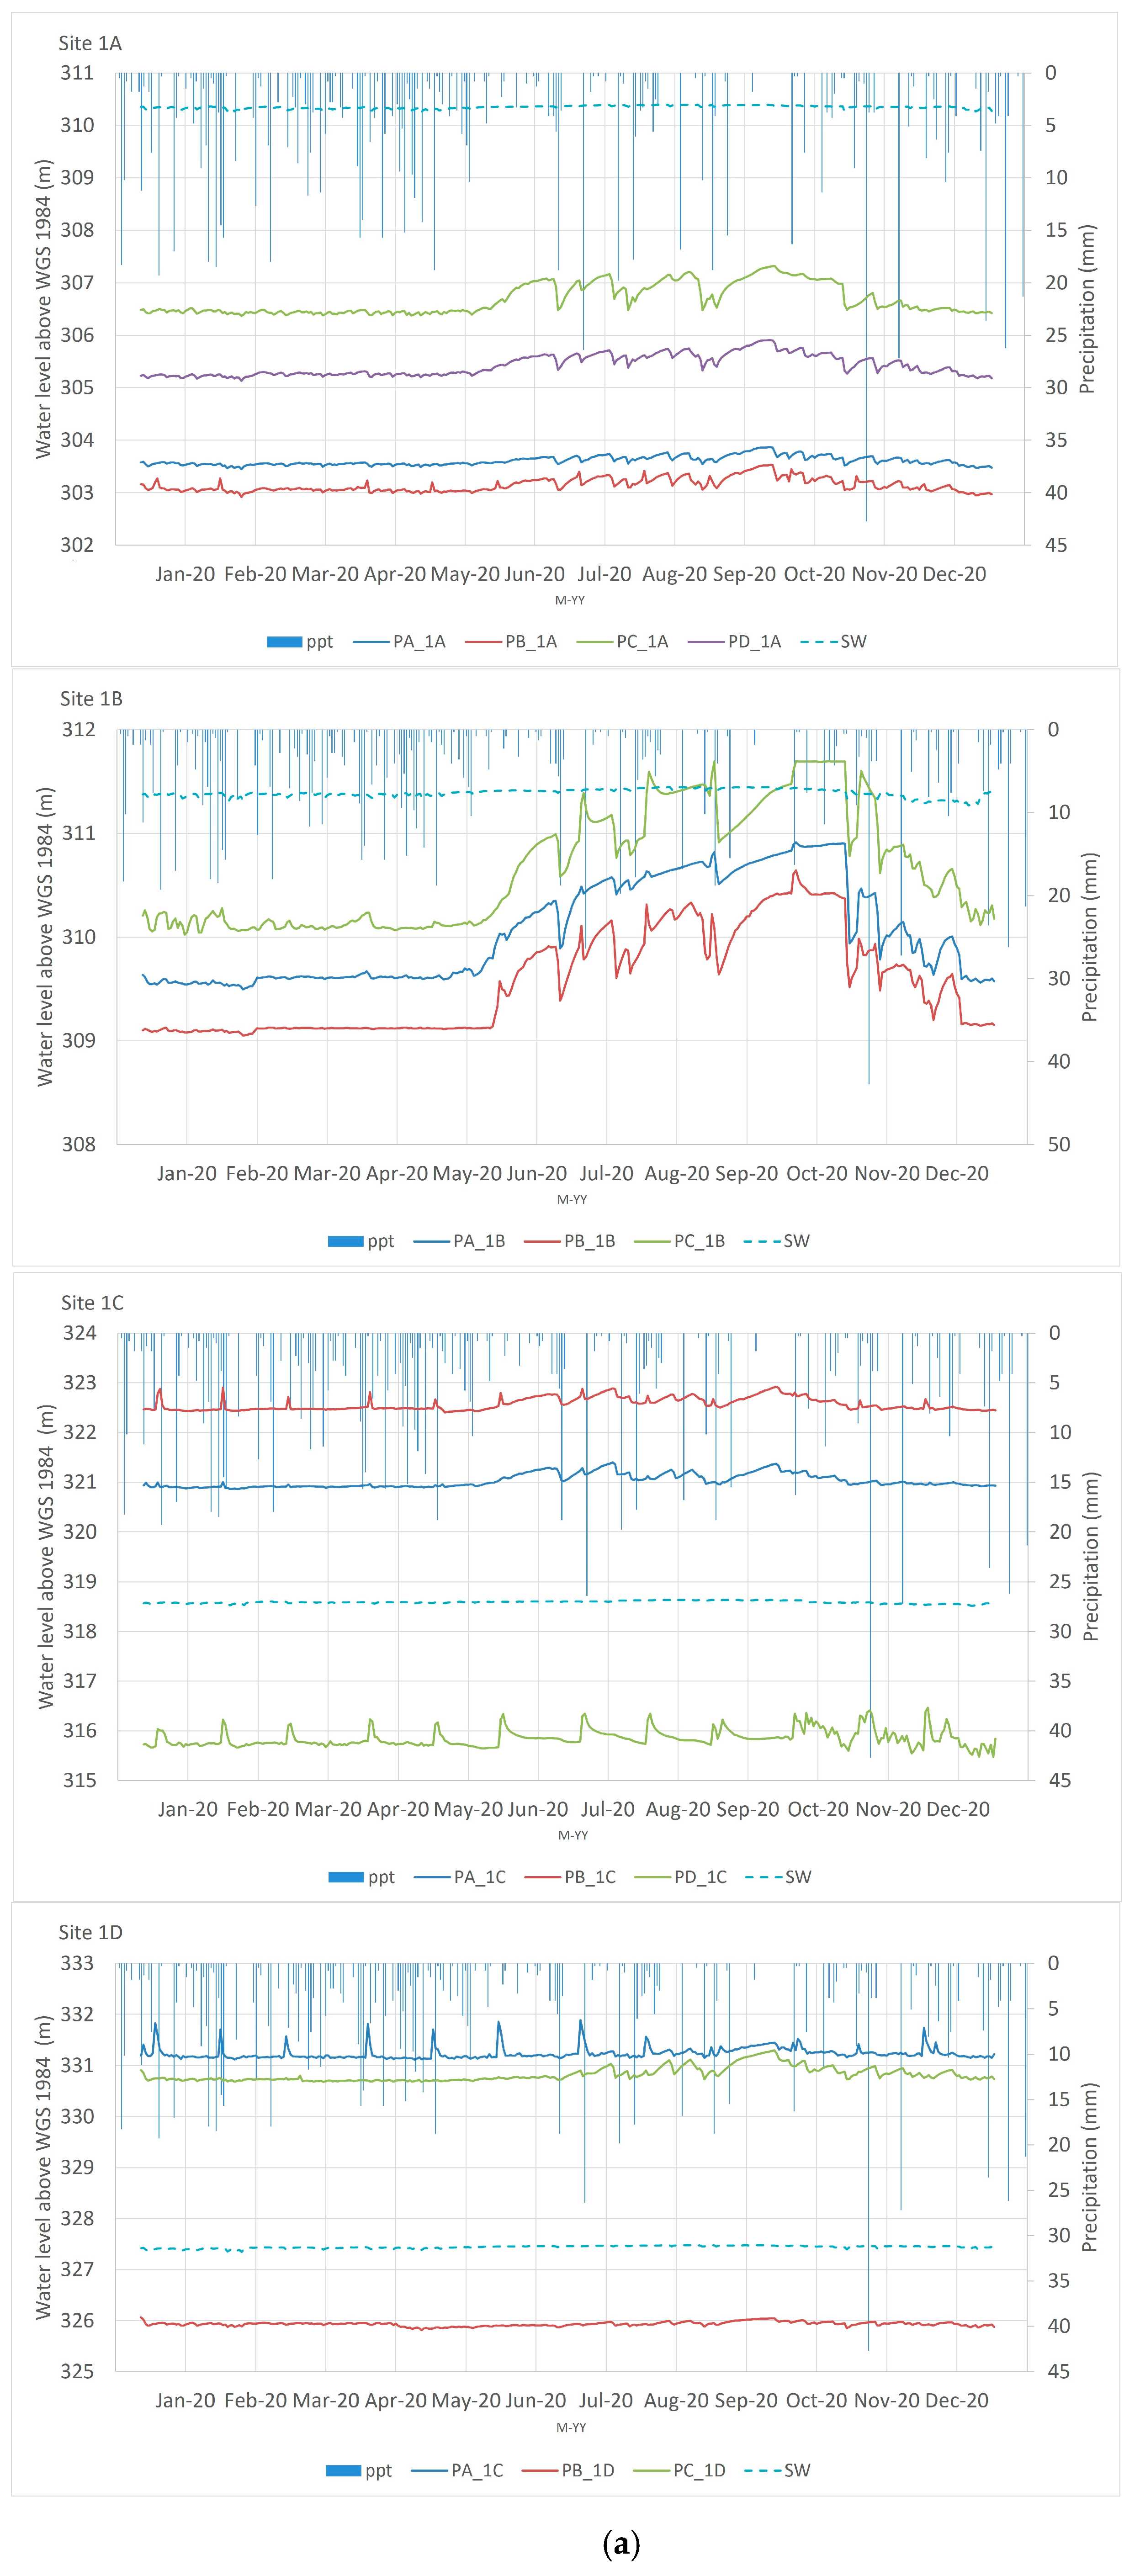
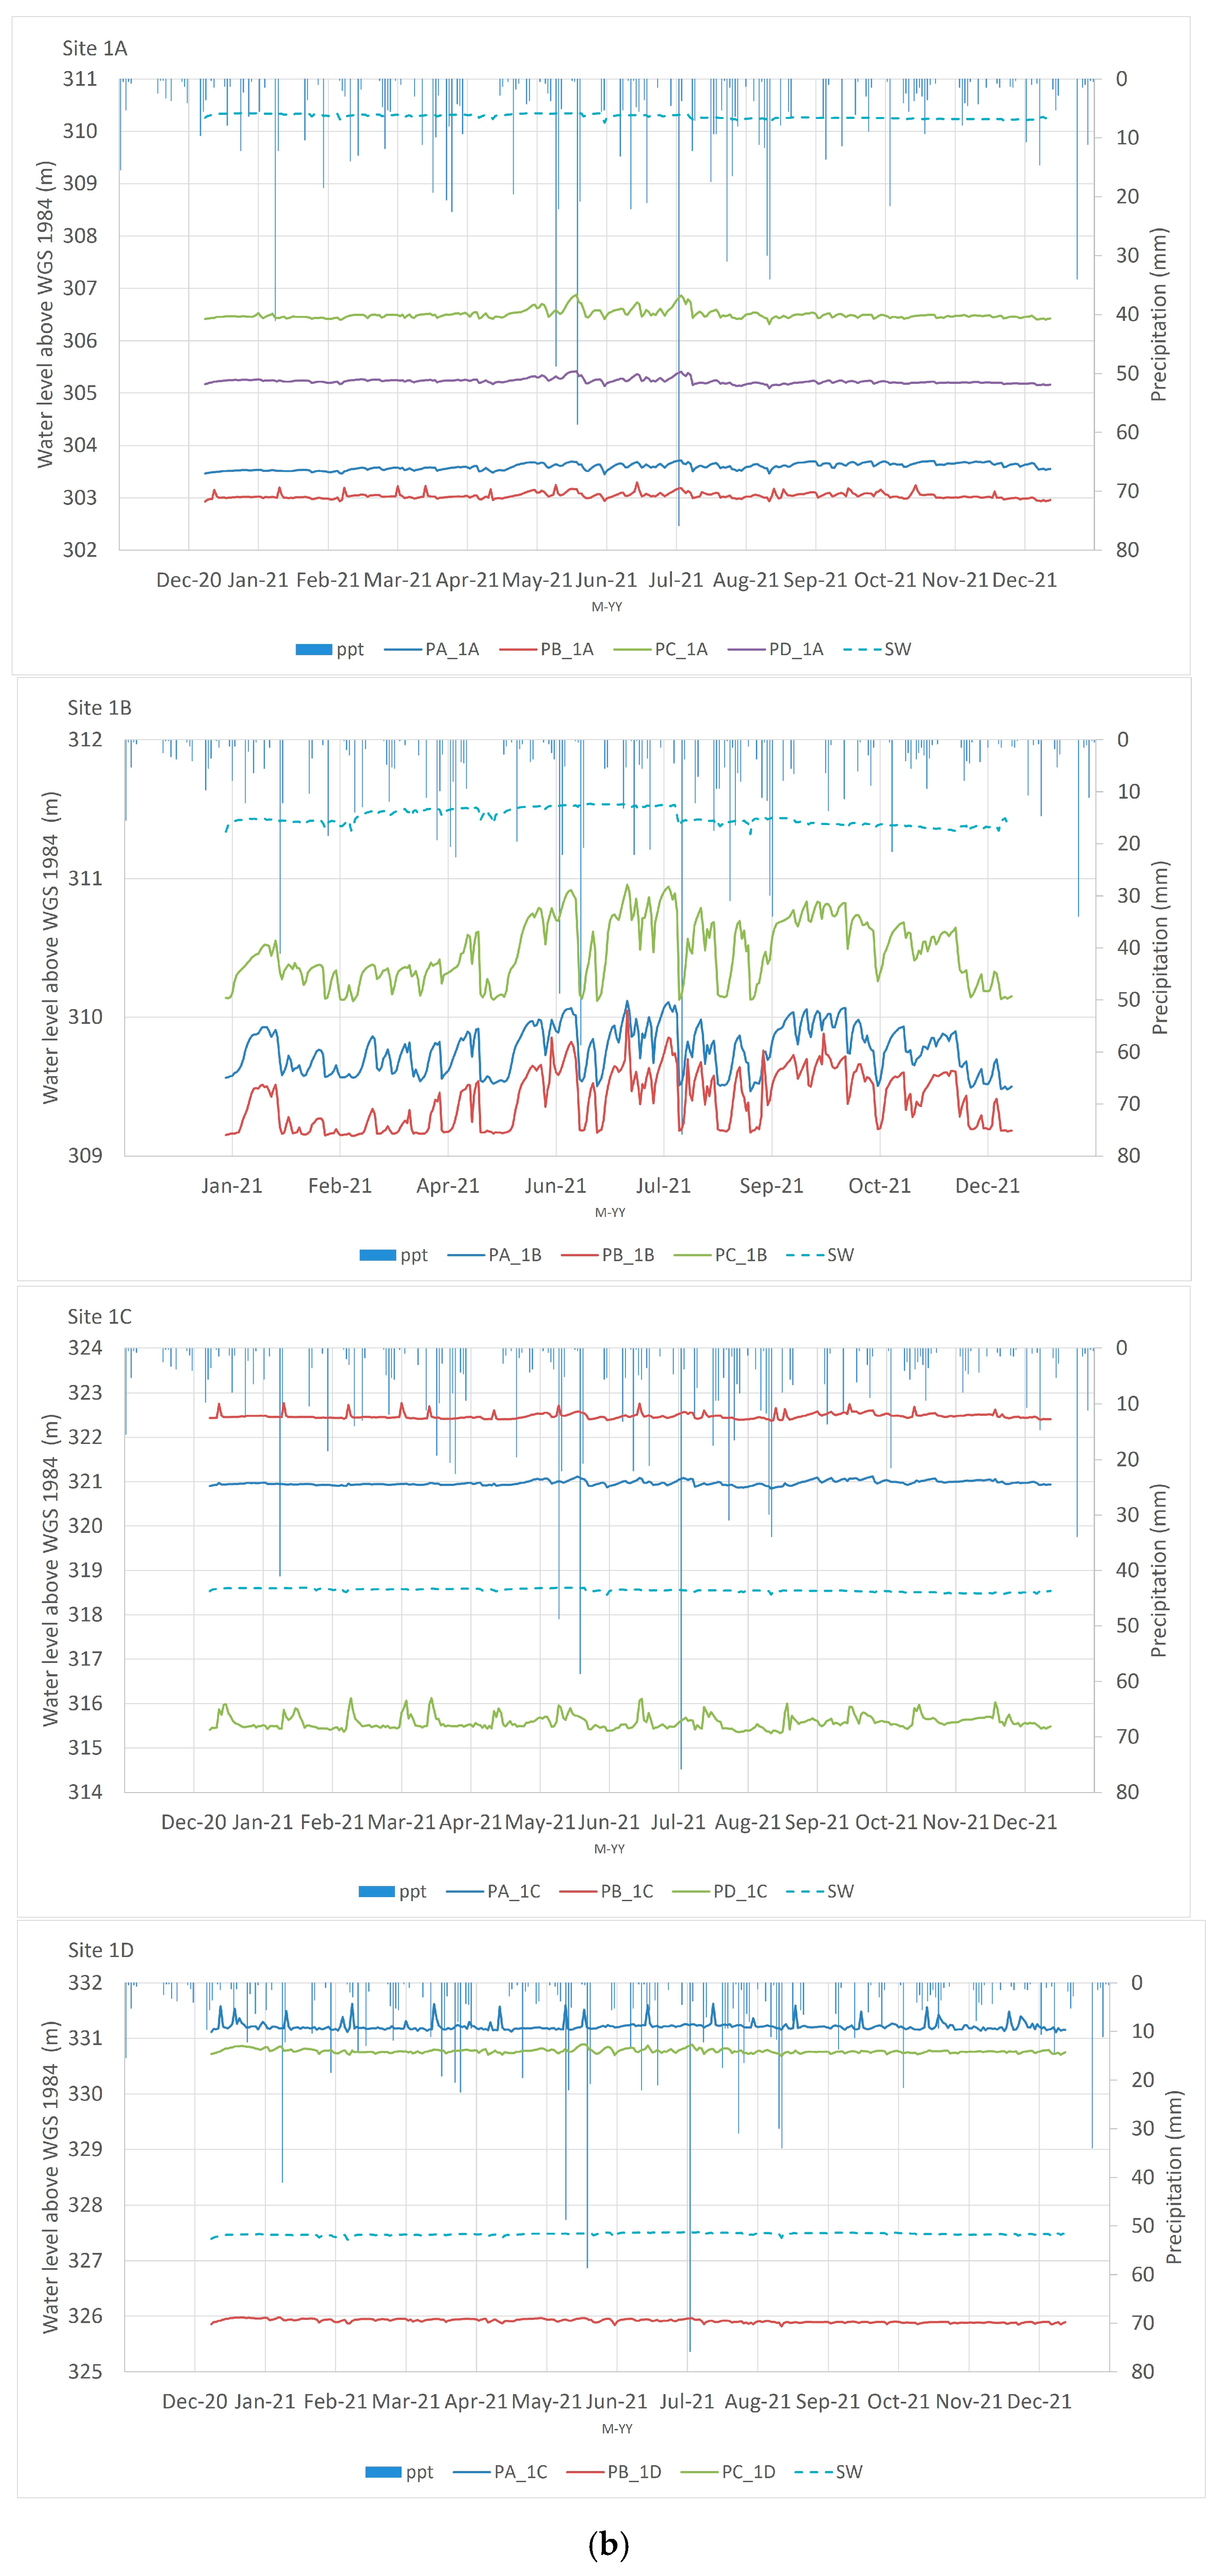
SGW responded to precipitation events by exhibiting higher water levels from June to October 2020, particularly at sites 1A and 1B (Figure 3). Sites 1C and 1D showed minor fluctuations in SGW levels with precipitation (Figure 3). Overall, considering the average for the study period (2020–2021), for the downstream sites 1A and 1B, creek stage was higher than the SGW, displaying losing stream conditions, with differences ranging from 7.22 m to 0.42 m (Figure 3, Table 2). Except for one piezometer, upstream sites 1C and 1D displayed higher SGW levels than creek stage, exhibiting gaining stream conditions. Considering the daily average of 2020–2021, piezometer PC at site 1B showed higher SGW levels than the creek in August and October 2020, demonstrating seasonal gaining stream conditions (Figure 3). For upstream sites 1C and 1D, an overall gaining stream condition was observed, except for piezometers PD and PB, respectively (Figure 3).
It is understood that interactions between SW and SGW, as indicated by gaining and losing stream conditions, influence water flow directions and nutrient transport [16,45,46]. For instance, Kwon et al. [16] demonstrated that the groundwater level was higher in the upstream high-elevation area than the stream water level, leading to a gaining stream condition. The authors proposed that elevated SW nitrogen (N) and phosphorus (P) concentrations were linked to SGW flow to the stream during gaining stream conditions. Musolff et al. [46] further suggested that the spatiotemporal dynamic of groundwater head were the dominant control of water flow direction and NO3-N concentration changes. Pistocchi et al. [47] emphasized the significance of in-stream processes such as retention, sorption, and diffuse nutrient inputs from water table discharge in delineating source and buffer areas within the drainage network. Ruiz et al. [48], supported this argument emphasizing the role of stream water mixture with SGW in governing nutrient fate and transport. Thus, analyzing spatiotemporal nutrient concentration dynamics necessitates an understanding of SW and SGW nutrient concentrations in relation to water flow directions, particularly in the context of gaining-losing stream conditions.
3.2. Intersite Spatial and Seasonal Nutrient Concentrations
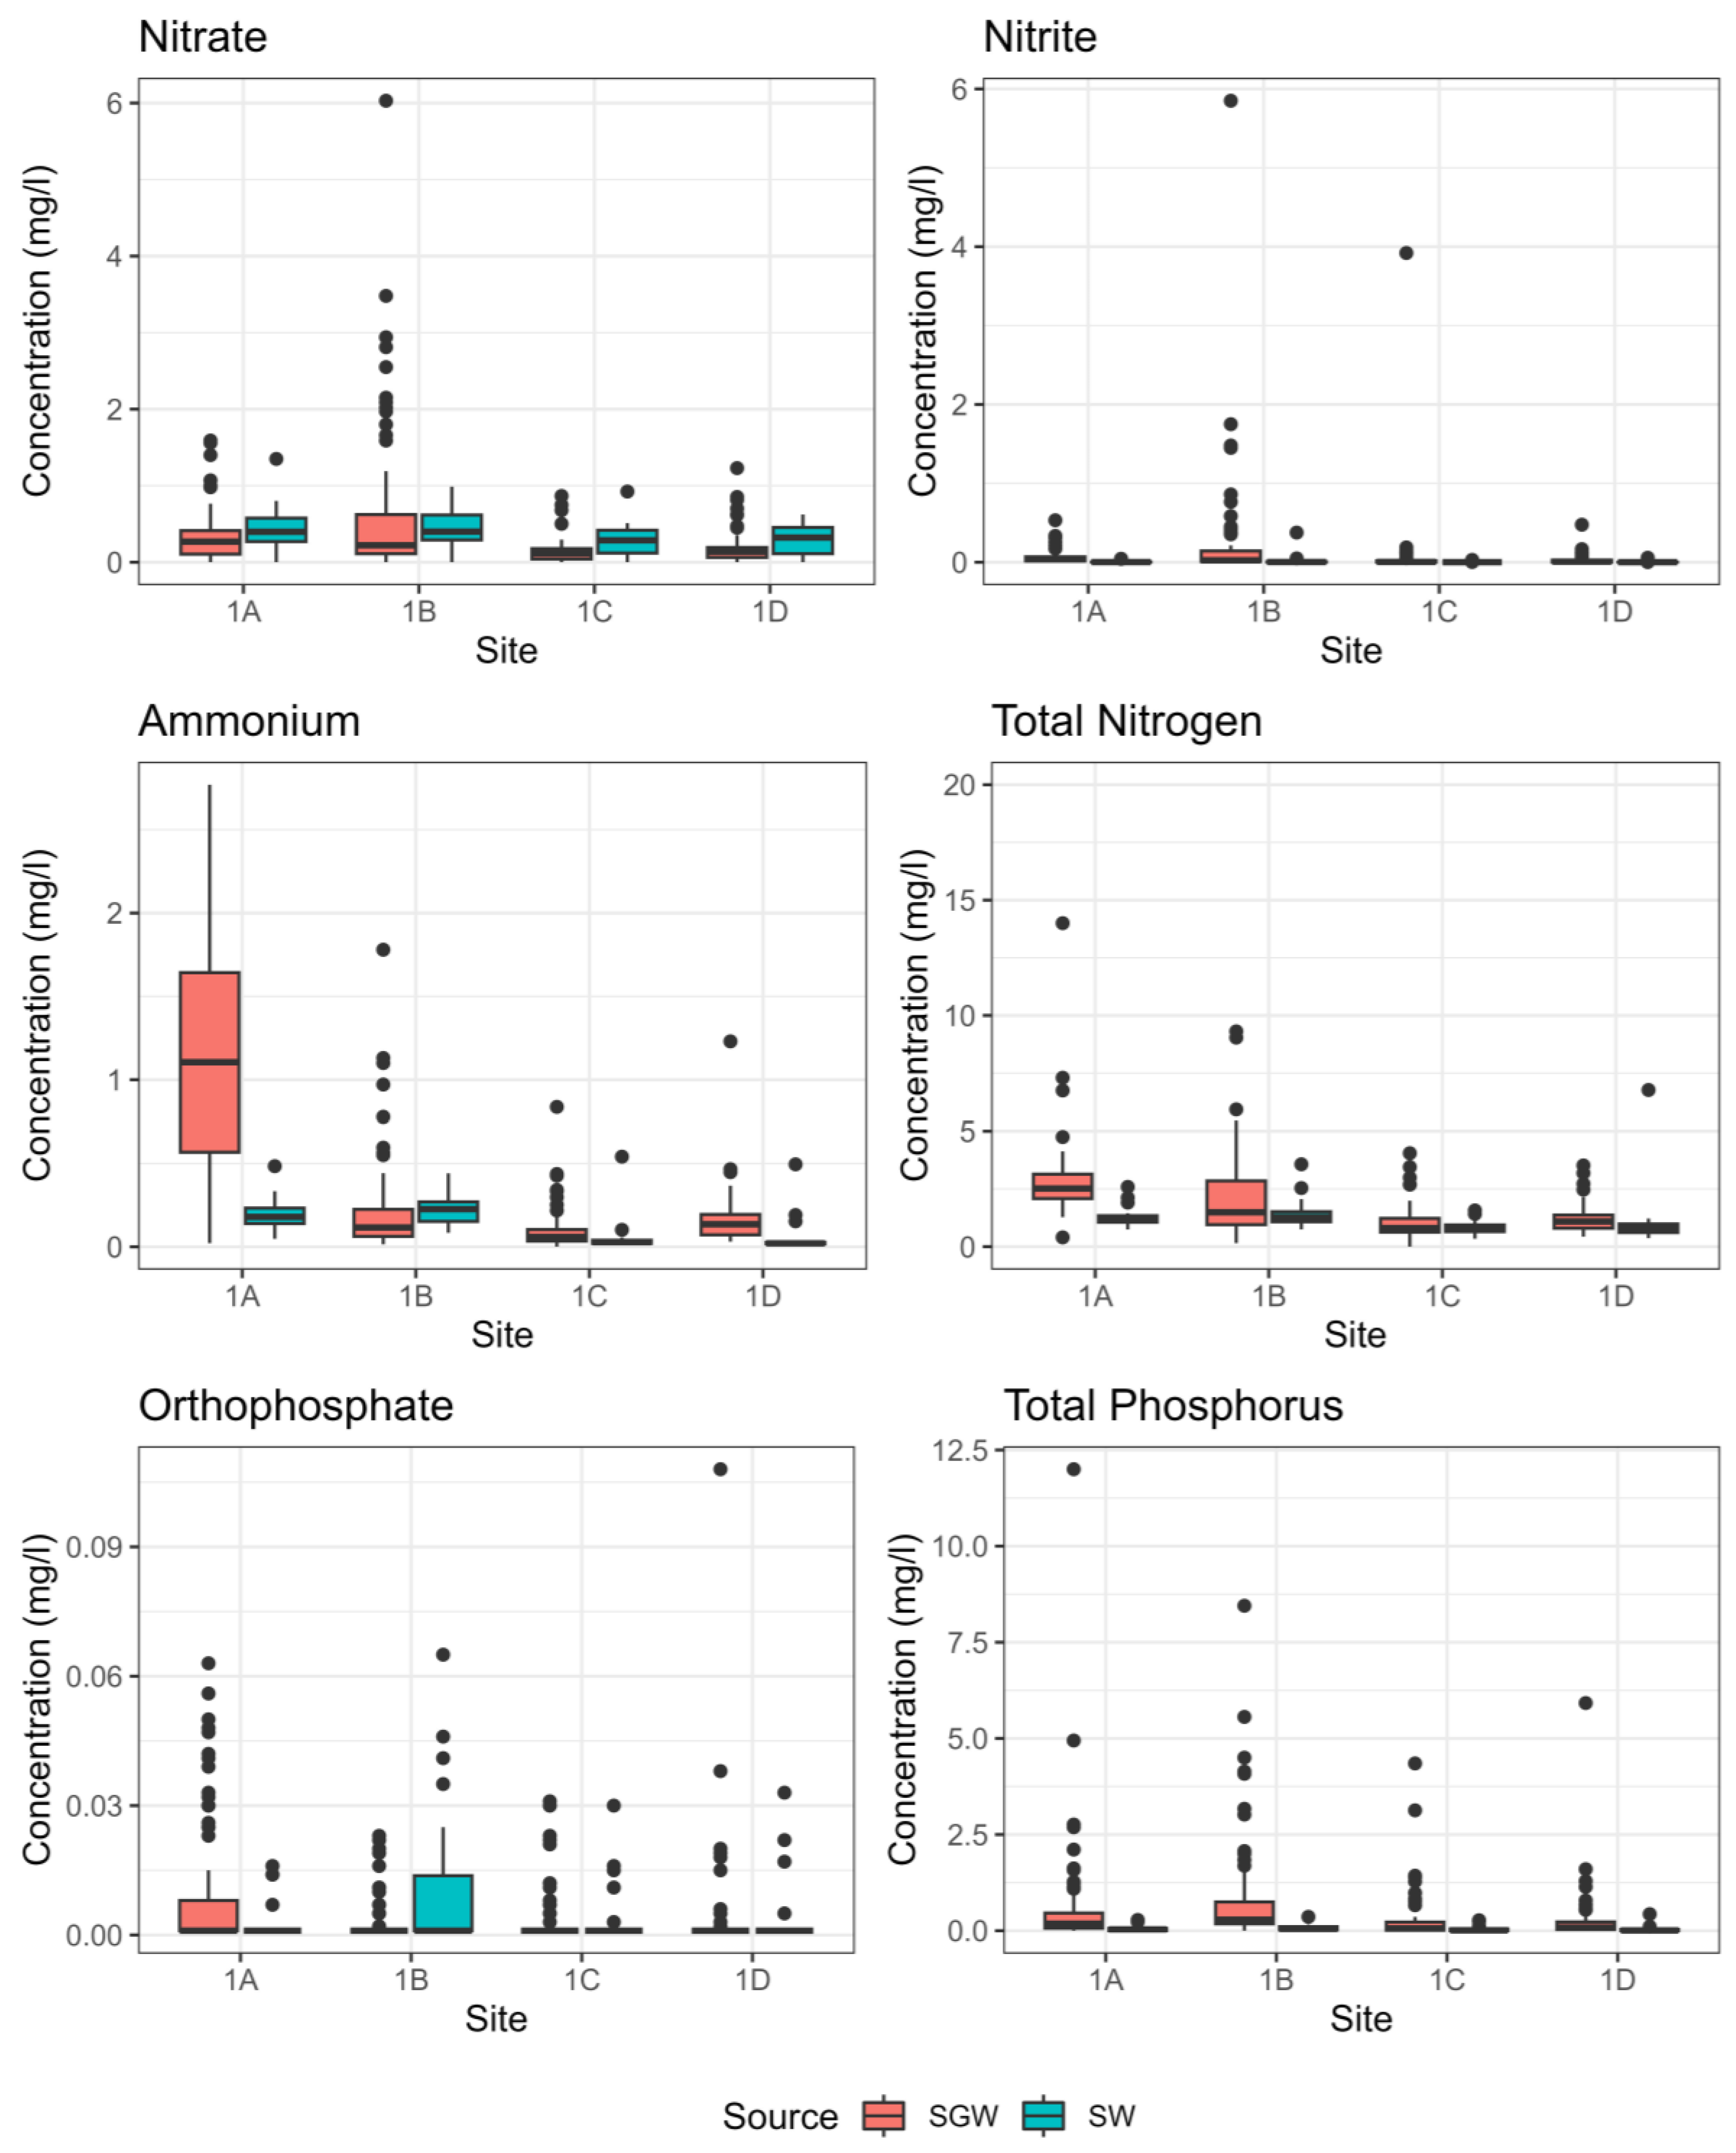
During the study period (2020–2021), total nitrogen (total_N) and total phosphorus (total_P) concentrations were significantly higher in SGW than in SW (p < 0.05). However, there were no significant differences (p > 0.05) in NO3-N, NO2-N, NH4-N, and PO43-P concentrations between SW and SGW, and these constituents exhibited no significant variations across the monitoring sites (p > 0.05). Notably, SW exhibited a higher NO3-N concentration (0.42 mg/L), while SGW displayed an elevated NH4-N concentration (1.55 mg/L) compared to other nitrogen species (Figure 4, Table 3). Gootman et al. [26] similarly suggested nutrient concentration differences between SW and SGW, with SGW showing higher NO2-N and NH4-N concentrations. The authors concluded that water source type (i.e., SW and SGW) and corresponding flow patterns, SW–SGW interactions, and associated catchment land use were driving the differences.
Generally, soil is a major reservoir of N in wetlands, and organic matter is continuously being decomposed to NH4-N, which can directly leach to SGW [15,19]. In addition, high saturation levels in wetland soils (shallow GW) can facilitate redox conditions and lead to denitrification and, therefore, lower nitrate concentrations [12,15,16]. Furthermore, SGW often exhibits lower NO3-N concentrations, possibly influenced by its proximity to vegetation and enhanced plant NO3-N uptake [15,18,19,23]. NH4-N transforms to NO3-N in high aerobic conditions of SW [15]. Overall, the average NO3-N concentration across all monitoring sites was less than 1 mg/L (Table 3), suggesting minimal impact from human activities in the area [49]. Typically, NO3-N concentrations exceeding 2 mg/L indicate the influence of anthropogenic activities such as fertilizer application and wastewater treatment [49]. However, the developed areas within the study catchment have been expanding annually. In addition, SW and SGW in the riparian wetland receive seasonal water flow from adjacent areas in the catchment (Figure A1). Thus, nutrient concentrations are attributable to contributing catchment land-use practices [5,16,18,21,26]. Site 1B demonstrated higher nutrient concentrations in both SW and SGW, except for elevated SGW NH4-N and total N in 1A (Table 3). Conversely, site 1C generally exhibited lower nutrient concentrations across SW and SGW. The elevated nutrient levels in 1B may be attributed to the high residential (55.39%) land use at the catchment scale (Table 1), which caused high runoff from residential impervious surfaces that transported nutrients [17,21,50,51]. In contrast, the prevalence of forested regions (68%) at site 1C (Table 1) likely contributed to lower nutrient transport due to higher plant uptakes and higher infiltration rates of forest soils, as demonstrated in multiple previous investigations [5,15,23].
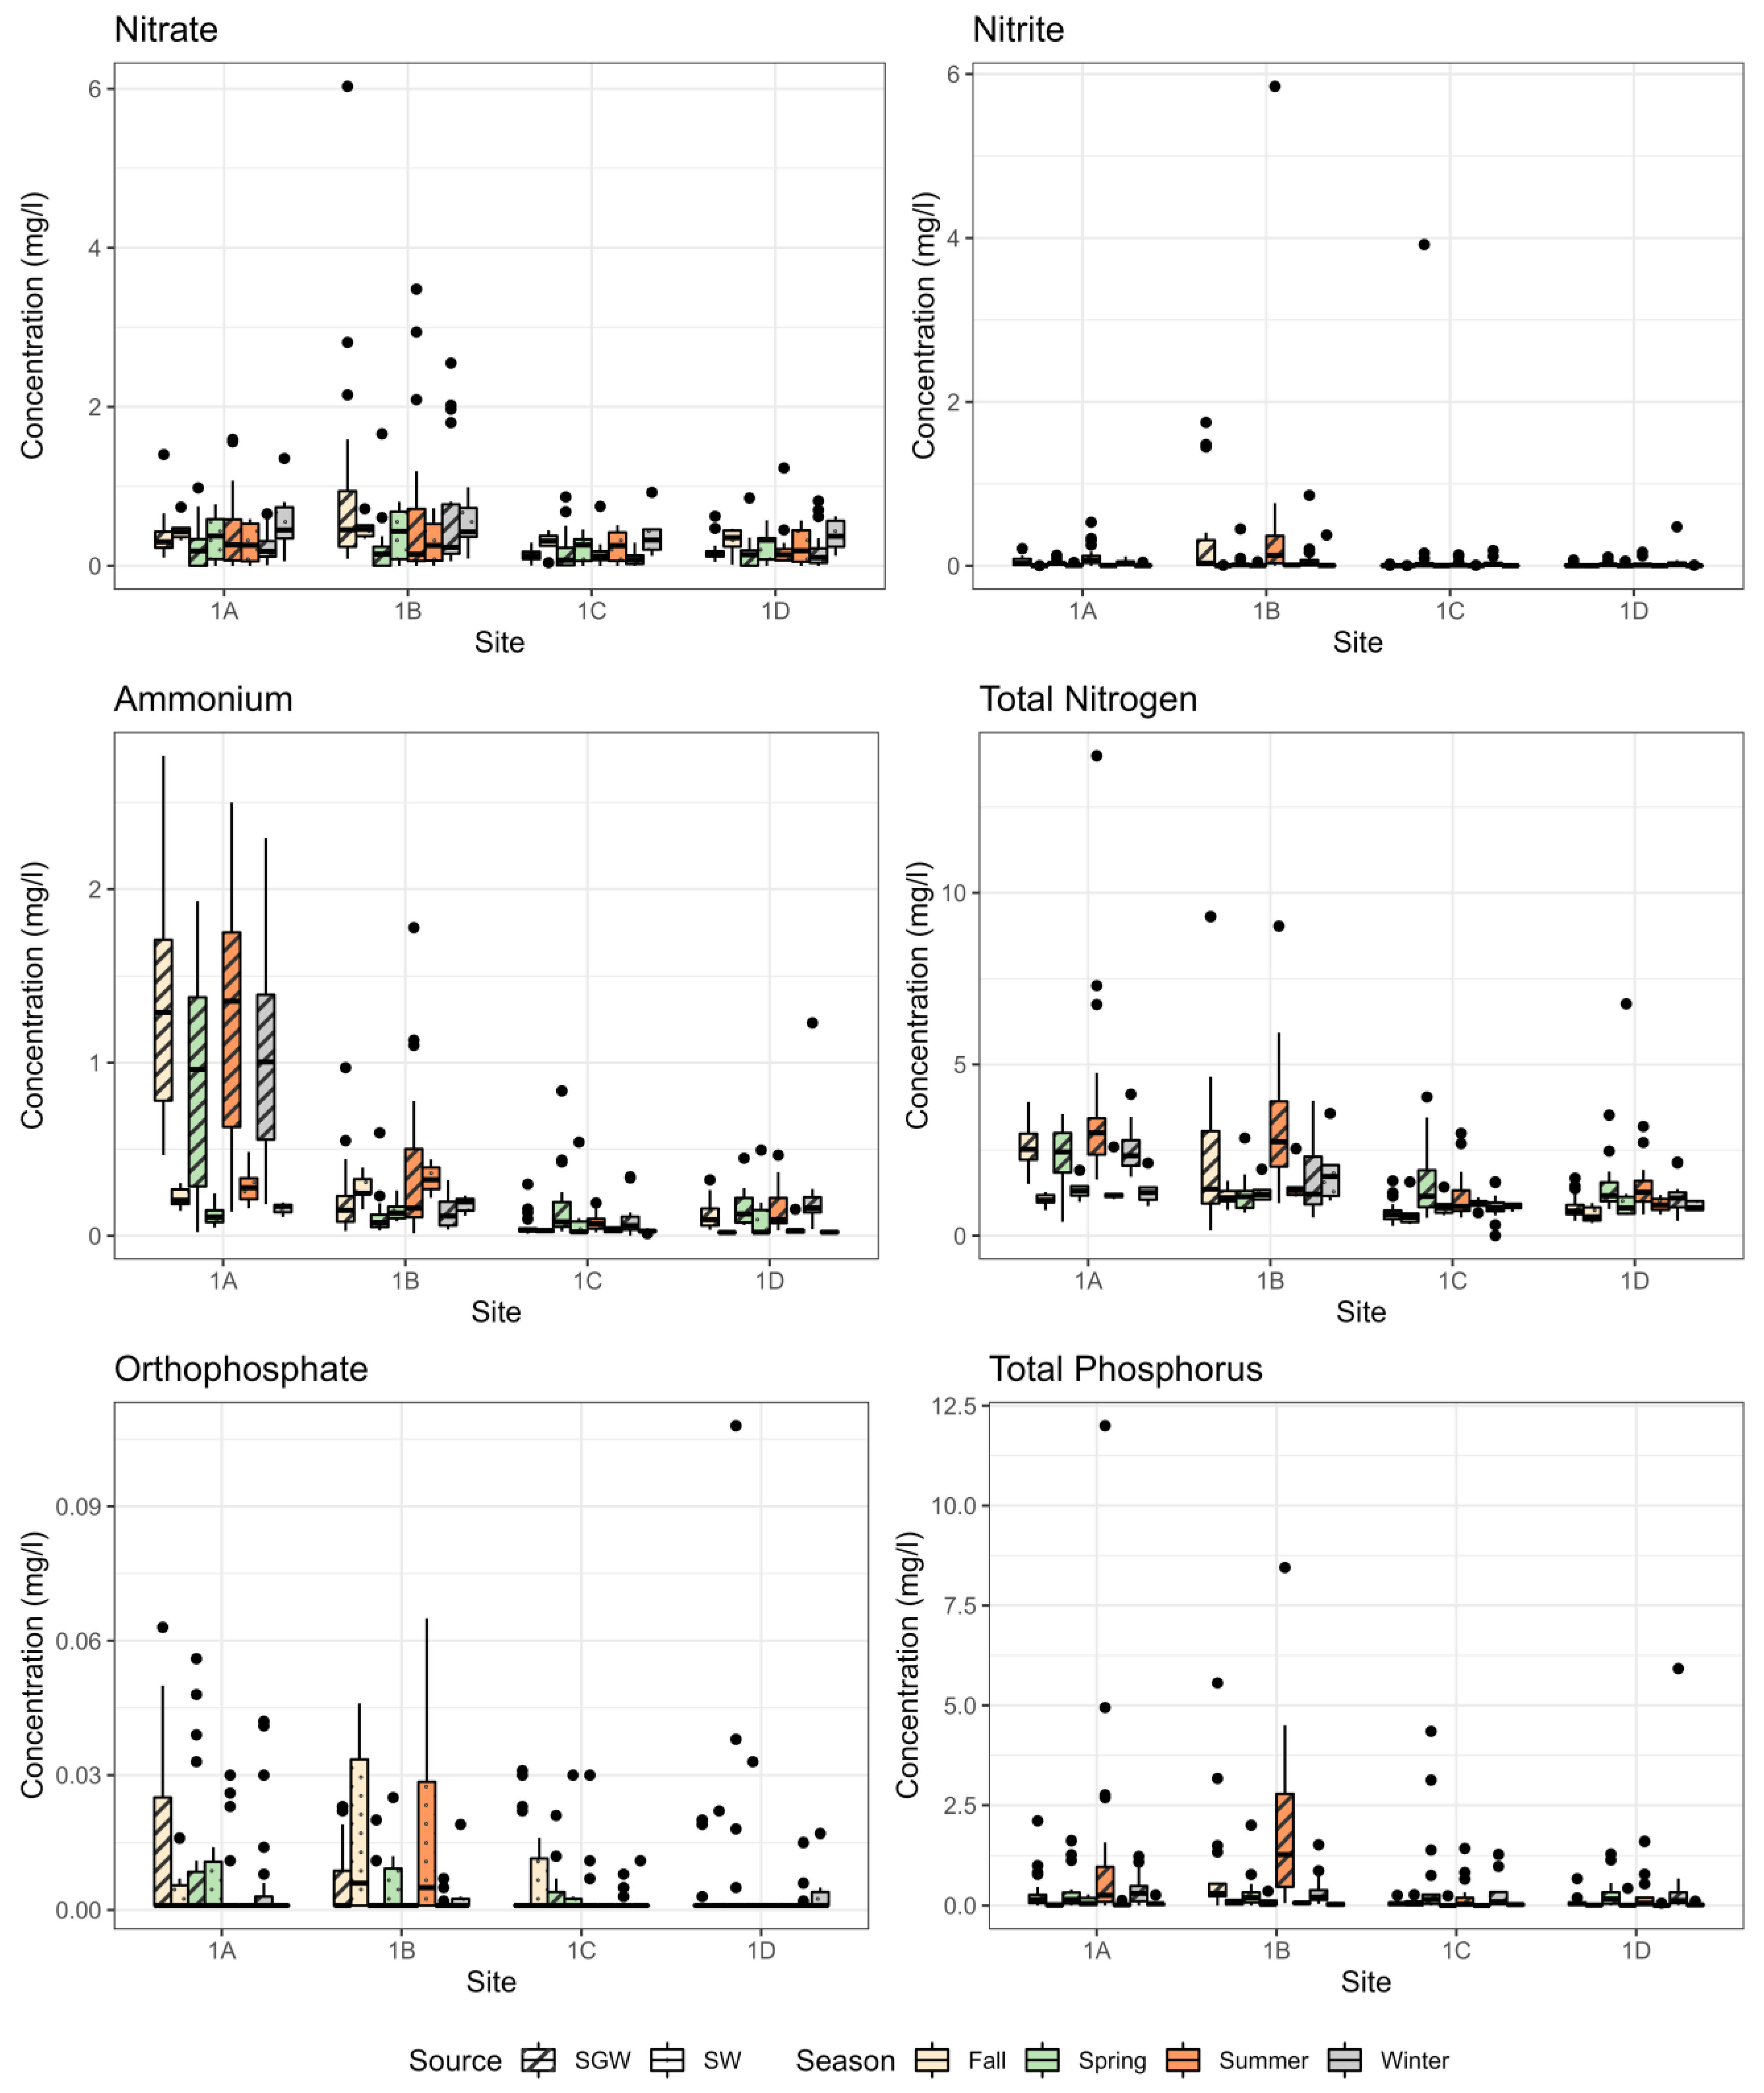
To analyze the seasonal variation of nutrient concentrations, the results were averaged across the fall, spring, summer, and winter seasons for the study period (2020–2021). In SW, NO3-N concentrations were significantly different for all four seasons (summer, fall, winter, and spring) (p < 0.05), whereas SGW NO3-N concentrations did not significantly differ seasonally (p > 0.05) (Figure 5). For all the monitoring stations, SW NO3-N concentrations in summer and fall were significantly higher than winter concentrations (p < 0.05). The seasonal fluctuation of NO3-N concentration may be attributed to precipitation patterns and resulting SW and SGW fluctuations (Figure 3). Runoff associated with high precipitation events can transport NO3-N to SW [51]. Furthermore, periodic animal grazing in the study area during summer and fall might have increased N concentrations due to excrement deposition, as discussed by Kurz et al. [52]. The authors also suggested that cattle grazing intensifies the frequency and magnitude of overland flow, resulting in more N transport to SW [52]. Additionally, during fall storms, SGW levels increased (Figure 3), presumably resulting in increased nutrient flushing from the soil that had built up during the summer months [18,51]. Although dilution induced by rainfall events is known to reduce nutrient concentrations, it is worth noting that this dilution effect may be balanced by significant nutrient leaching from the soil owing to high mineralization in the summer months [15,47,53]. There was no significant seasonal fluctuation (p > 0.05) observed in NO2-N, NH4-N, total_N, and total_P concentrations in SW and SGW for the study period (Figure 5).
3.3. Intrasite Spatial Nutrient Variation
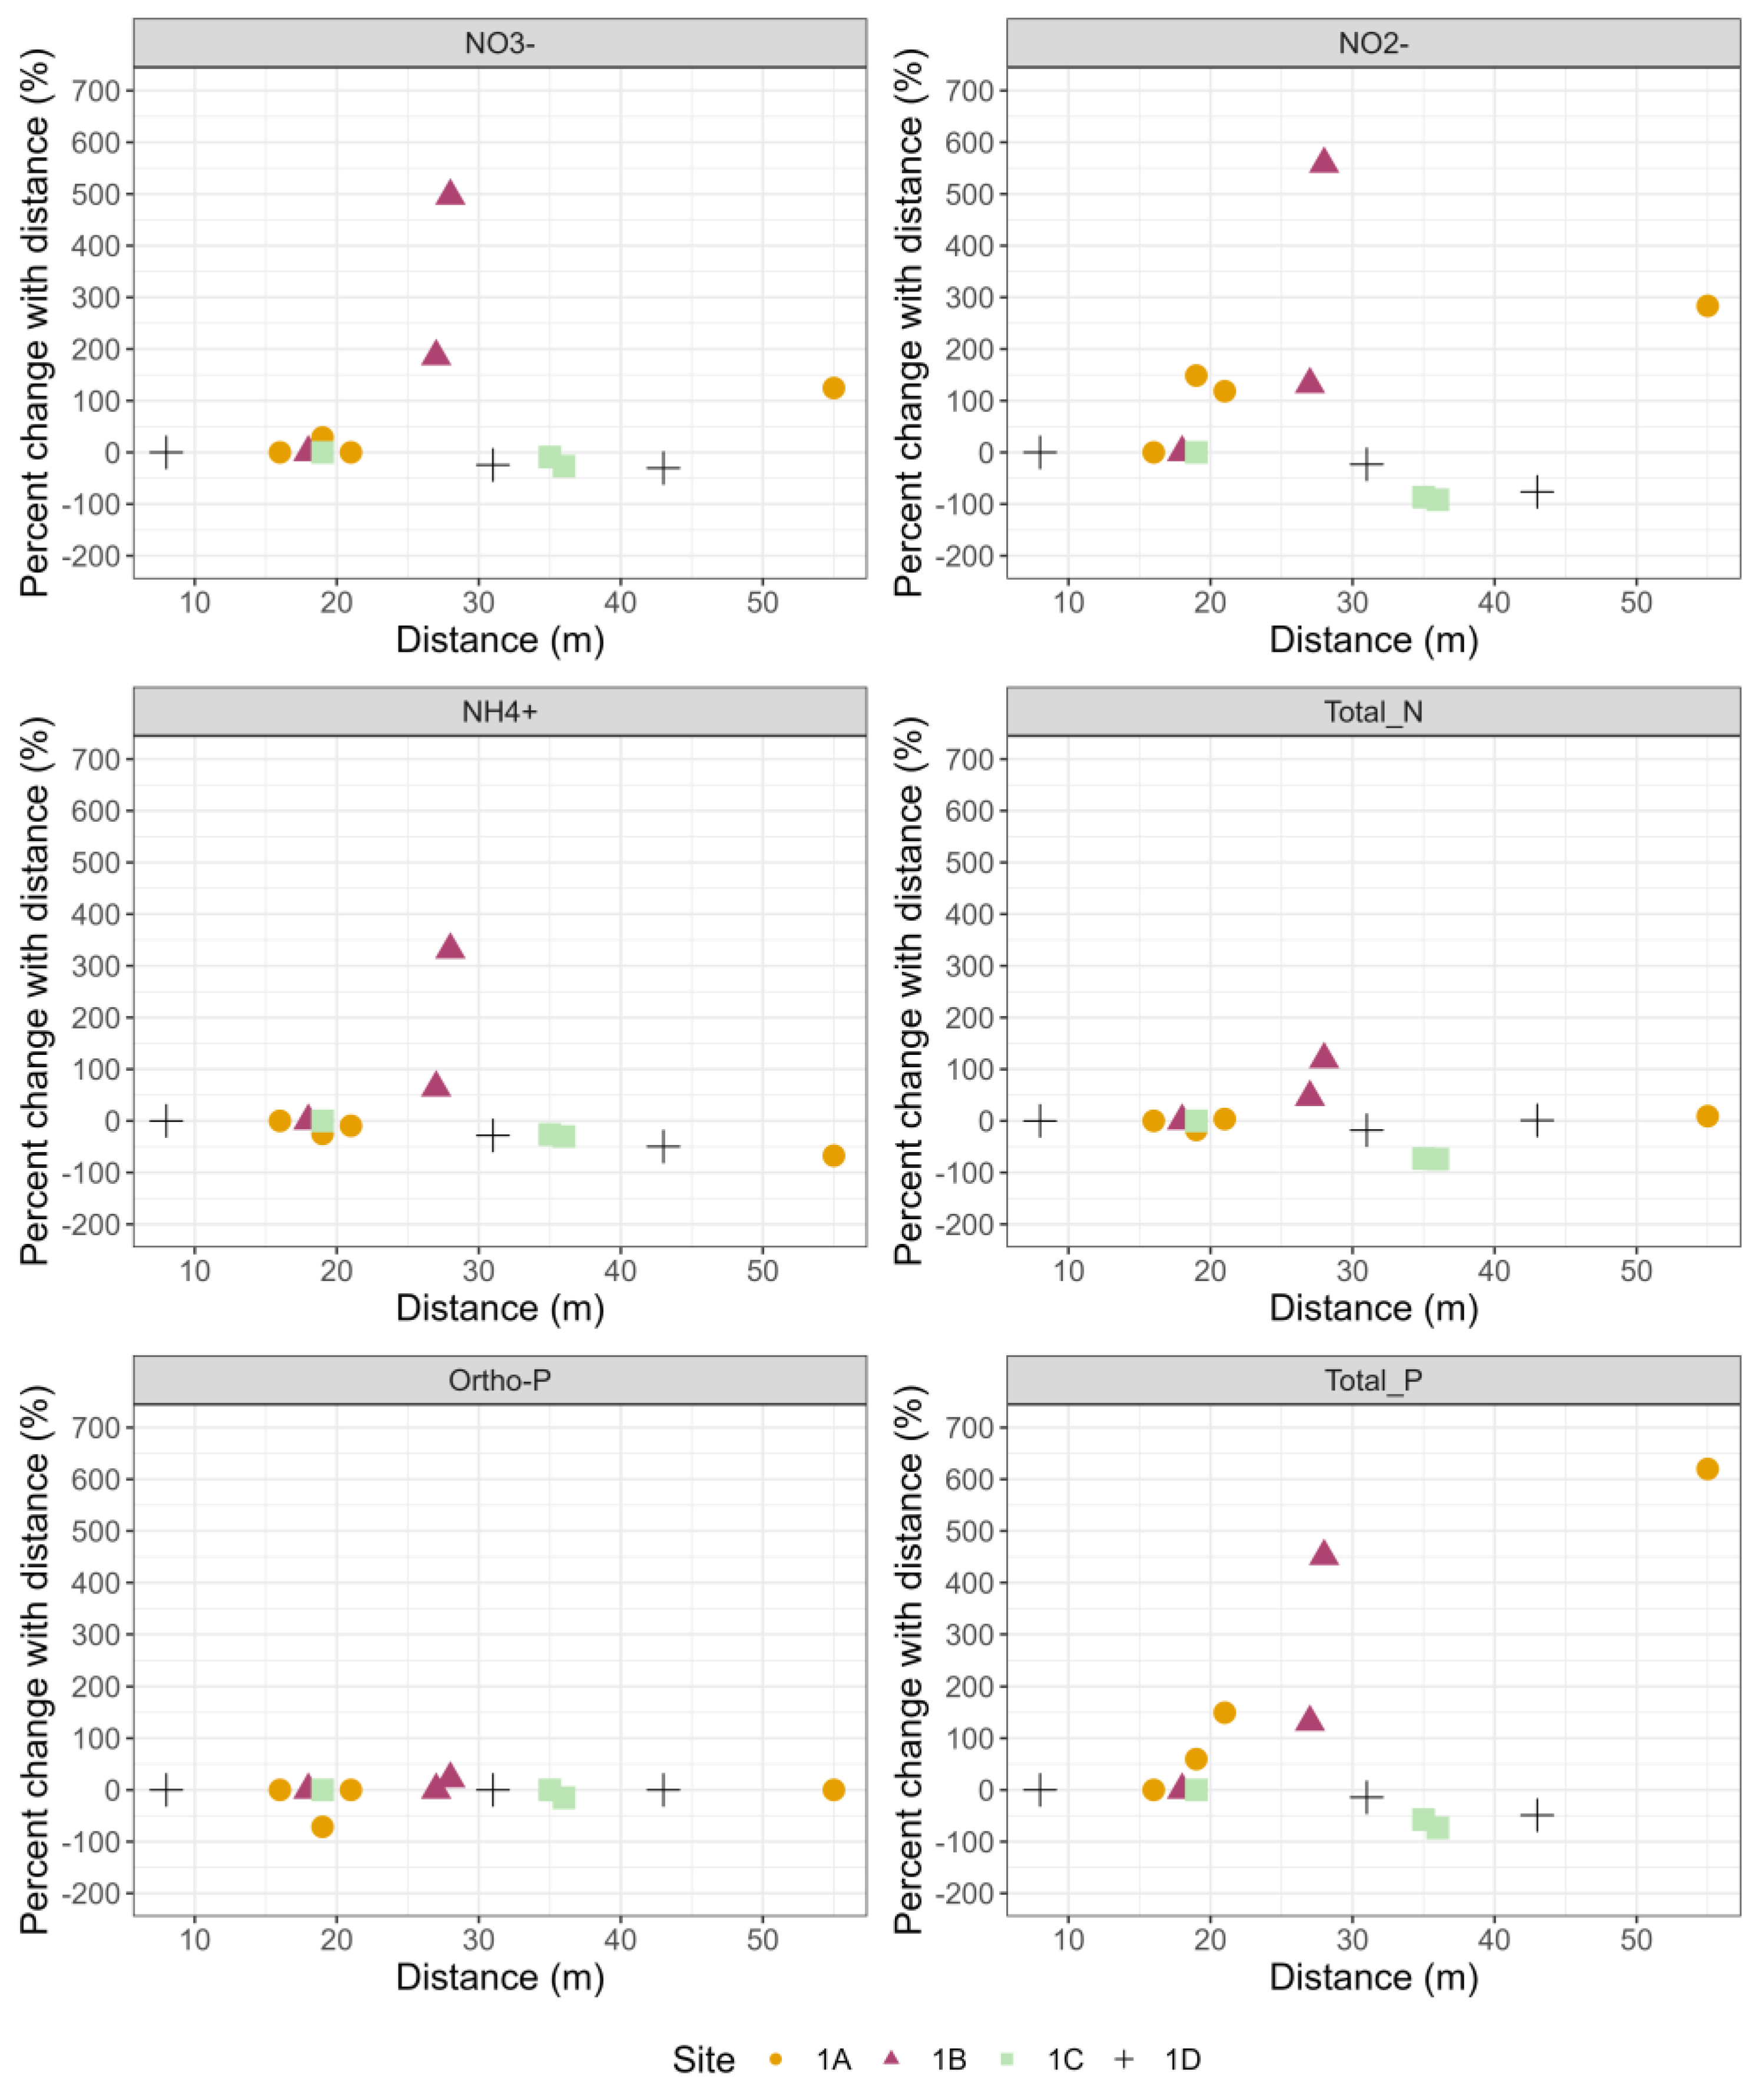
Nutrient concentration differences for the nested piezometer arrays at each monitoring site are summarized in Table 4 and Figure 6. Piezometers in upstream sites 1C and 1D represented decreased nutrient concentrations with a larger distance from the creek (Figure 6, Table 4). The closest piezometers to the creek in sites 1C and 1D had lower water tables than the reach stage, implying losing stream conditions (Figure 3, Table 2). As a result, nutrients in SW can be transported towards SGW, thereby exhibiting higher nutrient concentrations relative to SW in the closest piezometer to the creek. As the distance from the creek increased in these sites, the nutrient concentrations in piezometers decreased (Figure 6, Table 4). Previous studies have observed nutrient concentration decrease with distance from the creek, often attributing this phenomenon to subsurface sink mechanisms [53,54]. For example, Triska et al. [53] observed that wells > 4.3 m from the channel acted as significant N sink. The authors suggested that anaerobic SGW increased the denitrification potential of the site more than aerobic creek locations. Furthermore, nutrient removal mechanisms such as plant uptake contribute to nutrient attenuation [15,54]. The upstream sites of the study reach were highly forested (Table 1), making them prone to nutrient removal by plants.
However, in downstream sites 1A and 1B, nutrient concentrations increased with distance. Similar results were observed in Chinnasamy and Hubbart [24], who indicated a high concentration of nutrients with stream distance and suggested SGW flow patterns and interactions with SW are important for nutrient attenuation in riparian zones. As per the primary literature [53,54], the nutrient concentration is expected to be lower at greater distances due to dilution effects and the subsurface sink mechanism. However, high nutrient leaching from soil to SGW is assumed to offset the dilution effect [15,47]. This assumption is reasonable because the decomposition of organic matter in wetlands contributes to soil serving as a reservoir of nitrogen (N), which can subsequently leach into SGW [15]. Furthermore, plant uptake in downstream sites was presumably low due to less forest cover, resulting in less nutrient uptake and more leaching [15,54]. Additionally, piezometers in the downstream site 1A represented higher NH4-N concentrations than NO3-N (Table 4), exhibiting subsurface redox conditions as discussed by [15,24,53]. Thus, despite the flow direction from the creek to SGW (a losing stream scenario), NO3-N entering the subsurface underwent denitrification, and thus, SGW NO3-N concentration was lower than SW. Both in SW and SGW, ortho-P levels were consistently low in all piezometers, possibly attributed to sorption and the removal of sorbed ortho-P by plants and microbes in wetlands, as presented in previous research [6,18].
3.4. Principal Component Analysis (PCA) and Correlation
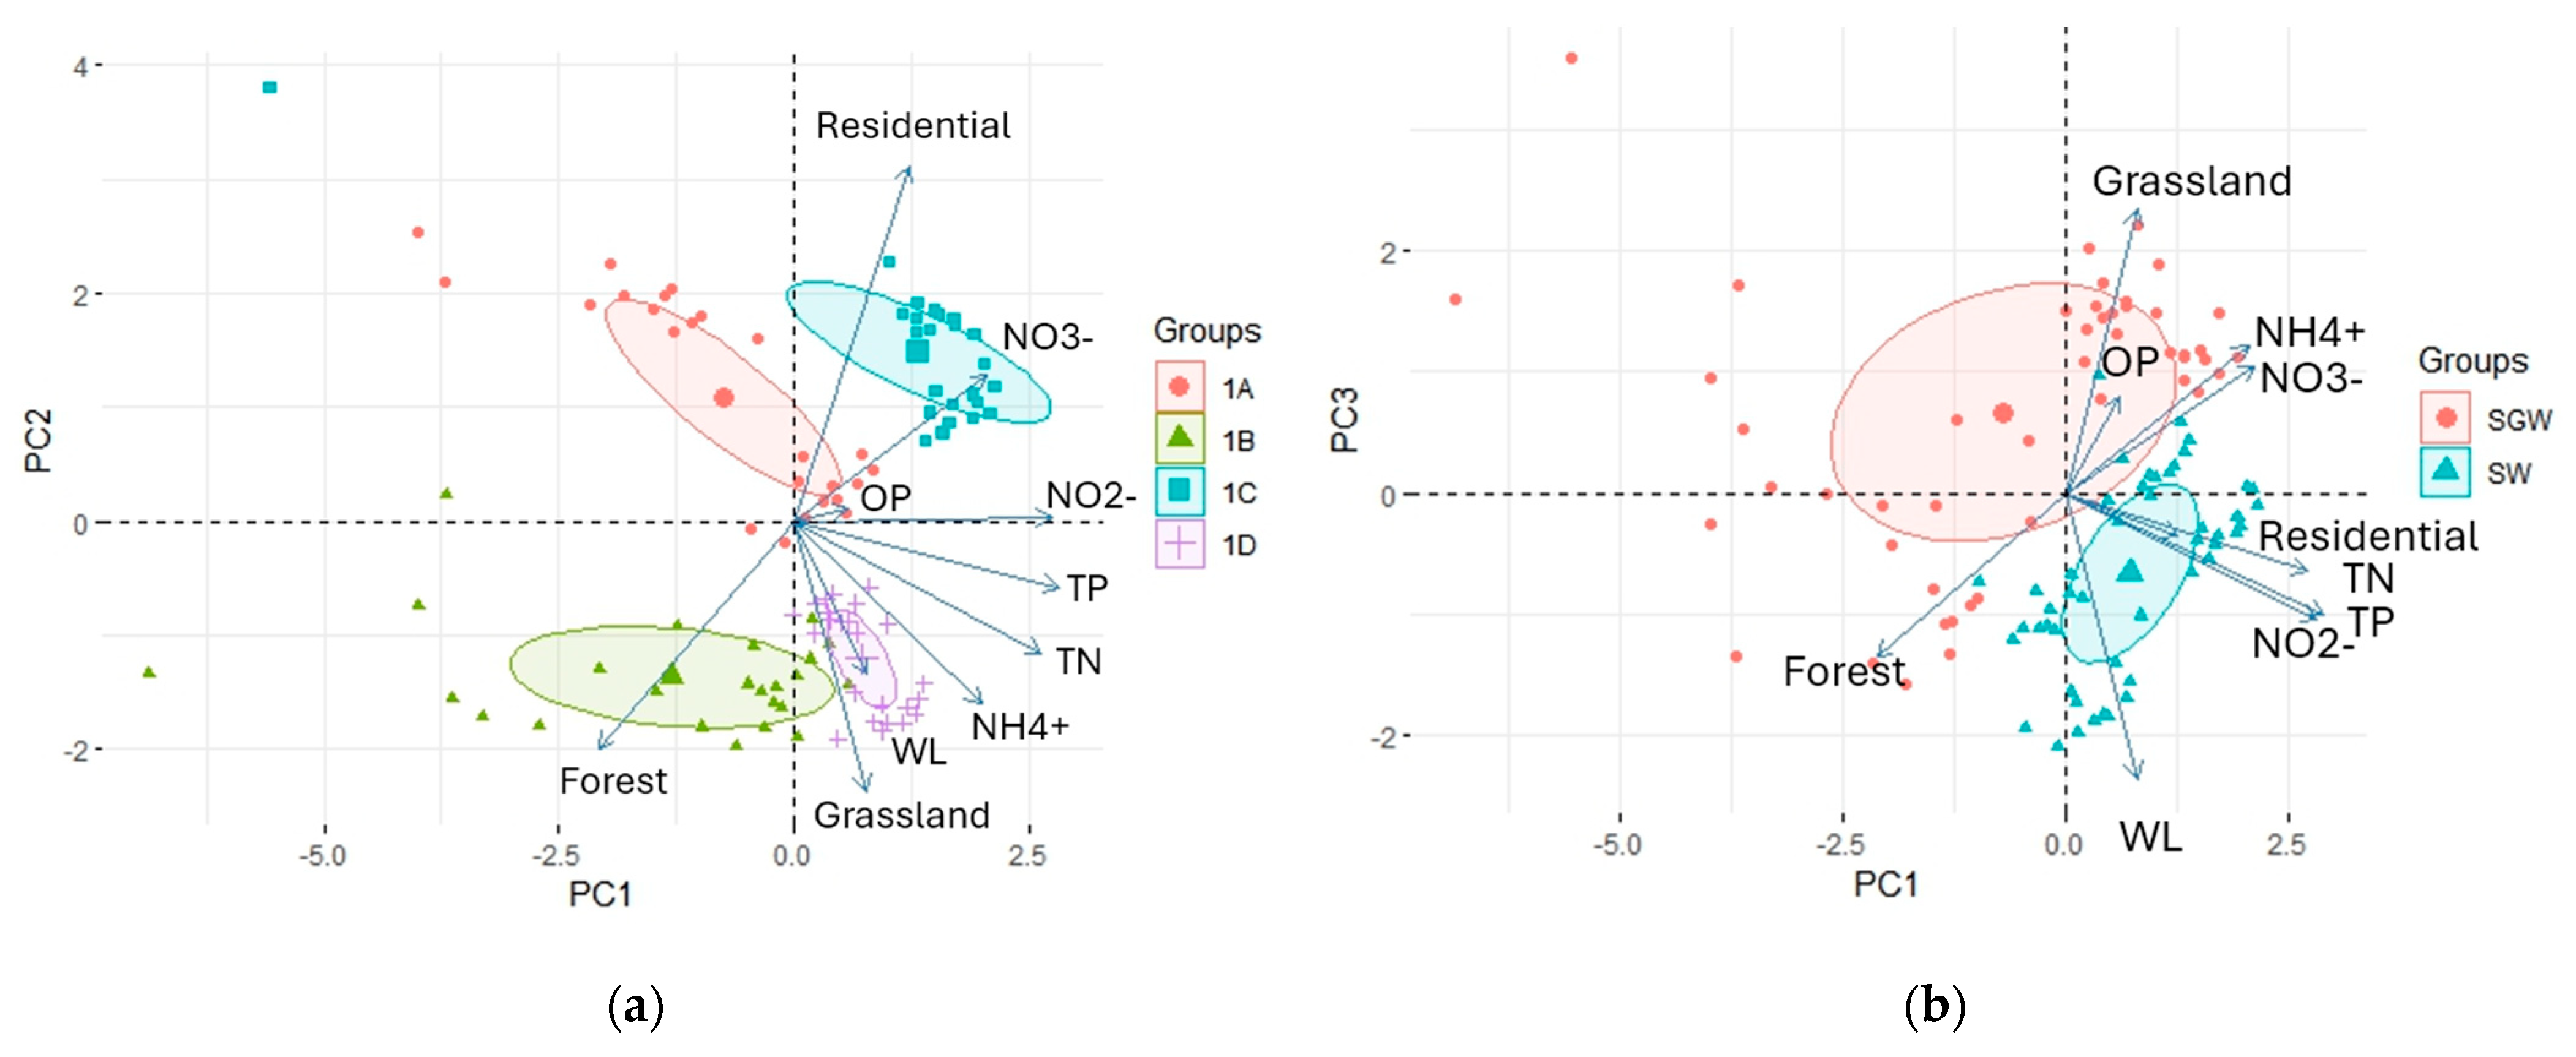
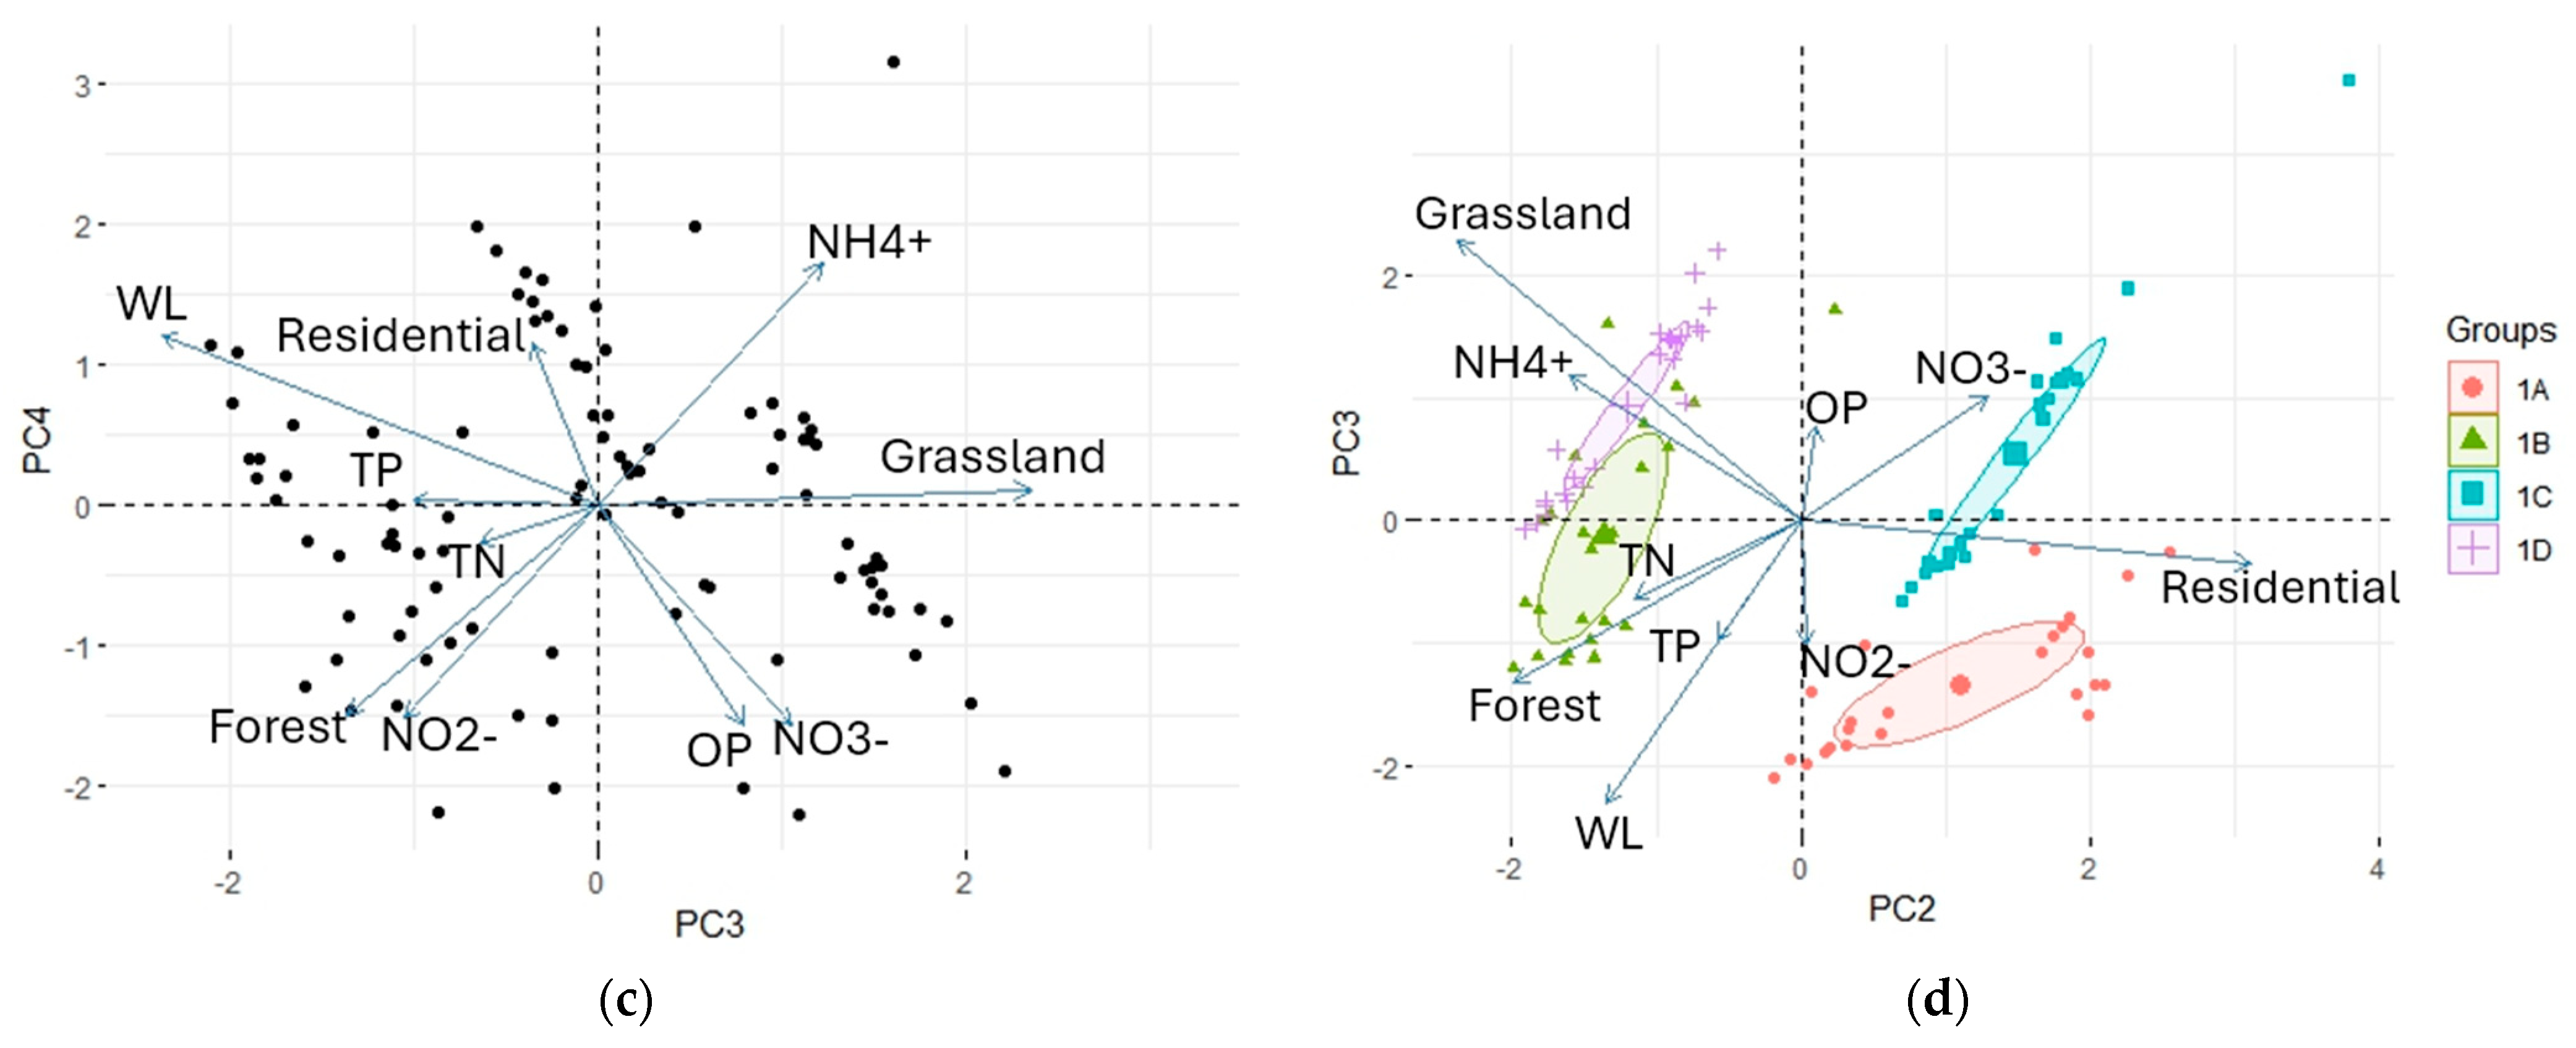
The first four principal components (PCs) with eigenvalues >1 were given the primary focus [16,26,44], as the four PCs (PC1-PC4) cumulatively explained 76% of the data variation (Table 5). Loadings indicated the eigenvector weights, with values higher than the average threshold (>0.31), implying stronger relationships between parameters and corresponding PCs [44] (Table 6). PC1 displayed high positive loading for NO3-N, NO2-N, NH4-N, total_N, total_P, and strong negative loading for forest (Table 6), reflecting primary nutrients in both SW and SGW and their negative correlation with forested land use. PC2 represented land use of the study reach with forest, grassland, and residential percentages showing higher loadings (Table 6). The PC1-PC2 biplot depicted separations among monitoring sites by sub-catchment land use (Figure 7a). PC1 separated sites 1B and 1D with more residential catchments than sites 1A and 1C (Figure 7a). PC2 distinguished between sites 1A and 1B (less forested catchment) and 1C and 1D (more forested catchment). PC1_PC3 biplot represented distinct nutrient profiles by water source type (SW and SGW) (Figure 7b). Similar to the PC1-PC2 biplot, the PC2-PC3 biplot showed the separation of monitoring sites (Figure 7d), further supporting the difference in nutrient dynamics due to catchment land-use practices. Thus, water source type, monitoring stations, and associated land use cumulatively explained 65% of data variability (Table 5). PC3 and PC4 biplots showed no significant separation by water source type (SW and SGW), monitoring stations, and associated land use (Figure 7c).
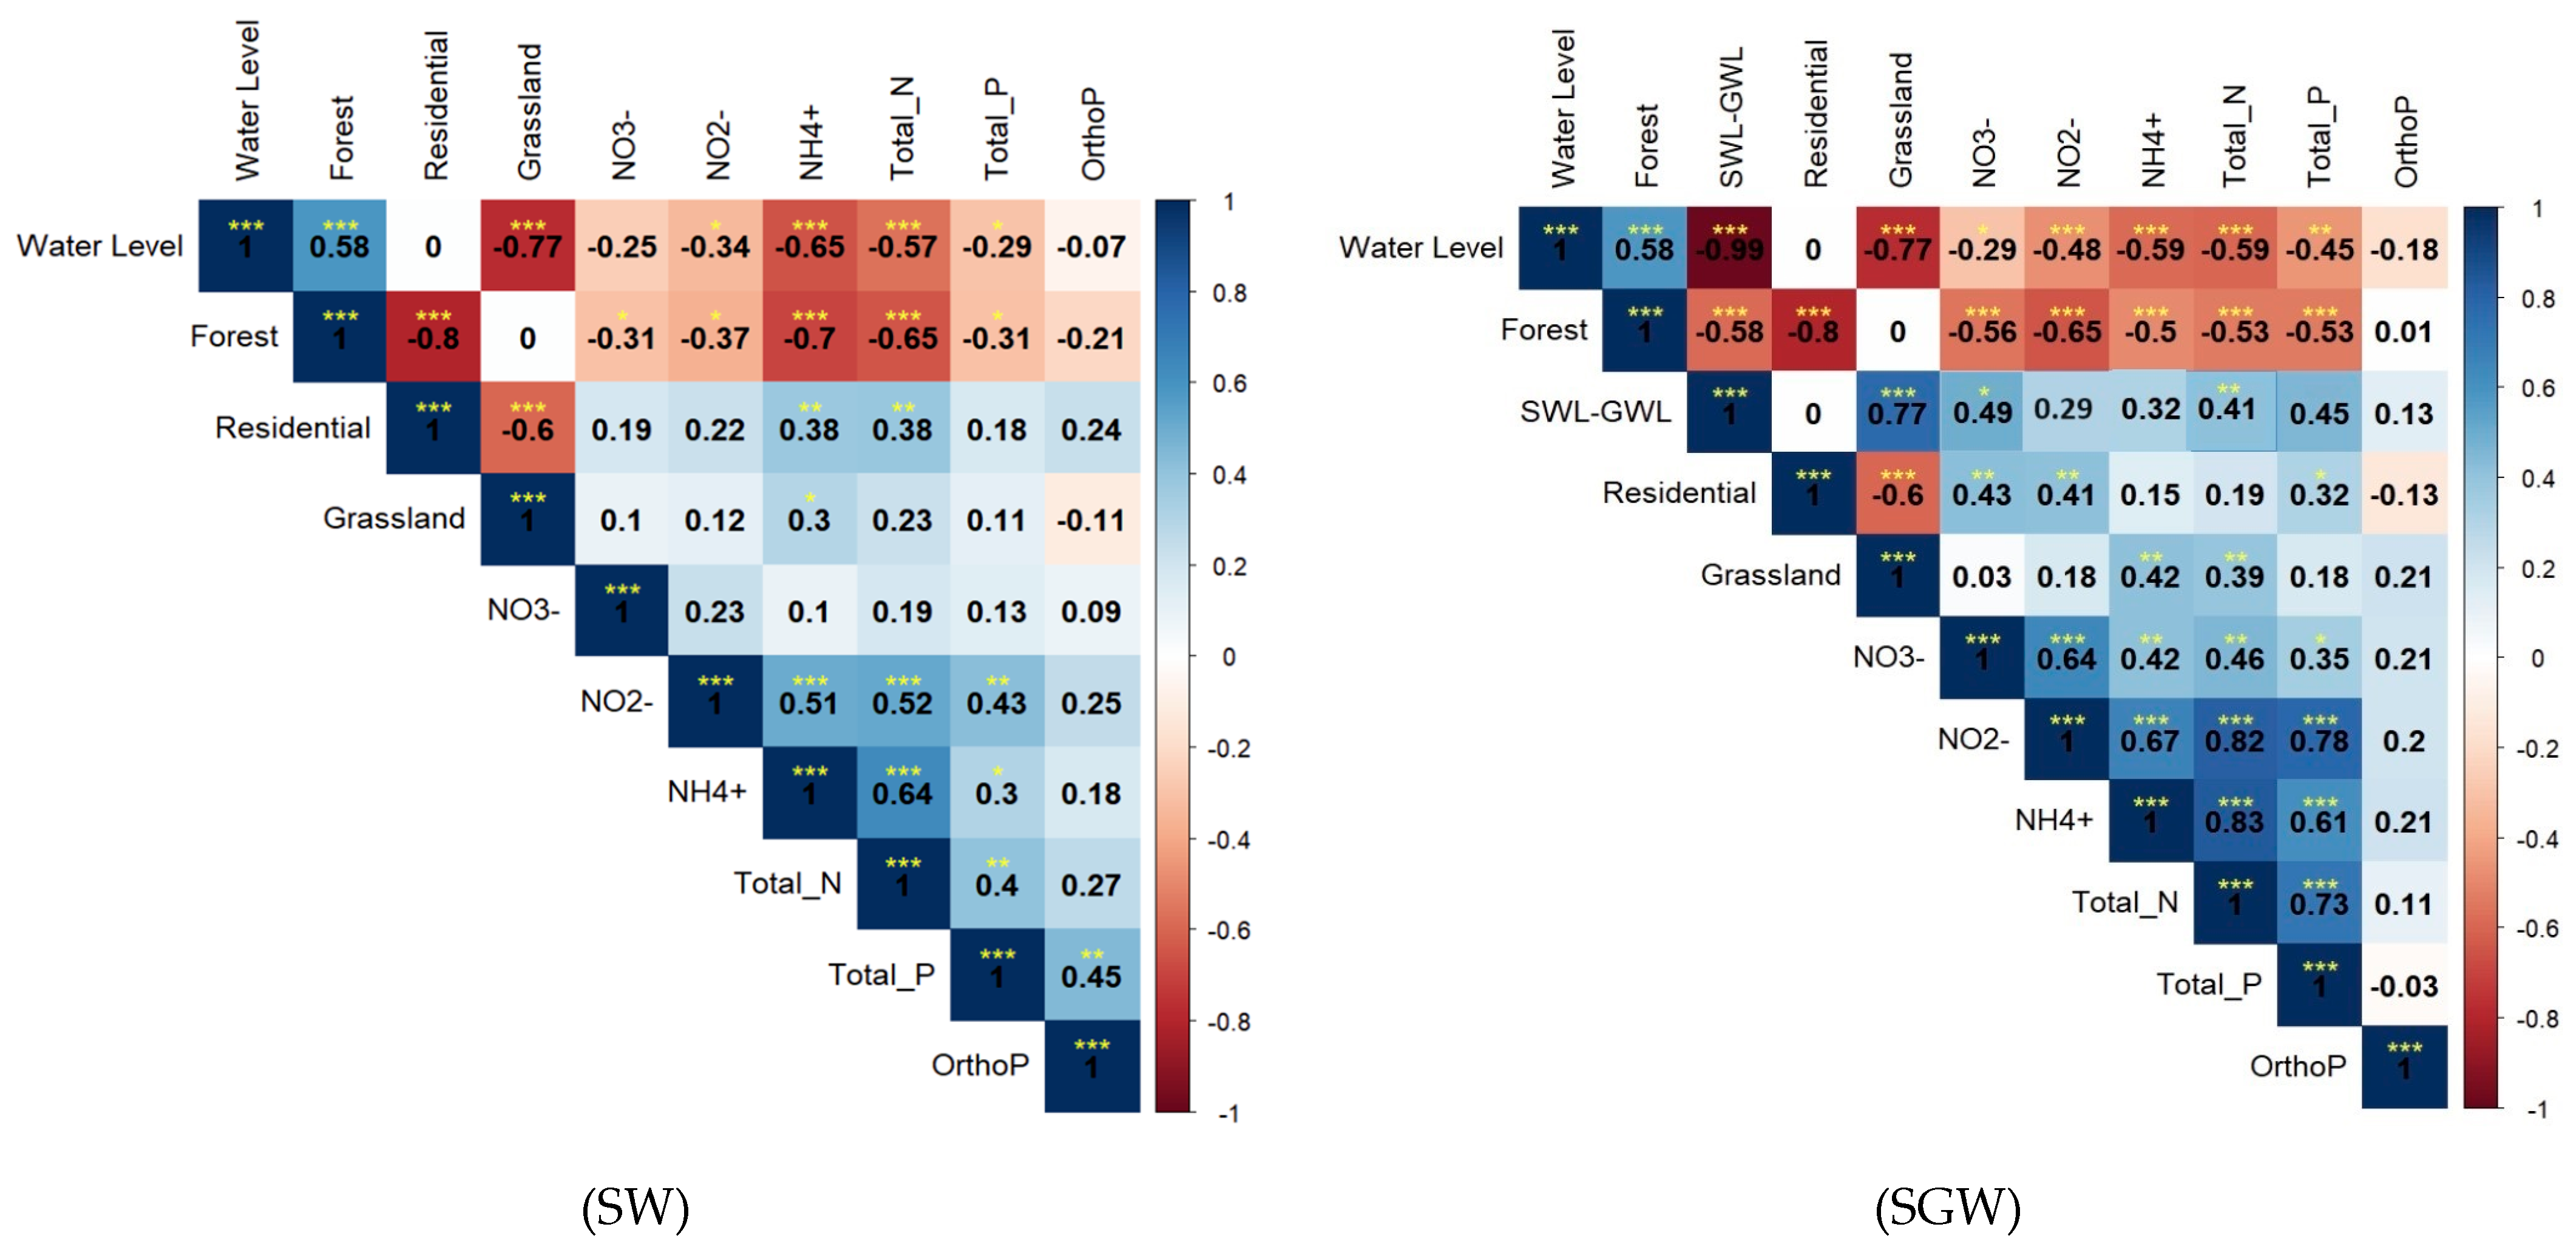
PCA analysis highlighted the distinct nutrient dynamics of SW and SGW. Correlation analyses for SW and SGW were performed separately (Figure 8) to explore these differences further. Both in SW and SGW environments, forest areas exhibited a high negative correlation with all the nutrients (Figure 8). Grassland areas were significantly positively correlated with NH4-N in both SW and GW. Under wetland soil conditions, NH4-N accumulates due to less nitrification and more denitrification under anaerobic conditions [15]. Furthermore, vegetation, including grasslands and forests in riparian wetlands, is essential in NO3-N removal by plant uptake [9,15,18]. For example, plant uptake was shown to remove 88% of N in a perennial cropping system and 100% in a mixed deciduous forest in the riparian area of Calapooia River, Oregon [18]. Similarly, Hefting et al. [9] suggested that 13 to 99% of GW NO3-N was removed by riparian forest vegetation uptake. In the current study, catchment residential areas were significantly positively (p < 0.05) correlated with NO3-N, NO2-N, and total_P in SGW. Similarly, in SW, residential practices at the catchment scale had a significant positive relation (p < 0.05) with total_N. High NO3-N levels in residential areas are attributed to high impervious surfaces and residential storm runoff [21,51]. In addition, in the SGW environment, the water level difference between SW and GW (SWL-GWL) had a significant positive correlation with NO3-N and total_N (p < 0.05). With a higher difference between SW and GW levels, more SW will be discharged to SGW and transport more NO3-N from the creek. However, the relationship was not significant for NH4-N, NO2-N, and Total_P (p > 0.05) (Figure 8). Overall, PCA and correlation analysis depicted primary nutrients in the SW and SGW environment and identified the importance of water source type, catchment land use, and hydrology on nutrient concentration dynamics, similar to previous results [3,10,16,26]. Despite the immediate area’s minimal human impact, correlation analysis established a connection between land-use practices in the contributing upland areas and nutrient loadings in the riparian wetland. Thus, this study offers important baseline data showing that riparian wetlands with low anthropogenic impact are nonetheless impacted, thereby providing guidance to improve wetland management decisions and the formulation of sustainable nutrient mitigation strategies in low-impact wetlands [3,10].
3.5. Limitations, Implications, and Future Directions
The present study offers a distinct opportunity to understand the spatiotemporal dynamics of nutrient concentrations in SW and SGW in riparian wetlands of a mixed land-use catchment in the Appalachian region of West Virginia. The study provides valuable insights into nutrient concentration differences relative to land use, water level change, and water source type (SW and SGW). Moreover, the current project supplies greatly needed baseline data for a low human-impacted riparian wetland in a mixed land-use catchment. This baseline data offers insights into land management strategies. For example, while the area has limited human impact, the correlation between catchment residential areas and SW–SGW nutrient concentration dynamics emphasizes the importance of reducing rapid development in the catchment. Additionally, cattle grazing, with its associated activities of walking, trampling, and excrement deposition, can negatively affect water quality and contribute to N transport via increased overland flow [52]. Therefore, reducing cattle grazing is essential for preserving surface and SGW water quality in these areas. The four SW monitoring stations and 13 co-located piezometers yielded high-resolution data for a mixed land-use catchment, which could be extended to similar wetland studies. Additionally, the current study used nutrient data from 2020–2021 to identify riparian wetland-governed hydrology and nutrient dynamics. While a longer time series may better support the findings in this investigation, the current project provides important nutrient baseline data. In addition, the spatial nutrient concentration analysis showed probable subsurface storage properties. However, to validate the subsurface storage (sink) mechanisms, data involving soil organic matter, dissolved oxygen, and redox potential are needed [16,53]. Mass balance calculations can offer insights into nutrient mass transport mechanisms due to surface water seepage, groundwater discharge, and nutrient retention through processes such as plant uptake and denitrification [55]. However, the current data lack information on nutrient flux and rate and kinetics of the in-stream processes. In addition, PCA and correlation analysis advanced understanding of the influence of catchment land use on nutrient concentrations in SW and SGW of riparian wetlands. However, due to the complex topography in the study area, the nutrient transport from high elevation land-use areas might have undergone subsurface changes, raising uncertainties regarding nutrient transformation processes. Stable isotopes may provide more reliable information about land-use contribution and residence times [16]. However, isotope analysis and hydrochemical data collection were fiscally beyond the scope of the study. Despite these limitations, the present study presents valuable baseline information, which could be extended by performing SW–SGW integrated modeling to better understand SGW flow dynamics to and from receiving SW. This information will be helpful to researchers and water managers to understand nutrient fate and transport better and make informed water resource management decisions.
4. Conclusions
Riparian wetland’s nutrient dynamics are impacted by surface water (SW)–shallow groundwater (SGW) flow direction and local land-use practices. Thus, a spatiotemporal assessment of nutrient concentrations is needed to ensure SW and SGW quality. Nutrient concentrations, including nitrate (NO3-N), nitrite (NO2-N), ammonium (NH4-N), orthophosphate (PO43-P), total nitrogen (total_N), and total phosphorus (total_P) in SW and SGW were monitored between 2020 and 2021 in riparian wetlands of a mixed land-use catchment in West Run Watershed (WRW), located in northeastern Morgantown, West Virginia (WV). On average, gaining stream conditions were observed in upstream sites, and losing stream conditions were observed in downstream sites. Total_N and total_P concentrations in SGW significantly exceeded SW concentrations (p < 0.05). Out of total_N, NO3-N dominated in SW (0.42 mg/L), while NH4-N prevailed in SGW (1.55 mg/L), based on 2020–2021 average concentrations. Significantly high (p < 0.05) SW NO3-N concentrations in summer and fall relative to winter are attributed to increased precipitation and the resulting SW and SGW fluctuations. Intra-site nutrient analysis indicated decreased nutrient concentrations with distance from the creek in sites 1C and 1D. Due to losing stream conditions in the nearest piezometers to the creek, nutrients in SW can move towards SGW and exhibit high nutrient concentrations. Principal Component Analysis (PCA) showed differences in nutrient concentrations based on the water source type and catchment land use, explaining 65% of data variability. Spearman correlation analysis illustrated the correlation among nutrient concentrations, land use, and water level changes in SW and SGW environments. The study presents a distinct opportunity to analyze the spatiotemporal dynamics of SW and SGW nutrient concentrations in minimally human-impacted riparian wetlands in the Appalachian region of West Virginia. A notable component of the study are the quantitative correlations between the SW and SGW nutrient concentrations based on observed data in these minimally impacted riparian zones to the water flow direction and catchment land-use practices. Consequently, this study provides needed baseline data in riparian wetlands, offering valuable information to advance land management strategies in similar mixed land-use wetlands.
Author Contributions
For the current work, author contributions were as follows: conceptualization, J.A.H., J.T.A. and B.F.A.; methodology, J.A.H. and B.F.A.; software, J.A.H.; validation, J.A.H. and B.F.A.; formal analysis, B.F.A.; investigation, J.A.H., J.T.A. and B.F.A.; resources, J.A.H.; data curation, J.A.H., J.T.A. and B.F.A.; writing—original draft preparation, B.F.A. and J.A.H.; writing—review and editing, J.A.H., J.T.A. and B.F.A.; visualization, J.A.H. and B.F.A.; supervision, J.A.H.; project administration, J.A.H.; funding acquisition, J.A.H. All authors have read and agreed to the published version of the manuscript.
Funding
This work was supported by the USDA National Institute of Food and Agriculture, Hatch project accession number 1011536 and McIntire Stennis accession number 7003934, and the West Virginia Agricultural and Forestry Experiment Station. Additional funding was provided by the USDA Natural Resources Conservation Service, Soil and Water Conservation, Environmental Quality Incentives Program No: 68-3D47-18-005, the Environmental Protection Agency, Grant No. D-96362401-0, and a portion of this research was supported by Agriculture and Food Research Initiative Competitive Grant No. 2020-68012-31881 from the USDA National Institute of Food and Agriculture. The results presented may not reflect the sponsors’ views, and no official endorsement should be inferred. The funders had no role in study design, data collection, and analysis, the decision to publish, or the preparation of the manuscript.
Data Availability Statement
The data presented in this study are available on reasonable request from the corresponding author or are available through publicly available sources noted in text.
Acknowledgments
The authors appreciate the feedback of anonymous reviewers whose constructive comments improved the article.
Conflicts of Interest
The authors declare no conflicts of interest.
Appendix A
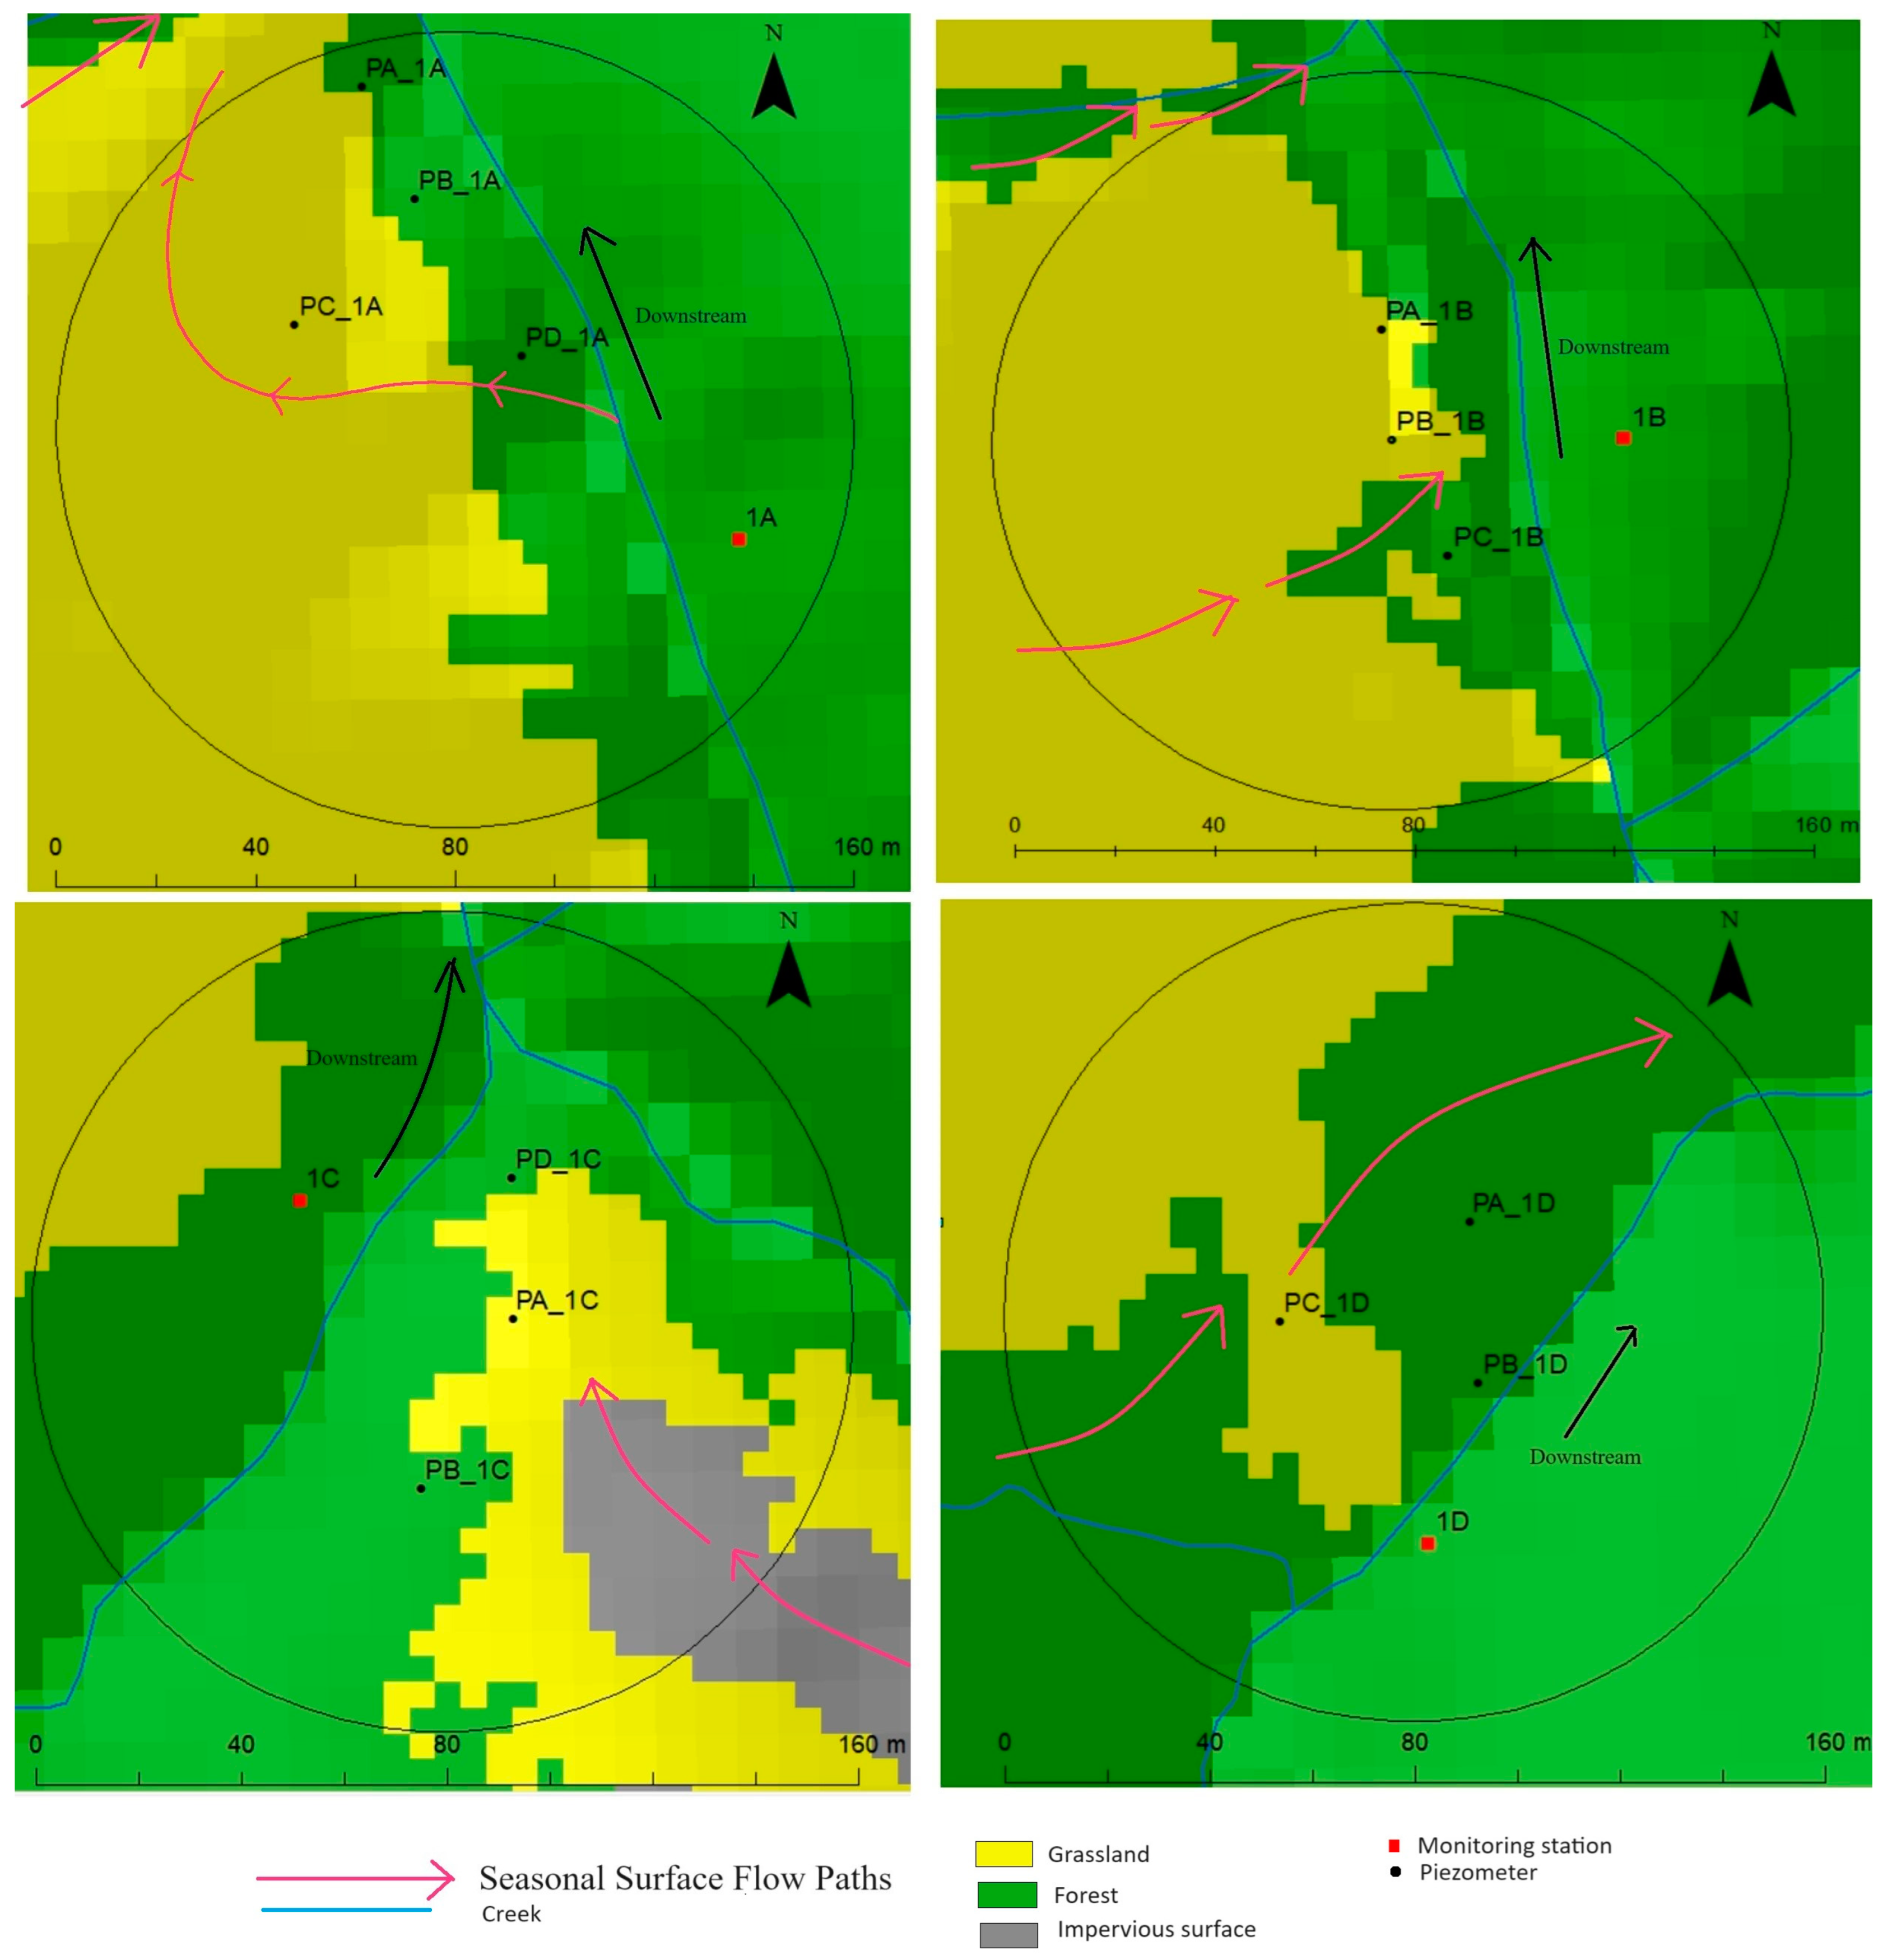
Figure A1.
Seasonal surface flow paths in the 80 m radius of monitoring stations and piezometers in the study reach West Run Watershed (WRW), Morgantown, WV.
Figure A1.
Seasonal surface flow paths in the 80 m radius of monitoring stations and piezometers in the study reach West Run Watershed (WRW), Morgantown, WV.


Table A1.
Land surface elevation (Datum: WGS_1984), observed water depth, water level elevation of monitoring stations and piezometers in the study reach, West Run Watershed (WRW), Morgantown, WV. Land elevation data were obtained from the USGS National Elevation Dataset (https://www.usgs.gov (accessed on 25 April 2023)). Water depth was converted to elevation above WGS_1984 by subtracting water depth from land elevation.
| Site | Surface Elevation (m) | Water Depth (m) | Water Level Elevation (m) | Piezometer | Surface Elevation (m) | Water Depth (m) | Water Level Elevation (m) |
|---|---|---|---|---|---|---|---|
| 1A | 310.48 | 0.16 | 310.32 | PA_1A | 304.98 | 1.38 | 303.60 |
| PB_1A | 304.43 | 1.34 | 303.09 | ||||
| PC_1A | 307.78 | 1.19 | 306.59 | ||||
| PD_1A | 306.67 | 1.34 | 305.33 | ||||
| 1B | 311.66 | 0.24 | 311.42 | PA_1B | 310.96 | 1.05 | 309.91 |
| PB_1B | 310.95 | 1.47 | 309.49 | ||||
| PC_1B | 311.72 | 1.15 | 310.57 | ||||
| 1C | 318.82 | 0.25 | 318.57 | PA_1C | 323.03 | 1.96 | 320.99 |
| PB_1C | 324.48 | 2.03 | 322.52 | ||||
| PD_1C | 316.86 | 1.15 | 315.71 | ||||
| 1D | 327.67 | 0.21 | 327.46 | PA_1D | 333.06 | 1.83 | 331.22 |
| PB_1D | 327.30 | 1.37 | 325.93 | ||||
| PC_1D | 332.44 | 1.64 | 330.79 |
References
- Wurtsbaugh, W.A.; Paerl, H.W.; Dodds, W.K. Nutrients, Eutrophication and Harmful Algal Blooms along the Freshwater to Marine Continuum. WIREs Water 2019, 6, e1373. [Google Scholar] [CrossRef]
- Bachmann, R.W.; Jones, B.L.; Fox, D.D.; Hoyer, M.; Bull, L.A.; Canfield, D.E. Relations between Trophic State Indicators and Fish in Florida (USA) Lakes. Can. J. Fish. Aquat. Sci. 1996, 53, 842–855. [Google Scholar] [CrossRef]
- Teixeira De Souza, A.; Carneiro, L.A.T.X.; Da Silva Junior, O.P.; De Carvalho, S.L.; Américo-Pinheiro, J.H.P. Assessment of Water Quality Using Principal Component Analysis: A Case Study of the Marrecas Stream Basin in Brazil. Environ. Technol. 2021, 42, 4286–4295. [Google Scholar] [CrossRef]
- Ni, W.; Li, M. What Drove the Nonlinear Hypoxia Response to Nutrient Loading in Chesapeake Bay during the 20th Century? Sci. Total Environ. 2023, 861, 160650. [Google Scholar] [CrossRef] [PubMed]
- Poor, C.J.; McDonnell, J.J. The Effects of Land Use on Stream Nitrate Dynamics. J. Hydrol. 2007, 332, 54–68. [Google Scholar] [CrossRef]
- Carlyle, G.C.; Hill, A.R. Groundwater Phosphate Dynamics in a River Riparian Zone: Effects of Hydrologic flowpaths, Lithology and Redox Chemistry. J. Hydrol. 2001, 247, 151–168. [Google Scholar] [CrossRef]
- Vilmin, L.; Mogollón, J.M.; Beusen, A.H.W.; Bouwman, A.F. Forms and Subannual Variability of Nitrogen and Phosphorus Loading to Global River Networks over the 20th Century. Glob. Planet. Change 2018, 163, 67–85. [Google Scholar] [CrossRef]
- Casey, R.E.; Klaine, S.J. Nutrient Attenuation by a Riparian Wetland during Natural and Artificial Runoff Events. J. Environ. Qual. 2001, 30, 1720–1731. [Google Scholar] [CrossRef] [PubMed]
- Hefting, M.M.; Clement, J.-C.; Bienkowski, P.; Dowrick, D.; Guenat, C.; Butturini, A.; Topa, S.; Pinay, G.; Verhoeven, J.T.A. The Role of Vegetation and Litter in the Nitrogen Dynamics of Riparian Buffer Zones in Europe. Ecol. Eng. 2005, 24, 465–482. [Google Scholar] [CrossRef]
- Li, S.; Gu, S.; Tan, X.; Zhang, Q. Water Quality in the Upper Han River Basin, China: The Impacts of Land Use/Land Cover in Riparian Buffer Zone. J. Hazard. Mater. 2009, 165, 317–324. [Google Scholar] [CrossRef]
- Jacobson, L.M.; David, M.B.; Drinkwater, L.E. A Spatial Analysis of Phosphorus in the Mississippi River Basin. J. Environ. Qual. 2011, 40, 931–941. [Google Scholar] [CrossRef]
- Cirmo, C.P.; McDonnell, J.J. Linking the Hydrologic and Biogeochemical Controls of Nitrogen Transport in Near-Stream Zones of Temperate-Forested Catchments: A Review. J. Hydrol. 1997, 199, 88–120. [Google Scholar] [CrossRef]
- Xie, Z.; Zhang, Y.; Zhang, Z.; Huang, J. Nitrate Removal Mechanism in Riparian Groundwater in an Intensified Agricultural Catchment. Agric. Water Manag. 2023, 280, 108223. [Google Scholar] [CrossRef]
- Verhoeven, J.; Arheimer, B.; Yin, C.; Hefting, M. Regional and Global Concerns over Wetlands and Water Quality. Trends Ecol. Evol. 2006, 21, 96–103. [Google Scholar] [CrossRef] [PubMed]
- White, J.R.; Reddy, K.R. Biogeochemical Dynamics I: Nitrogen Cycling in Wetlands. In The Wetlands Handbook; Maltby, E., Barker, T., Eds.; Wiley: Hoboken, NJ, USA, 2009; pp. 213–227. ISBN 978-0-632-05255-4. [Google Scholar]
- Kwon, H.-I.; Koh, D.-C.; Cho, B.-W.; Jung, Y.-Y. Nutrient Dynamics in Stream Water and Groundwater in Riparian Zones of a Mesoscale Agricultural Catchment with Intense Seasonal Pumping. Agric. Water Manag. 2022, 261, 107336. [Google Scholar] [CrossRef]
- Raciti, S.M.; Groffman, P.M.; Jenkins, J.C.; Pouyat, R.V.; Fahey, T.J.; Pickett, S.T.A.; Cadenasso, M.L. Nitrate Production and Availability in Residential Soils. Ecol. Appl. 2011, 21, 2357–2366. [Google Scholar] [CrossRef] [PubMed]
- Davis, J.H.; Griffith, S.M.; Wigington, P.J. Surface Water and Groundwater Nitrogen Dynamics in a Well Drained Riparian Forest within a Poorly Drained Agricultural Landscape. J. Environ. Qual. 2011, 40, 505–516. [Google Scholar] [CrossRef] [PubMed]
- Martin, J.F.; Reddy, K.R. Interaction and Spatial Distribution of Wetland Nitrogen Processes. Ecol. Model. 1997, 105, 1–21. [Google Scholar] [CrossRef]
- Richardson, C.J.; Vaithiyanathan, P. Biogeochemical Dynamics II: Cycling and Storage of Phosphorus in Wetlands. In The Wetlands Handbook; Maltby, E., Barker, T., Eds.; Wiley: Hoboken, NJ, USA, 2009; pp. 228–248. ISBN 978-0-632-05255-4. [Google Scholar]
- Tucker, W.A.; Diblin, M.C.; Mattson, R.A.; Hicks, R.W.; Wang, Y. Nitrate in Shallow Groundwater Associated with Residential Land Use in Central Florida. J. Environ. Qual. 2014, 43, 639–646. [Google Scholar] [CrossRef] [PubMed]
- Huizenga, A.; Bailey, R.T.; Gates, T.K. Stream-Aquifer and in-Stream Processes Affecting Nitrogen along a Major River and Contributing Tributary. J. Contam. Hydrol. 2017, 199, 24–35. [Google Scholar] [CrossRef]
- Jordan, T.E.; Correll, D.L.; Weller, D.E. Nutrient Interception by a Riparian Forest Receiving Inputs from Adjacent Cropland. J. Environ. Qual. 1993, 22, 467–473. [Google Scholar] [CrossRef]
- Chinnasamy, P.; Hubbart, J.A. Stream and Shallow Groundwater Nutrient Concentrations in an Ozark Forested Riparian Zone of the Central USA. Environ. Earth Sci. 2015, 73, 6577–6590. [Google Scholar] [CrossRef]
- Banner, E.B.K.; Stahl, A.J.; Dodds, W.K. Stream Discharge and Riparian Land Use Influence In-Stream Concentrations and Loads of Phosphorus from Central Plains Watersheds. Environ. Manag. 2009, 44, 552–565. [Google Scholar] [CrossRef]
- Gootman, K.S.; Hubbart, J.A. Characterization of Sub-Catchment Stream and Shallow Groundwater Nutrients and Suspended Sediment in a Mixed Land Use, Agro-Forested Watershed. Water 2023, 15, 233. [Google Scholar] [CrossRef]
- Gorgoglione, A.; Gregorio, J.; Ríos, A.; Alonso, J.; Chreties, C.; Fossati, M. Influence of Land Use/Land Cover on Surface-Water Quality of Santa Lucía River, Uruguay. Sustainability 2020, 12, 4692. [Google Scholar] [CrossRef]
- Merriam, E.R.; Petty, J.T.; O’Neal, M.; Ziemkiewicz, P.F. Flow-Mediated Vulnerability of Source Waters to Elevated TDS in an Appalachian River Basin. Water 2020, 12, 384. [Google Scholar] [CrossRef]
- Flite, O.P.; Shannon, R.D.; Schnabel, R.R.; Parizek, R.R. Nitrate Removal in a Riparian Wetland of the Appalachian Valley and Ridge Physiographic Province. J. Environ. Qual. 2001, 30, 254–261. [Google Scholar] [CrossRef]
- Webster, J.R.; Stewart, R.M.; Knoepp, J.D.; Jackson, C.R. Effects of Instream Processes, Discharge, and Land Cover on Nitrogen Export from Southern Appalachian Mountain Catchments. Hydrol. Process. 2019, 33, 283–304. [Google Scholar] [CrossRef]
- Abesh, B.F.; Hubbart, J.A. A Comparison of Saturated Hydraulic Conductivity (Ksat) Estimations from Pedotransfer Functions (PTFs) and Field Observations in Riparian Seasonal Wetlands. Water 2023, 15, 2711. [Google Scholar] [CrossRef]
- Kellner, E.; Hubbart, J.; Stephan, K.; Morrissey, E.; Freedman, Z.; Kutta, E.; Kelly, C. Characterization of sub-watershed-scale stream chemistry regimes in an Appalachian mixed-land-use watershed. Environ. Monit. Assess. 2018, 190, 1–18. [Google Scholar]
- Petersen, F.; Hubbart, J.A. Advancing Understanding of Land Use and Physicochemical Impacts on Fecal Contamination in Mixed-Land-Use Watersheds. Water 2020, 12, 1094. [Google Scholar] [CrossRef]
- Heck, Z.A. Development of Multi-Catchment Rating Curves for Streams of Appalachian Mixed-Land-Use Watersheds: Preliminary Results; West Virginia University Libraries: Morgantown, WV, USA, 2021. [Google Scholar]
- Solinst. Solnist Levelogger Pressure Transducer, Solinst Canada Ltd. 2020. Available online: https://www.solinst.com/ (accessed on 10 December 2019).
- Solinst. Solinist Levelogger Junior Edge Pressure Transducers, Solnist Canada Ltd. 2020. Available online: https://www.solinst.com/onthelevel-news/water-level-monitoring/water-level-datalogging/levelogger-data-critical-for-water-and-leachate-management-at-a-queensland-landfill/ (accessed on 10 December 2019).
- NOAA National Centers for Environmental Information Local Climatological Data (LCD). 2010. Available online: https://ncei.noaa.gov/access/search/data-search/local-climatological-data (accessed on 1 January 2020).
- USGS National Field Manual for the Collection of Water Quality Data. 2006. Available online: https://www.usgs.gov/mission-areas/water-resources/science/national-field-manual-collection-water-quality-data-nfm (accessed on 1 January 2020).
- Cole-Parmer. Cole-Parmer Masterflex Portable Sampling Pump. Vernon Hills, IL, USA. 2020. Available online: https://www.coleparmer.com/c/pumps?gclid=cj0kcqjwl8anbhcfarisakbbpyrgig5lakcmpwargc2ckdxbwuhwrer1gdct_5e7noihh8tkpizfzwgaakkwealw_wcb (accessed on 10 December 2019).
- HACH DR3900 Laboratory Spectrophotometer for Water Analysis|Hach USA. 2020. Available online: https://www.hach.com/p-dr3900-laboratory-spectrophotometer-for-water-analysis (accessed on 10 December 2019).
- HACH. HACH TNTplus Vial Chemicals. HACH, USA. 2020. Available online: https://www.hach.com/products/chemistries/tntplus (accessed on 10 December 2019).
- Hach Company TNTplus 835/836 Nitrate Method 10206 Spectrophotometric Measurement of Nitrate in Water and Wastewater. Available online: https://ca.hach.com/asset-get.download.jsa?id=17043310582 (accessed on 1 January 2020).
- Crawley, M.J. Statistics: An Introduction Using R; John Wiley & Sons: West Sussex, UK, 2005; ISBN 0-470-02298-1. [Google Scholar]
- Davis, J.C. Statistics and Data Analysis in Geology, 3rd ed.; John Wiley & Sons: New York, NY, USA, 2002; ISBN 0-471-17275-8. [Google Scholar]
- Tesoriero, A.J.; Duff, J.H.; Wolock, D.M.; Spahr, N.E.; Almendinger, J.E. Identifying Pathways and Processes Affecting Nitrate and Orthophosphate Inputs to Streams in Agricultural Watersheds. J. Environ. Qual. 2009, 38, 1892–1900. [Google Scholar] [CrossRef]
- Musolff, A.; Schmidt, C.; Rode, M.; Lischeid, G.; Weise, S.M.; Fleckenstein, J.H. Groundwater Head Controls Nitrate Export from an Agricultural Lowland Catchment. Adv. Water Resour. 2016, 96, 95–107. [Google Scholar] [CrossRef]
- Pistocchi, C.; Silvestri, N.; Rossetto, R.; Sabbatini, T.; Guidi, M.; Baneschi, I.; Bonari, E.; Trevisan, D. A Simple Model to Assess Nitrogen and Phosphorus Contamination in Ungauged Surface Drainage Networks: Application to the Massaciuccoli Lake Catchment, Italy. J. Environ. Qual. 2012, 41, 544–553. [Google Scholar] [CrossRef] [PubMed]
- Ruiz, L.; Abiven, S.; Martin, C.; Durand, P.; Beaujouan, V.; Molénat, J. Effect on Nitrate Concentration in Stream Water of Agricultural Practices in Small Catchments in Brittany: II. Temporal Variations and Mixing Processes. Hydrol. Earth Syst. Sci. 2002, 6, 507–514. [Google Scholar] [CrossRef]
- Chotpantarat, S.; Parkchai, T.; Wisitthammasri, W. Multivariate Statistical Analysis of Hydrochemical Data and Stable Isotopes of Groundwater Contaminated with Nitrate at Huay Sai Royal Development Study Center and Adjacent Areas in Phetchaburi Province, Thailand. Water 2020, 12, 1127. [Google Scholar] [CrossRef]
- Liu, X.; Wang, X.; Zhang, L.; Fan, W.; Yang, C.; Li, E.; Wang, Z. Impact of Land Use on Shallow Groundwater Quality Characteristics Associated with Human Health Risks in a Typical Agricultural Area in Central China. Environ. Sci. Pollut. Res. 2021, 28, 1712–1724. [Google Scholar] [CrossRef] [PubMed]
- Yang, Y.-Y.; Toor, G.S. Sources and Mechanisms of Nitrate and Orthophosphate Transport in Urban Stormwater Runoff from Residential Catchments. Water Res. 2017, 112, 176–184. [Google Scholar] [CrossRef] [PubMed]
- Kurz, I.; O’Reilly, C.D.; Tunney, H. Impact of Cattle on Soil Physical Properties and Nutrient Concentrations in Overland Flow from Pasture in Ireland. Agric. Ecosyst. Environ. 2006, 113, 378–390. [Google Scholar] [CrossRef]
- Triska, F.J.; Kennedy, V.C.; Avanzino, R.J.; Zellweger, G.W.; Bencala, K.E. Retention and Transport of Nutrients in a Third-order Stream in Northwestern California: Hyporheic Processes. Ecology 1989, 70, 1893–1905. [Google Scholar] [CrossRef]
- Huang, N.; Lin, T.; Guan, J.; Zhang, G.; Qin, X.; Liao, J.; Liu, Q.; Huang, Y. Identification and Regulation of Critical Source Areas of Non-Point Source Pollution in Medium and Small Watersheds Based on Source-Sink Theory. Land 2021, 10, 668. [Google Scholar] [CrossRef]
- House, W.A.; Warwick, M.S. A Mass-Balance Approach to Quantifying the Importance of in-Stream Processes during Nutrient Transport in a Large River Catchment. Sci. Total Environ. 1998, 210, 139–152. [Google Scholar] [CrossRef]
Figure 1.
Project study reach within the larger West Run Watershed (WRW) with four stream stage monitoring sites (1A, 1B, 1C, and 1D) and thirteen nested piezometers in Morgantown, West Virginia (WV), USA.
Figure 1.
Project study reach within the larger West Run Watershed (WRW) with four stream stage monitoring sites (1A, 1B, 1C, and 1D) and thirteen nested piezometers in Morgantown, West Virginia (WV), USA.

Figure 2.
Average monthly precipitation (mm), maximum temperature (Tmax), minimum temperature (Tmin) in the study reach in West Run Watershed (WRW), Morgantown, WV, for (a) 2020 and (b) 2021. Precipitation and temperature data were obtained from the Morgantown, WV municipal airport’s National Oceanic and Atmospheric Administration (NOAA) weather station [31].

Figure 3.
Average daily SW and SGW levels and precipitation for monitoring stations 1A–1D and co-located piezometers in the study reach in West Run Watershed (WRW), Morgantown, WV, for (a) 2020 and (b) 2021. The water depths were adjusted to the WGS 1984 datum. Precipitation data were obtained from the Morgantown, WV municipal airport’s National Oceanic and Atmospheric Administration (NOAA) weather station [31]. Note: The SGW level is illustrated for each co-located piezometer in the monitoring site. PA_1A, PB_1A, PC_1A, PD_1A are 4 co-located piezometers in site 1A, PA_1B, PB_1B, PC_1B are 3 co-located piezometers of site 1B, PA_1C, PB_1C, PD_1C are 3 co-located piezometers of site 1C and PA_1D, PB_1D, PC_1D are 3 co-located piezometers of site 1D.


Figure 4.
Box and whisker plot of nitrate (NO3-N), nitrite (NO2-N), ammonium (NH4-N), total nitrogen (total-N), orthophosphate (PO43-P), total phosphorus (total-P) in SW and SGW for monitoring stations 1A–1D in the study reach, West Run Watershed (WRW), Morgantown, WV for the study period (January 2020 to December 2021). The black-filled circles represent outliers.

Figure 5.
Box and whisker plot of nitrate (NO3-N), nitrite (NO2-N), ammonium (NH4-N), total nitrogen (total-N), orthophosphate (PO43-P), total phosphorus (total-P) for SW and SGW from monitoring stations 1A–1D in the study reach, West Run Watershed (WRW), Morgantown, WV from 2020–2021. The striped and dotted boxes represent SGW and SW sources, each color-coded for four seasons (fall, spring, summer, and winter). The black-filled circle represents outliers.

Figure 6.
Nitrate (NO3-N), nitrite (NO2-N), ammonium (NH4-N), orthophosphate (PO43-P), total nitrogen (total_N), and total phosphorus (Total_P) concentrations in SGW from monitoring stations 1A–1D in the study reach, West Run Watershed (WRW), Morgantown, WV from 2020–2021. The X-axis represents the distance of co-located piezometers from the reach, where 0.0 m is the stream’s edge at each monitoring site, with distinct shapes denoting piezometers from different sites.

Figure 7.
Biplots representing the relation between nutrients including nitrate (NO3-N), nitrite (NO2-N), ammonium (NH4-N), total nitrogen (TN), orthophosphate (OP), total phosphorus (TP), land-use percentages (forest, residential, agriculture), SW and SGW levels (WL). (a) PC1-PC2 biplot, (b) PC1-PC3 biplot, (c) PC3-PC4 biplot, (d) PC2-PC3 biplot.


Figure 8.
Spearman correlation coefficient between nutrients including nitrate (NO3-N), nitrite (NO2-N), ammonium (NH4-N), total nitrogen (Total_N), orthophosphate (OrthoP/PO43-P), Total phosphorus (Total_P), land-use percentages (forest, residential, agriculture), SW and SGW levels (water level) for SW (left panel) and SGW (right panel) environments. Water level differences (SWL-GWL) were added to analyze the correlation of gaining–losing stream conditions in SGW. Red squares represent negative correlation, and blue squares represent positive correlation. The yellow asterisks denote the significance level (*** = 0.001, ** = 0.01, * = 0.05).

Table 1.
Land use/land cover (LULC) and drainage area of sub-catchments associated with monitoring sites (1A, 1B, 1C, 1D) in West Run Watershed (WRW), Morgantown, WV. The % of study area indicates the percentage of total study area covered by each sub-catchment. Notes: All LULC data are in percentage (%).
| Site | Residential (%) | Forest (%) | Grassland/ Pasture (%) | Drainage Area (km2) | % of Study Area | Elevation (m) |
|---|---|---|---|---|---|---|
| 1A | 25.36 | 31.14 | 43.48 | 0.41 | 34.08 | 310.48 |
| 1B | 55.39 | 21.98 | 22.63 | 0.42 | 34.52 | 311.66 |
| 1C | 2.44 | 68.29 | 29.27 | 0.17 | 13.47 | 318.82 |
| 1D | 48.95 | 43.57 | 7.47 | 0.21 | 17.93 | 327.67 |
Table 2.
Average surface water (SW) level and shallow groundwater (SGW) level in the study reach West Run Watershed (WRW), Morgantown, WV, for the study period of 2020–2021. The SW and GW levels are the observed water depths converted to water level elevations above WGS 1984 datum (Table A1). The water level difference (SWL-GWL) is obtained by subtracting the SW level from the GW level. Note: Data units are meters.
| Site | SW Level | Piezometer | GW Level | SWL-GWL |
|---|---|---|---|---|
| 1A | 310.32 | PA_1A | 303.60 | 6.72 |
| PB_1A | 303.09 | 7.22 | ||
| PC_1A | 306.59 | 3.73 | ||
| PD_1A | 305.33 | 4.99 | ||
| 1B | 311.42 | PA_1B | 309.91 | 1.51 |
| PB_1B | 309.49 | 1.93 | ||
| PC_1B | 310.57 | 0.42 | ||
| 1C | 318.57 | PA_1C | 320.99 | −2.42 |
| PB_1C | 322.52 | −3.95 | ||
| PD_1C | 315.71 | 2.86 | ||
| 1D | 327.46 | PA_1D | 331.22 | −3.76 |
| PC_1D | 325.93 | 1.53 | ||
| PB_1D | 330.79 | −3.33 |
Table 3.
Average concentrations of nitrate (NO3-N), nitrite (NO2-N), ammonium (NH4-N), total nitrogen (total-N), orthophosphate (PO43-P), total phosphorus (total-P) with maximum and minimum concentrations in parenthesis for SW and SGW in the study reach, West Run Watershed (WRW), Morgantown, WV from 2020–2021. SGW concentrations are averaged for piezometer clusters at each monitoring site.
| Nitrate (NO3-N) | ||
| Site | Surface Water (SW) | Shallow Groundwater (SGW) |
| 1A | 0.42(1.35, 0.001) | 0.32(1.59, 0.001) |
| 1B | 0.42(0.99, 0.001) | 0.66(6.03, 0.001) |
| 1C | 0.28(0.92, 0.001) | 0.14(0.87, 0.001) |
| 1D | 0.30(0.62, 0.001) | 0.19(1.23, 0.001) |
| Nitrite (NO2-N) | ||
| 1A | 0.01(0.04, 0.001) | 0.06(0.53, 0.001) |
| 1B | 0.02(0.38, 0.01) | 0.24(5.85, 0.001) |
| 1C | 0.01(0.03, 0.001) | 0.08(3.92, 0.001) |
| 1D | 0.01(0.06, 0.001) | 0.03(0.48, 0.001) |
| Ammonium (NH4-N) | ||
| 1A | 0.20(0.48, 0.05) | 1.15(2.77, 0.02) |
| 1B | 0.23(0.44, 0.08) | 0.22(1.78, 0.02) |
| 1C | 0.05(0.54, 0.01) | 0.10(0.84, 0.001) |
| 1D | 0.05(0.50, 0.01) | 0.16(1.23, 0.03) |
| Total nitrogen (Total-N) | ||
| 1A | 1.28(2.59, 0.75) | 2.80(14, 0.40) |
| 1B | 1.44(3.57, 0.75) | 2.13(9.31, 0.15) |
| 1C | 0.83(1.57, 0.34) | 1.05(4.05, 0.01) |
| 1D | 1.06(6.77, 0.37) | 1.20(3.52, 0.43) |
| Orthophosphate (PO43-P) | ||
| 1A | 0.003(0.02, 0.001) | 0.008(0.06, 0.001) |
| 1B | 0.01(0.07, 0.001) | 0.003(0.02, 0.001) |
| 1C | 0.004(0.03, 0.001) | 0.004(0.03, 0.001) |
| 1D | 0.004(0.03, 0.001) | 0.004(0.11, 0.001) |
| Total phosphorus (Total-P) | ||
| 1A | 0.06(0.28, 0.001) | 0.56(12, 0.001) |
| 1B | 0.07(0.36, 0.001) | 0.88(8.45, 0.001) |
| 1C | 0.04(0.27, 0.001) | 0.29(4.35, 0.001) |
| 1D | 0.04(0.43, 0.001) | 0.28(5.92, 0.001) |
Table 4.
Average nitrate (NO3-N), nitrite (NO2-N), ammonium (NH4-N), orthophosphate (PO43-P), total nitrogen (total_N), and total phosphorus (total_P) concentrations in SGW from co-located piezometers of monitoring stations 1A–1D in the study reach, West Run Watershed (WRW), Morgantown, WV from 2020–2021. Notes: The values in parentheses represent piezometer distance from the creek.
| Site | Piezometer | NO3-N | NO2-N | NH4-N | Total_N | PO43-P | Total_P |
|---|---|---|---|---|---|---|---|
| 1A | PC_1A (55 m) | 0.51 | 0.10 | 0.53 | 3.10 | 0.001 | 1.31 |
| PB_1A (21 m) | 0.23 | 0.05 | 1.40 | 2.94 | 0.001 | 0.46 | |
| PA_1A (19 m) | 0.29 | 0.06 | 1.16 | 2.34 | 0.001 | 0.29 | |
| PD_1A (16 m) | 0.23 | 0.02 | 1.55 | 2.84 | 0.001 | 0.18 | |
| 1B | PA_1B (28 m) | 1.19 | 0.49 | 0.41 | 3.01 | 0.001 | 1.64 |
| PB_1B (27 m) | 0.57 | 0.17 | 0.16 | 2.01 | 0.001 | 0.69 | |
| PC_1B (18 m) | 0.20 | 0.07 | 0.09 | 1.37 | 0.001 | 0.30 | |
| 1C | PB_1C (36 m) | 0.12 | 0.02 | 0.09 | 0.98 | 0.001 | 0.14 |
| PA_1C (35 m) | 0.15 | 0.03 | 0.09 | 1.02 | 0.001 | 0.22 | |
| PD_1C (19 m) | 0.16 | 0.19 | 0.13 | 3.79 | 0.001 | 0.52 | |
| 1D | PA_1D (43 m) | 0.16 | 0.01 | 0.11 | 1.29 | 0.001 | 0.18 |
| PC_1D (31 m) | 0.17 | 0.03 | 0.16 | 1.04 | 0.001 | 0.30 | |
| PB_1D (8 m) | 0.23 | 0.04 | 0.22 | 1.27 | 0.001 | 0.35 |
Table 5.
The eigenvalue, proportion of variance, and cumulative variance of each principal component (PC).
Table 5.
The eigenvalue, proportion of variance, and cumulative variance of each principal component (PC).
| Principal Component | PC1 | PC2 | PC3 | PC4 | PC5 | PC6 | PC7 | PC8 | PC9 | PC10 |
|---|---|---|---|---|---|---|---|---|---|---|
| Eigenvalue | 1.72 | 1.45 | 1.19 | 1.07 | 0.97 | 0.75 | 0.62 | 0.51 | 0.46 | 0.00 |
| Proportion of variance | 0.30 | 0.21 | 0.14 | 0.11 | 0.09 | 0.06 | 0.04 | 0.03 | 0.02 | 0.00 |
| Cumulative Proportion | 0.30 | 0.51 | 0.65 | 0.76 | 0.86 | 0.91 | 0.95 | 0.98 | 1.00 | 1.00 |
Table 6.
Loadings of nitrate (NO3-N), nitrite (NO2-N), ammonium (NH4-N), total nitrogen (Total_N), orthophosphate (PO43-P), Total phosphorus (Total_P), land-use percentages (forest, residential, agriculture), SW–SGW levels (water level) for first four principal components (PC1, PC2, PC3, and PC4). Loadings higher than the average threshold (>0.31) are in bold.
| Parameters | PC1 | PC2 | PC3 | PC4 |
|---|---|---|---|---|
| Water level | 0.12 | −0.25 | −0.55 | 0.31 |
| Forest | −0.33 | −0.38 | −0.31 | −0.38 |
| Residential | 0.20 | 0.60 | −0.08 | 0.29 |
| Grassland | 0.12 | −0.46 | 0.54 | 0.03 |
| NO3-N | 0.33 | 0.25 | 0.24 | −0.40 |
| NO2-N | 0.44 | 0.01 | −0.24 | −0.39 |
| NH4-N | 0.32 | −0.30 | 0.28 | 0.44 |
| Total_N | 0.43 | −0.22 | −0.15 | −0.07 |
| Total_P | 0.46 | −0.11 | −0.23 | 0.01 |
| PO43-P | 0.09 | 0.02 | 0.18 | −0.40 |
Disclaimer/Publisher’s Note: The statements, opinions and data contained in all publications are solely those of the individual author(s) and contributor(s) and not of MDPI and/or the editor(s). MDPI and/or the editor(s) disclaim responsibility for any injury to people or property resulting from any ideas, methods, instructions or products referred to in the content. |
© 2024 by the authors. Licensee MDPI, Basel, Switzerland. This article is an open access article distributed under the terms and conditions of the Creative Commons Attribution (CC BY) license (https://creativecommons.org/licenses/by/4.0/).
Share and Cite
MDPI and ACS Style
Abesh, B.F.; Anderson, J.T.; Hubbart, J.A. Surface Water (SW) and Shallow Groundwater (SGW) Nutrient Concentrations in Riparian Wetlands of a Mixed Land-Use Catchment. Land 2024, 13, 409. https://doi.org/10.3390/land13040409
AMA Style
Abesh BF, Anderson JT, Hubbart JA. Surface Water (SW) and Shallow Groundwater (SGW) Nutrient Concentrations in Riparian Wetlands of a Mixed Land-Use Catchment. Land. 2024; 13(4):409. https://doi.org/10.3390/land13040409
Chicago/Turabian StyleAbesh, Bidisha Faruque, James T. Anderson, and Jason A. Hubbart. 2024. "Surface Water (SW) and Shallow Groundwater (SGW) Nutrient Concentrations in Riparian Wetlands of a Mixed Land-Use Catchment" Land 13, no. 4: 409. https://doi.org/10.3390/land13040409
Note that from the first issue of 2016, this journal uses article numbers instead of page numbers. See further details here.