Author Contributions
Conceptualization, P.C.M.I., W.B.C. and A.A.M.; Methodology, P.C.M.I., G.M.F.A., W.B.C. and A.A.M.; Software, G.S.F. and G.M.F.A.; Validation, M.O.J.L. and A.A.M.; Formal analysis, P.C.M.I., G.S.F. and G.M.F.A.; Investigation, P.C.M.I., G.S.F., W.B.C. and A.A.M.; Resources, L.S.F.R., R.E. and A.A.M.; Data curation, P.C.M.I. and G.S.F.; Writing—original draft, P.C.M.I. and G.S.F.; Writing—review & editing, G.M.F.A., W.B.C. and A.A.M.; Supervision, L.S.F.R. and M.O.J.L.; Project administration, L.S.F.R., R.E. and A.A.M.; Funding acquisition, L.S.F.R. and A.A.M. All authors have read and agreed to the published version of the manuscript.
Figure 1.
Study areas and sampling plots.
Figure 1.
Study areas and sampling plots.
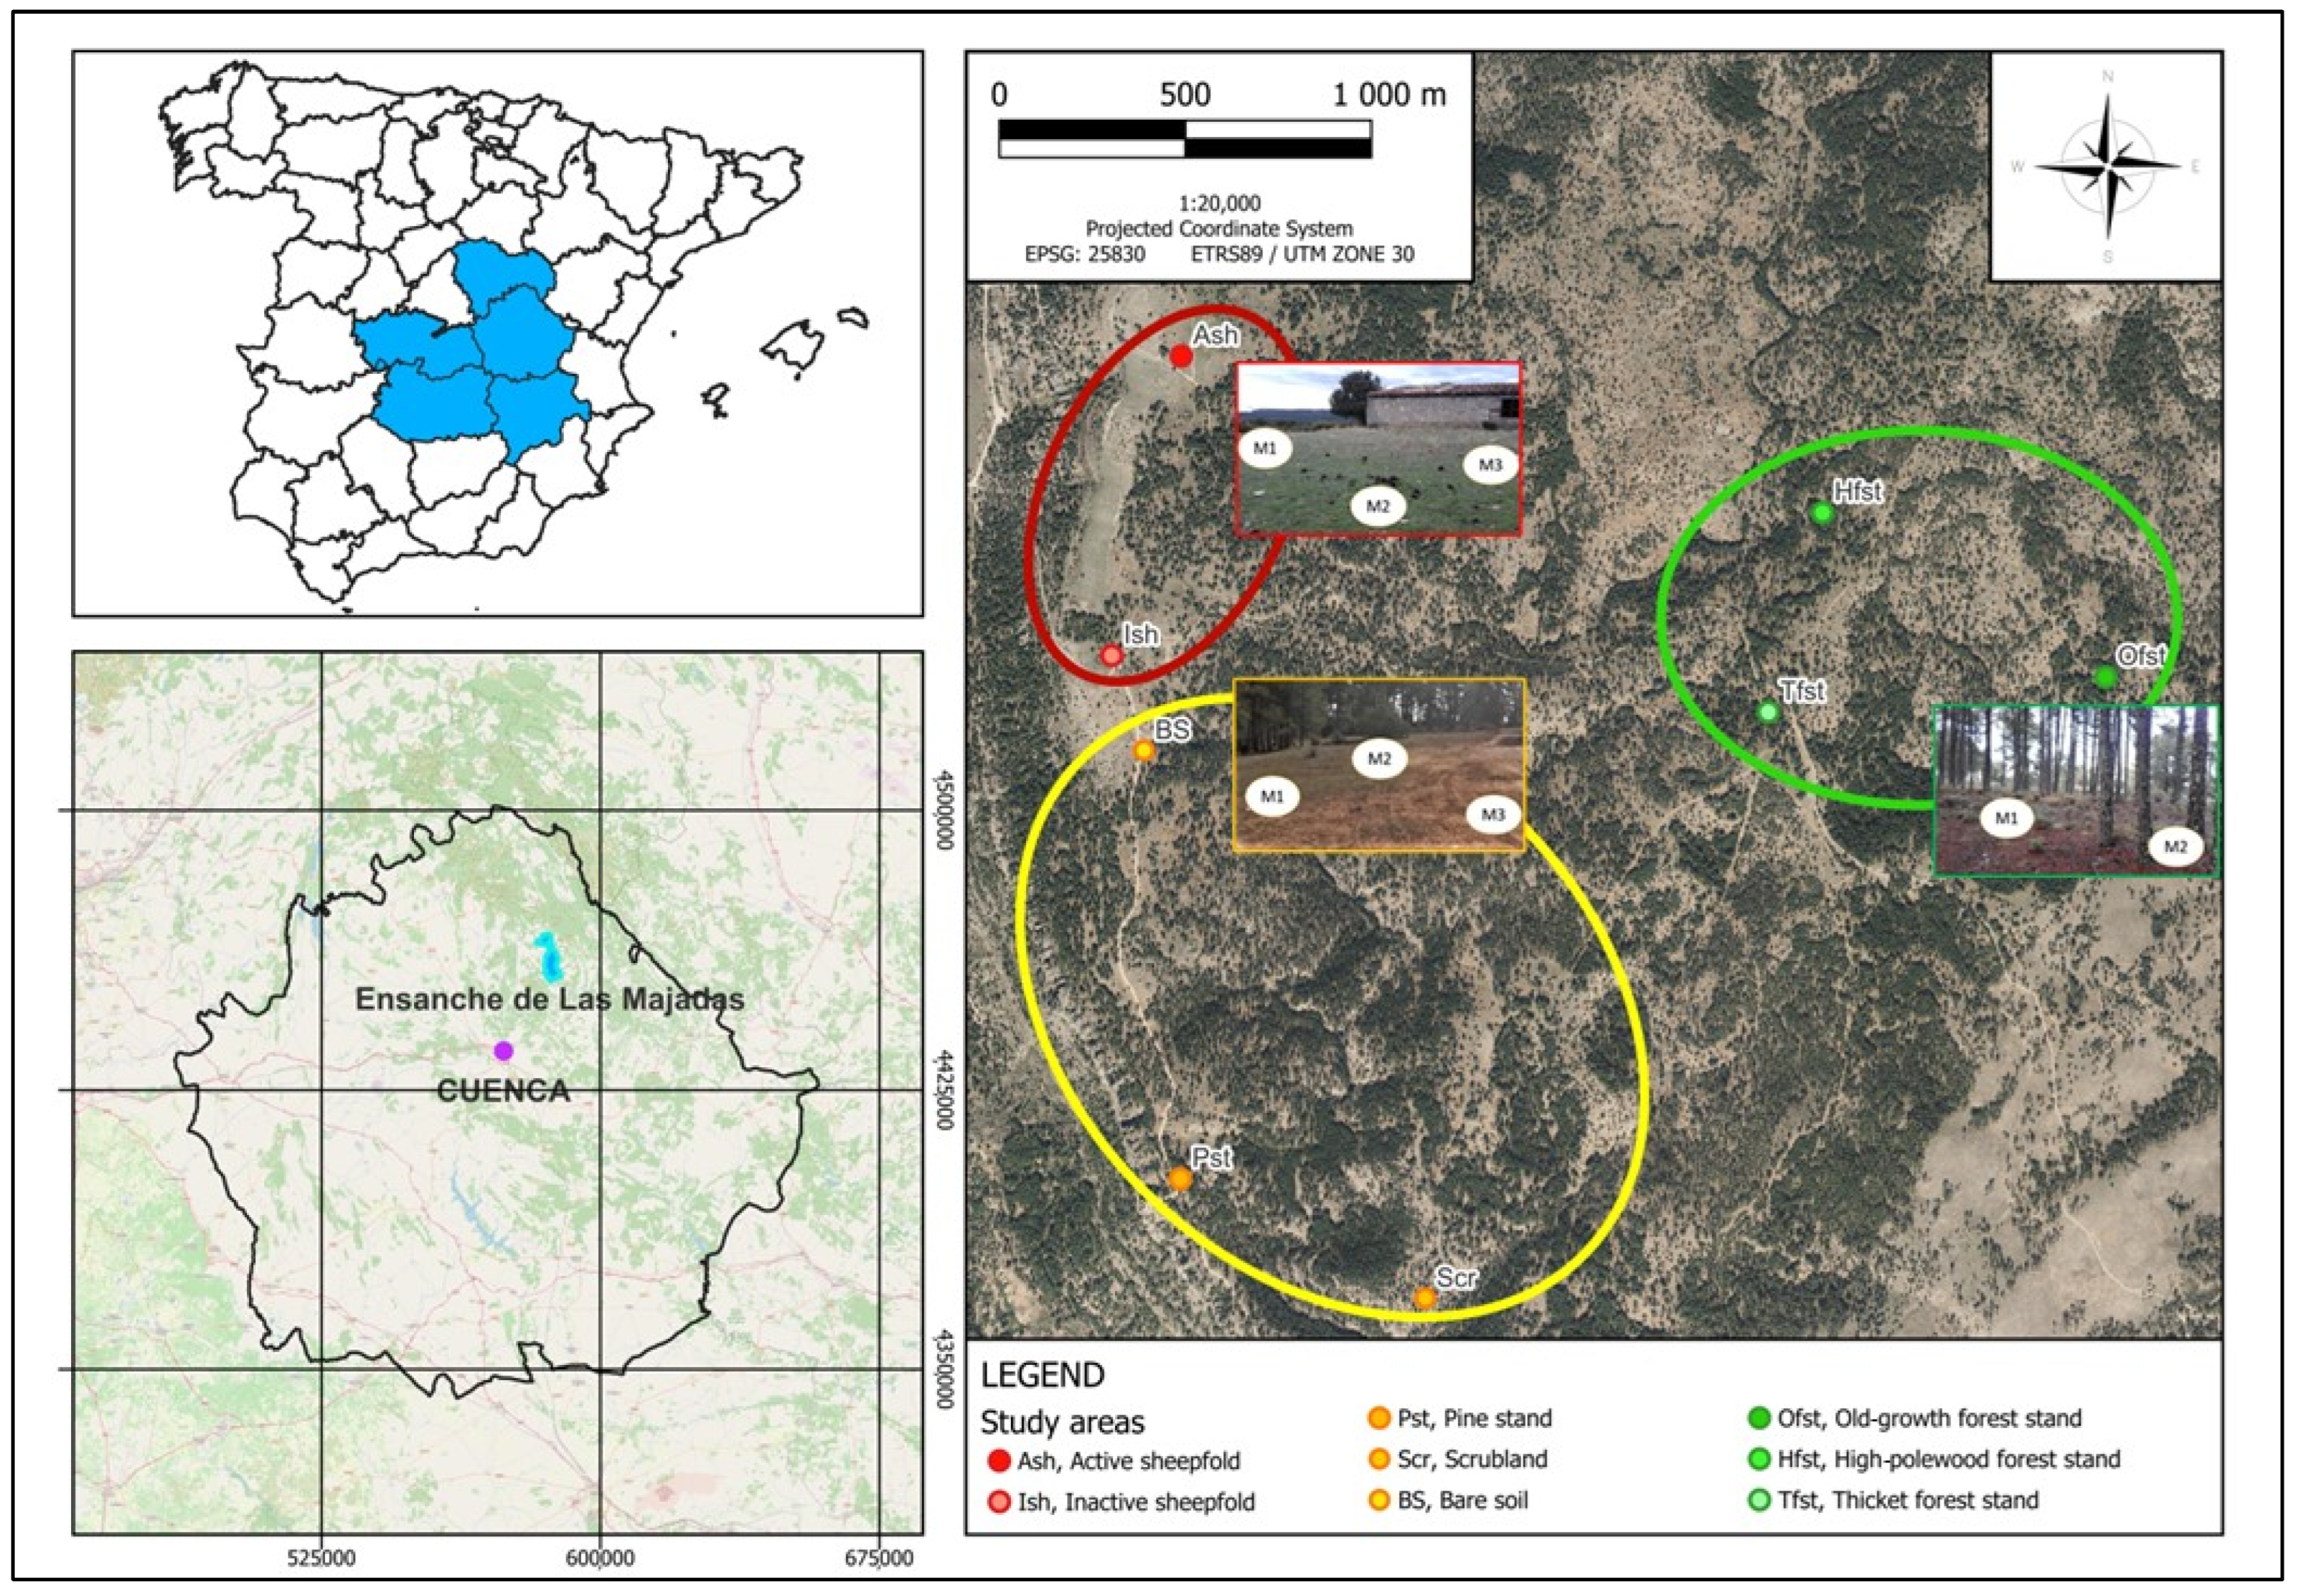
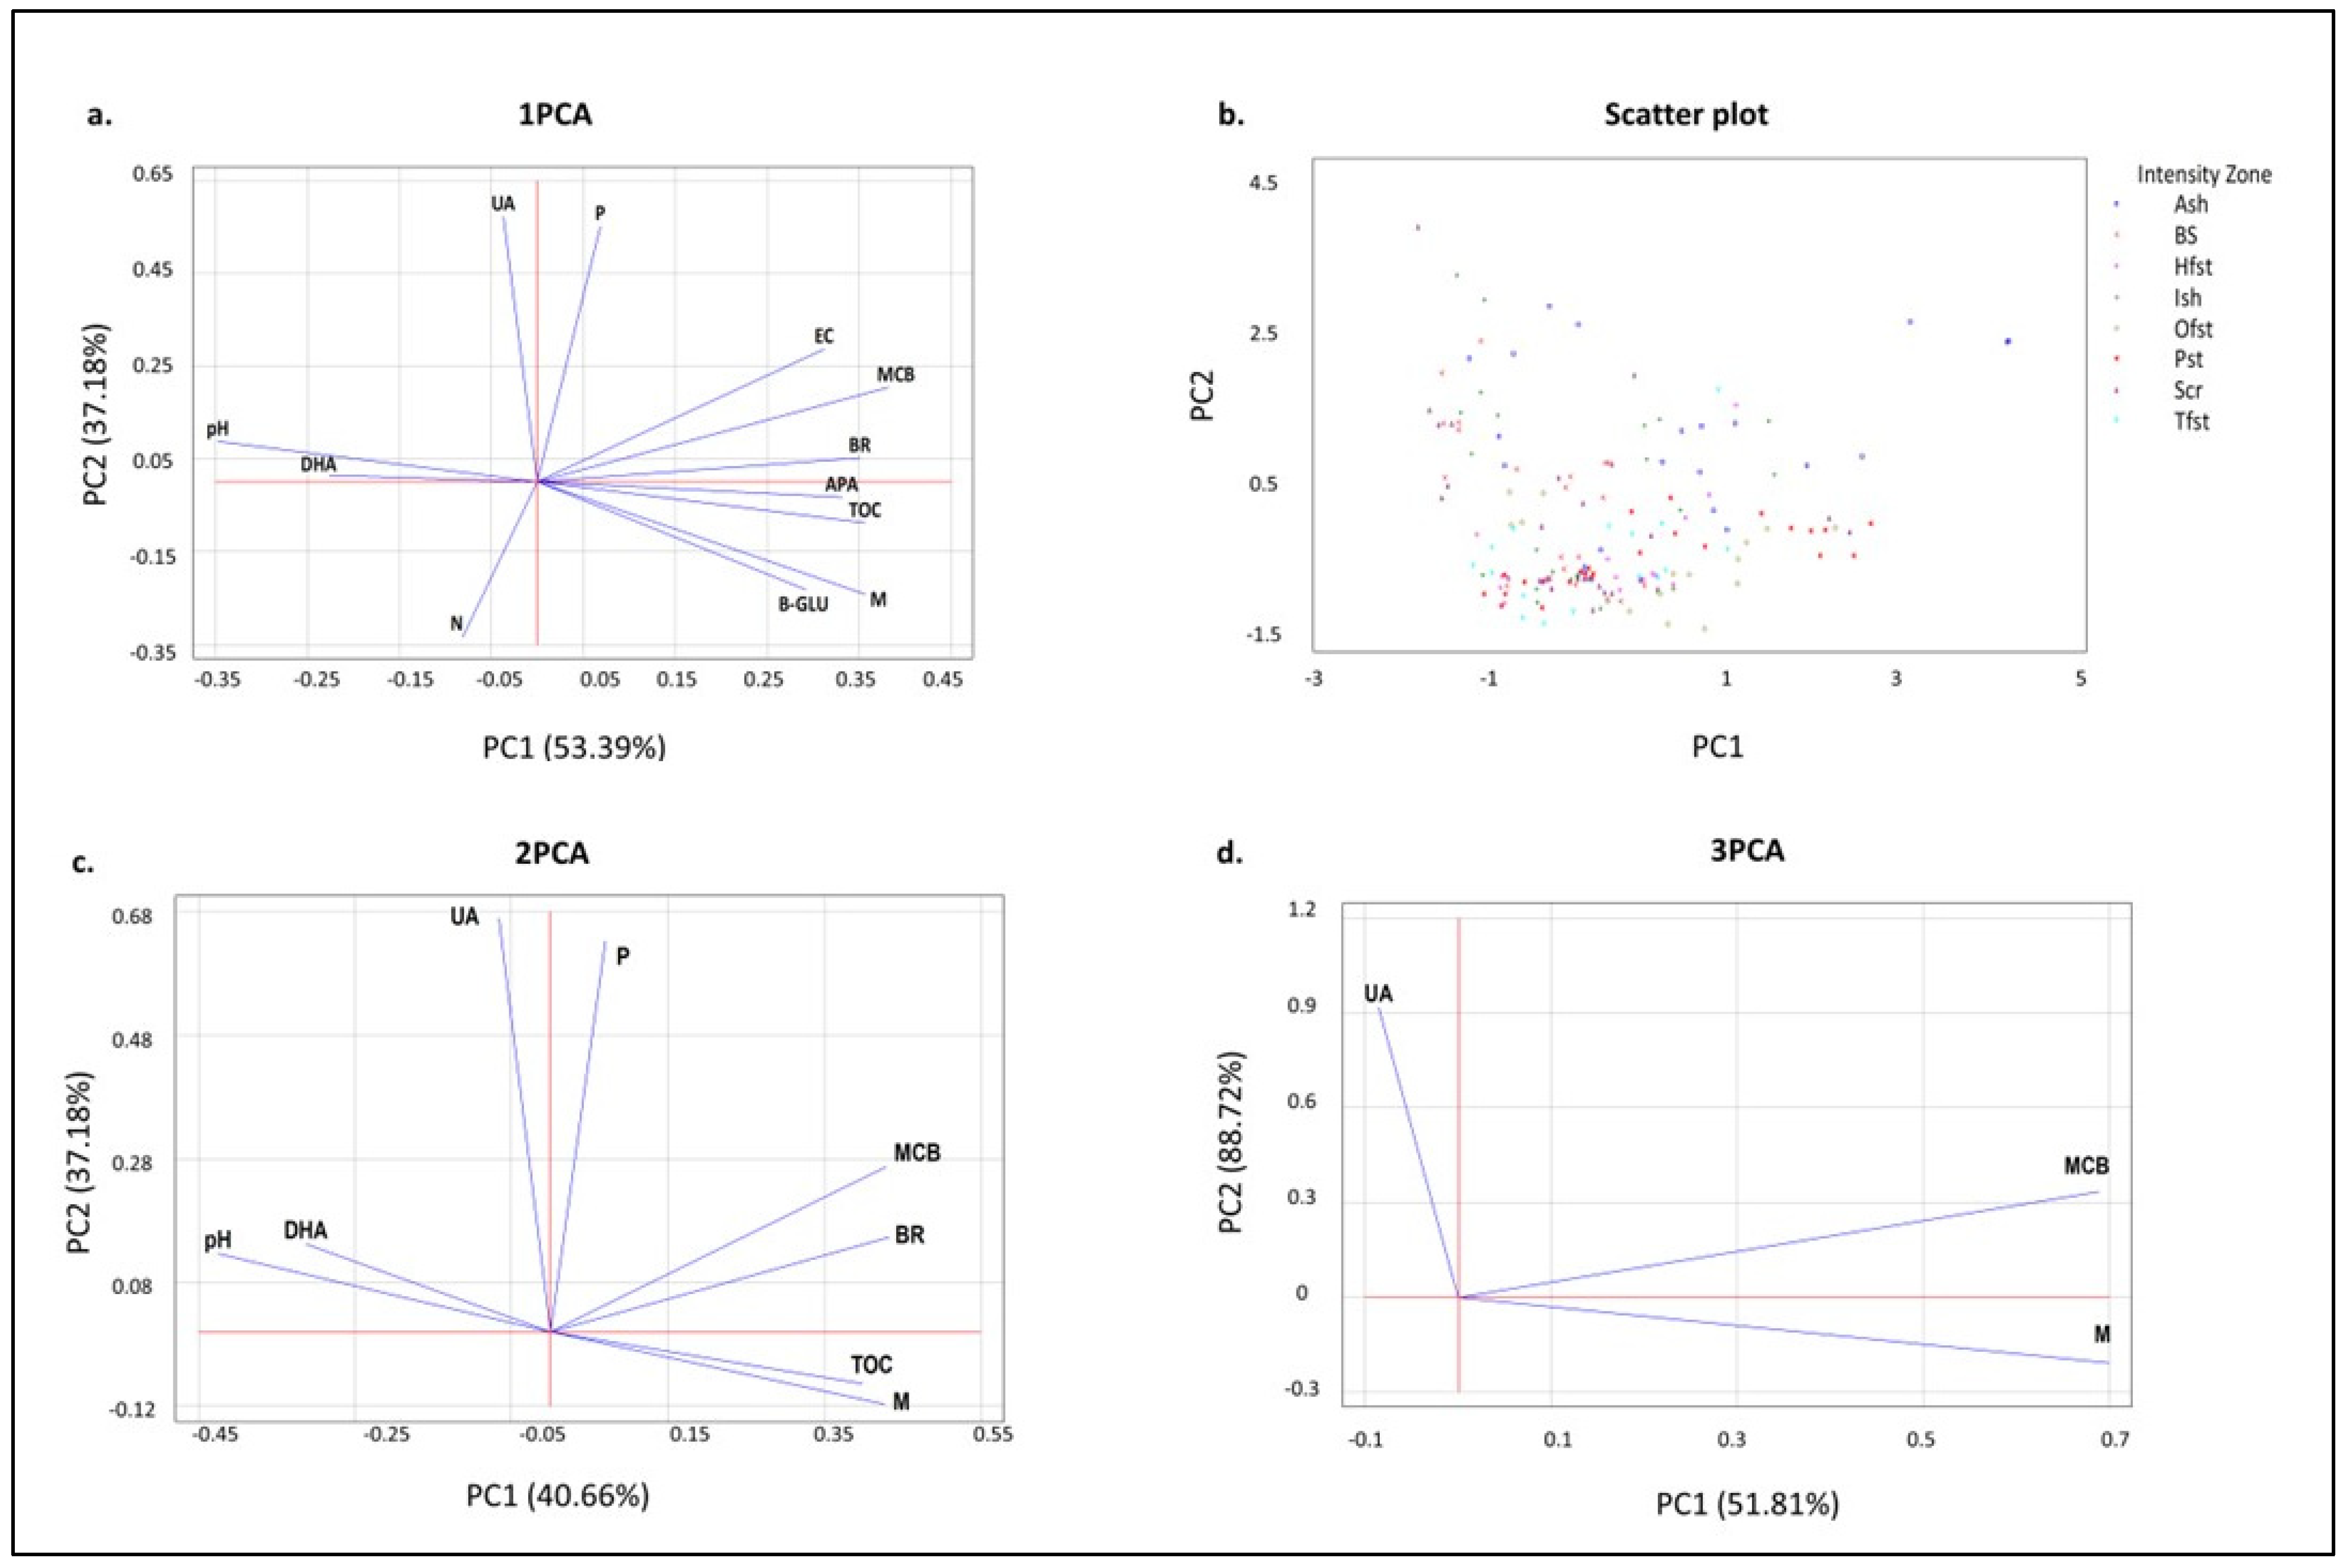
Figure 2.
Mean soil quality index (SQI) value in each study area. Ash, active sheepfold; Ish, inactive sheepfold; BS, bare soil; Scr, scrubland; Pst, pine stand; Tfst, thicket forest stand; Hfst, high-polewood forest stand; and Ofst, old-growth forest stand (n = 168, units shown on the planes of the axes).
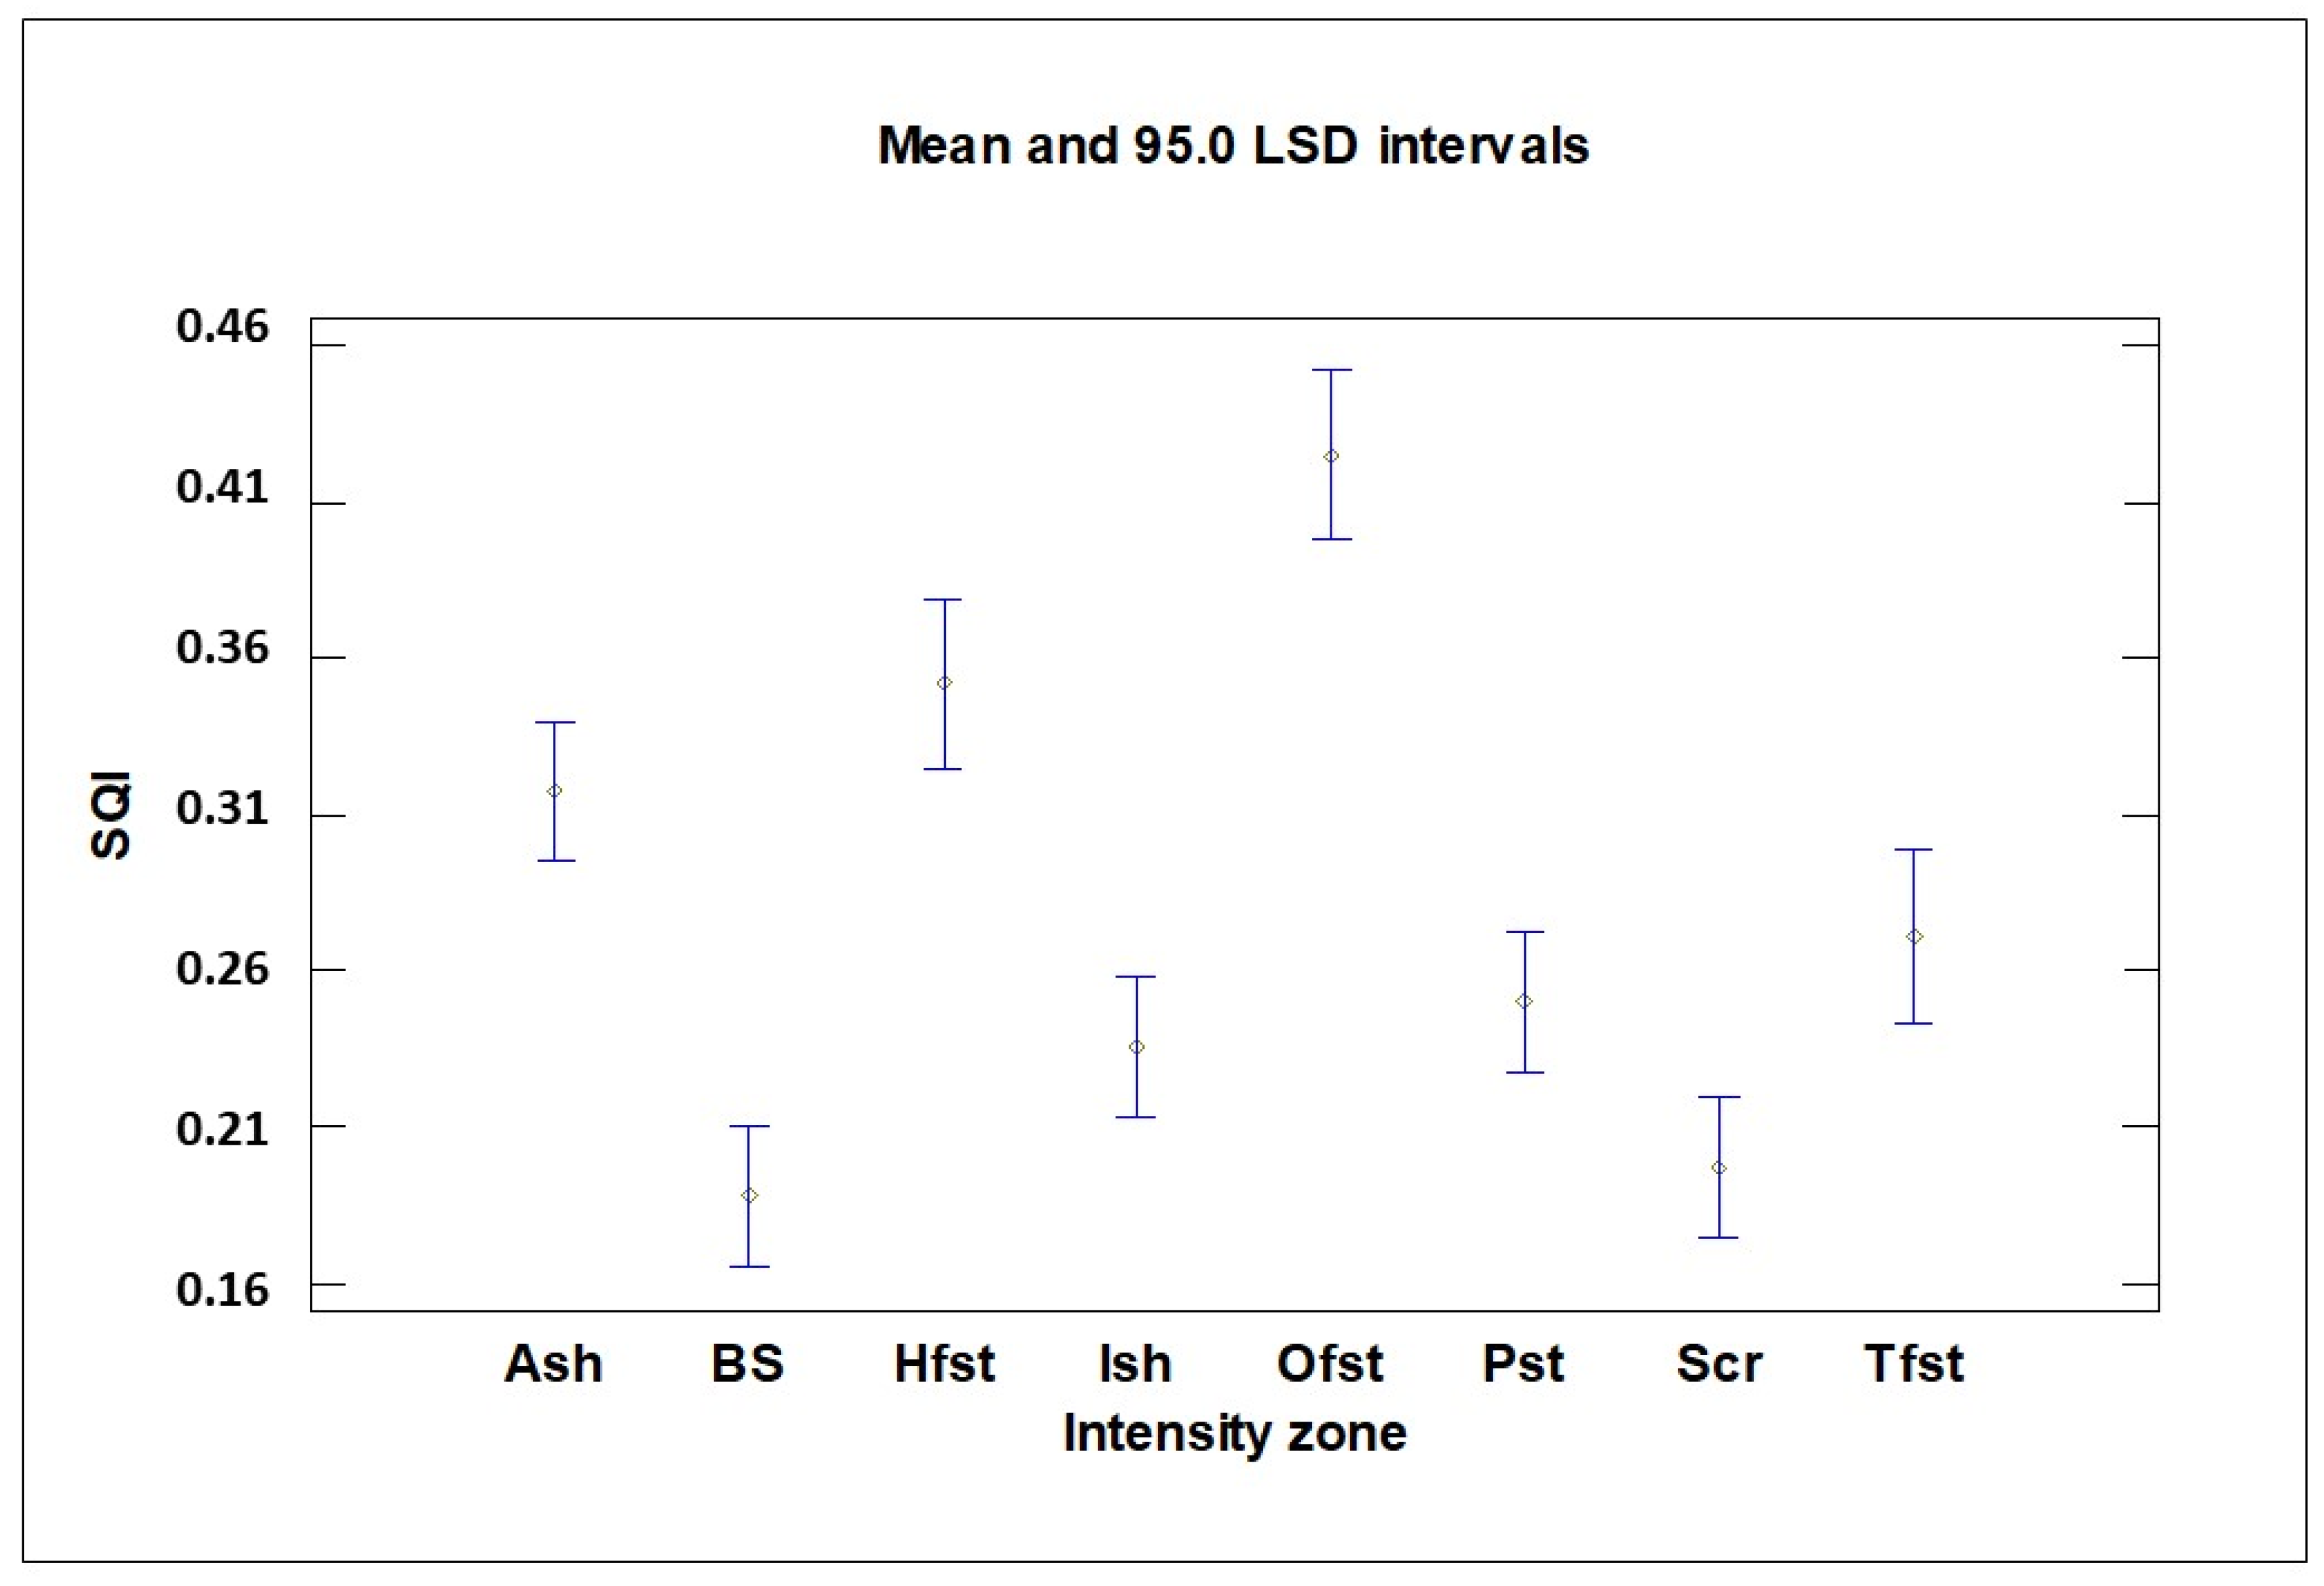
Figure 3.
(a) Diagram showing the eigenvectors for each one of the twelve parameters (shown as lines) on the first two principal component axes. Longer lines indicate parameters that relate strongly to the axes, and the closer they are plotted, the stronger the correlations between the parameters (n = 168, units shown on the planes of the axes). (b) Scatter plot of the principal component scores of the standardized data. Abbreviations: Ash, active sheepfold; Ish, inactive sheepfold; BS, bare soil; Scr, scrubland; Pst, pine stand; Tfst, thicket forest stand; Hfst, high-polewood forest stand; Ofst, old-growth forest stand; TOC, total organic carbon; N, total nitrogen; M, moisture; pH, soil acidity; BR, basal soil respiration; MBC, microbial biomass carbon; APA, phosphatase activity; β-GLU, β-glucosidase activity. (c) Principal component analysis (2PCA) performed using the eight selected parameters. The eigenvector for each of the eight parameters is plotted on the plane. (d) Principal component analysis (3PCA) performed using the eight selected parameters, with axes 3PC1 and 3PC2. M, moisture; pH, soil acidity; MBC, microbial biomass carbon; UA, urease activity.
![Land 13 00411 g003]()
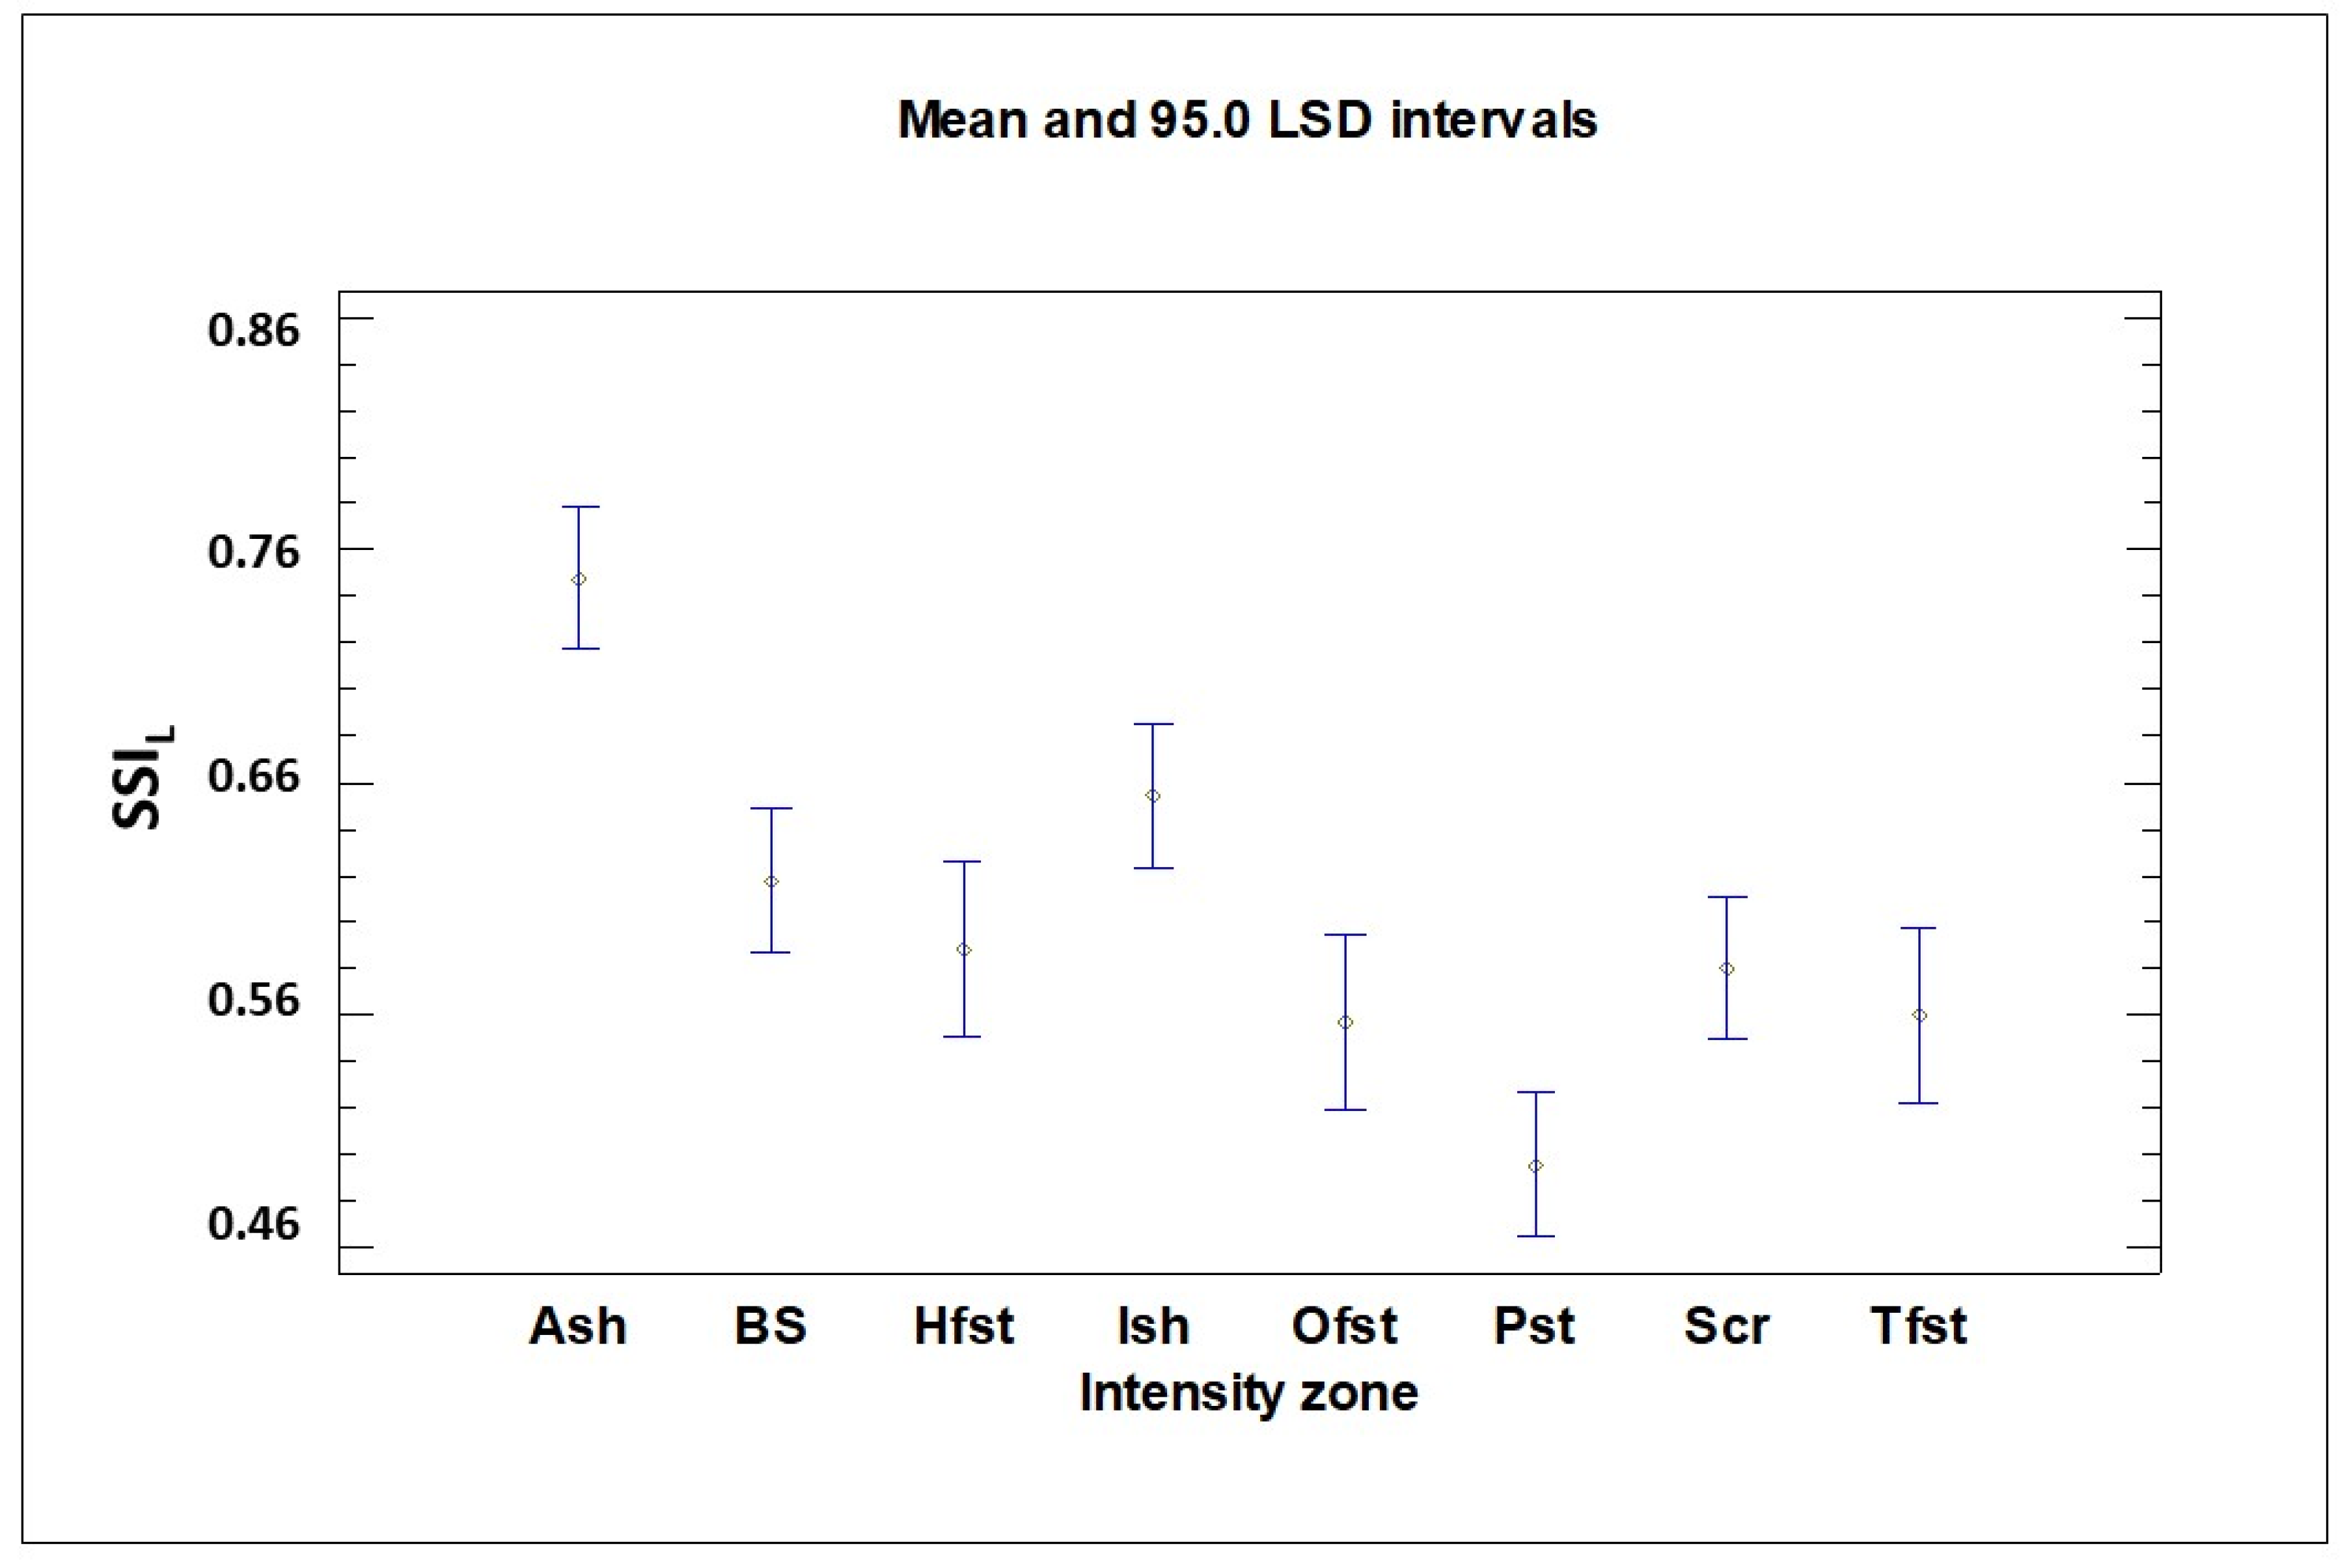
Figure 4.
Average value of SSIL (Soil Status Index by Livestock) in each study area. Ash, active sheepfold; Ish, inactive sheepfold; BS, bare soil; Scr, scrubland; Pst, pine stand; Tfst, thicket forest stand; Hfst, high-polewood forest stand; and Ofst, old-growth forest stand (n = 168, units shown on the planes of the axes).
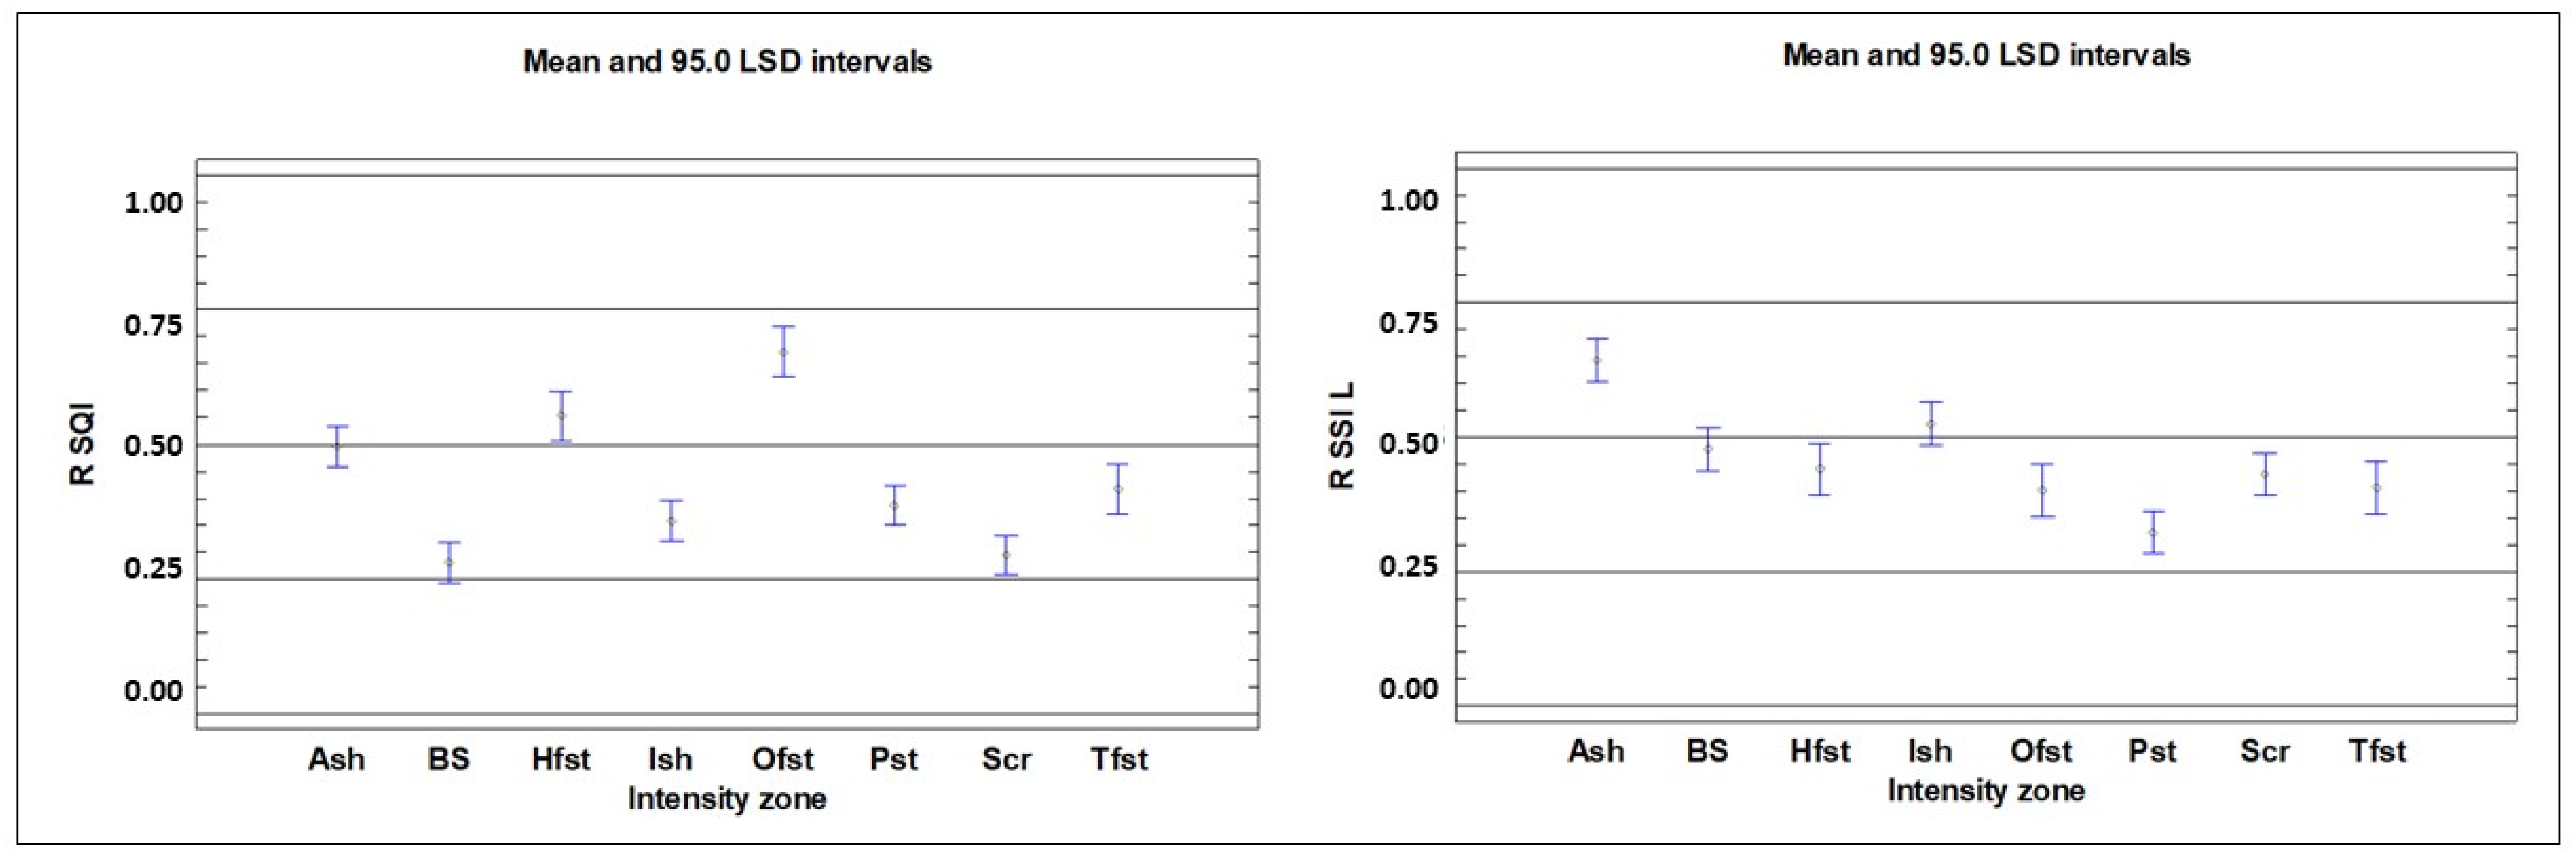
Figure 5.
Ranges for RSQI and RSSIL in each study area. Ash, active sheepfold; Ish, inactive sheepfold; BS, bare soil; Scr, scrubland; Pst, pine stand; Tfst, thicket forest stand; Hfst, high-polewood forest stand; and Ofst, old-growth forest stand (n = 168, units shown on the planes of the axes).
Figure 5.
Ranges for RSQI and RSSIL in each study area. Ash, active sheepfold; Ish, inactive sheepfold; BS, bare soil; Scr, scrubland; Pst, pine stand; Tfst, thicket forest stand; Hfst, high-polewood forest stand; and Ofst, old-growth forest stand (n = 168, units shown on the planes of the axes).
Table 1.
Tree and shrub species, vegetation cover density and main characteristics of the study areas in “Ensanche de Las Majadas”.
Table 1.
Tree and shrub species, vegetation cover density and main characteristics of the study areas in “Ensanche de Las Majadas”.
| Area | UTM | Alt. (m) | VEGETATION COVER |
|---|
| X | Y | TVc (%) | Tree Species | Vc (%) | | Shrub Species | Vc (%) | | Other Genres | | Vc (%) |
|---|
| Ash | 585,166 | 4,459,908 | 1393 | 50 | | | | | | | Pasture, Thymus, Lavandula, Eryngium | | 50 |
| Ish | 584,979 | 4,459,104 | 1446 | 50 | | | | | | | | 50 |
| BS | 585,065 | 4,458,849 | 1440 | 30 | | | | Juniperus communis L., Juniperus oxycedrus L., Crataegus monogyna Jacq., Amelanchier ovalis, Berberis hispanica Bois. & Reut., Buxus sempervirens L. | 30 | | | |
| Scr | 585,822 | 4,457,380 | 713 | 50 | | | | 30 | | | 25 |
| Pst | 585,163 | 4,457,700 | 1384 | 70 | Pinus nigra Arn. ssp salzmannii, Pinus sylvestris L. | 50 | | 50 | | | 10 |
| Tfst | 586,744 | 4,458,952 | 1444 | 70 | 50 | | 50 | | | 20 |
| Hfst | 586,89 | 4,459,488 | 1457 | 70 | 50 | | 50 | | | 20 |
| Ofst | 587,651 | 4,459,046 | 1444 | 70 | 50 | | 50 | | | 20 |
Table 2.
Estimation of Livestock Loading Unit (LLU) for the study areas.
Table 2.
Estimation of Livestock Loading Unit (LLU) for the study areas.
| Area | Type of livestock | n° Individuals | Cf | LSR | Total LSR | Area (ha) | LLU |
|---|
| Ash | Ovine cattle | 1256 | 0.15 | 188.40 | 188.40 | 4.20 | 45.00 |
| Ish | Ovine cattle/ Caprine cattle/ Bovine cattle/ Equine cattle | 2219 | 0.15 | 332.85 | 1125.90 | 3860.19 | 0.30 |
| BS | 1 | 0.15 | 0.15 | 0.30 |
| Scr | 469 | 1.00 | 469.00 | 0.30 |
| Pst | 162 | 0.40 | 64.80 | 0.30 |
| Tfst | Deer/ Fallow deer | 17 | 0.40 | 6.80 | 6.80 | 3964.94 | 0.00 |
| Hfst | 0.00 |
| Ofst | 0.00 |
Table 3.
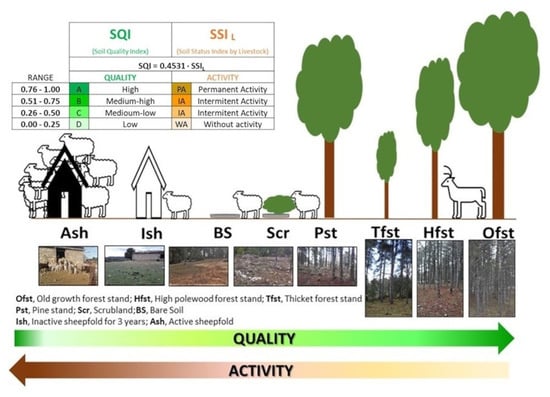
Soil quality value ranges.
Table 3.
Soil quality value ranges.
| Range | Quality |
|---|
| 0.76–1.00 | A | High |
| 0.51–0.75 | B | Medium–high |
| 0.26–0.50 | C | Medium–low |
| 0.00–0.25 | D | Low |
Table 4.
Mean values and standard deviations for each parameter in each study area (n = 168).
Table 4.
Mean values and standard deviations for each parameter in each study area (n = 168).
| Parameters I | Physicochemical | Microbiological | Enzymatic Activities |
|---|
| TOC | N | P | M | pH | EC | BR | MBC | DHA | UA | APA | β-GLU |
|---|
| | (%) | (%) | (ppm) | (%) | | (mS · m−1) | (μg C-CO2· | (μg C · g−1) | (μmol(INTF) | (μmol(N-NH4+) | (μmol(PNF) | (μmol(PNF) |
|---|
| Area II | | | | | | | g−1· day−1) | | · g−1 · h−1) | · g−1 · h−1) | · g−1 · h−1) | · g−1 · h−1) |
|---|
| Ash | 5.61 ± 0.23 b | 1.15 ± 0.06 a | 191.78 ± 15.84 a | 32.33 ± 1.26 b | 7.55 ± 0.08 cd | 31.66 ± 1.67 a | 126.55 ± 9.93 ab | 2142.25 ± 120.44 a | 0.03 ± 0.00 cd | 27.65 ± 1.48 a | 116.39 ± 7.00 a | 34.77 ± 1.90 d |
| Ish | 5.07 ± 0.23 b | 1.01 ± 0.06 abc | 187.10 ± 15.84 a | 23.95 ± 1.26 d | 7.72 ± 0.08 abc | 20.45 ± 1.67 bc | 48.40 ± 9.93 ef | 1073.11 ± 120.44 bc | 0.03 ± 0.00 bc | 21.78 ± 1.48 b | 94.36 ± 7.00 cd | 28.28 ± 1.90 e |
| BS | 5.26 ± 0.23 b | 0.88 ± 0.06 c | 48.66 ± 15.84 b | 19.67 ± 1.26 e | 7.92 ± 0.08 a | 14.55 ± 1.67 d | 35.41 ± 9.93 f | 821.48 ± 120.44 c | 0.04 ± 0.00 a | 19.22 ± 1.48 b | 84.80 ± 7.00 de | 37.15 ± 1.90 cd |
| Scr | 5.18 ± 0.23 b | 0.87 ± 0.06 c | 37.98 ± 15.84 b | 24.25 ± 1.26 d | 7.91 ± 0.08 ab | 16.05 ± 1.67 cd | 31.43 ± 9.93 f | 792.68 ± 120.44 c | 0.04 ± 0.00 ab | 20.53 ± 1.48 b | 112.75 ± 7.00 abc | 32.22 ± 1.90 de |
| Pst | 6.77 ± 0.23 a | 1.09 ± 0.06 ab | 54.11 ± 15.84 b | 38.26 ± 1.26 a | 7.33 ± 0.08 d | 31.05 ± 1.67 a | 99.15 ± 9.93 bc | 1041.76 ± 120.44 bc | 0.03 ± 0.00 de | 13.89 ± 1.48 c | 115.08 ± 7.00 ab | 51.73 ± 1.90 b |
| Tfst | 5.29 ± 0.28 b | 0.86 ± 0.07 c | 43.44 ± 19.39 b | 27.65 ± 1.55 cd | 7.66 ± 0.10 bc | 24.92 ± 2.05 b | 67.23 ± 12.16 de | 844.04 ± 147.51 bc | 0.03 ± 0.00 e | 12.34 ± 1.81 c | 67.53 ± 8.57 e | 42.70 ± 2.33 c |
| Hfst | 5.19 ± 0.28 b | 0.93 ± 0.07 bc | 43.18 ± 19.39 b | 30.51 ± 1.55 bc | 6.74 ± 0.10 e | 17.67 ± 2.05 cd | 88.86 ± 12.16 cd | 1028.94 ± 147.51 bc | 0.01 ± 0.00 f | 12.16 ± 1.81 c | 77.62 ± 8.57 de | 57.45 ± 2.33 ab |
| Ofst | 6.71 ± 0.28 a | 1.08 ± 0.07 ab | 46.31 ± 19.39 b | 37.40 ± 1.55 a | 5.97 ± 0.10 f | 17.24 ± 2.05 cd | 142.21 ± 2.16 a | 1249.34 ± 147.51 b | 0.01 ± 0.00 f | 12.12 ± 1.81 c | 93.21 ± 8.57 bcd | 59.86 ± 2.33 ab |
Table 5.
Significance levels of the factors intensity zone (IZ), season (S) and their interaction (IZ × S) and their effects on the SQI value.
Table 5.
Significance levels of the factors intensity zone (IZ), season (S) and their interaction (IZ × S) and their effects on the SQI value.
| | GLM |
|---|
| | Fp | Model |
| Variable | IZ | S | IZ × S | R2 | Fp |
| SQI | 20.15 *** | 96.91 *** | 3.90 *** | 79.20 | 16.70 *** |
Table 6.
Mean values of the soil quality index (SQI) in each study area.
Table 6.
Mean values of the soil quality index (SQI) in each study area.
| Area | SQI | |
|---|
| Ash | 0.32 | ± | 0.02 | bc |
| Ish | 0.24 | ± | 0.02 | de |
| BS | 0.19 | ± | 0.02 | f |
| Scr | 0.19 | ± | 0.02 | ef |
| Pst | 0.25 | ± | 0.02 | d |
| Tfst | 0.27 | ± | 0.02 | cd |
| Hfst | 0.35 | ± | 0.02 | b |
| Ofst | 0.42 | ± | 0.02 | a |
Table 7.
Results of a principal component analysis (PCA) performed with the full set of parameters: eigenvalues from the first three principal components, percentage variance explained (EV), cumulative variance percentage (CV) and corrected explained variance (CEV).
Table 7.
Results of a principal component analysis (PCA) performed with the full set of parameters: eigenvalues from the first three principal components, percentage variance explained (EV), cumulative variance percentage (CV) and corrected explained variance (CEV).
| Principal Component Analysis | 1PCA | 2PCA | 3PCA |
|---|
| Principal Component | 1PC1 | 1PC2 | 1PC3 | 2PC1 | 2PC2 | 2PC3 | 3PC1 | 3PC2 |
| Eigenvalue | 4.46 | 1.94 | 1.55 | 3.25 | 1.69 | 1.03 | 1.55 | 1.11 |
| EV | 37.18 | 16.21 | 12.96 | 40.66 | 21.08 | 12.91 | 51.61 | 37.11 |
| CV | 37.18 | 53.39 | 66.36 | 40.66 | 61.74 | 74.65 | 51.61 | 88.72 |
| CEV | | | | | | | 58.17 | 41.82 |
| Parameters a | | | | | | | | |
| TOC | 0.36 | −0.09 | 0.13 | 0.40 | | | | |
| N | −0.08 | −0.33 | 0.48 | | | | | |
| P | 0.07 | 0.55 | 0.14 | | | | | |
| M | 0.36 | −0.24 | 0.20 | 0.43 | | | 0.72 | |
| pH | −0.35 | 0.09 | 0.42 | −0.42 | | | | |
| EC | 0.31 | 0.29 | 0.00 | | | | | |
| BR | 0.35 | 0.05 | 0.09 | 0.43 | | | | |
| MBC | 0.38 | 0.20 | 0.20 | 0.43 | | | 0.69 | |
| DHA | −0.23 | 0.01 | 0.54 | | | 0.73 | | |
| UA | −0.04 | 0.57 | 0.04 | | 0.67 | | | 0.92 |
| APA | 0.33 | −0.03 | 0.37 | | | | | |
| B-GLU | 0.29 | −0.23 | −0.19 | | | | | |
Table 8.
Values of the constants of each standardization equation and correlation coefficient for each of the parameters that make up the SSIL.
Table 8.
Values of the constants of each standardization equation and correlation coefficient for each of the parameters that make up the SSIL.
| Variables a or Constants b | Op | σ | B | L | m | Standarization Equation | r |
|---|
| M (%) | 28.88 | 13.79 | | | | y = e − ((M − 28.88)2)/(2 × 13.792)) | 0.99 |
| MBC (μg C g−1) | | | 1136.12 | 0.01 | 1.8 | y = 1/(1 + (1136.12) / (MBC))1.8) | 0.99 |
| UA (μmol N-NH4+ g−1 h−1) | | | 18.21 | 1.33 | 1.8 | y = 1/(1+ (18.21 / UA)1.8) | 0.98 |
Table 9.
Significance levels of the factors intensity zone (IZ) and season (S) and their interaction (IZ × S) and their effects on the SSIL value.
Table 9.
Significance levels of the factors intensity zone (IZ) and season (S) and their interaction (IZ × S) and their effects on the SSIL value.
| | GLM |
|---|
| | Fp | Model |
| Variable | IZ | S | IZ × S | R2 | Fp |
| SSIL | 11.38 *** | 38.70 *** | 5.81 *** | 70.64 | 10.55 *** |
Table 10.
Mean values and standard deviations of the Soil Status Index by Livestock (SSIL) in the study areas.
Table 10.
Mean values and standard deviations of the Soil Status Index by Livestock (SSIL) in the study areas.
| Area | SSIL |
|---|
| Ash | 0.75 | ± | 0.02 | a |
| Ish | 0.65 | ± | 0.02 | b |
| BS | 0.62 | ± | 0.02 | bc |
| Scr | 0.58 | ± | 0.02 | c |
| Pst | 0.49 | ± | 0.02 | d |
| Tfst | 0.56 | ± | 0.03 | cd |
| Hfst | 0.59 | ± | 0.03 | bc |
| Ofst | 0.56 | ± | 0.03 | cd |
Table 11.
Adjustment equation and correlation between SQI and SSIL.
Table 11.
Adjustment equation and correlation between SQI and SSIL.
| | Model |
|---|
| | Fp | R2 (%) | SEE |
|---|
| SQI = 0.4531 · SSIL | 897.69 *** | 84.31 | 0.12 |
Table 12.
Classification of soil areas based on quality or livestock activity levels established using the Rank Soil Quality Index (RSQI) and the Rank Soil Status Index by Livestock (RSSIL).
Table 12.
Classification of soil areas based on quality or livestock activity levels established using the Rank Soil Quality Index (RSQI) and the Rank Soil Status Index by Livestock (RSSIL).
| Area | RSQI | Quality | RSSIL | Status by livestock |
|---|
| Ash | 0.49 ± 0.03 bc | medium–high | 0.64 ± 0.03 a | medium–high |
| Ish | 0.36 ± 0.03 de | medium–low | 0.52 ± 0.03 b | medium–high |
| BS | 0.28 ± 0.03 f | medium–low | 0.48 ± 0.03 bc | medium–low |
| Scr | 0.29 ± 0.03 ef | medium–low | 0.43 ± 0.03 c | medium–low |
| Pst | 0.38 ± 0.03 d | medium–high | 0.32 ± 0.03 d | medium–low |
| Tfst | 0.42 ± 0.03 cd | medium–high | 0.41 ± 0.03 cd | medium–low |
| Hfst | 0.55 ± 0.03 b | medium–high | 0.44 ± 0.03 bc | medium–low |
| Ofst | 0.67 ± 0.03 a | high | 0.40 ± 0.03 cd | medium–low |


 ,
, 


