
The Evolution and Driving Mechanisms of the Blue-Green Space Publicness Pattern in Changsha, China
1
School of Architecture and Art, Central South University, Changsha 410017, China
2
School of Geographical Sciences, Hunan Normal University, Changsha 410081, China
3
Hunan Key Laboratory of Geospatial Big Data Mining and Application, Hunan Provincial Normal University, Changsha 410081, China
4
Hunan Sidayuan Planning Consulting and Research Co., Ltd., Changsha 410081, China
*
Author to whom correspondence should be addressed.
Land 2024, 13(4), 403; https://doi.org/10.3390/land13040403
Submission received: 15 February 2024
/
Revised: 19 March 2024
/
Accepted: 21 March 2024
/
Published: 22 March 2024
(This article belongs to the Topic Healthy and Sustainable Living Environments: Green and Blue Spaces)
Abstract
:Urban blue-green space (UBGS), where public life occurs, is vital for social interaction, social cohesion, public spirit cultivation, and community formation. UBGS publicness reflects whether it supports and facilitates community formation. From the perspective of the man–land relationship, UBGS with high publicness should have three significant characteristics: accessibility of elements, functional selectivity, and structural connectivity and shareability. This study took Changsha as the case study and evaluated its UBGS publicness in 2012, 2016, and 2020. We analyzed the evolution of the UBGS publicness pattern, and the results indicated the following: (1) The elements accessibility indicator showed a decreasing trend year by year and maintained the pattern of low in the city center and high in the suburban area; (2) the functional diversity indicator changed from a monocentric polarized spatial pattern to a polycentric and balanced spatial pattern; (3) the structural connectivity indicator generally improved and showed the core-edge pattern; and (4) the comprehensive indicator showed that the pattern developed from the core edge to the core edge as the primary focus with fan-shaped expansion supplemented. Based on this, combined with Changsha’s urban development history, environmental, policy, economic, and social factors supported, led, promoted, and guided the formation and evolution of the UBGS publicness pattern. This study improved the theoretical foundation of UBGS publicness, provided ideas and methods for the UBGS publicness evaluation on the urban scale, and may provide a reference for the construction of livable and sustainable cities.
1. Introduction
According to the New Urban Agenda, urban blue-green space (UBGS), formed by green space and water systems, should be well connected in terms of function, form, and structure [1] to meet public life needs with abundant space, rich choices, and continuous experience [2,3]. On this basis, UBGS will promote social interaction, strengthen social cohesion, enrich cultural diversity, cultivate the public spirit, and then realize the publicness value [4,5,6]. In other words, UBGS can be used as the focus to achieve macro-development goals such as the people’s right to the city, sustainable development, and livable city construction [3,7]. In recent years, “eco-city”, “garden city”, and “park city” have become the guiding concepts of urban construction in China, and UBGS is the focus of implementing these concepts. Contemporary metropolitan life in China exhibits the following characteristics. Firstly, the prevalence of virtual socialization and atomized lifestyle has resulted in the lack of face-to-face communication [4,8]; secondly, the intensification of population mobility between urban and rural areas and the insufficient interaction between the migrant and local populations has resulted in social segregation and exclusion [9]. UBGS construction faces many challenges, including how to embody the basic idea of “people’s city for the people”, how to enhance the public’s access to nature, how to carry rich public life, and how to promote face-to-face social interaction and improve social cohesion [5].
Spatial publicness refers to the supportive attributes of space in supporting individuals in realizing their urban rights, carrying out public life, and forming a community [10,11,12,13]. Recently, Western and Chinese scholars have produced a substantial amount of research. Western scholars have established a relatively complete theoretical framework for spatial publicness. They have developed evaluation models such as the star [14,15], cobweb [16], tri-axial [17], six-axial [18], OMAI [19], PEM [20,21], and others and conducted empirical research. The star model, which includes multiple dimensions, such as land ownership, planning, construction, management, and operation, is widely recognized and applied for its comprehensiveness [14,15]. The cobweb model shows superiority in identifying whether a space has a conservative spatial character due to prioritizing private property safety or a thematic spatial character due to prioritizing public life satisfaction [16]. In specific applications, through on-site observation, Mantey used the six-axis model to evaluate the publicness of 13 public gathering places in the suburbs of Podkowa Leśna (Warsaw urban region, Poland) [18]. Németh and Schmidt used the tri-axial model to evaluate 151 spaces in Midtown Manhattan and the Upper West Side neighborhoods [22]. These research works verified the operability of evaluation models in practical applications. The above models and evaluation work show the following similarities: First, land ownership and management measures are essential indicators of spatial publicness because the cases are usually in cities with private land ownership [18,22,23]. Secondly, researchers mostly score the case space through on-site observation, and the evaluation results are somewhat subjective. Third, although the models involve the physical configuration of the space, they usually only investigate the case space itself, ignoring the structural characteristics of the overall space [24].
Drawing on Western scholars’ research achievements and combining with China’s social background, Chinese scholars have proposed a theoretical framework of spatial publicness that conforms to Chinese urban characteristics and have carried out case research on cities such as Guangzhou [24,25], Shanghai, and Chongqing [26,27]. However, in Chinese cities with communal land ownership, land ownership weakly affects spatial publicness performance [24]. For example, in evaluating spatial publicness in Lychee Bay Park and Yaohua Neighborhood in Guangzhou, conducted by Wu Yunjing, the influence of the space’s physical configuration indicator was more significant than that of the stable land ownership indicator [24]. Therefore, we should improve the evaluation of urban spatial publicness research in the following aspects: First, we should pay more attention to the influence of physical characteristics on the performance of publicness, especially the structural and systematic characteristics [28]. Second, the researcher’s subjective experience greatly influences the results obtained by the current research methodology, and we should develop a more objective evaluation methodology. Third, most existing studies evaluate the specific spaces’ publicness at the micro-scale [18,21,28,29]. These are highly targeted but need more generalization, making conducting comparative studies on space differences difficult. It is also challenging to analyze spatial publicness patterns at the urban scale [30]. Furthermore, we cannot directly apply the evaluation results to improve spatial publicness at the urban scale.
Man–land relationships refer to the relationship between people’s activities and the natural geographical environment, which works hand in hand with economic development. Furthermore, an excellent human–land relationship means that the geographical environment can effectively match people’s needs and support the development of human society [31]. This study investigates UBGS publicness from the perspective of the man–land relationship. By using “land (UBGS)” as the research object, this study examines UBGS as well as its coupling with “people (the state, the process of public life)” so that the publicness of UBGS can be identified. “Element-function-structure” is the basic framework in the theory of man–land relationship [32], which provides a multidimensional perspective for an in-depth understanding of UBGS publicness. UBGS elements refer to material entities such as water and green spaces, which are the basis for forming a man–land relationship. UBGS functions refer to the roles played by the elements in meeting public needs and supporting social activities. Moreover, UBGS structure refers to the elements’ distribution and interrelationships, which will affect the activities of the public in the broader spatial context and the operational efficiency of the man–land relationship. UBGS with a high publicness level should have the following characteristics. First, the elements of UBGS are easily accessible, which implies that the spaces are accessible within the public’s walking capacity [10,28,33,34]. Second, the function is rich and diverse, which means the UBGS and its surrounding environment can provide the public with rich activity choices, thus attracting more people to planned or ad hoc activities [3,11,24,35,36]—and it creates interaction among the public and forms connections [37,38]. Third, the structure is connected, so the UBGS system has effective internal connectivity. The UBGS units can be combined to form clusters to support the public’s easy pedestrian movement, thus facilitating a more comprehensive range of public gatherings and interactions [1,37,39,40]. The accessibility, functional diversity, and structural connectivity of UBGS comprehensively portray the publicness of UBGS, which includes the complete public life process of the public arriving at the UBGS from their departure, choosing activities, and social interaction in a broad spatial scope.
In this study, we took Changsha as a case and evaluated its UBGS publicness in 2012, 2016, and 2020 with the help of multi-source data and spatial analysis methods. The goals of this study are as follows: (1) to extend the spatial scope and evaluate Changsha’s UBGS publicness at the urban scale; (2) to extend the temporal scope and characterize the pattern evolution of Changsha’s UBGS publicness; (3) to preliminarily explore the impacts of urban development strategies and construction activities on the pattern evolution of UBGS publicness in the context of a city with land communal ownership. We established a model for evaluating UBGS publicness in cities with land communal ownership to inspire the evaluation of spatial publicness at the urban scale, and the evaluation results also effectively support the improvement of UBGS publicness at the urban scale.
2. Study Area and Data Sources
2.1. Study Area
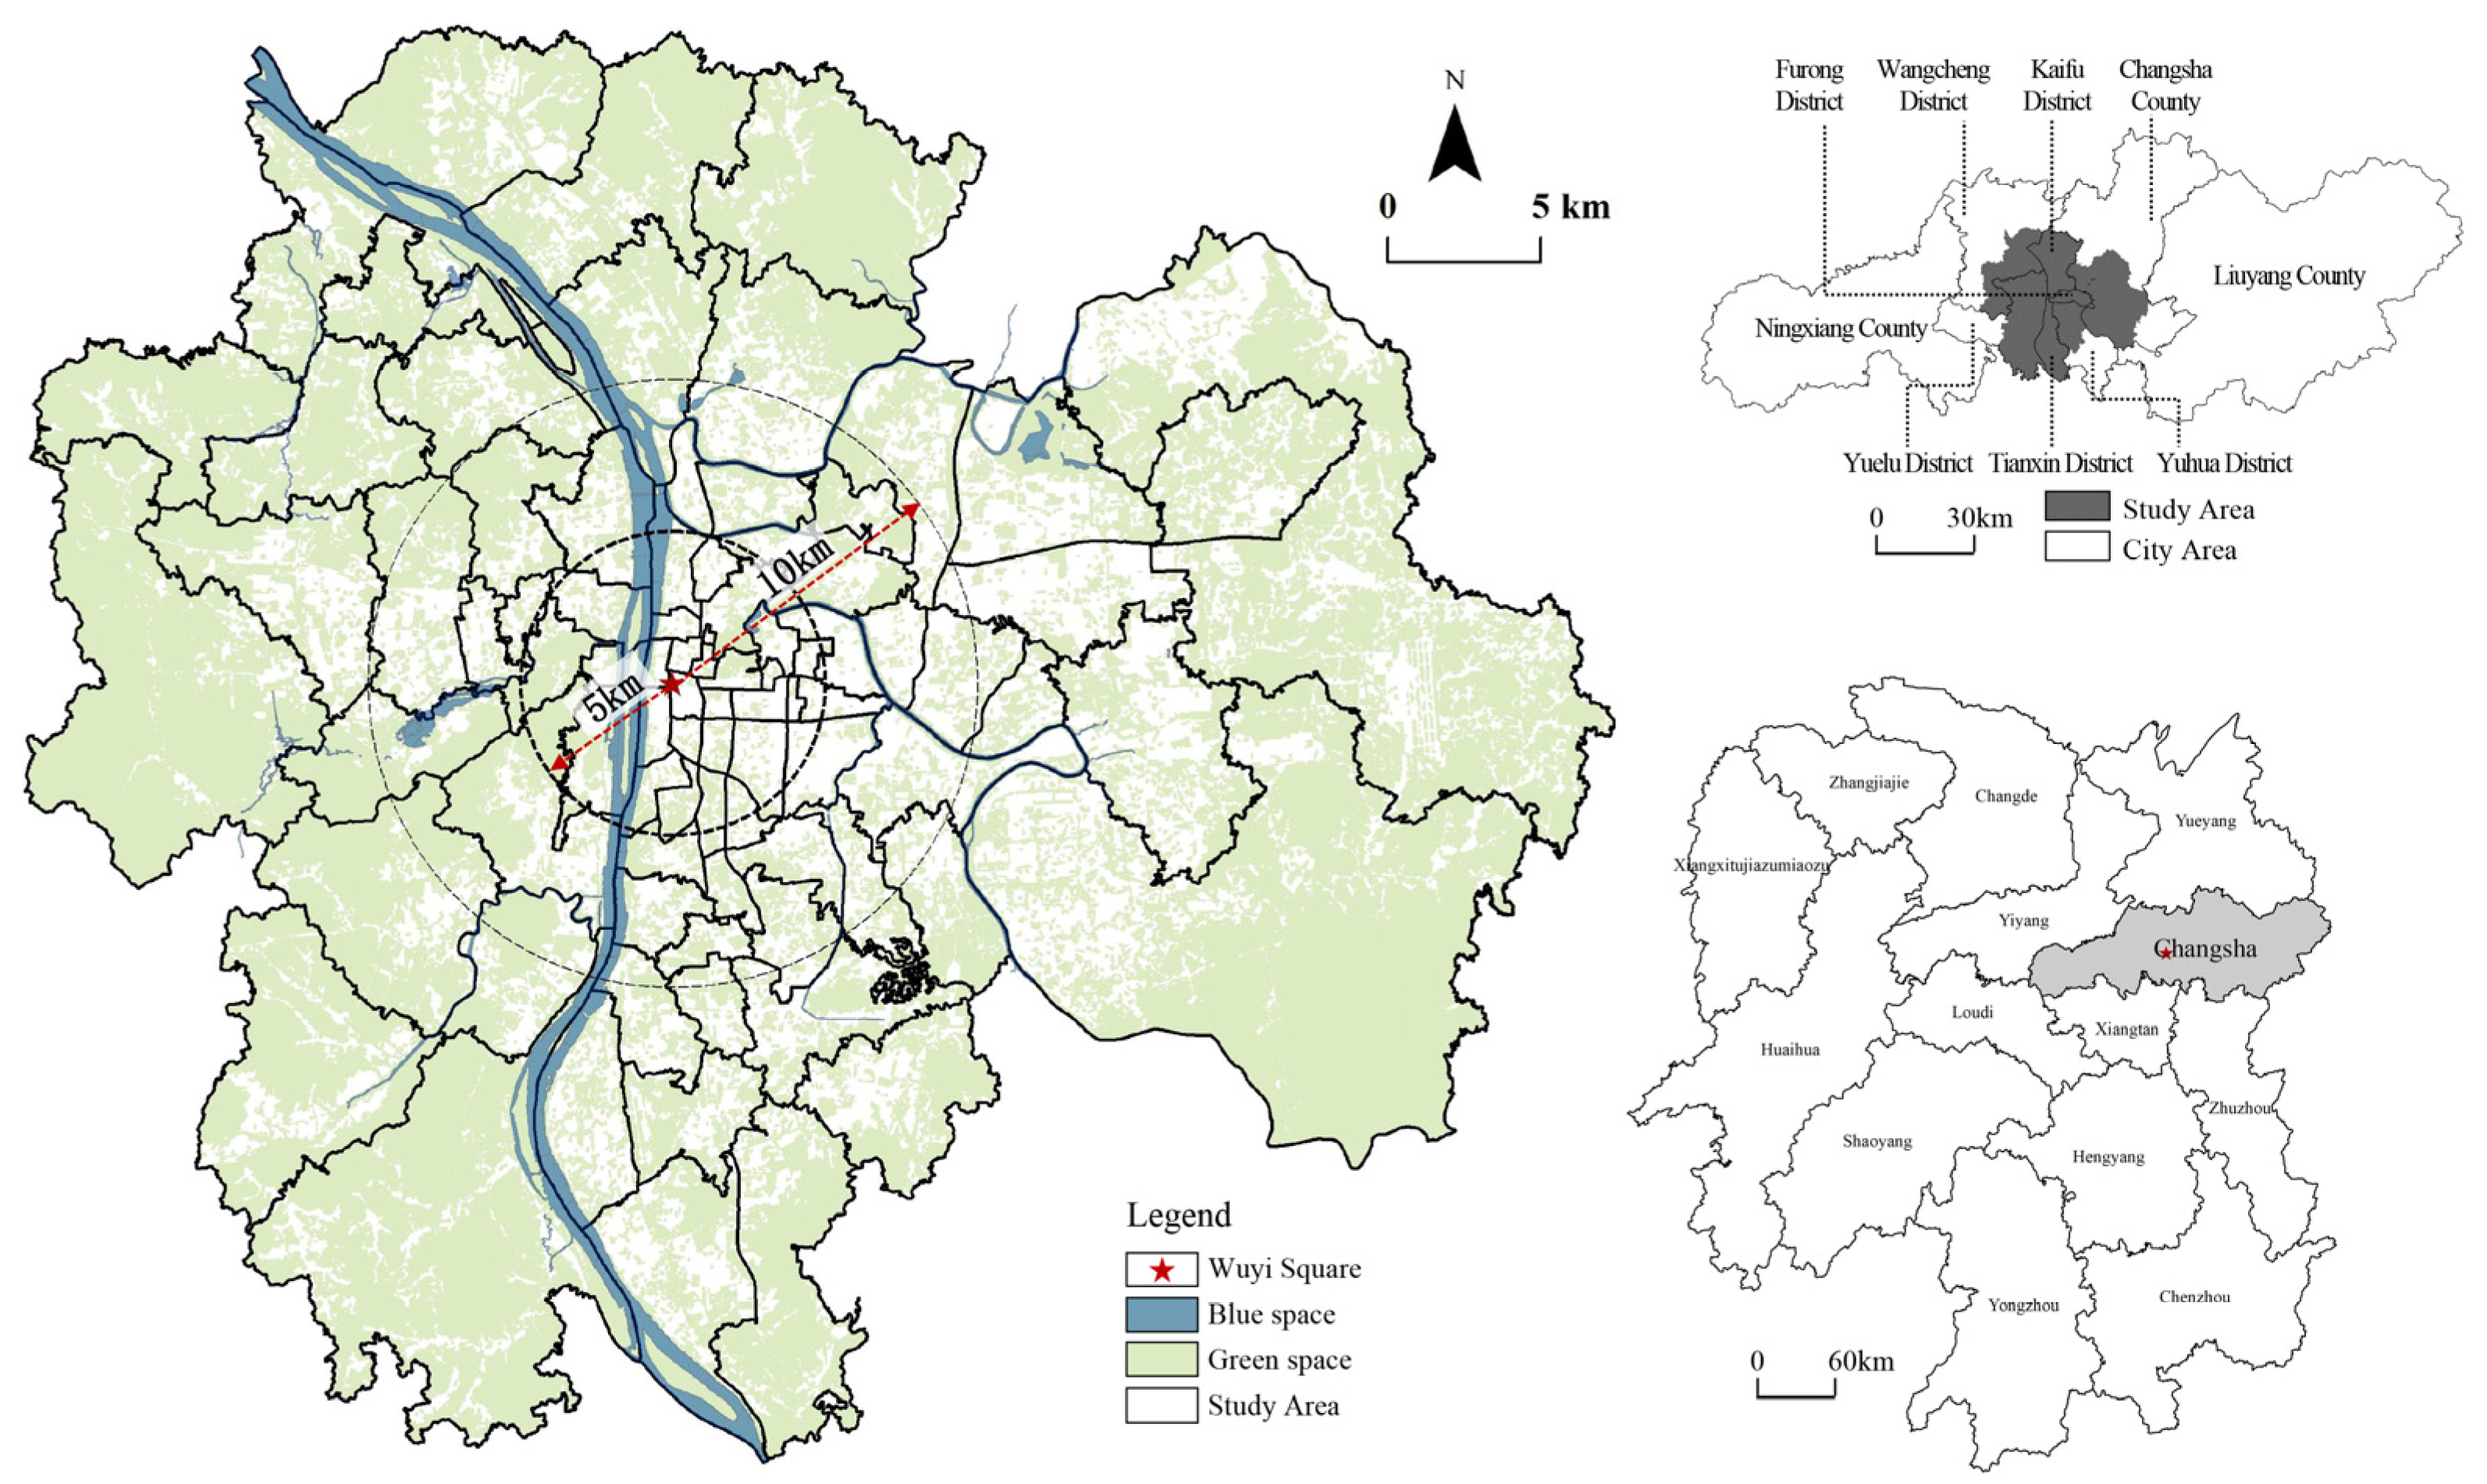
Changsha is an international cultural and creative center, a national historical and cultural city, and the capital of Hunan Province (Figure 1). It is also the core city of the ChangZhuTan urban agglomeration. Changsha is located in the transition zone between plains and hills northeast of Hunan Province, with a total area of 11,819 km2. The natural and built environments are intertwined, forming a general image of people in the city and the city in the forest. In 2012, Changsha entered the phase of high-quality development. Since then, UBGS has become essential in implementing Changsha’s urban strategies, such as “green city” and “national garden city”. Along with the urbanization process, Changsha’s UBGS is changing rapidly. In 2021, Changsha proposed the development goal of creating a national ecological garden city, constructing a city image of “green mountains and blue water surrounding the city”. In 2023, the pre-approval official announcement document for Changsha’s Green Space System Plan (2021–2035) indicated that Changsha would create a connected UBGS network and form a shared UBGS pattern [41]. Changsha’s UBGS construction is at the forefront of Chinese cities, and its publicness research will inspire Changsha’s future construction and impact other cities in China. The study area covers the city center area, which carries public life as the main study area, totaling 1508 km2, and involves 7 districts and 85 subdistricts. This study evaluated the publicness of UBGS in the study area in 2012, 2016, and 2020 and characterized the evolution of its pattern during this period. On this basis, it would combine Changsha’s urban development history to analyze its intrinsic driving mechanism.
2.2. Data Sources
The data used in this study and their sources are as follows: land cover data were derived from China’s 30 m accuracy land cover dataset from 1990 to 2022, which was produced by Prof. Yang Jie and Huang Xin of Wuhan University based on the Google Earth Engine (GEE) platform [42], and published on the Zenodo platform and continuously updated (https://doi.org/10.5281/zenodo.8176941, accessed on 11 January 2024). NDVI data were derived from the 30 m accuracy dataset published by the National Ecological Sciences Data Center (http://www.nesdc.org.cn/, accessed on 19 November 2023). Road network data were obtained from OpenStreetMap (https://www.openstreetmap.org, accessed on 27 November 2023). Population density data were collected from the gridded population dataset published by WorldPop (https://www.worldpop.org, accessed on 15 December 2023). Public service facilities data were based on Gaode map POI (Point of Interest) and gathered by web crawler technology. Socio-economic data were obtained from city yearbooks.
First, land cover and NDVI data were used to identify UBGS in Changsha City in 2012, 2016, and 2020. Second, UBGS units with more than 3000 m2 were extracted to exclude too-small and fragmented units. After that, the UBGS was further determined by combining the urban master plan and green space system planning. Finally, a vector dataset was generated based on the ArcGIS 10.8 platform. On this basis, according to the Urban Green Space Classification Standard (CJJ/T 85-2017) [43] and the existing studies [44,45], this study divided the UBGS into three categories: community-type (<2 hm2), district-type ([2, 25)hm2), and city-type (≥25 hm2). Different types of UBGS have different thresholds of acceptable walking time for the public and different ranges of surrounding environments closely related to them. Based on the type of UBGS, we determined the d0 threshold in the Elements accessibility indicator (AI) and the extent of the surrounding environment in the Functional diversity indicator (MFDI) below.
3. Methods
Based on the theory of the man–land relationship, this study established a system of UBGS publicness indicators from three dimensions: element, function, and structure. The element accessibility indicator was the weighted per capita area index (AI) of UBGS calculated by the Gaussian two-step floating catchment area (2SFCA) method to reflect the public’s accessibility to UBGS. The functional diversity indicator used Shannon’s diversity index (MFDI) to reflect the richness of the types of activities that the public could choose from the UBGS and its surroundings. Furthermore, the structural connectivity indicator used the mean nearest-neighbor distance index (MNNDI) to reflect the breadth of social contacts the public could achieve in the UBGS system.
3.1. Measurement Methods
3.1.1. Single Indicators Measurement
- (1)
- Element accessibility: The Gaussian two-step floating catchment area (2SFCA) method was used to measure the accessibility of UBGS [46]. The essence of this calculation is distance-weighted UBGS area per capita, which can reflect the magnitude of public access to UBGS—spatial accessibility and area abundance of elements. The calculation process was as follows: Firstly, the per capita scale of each UBGS was calculated, considering that UBGS service capacity decayed with distance. The travel time thresholds of community-type, district-type, and city-type UBGS were set to be 5 min, 15 min, and 30 min, respectively, and the spatial distance thresholds d0 were 400 m, 1200 m, and 2400 m, respectively, referring to the relevant studies [44]. Formulas (1) and (2) were applied to calculate the per capita size of each UBGS. Secondly, the size of UBGS per capita was calculated in subdistricts with Formula (3), considering public travel distance attenuation.where Pk refers to the population of subdistrict k in the domain of UBGS j (dkj ≤ d0); dkj is the spatial distance from the center point of subdistrict k to the center of UBGS j; Sj is the public service capacity of the UBGS, represented by its area. G(dkj, d0) is the Gaussian equation representing the spatial friction problem, computed as in Formula (2).where AI is the ratio of the supply of UBGS l within the population domain in the subdistrict i(dkj ≤ d0). The description of other indicators is the same as in Formula (1).
- (2)
- Functional diversity: The Shannon’s diversity index can reflect functional diversity and homogeneity and is sensitive to functional changes [35,47]. Therefore, Shannon’s diversity index was used in this study to measure the diversity of POIs in UBGS and its surroundings. According to the relevant provisions of the Urban Residential Area Planning and Design Standards (GB 50180-2018) [48] and Urban Comprehensive Transport System Planning Standards (GB/T 51328-2018) [49], 50 m, 200 m, and 300 m around the community-type, district-type, and city-type UBGS were designated as their adjacent environments, respectively. The function of public facilities in the surrounding environment directly impacts the performance of the functional diversity of UBGS [1,47,50,51]. The calculation process was as follows: First, Formulas (4) and (5) were used to obtain the functional diversity index of each UBGS. Second, Formula (6) was used to obtain the average value of the functional diversity indicator of UBGS in subdistrict units.where FDI is the functional diversity index of UBGS j, with a value range of [0, 1]; k is the number of functional types; Pk,j represents the percentage of the number of the kth type of function in the UBGS j; Xk is the number of UBGS of the kth type of function.where MFDI is the mean value of functional diversity of UBGS in subdistrict unit i; FDIj,i is the functional diversity index of UBGS j in subdistrict unit i; N is the number of UBGS in subdistrict unit i.
- (3)
- Structural connectivity: Referring to the relevant studies by Yu et al. [52], the structural connectivity indicator was measured using the mean nearest-neighbor distance index (MNNDI). MNNDI means the sum of the distances between a space and its nearest neighbors divided by the number of spaces with neighbors. An urban road network model was established on the GIS platform, and network analysis was used to find the nearest-neighbor distances between UBGS units within a subdistrict [2]. Then, the average of the nearest-neighbor distances was the structural connectivity level of UBGS within a subdistrict.where MNNDI is the mean nearest-neighbor distance index of the UBGS of the subdistrict; is the distance between UBGS j and its nearest neighbor in the subdistrict unit; m is the number of UBGS with nearest neighbors.
Based on the above, the UBGS publicness evaluation indicators and their meanings are shown in Table 1.
3.1.2. Comprehensive Indicator Measurement
The publicness of UBGS could be regarded as a comprehensive function of the three dimensions of “element-function-structure”. The scores of the three single indicators were normalized to create the indices that range from 0 (lowest publicness) to 1 (highest publicness). Then, the entropy weighting method (EWM) and the Delphi method were used to determine the weights of indicators. The EWM is an objective assignment method that obtains the entropy coefficient from the information of the data itself [32,53]. The Delphi method is a subjective assignment method that obtains weights from expert interviews [54]. The combination of the two methods leads to a rational weight factor. The linear weighting method synthesized the single indicators and got the UBGS publicness index (BGSPI). It was calculated as follows:
where BGSPI is the comprehensive index of the publicness of UBGS; Wj is the weight of the indicator; Yj is the standardized value of the indicator; n is the number of indicators.
3.2. Classification of Subdistricts
Based on the ArcGIS10.8 platform, we classified the calculated AI, MFDI, MNNDI, and BGSPI indices into five levels—lowest value, lower value, medium value, higher value, and highest value—with the natural breakpoint method. Then, we got the spatial pattern of each indicator. The pattern evolution characteristics of each indicator from 2012 to 2020 were obtained through comparative analysis. According to the change characteristics of BGSPI, the subdistricts were divided into four categories (Table 2). For the steadily rising type (Type I)—from 2012 to 2016 and from 2016 to 2020—both phases showed an upward trend. For the development fluctuation type, two phases of one rise and one fall; if there were an overall rise from 2012 to 2020, it would be categorized as a fluctuation rise type (Type II). If there were an overall fall from 2012 to 2020, it would be categorized as a fluctuation decline type (Type III). For the continuously declining type (Type IV)—from 2012 to 2016 and from 2016 to 2020—both phases showed a declining trend. Almost all urban construction impacted the publicness of UBGS, and there was usually no situation where the BGSPI remained stable. Subdistricts are critical administrative units for Chinese city governments to implement UBGS management and assess the level of UBGS construction. The classification results of subdistricts can provide a reference for subdistrict offices to understand the level of UBGS publicness. It will also benefit city governments and subdistrict offices to take measures to improve UBGS publicness.
3.3. Technology Path
The first three sections construct the theoretical framework and evaluation system of UBGS publicness and briefly introduce the study area. Section 4 assesses the publicness of Changsha UBGS in 2012, 2016, and 2020, describes the evolution of the spatial pattern of Changsha UBGS publicness, and categorizes 85 subdistricts. In Section 5, we first report the main findings and compare them with previous studies; second, we provide a preliminary discussion of the influencing factors and driving mechanisms of the evolution of the UBGS publicness pattern in the context of Changsha’s development. Third, we present the limitations and future research. Then, Section 6 summarizes the primary conclusions.
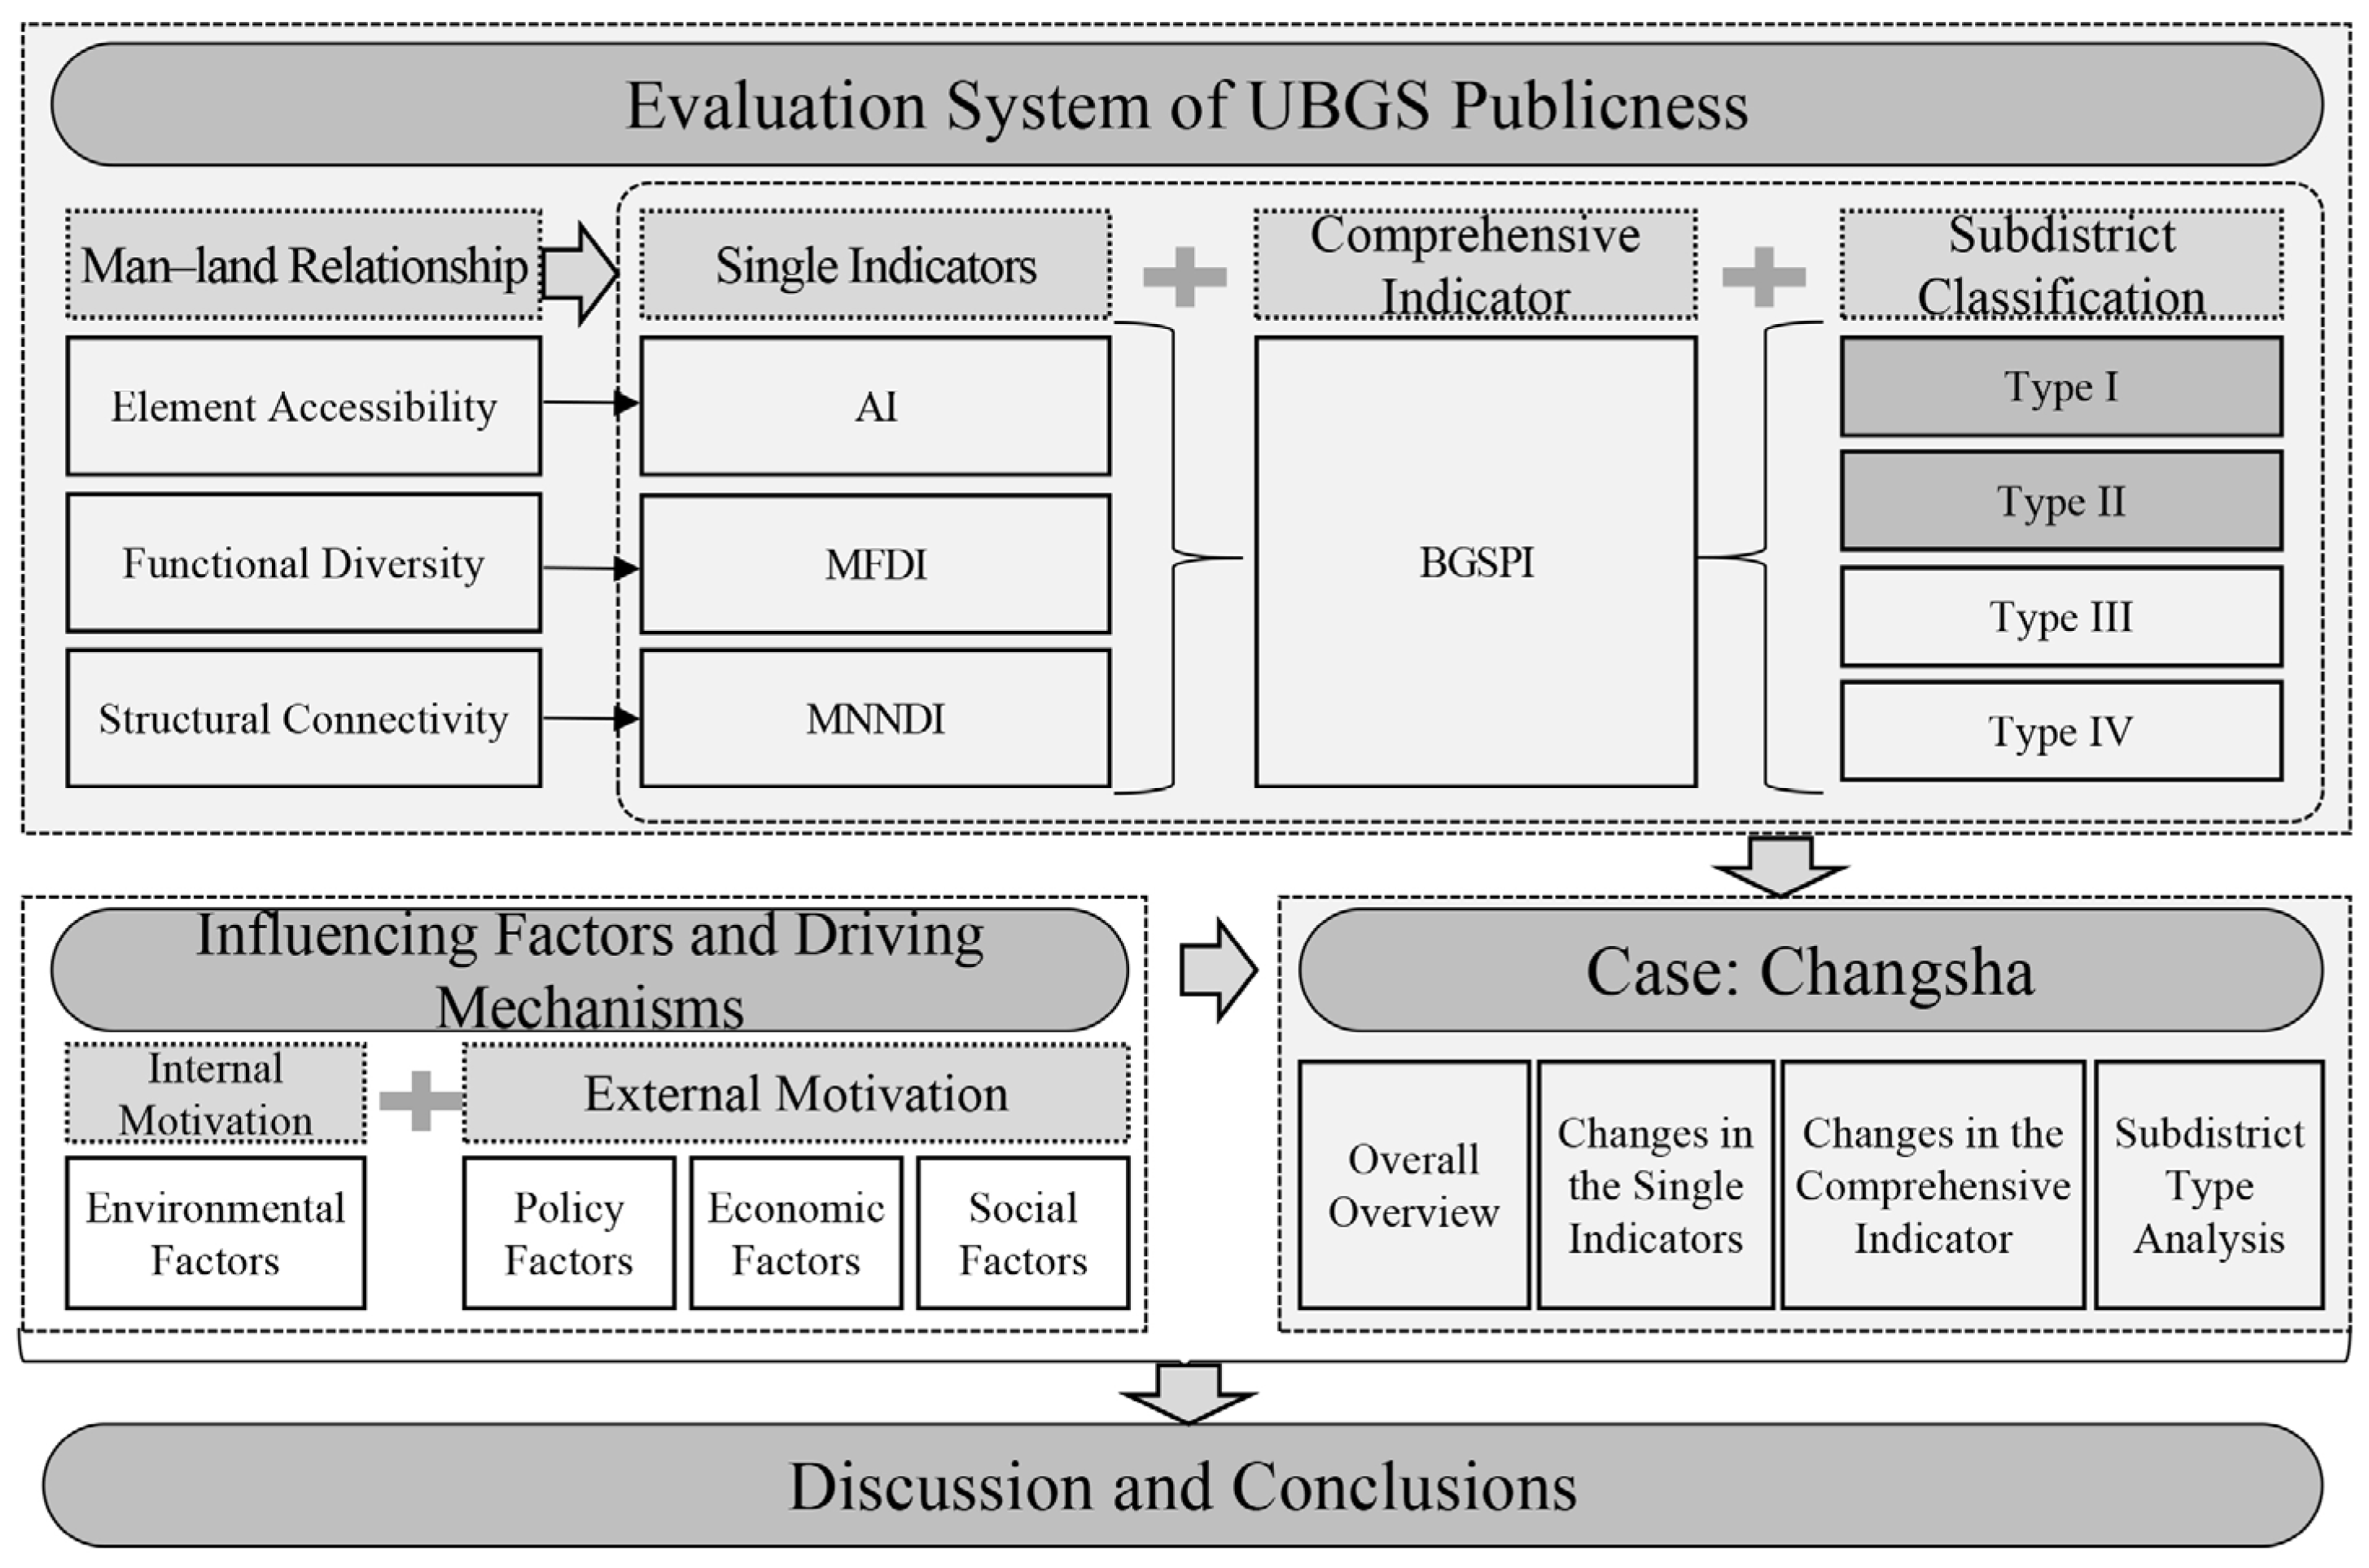
The technical path of this study is shown in Figure 2.
4. Results
4.1. Overview of UBGS
Regarding changes in the scale, Changsha’s total UBGS decreased from 1161.93 km2 to 1046.60 km2 from 2012 to 2020 (Table 3). City-type UBGS decreased yearly; however, district-type and community-type UBGS increased yearly. Moreover, the scale of district-type UBGS showed significant growth.
UBGS changed in scale and composition, which was closely related to urban construction. The external expansion of urban industrial land, transportation facility land, and residential land caused a reduction in the scale of UBGS. The increasing density of roads divided the UBGS and caused a shift in the types of UBGS, such as the shift from urban-type UBGS to district-type or community-type UBGS, district-type UBGS to community-type UBGS. At the same time, urban renewal projects promoted the transformation of marginal and abandoned spaces into UBGS, which, to some extent, caused an increase in the scale of district-type and community-type UBGS.
4.2. Changes in Single Indicators
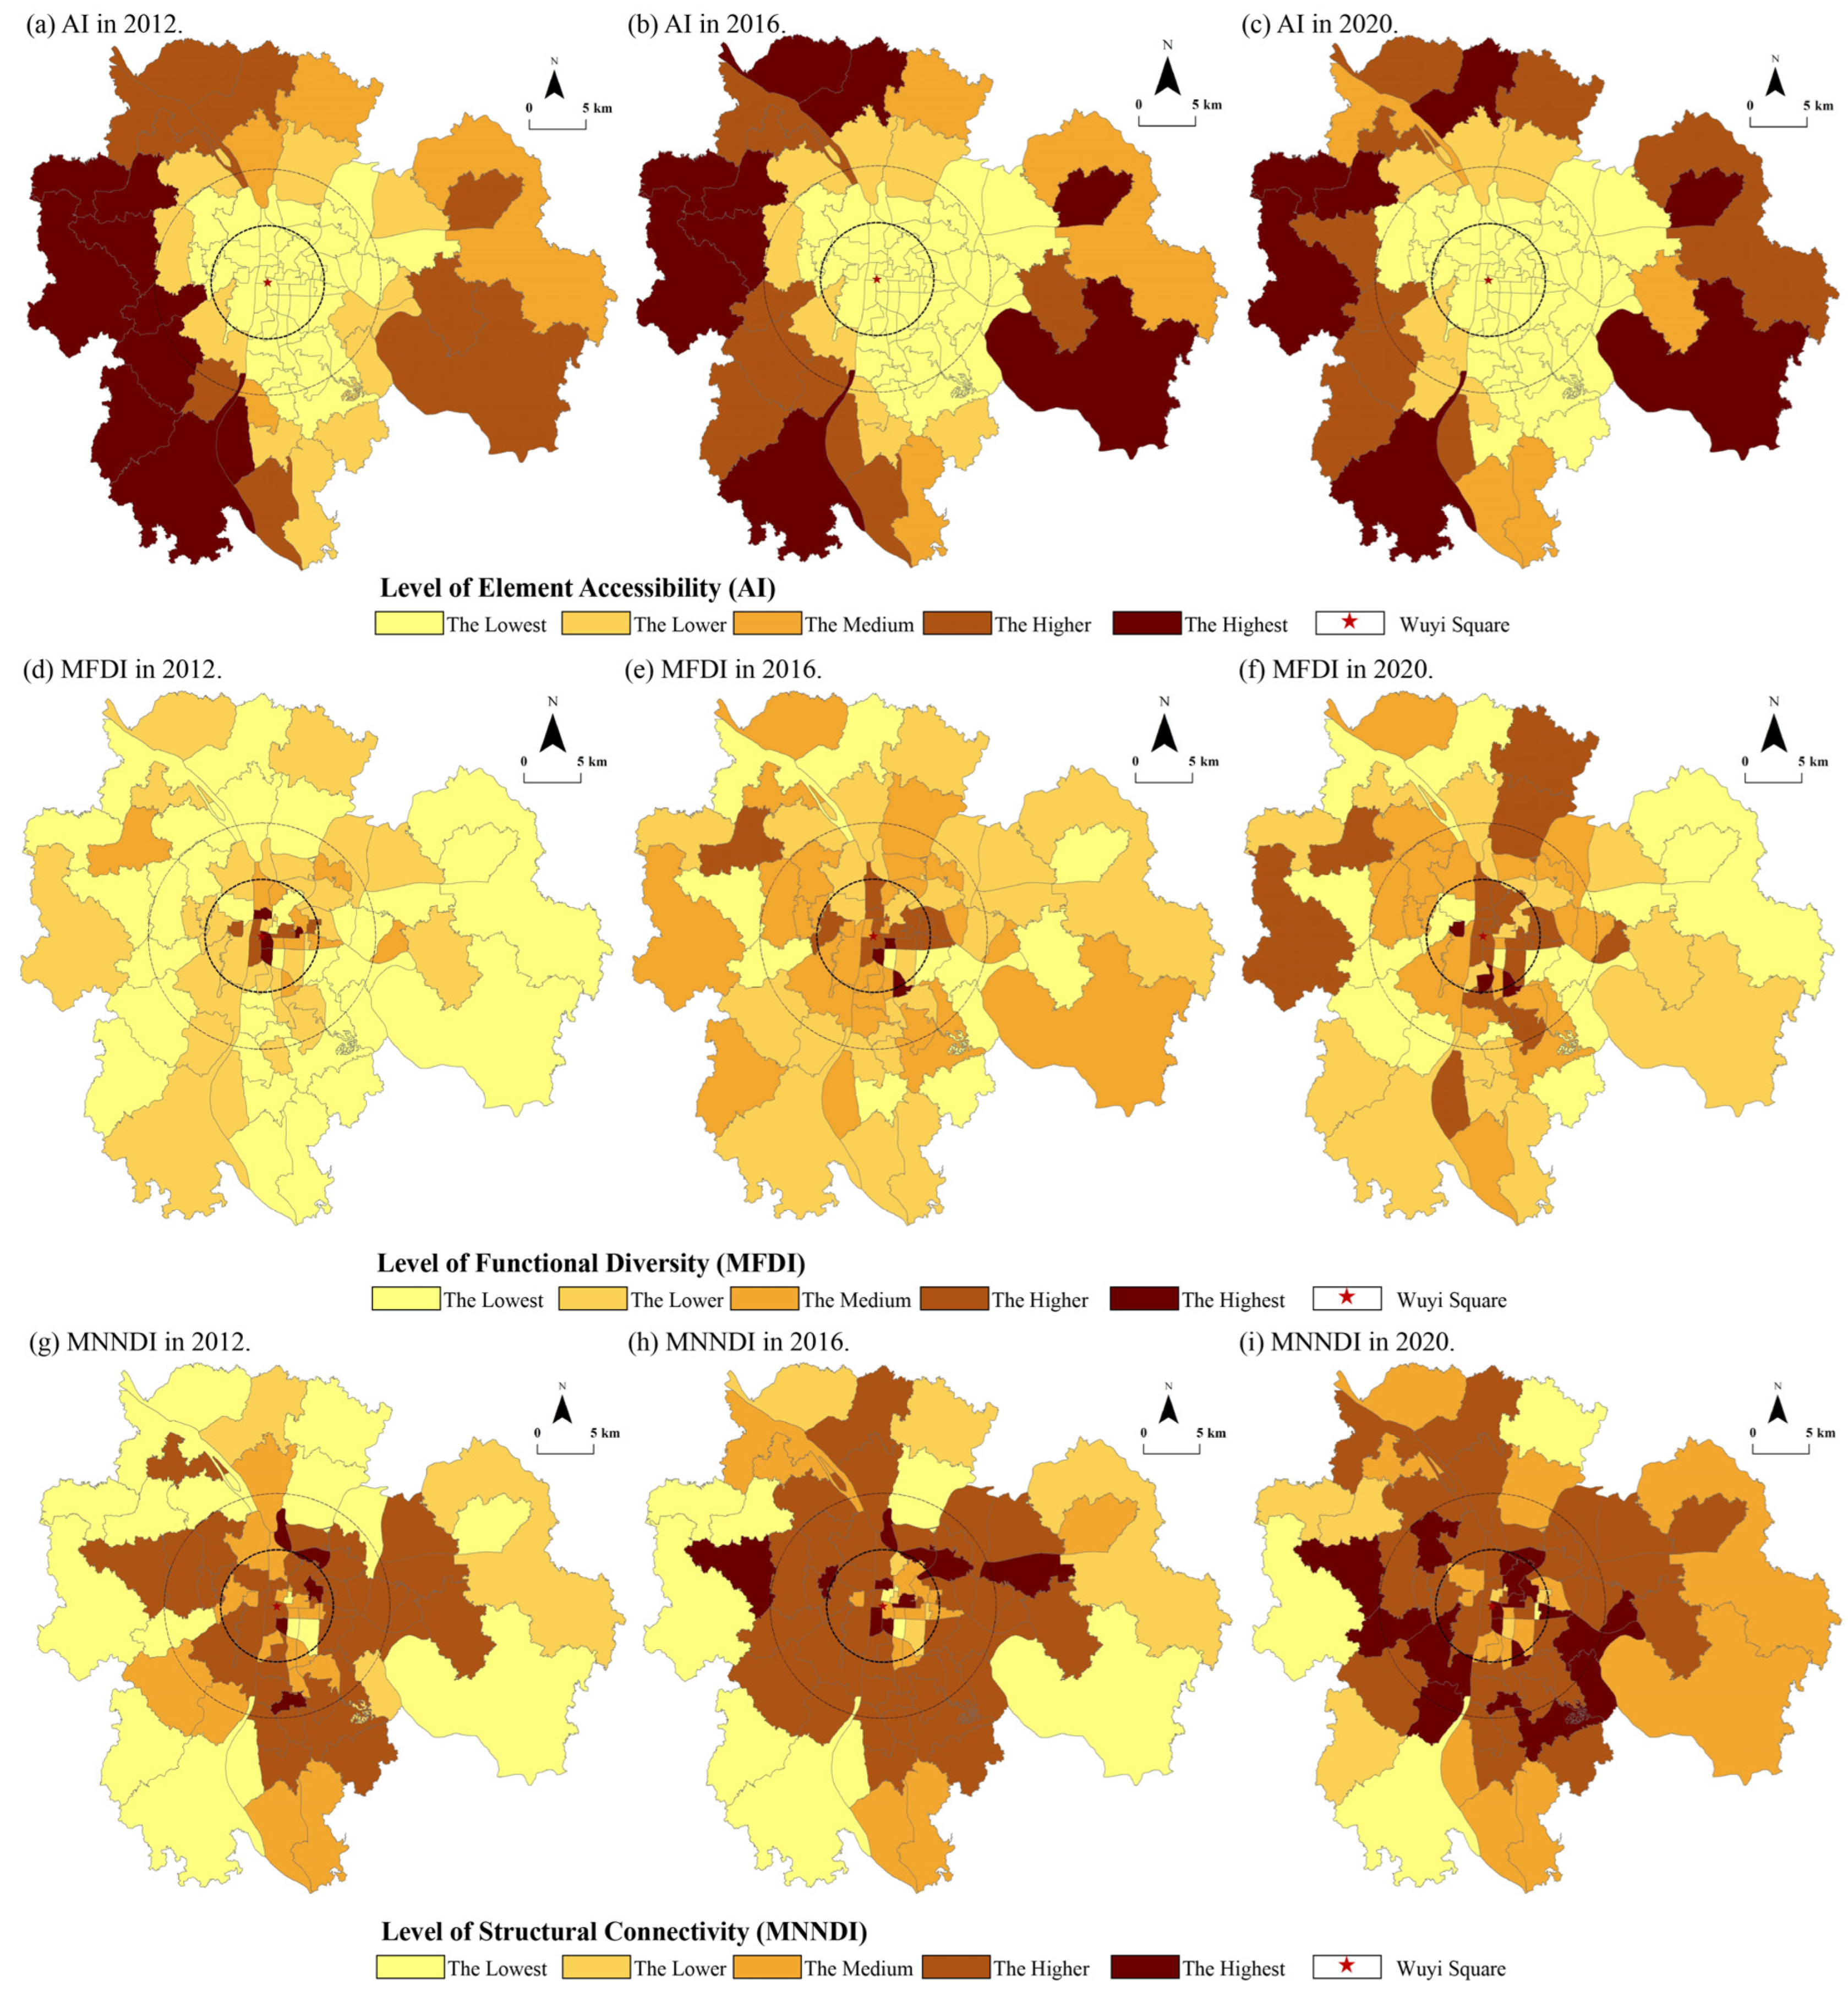
The changes in the element accessibility indicator (AI) were as follows (Table 4 and Figure 3): (i) From 2012 to 2016, there was no significant change in AI. In terms of spatial distribution, the highest-value and higher-value zones shifted, with the highest-value zones shifting from being concentrated on the west bank of the Xiangjiang River to being scattered in the peri-urban areas, and the higher-value zones shifting from being locally concentrated in the northern and eastern parts of the peri-urban areas to being scattered in the peri-urban areas. (ii) From 2016 to 2020, the number of subdistricts with the indicator AI’s lower and highest value decreased significantly, while the number with the indicator AI’s lowest value increased. Regarding the spatial distribution, the lowest-value zones showed a trend of expanding outward with the central area as the core, and some high-value zones in the peripheral areas transformed into the lower-value and the lowest-value. (iii) From 2012 to 2020, the number of subdistricts with the indicator AI’s lowest value increased, while the number with the indicator AI’s lower and highest value decreased. Until 2020, the study area maintained the overall pattern of low central and high peri-urban areas. The periphery appeared wedge-shaped, with the middle-value, higher-value, and highest-value zones nested mutually.
The changes in the functional diversity indicator (MFDI) were as follows (Table 4 and Figure 3): (1) From 2012 to 2016, there was a significant decrease in the number of subdistricts with MFDI lowest value and a significant increase with MFDI lower, medium, and higher value, especially the higher value. Regarding spatial distribution, MFDI showed a single center pattern with a high value in the center areas and a low value in the peripheral areas in 2012. Based on this, MFDI showed the changing trend of high-value zones expanding in the center areas and rising in the peripheral areas across the board in 2016. (2) From 2016 to 2020, there was an increase in the number of subdistricts with MFDI lowest and medium value and a decrease with MFDI higher and lower value. Regarding spatial distribution, 2020 continued the overall pattern of 2016. However, the range of medium-value zones in peripheral areas expanded, and a local center developed. (3) From 2012 to 2020, there was a significant decrease in the number of subdistricts with MFDI lowest value and a significant increase with MFDI lower, medium, and higher value. Regarding spatial distribution, MFDI shifted from a single-center polarized spatial pattern to a polycentric and balanced spatial pattern dominated by the center areas and supplemented by peripheral local centers.
The changes in the structural connectivity indicator (MNNDI) were as follows (Table 4 and Figure 3): (1) From 2012 to 2016, there was a significant decrease in the number of subdistricts with MNNDI lowest value and a significant increase with MNNDI lower and highest value. Regarding the spatial distribution, a general pattern was formed with Xiangjiang River and Wuyi Avenue as the main axis, with the central areas being high and the peri-urban areas being low in 2012. On this basis, the connectivity of UBGS around the central areas improved in 2016, and the higher-value zones showed a significant expansion trend, forming a distinct overall pattern of core edge. (2) From 2016 to 2020, there was a significant decrease in the number of subdistricts with MNNDI lowest and lower value and a significant increase with MNNDI highest value. In 2020, multiple local centers, such as Meixihu, Yuelu, and Yanghu, formed in the peripheral area. (3) From 2012 to 2020, there was a significant decrease in the number of subdistricts with MNNDI lowest value and a significant increase with MNNDI lower and highest value. There was a holistic improvement in UBGS connectivity. By 2020, the core area was the main center, followed by peripheral multi-centers, with a decreasing trend from the center to the periphery.
4.3. Changes in Comprehensive Indicator
4.3.1. Overall Trend of Changes in Comprehensive Indicator
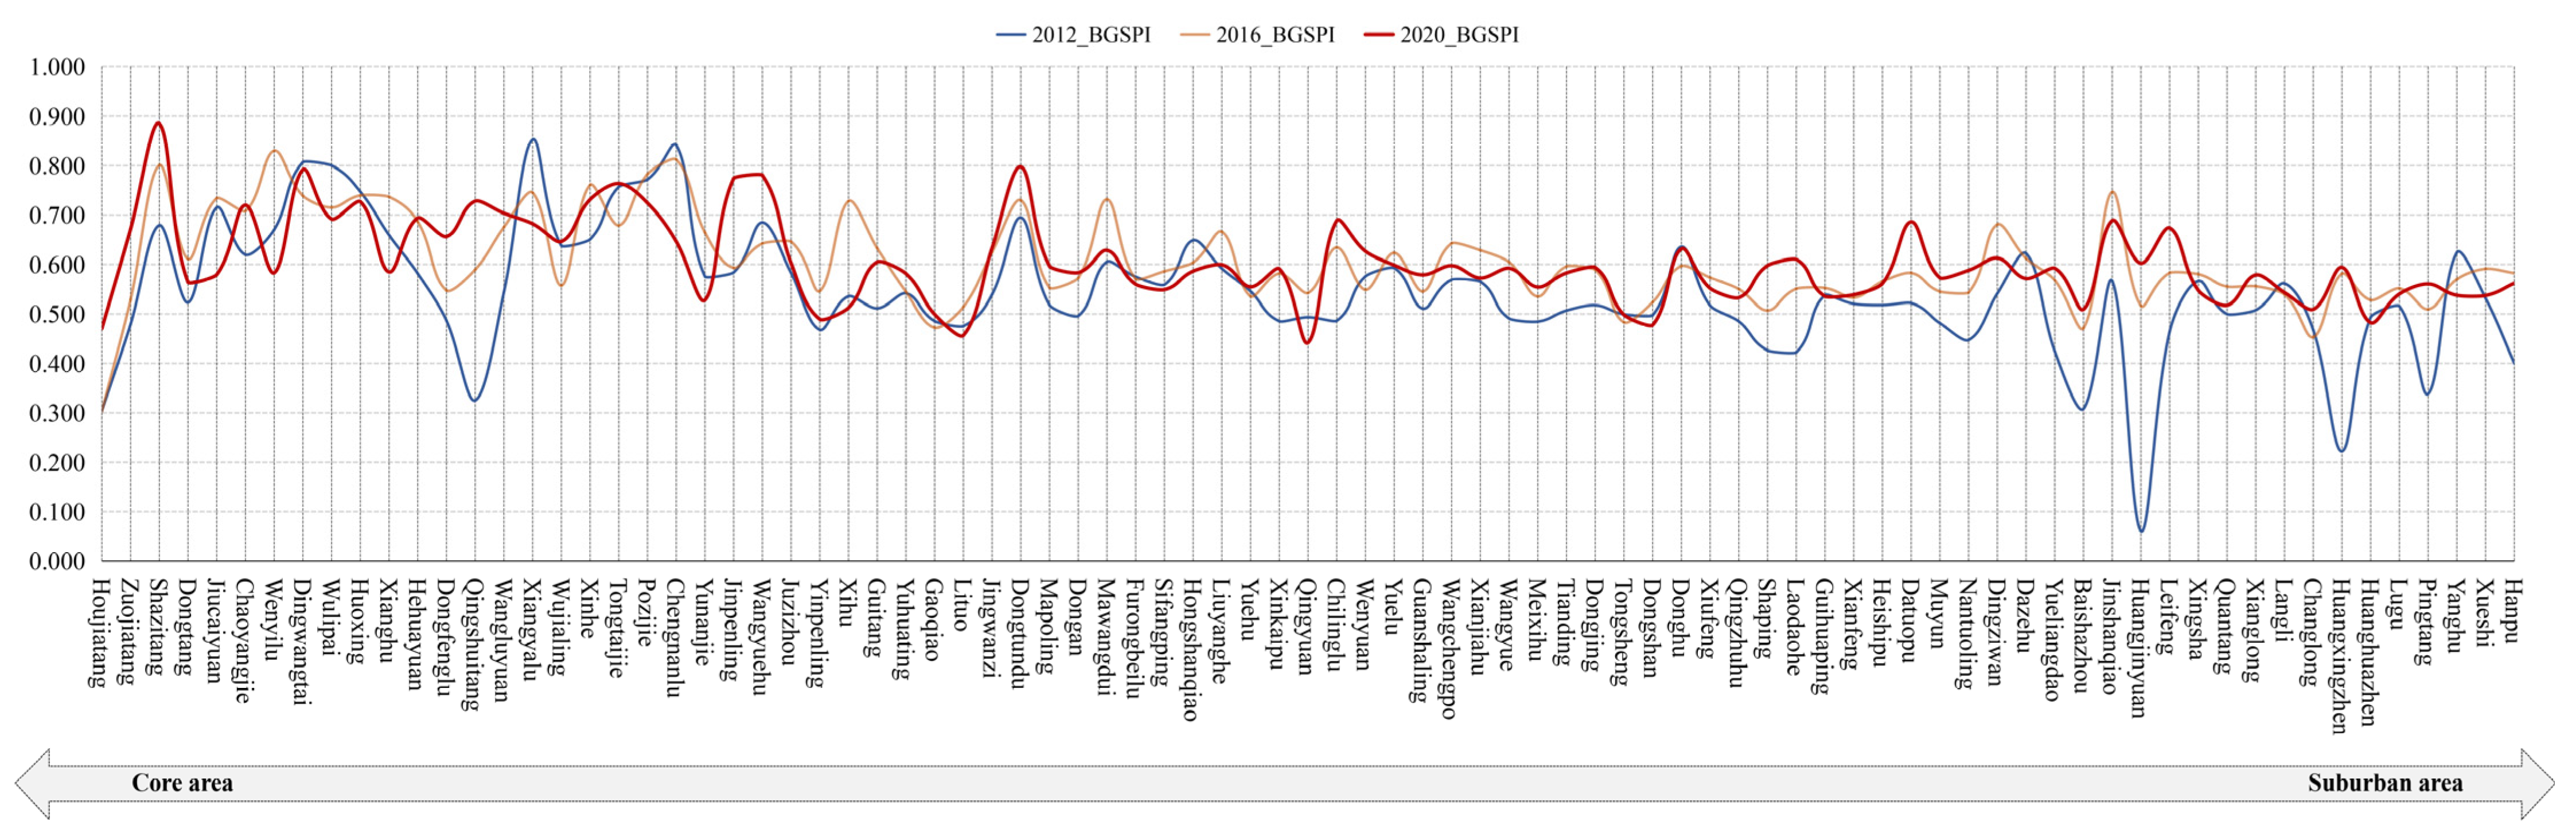
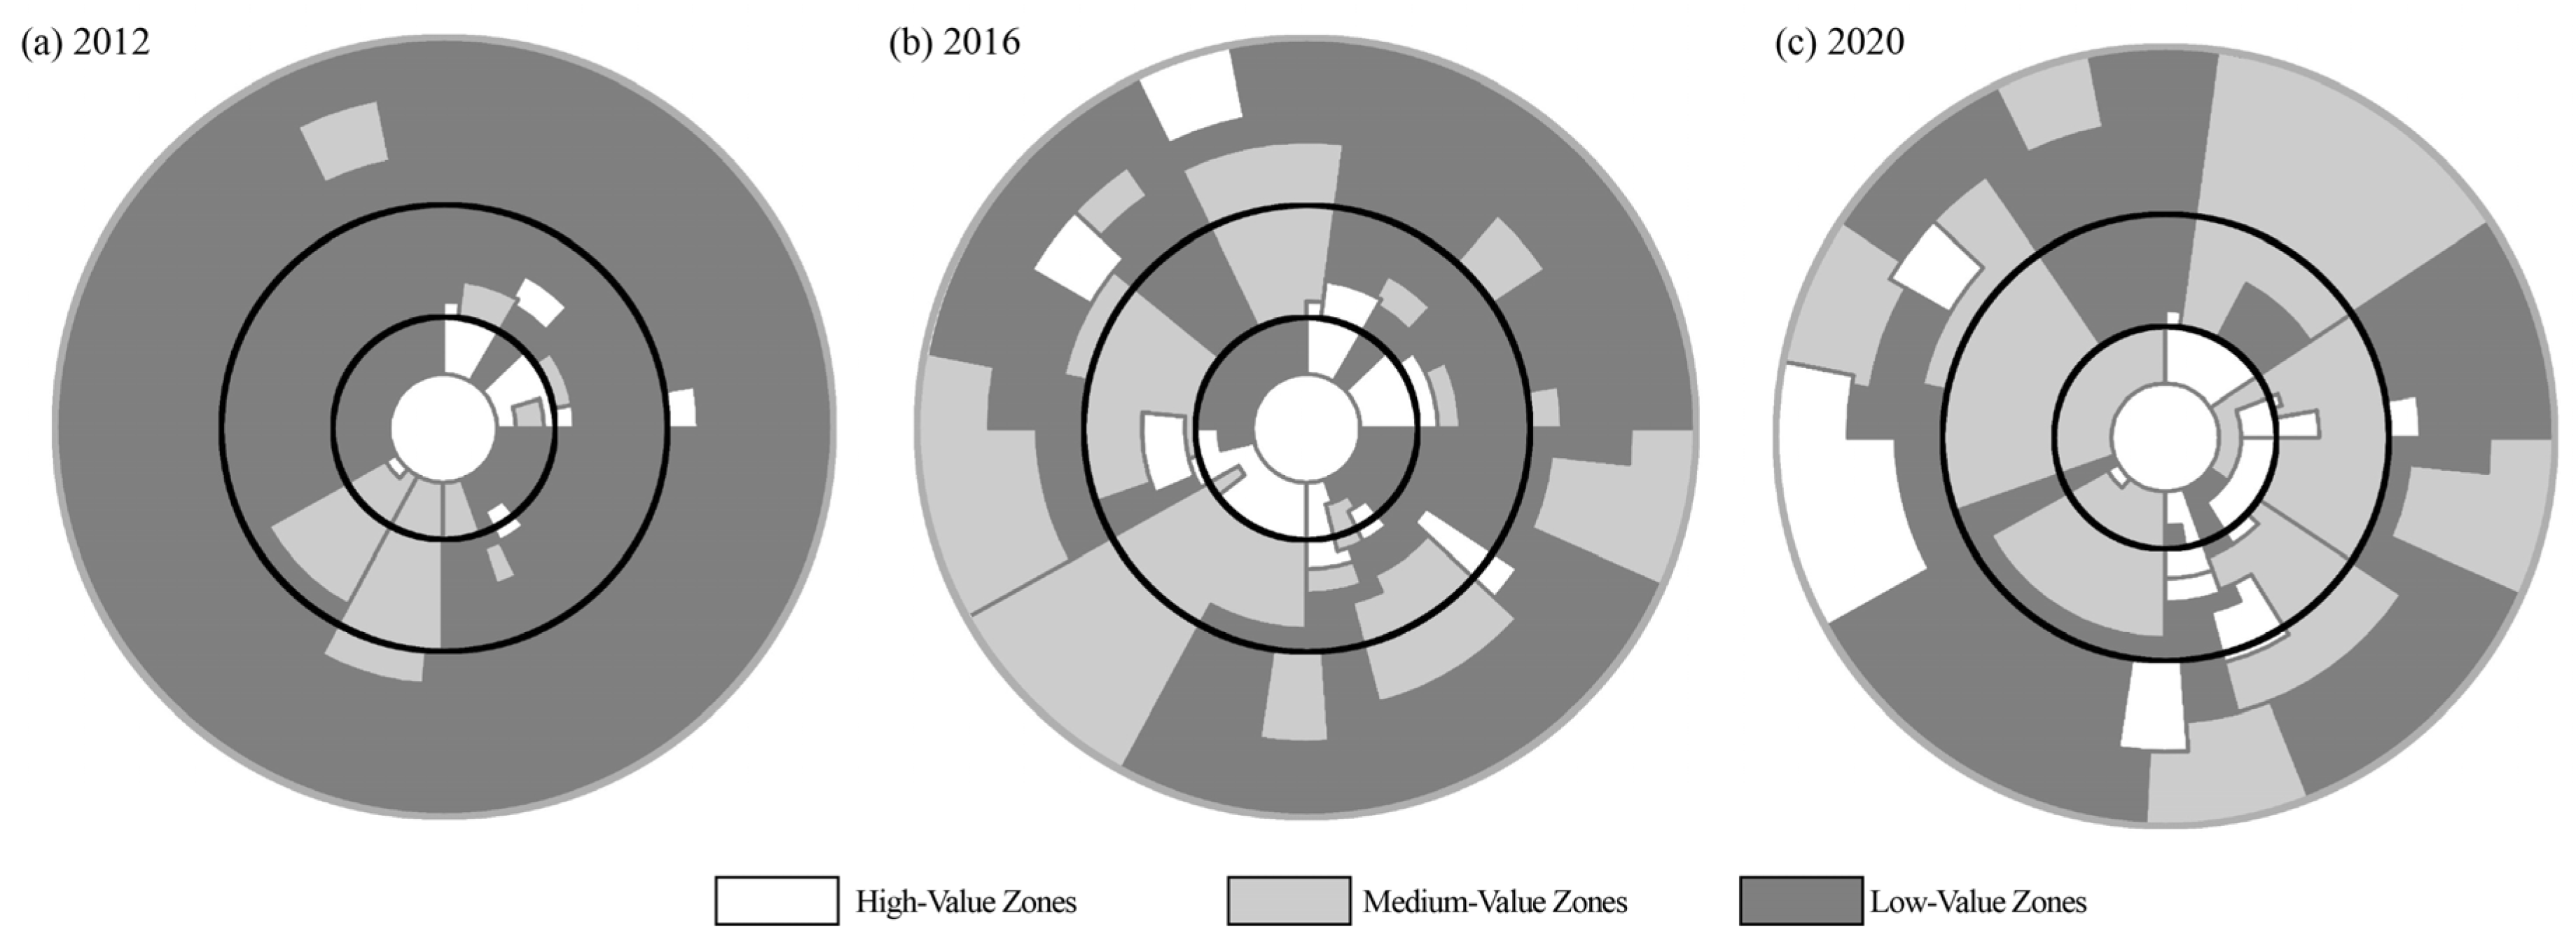
In terms of time, from 2012 to 2020, the average value of the Changsha UBGS publicness comprehensive indicator (BGSPI) increased from 0.543 to 0.604, with an average annual growth rate of 1.33%. It indicated that the construction of UBGS in Changsha was practical, and the level of UBGS publicness maintained growth. Regarding spatial distribution, the BGSPI of central and suburban areas maintained a steady upward trend while maintaining a decreasing spatial feature from the central area to the suburbs from 2012 to 2020. With its perfect facilities and strong economy, Changsha’s central district maintained a high level of BGSPI with a minor increase. The suburban district had a lower level of BGSPI, but the rate of improvement was fast. The gap between BGSPI levels in the suburbs and the central area was shrinking continuously (Figure 4).
4.3.2. Specific Description of Changes in Comprehensive Indicator
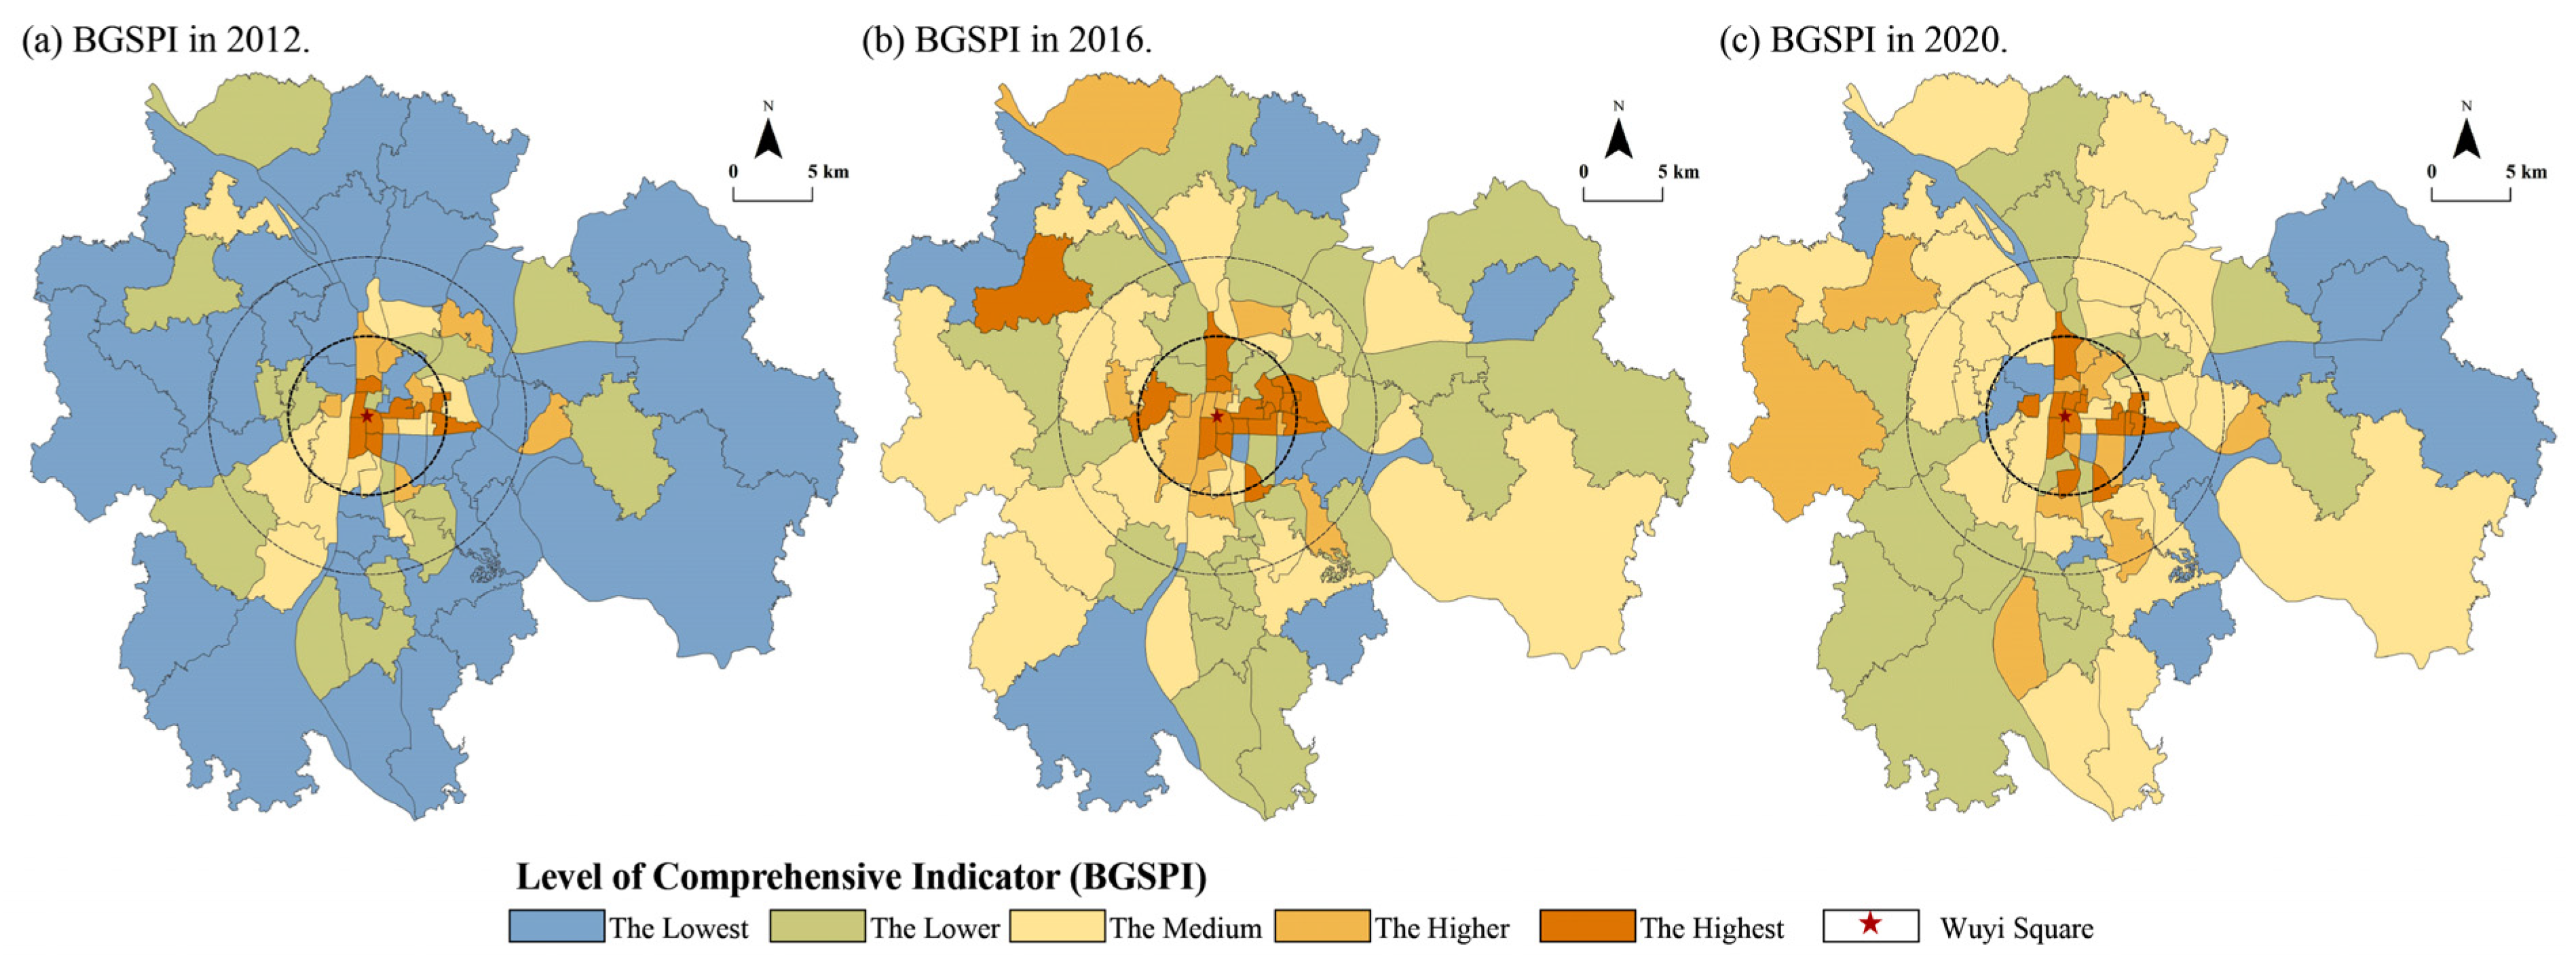
The changes in BGSPI of UBGS in Changsha from 2012 to 2020 were as follows (Table 5 and Figure 5): (1) From 2012 to 2016, the number of subdistricts with the lowest-value BGSPI decreased significantly, while those with the highest-value BGSPI increased significantly. Regarding spatial distribution, the BGSPI showed a spatial pattern of a single core with fringe, which polarized, and the highest-value and higher-value zones mostly appeared on the east bank of the Xiangjiang River in 2012. The BGSPI showed an expansion in the scope of high-value zones in the center areas and an overall increase in peri-urban areas in 2016. (2) From 2016 to 2020, BGSPI showed an equalization trend, and the gap between the highest and lowest values narrowed. Regarding spatial distribution, the BGSPI around the central area improved, forming a continuous middle-value zone, with local areas extending outward to become fan-shaped in 2020. (3) From 2012 to 2020, the number of subdistricts with low-value BGSPI decreased significantly, while the number of subdistricts with middle-value, higher-value, and highest-value BGSPI increased significantly. Regarding spatial distribution, the BGSPI developed from the single core-edge circled spatial pattern into the composite spatial pattern dominated by the single core-edge and supplemented by the fan-shaped areas (Figure 6).
4.4. Subdistrict Types Analysis
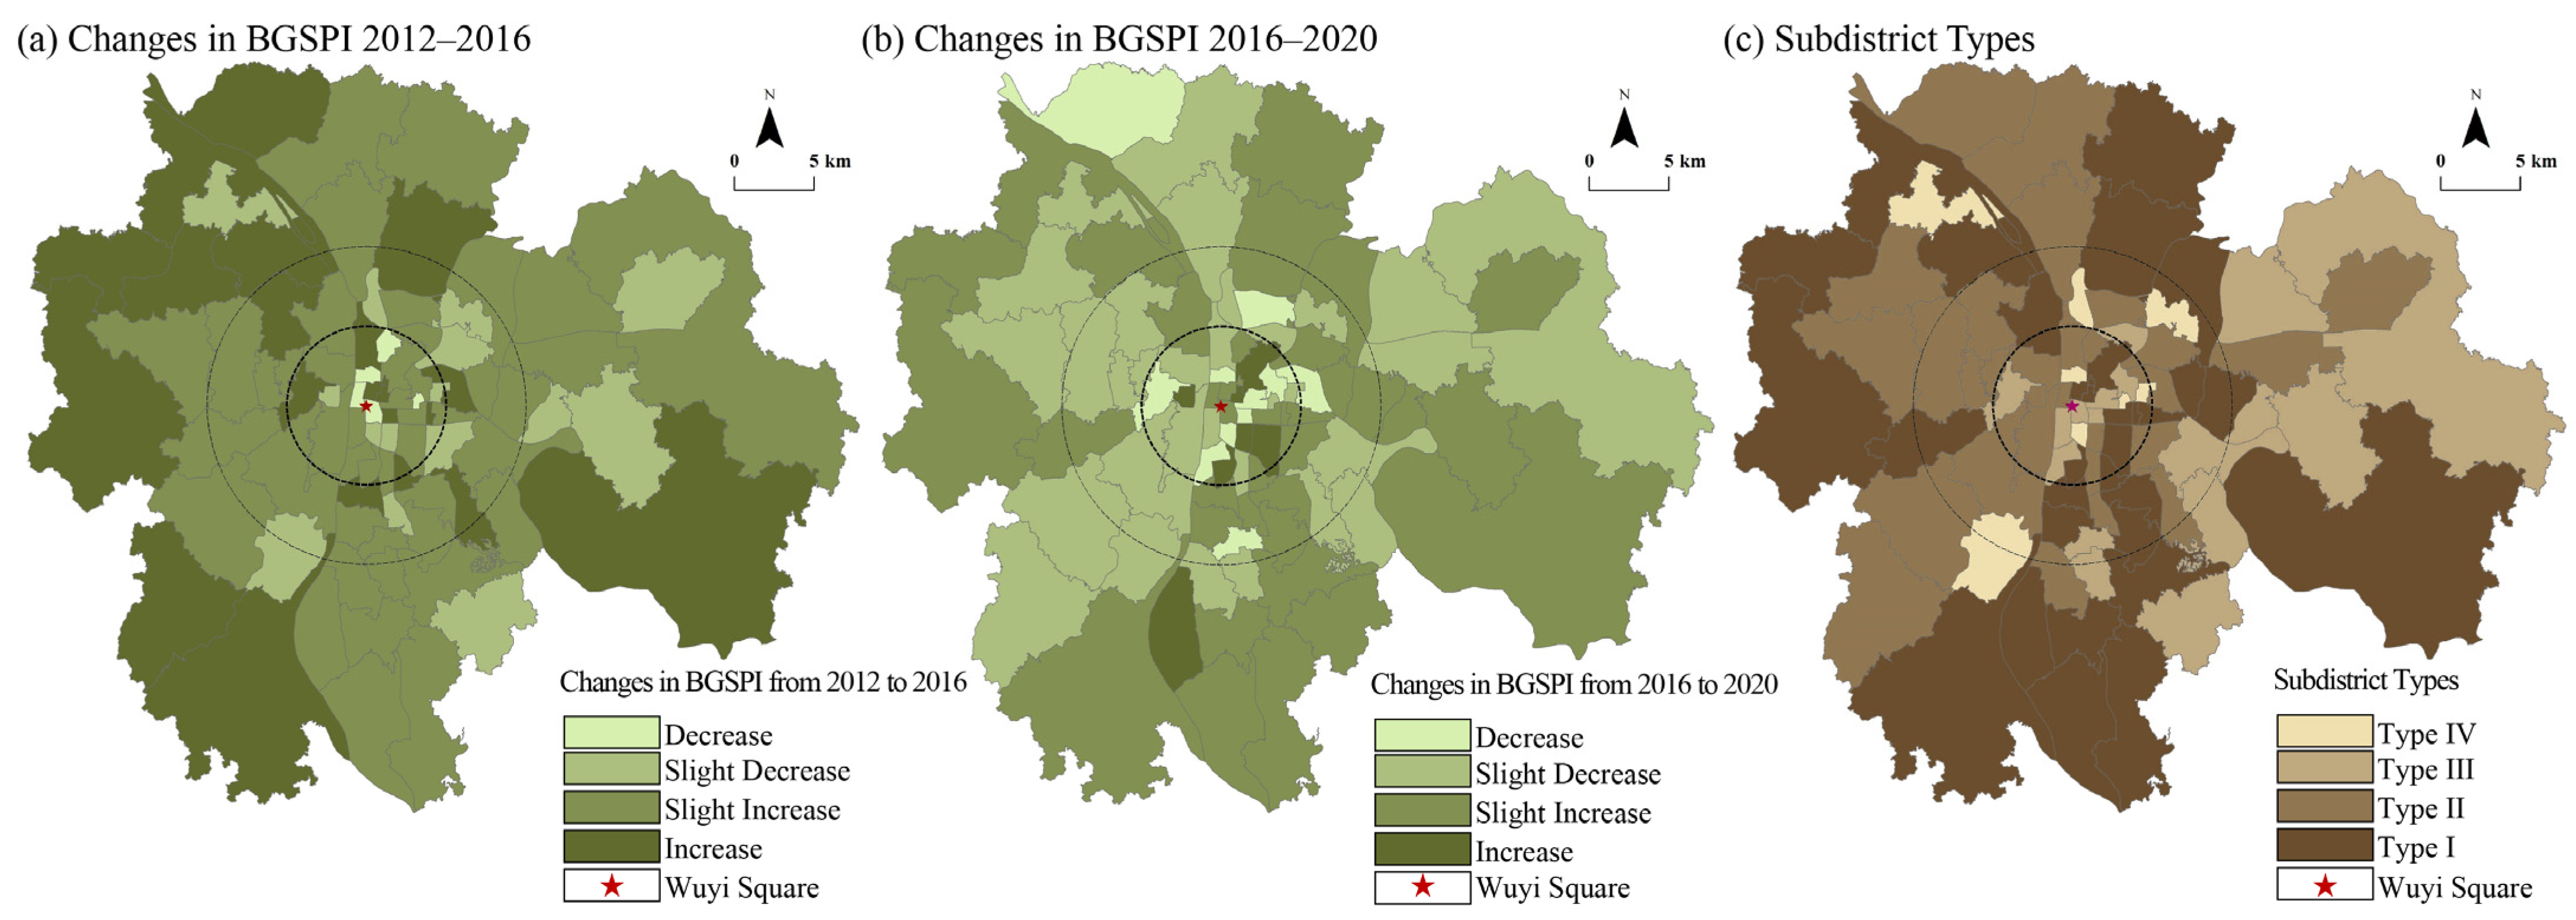
From 2012 to 2020, the BGSPI of more than two-thirds of the subdistricts in Changsha increased, and more than one-third were the steadily rising type (Type I). The subdistricts of fluctuation decline type (Type III) and the continuously declining type (Type IV) account for nearly one-third (Table 6).
Regarding spatial distribution, the subdistricts of Type I were primarily located in suburban areas and showed the spatial characteristics of banding along the Xiangjiang River, the Guitang River, and other waterways, such as the districts of Yueliangdao, Guanshaling, Chilinglu, and Xinkaipu on the bank of Xiangjiang River (Figure 7). The subdistricts of Type II mainly concentrated on the west bank of the Xiangjiang River, such as the districts of Yuelu, Juzizhou, and Yinpenling (Figure 7). The subdistricts of Type III, such as Dingwangtai, Pozijie, and Sifangping, were on the east bank of the Xiangjiang River in the central district (Figure 7). The subdistricts of Type IV were dispersed in various districts, with the central district being the main center, such as the districts of Wulipai, Xiangyalu, and Chengnanlu (Figure 7).
5. Discussion
5.1. Theoretical Framework
This study focused on the physical characteristics of UBGS and established a theoretical framework and evaluation system for UBGS publicness. Publicness has gradually expanded from the original political philosophy field to social and economic fields as modern society has developed. In this study, spatial publicness focused on the social field. UBGS publicness means that the public can interact, create interpersonal connections, and form a community by entering the UBGS. China is a country with public land ownership, which is a unified attribute of UBGS, so it has little impact on its publicness. Therefore, unlike evaluation models such as the star [14,15], the OMAI [19], etc., that emphasize land ownership, this study does not include land ownership in the evaluation system of UBGS publicness. Meanwhile, focusing on the external representation of UBGS to establish the evaluation framework helps achieve more objective results. The evaluation system applies to other cities to conduct spatial publicness evaluations that address the physical characteristics of the space.
5.2. Research Method
This study realized the urban-scale UBGS publicness evaluation using multi-source data and ArcGIS 10.8 spatial analysis methods. Unlike the micro-case analysis approach of existing studies, this study evaluated UBGS publicness and described its spatial pattern at the urban scale by taking Changsha, China, as an example. The evaluation results of this study allow for a comparative analysis of different regions. On this basis, we realize an objective analysis of the evolution of UBGS publicness patterns. Therefore, this study expands the temporal and spatial dimensions of UBGS publicness from a longer time series and an enormous spatial scope, discovering its evolutionary characteristics and development trends. This study will lay the foundation for proposing effective strategies to enhance UBGS publicness.
5.3. Influencing Factors and Driving Mechanisms
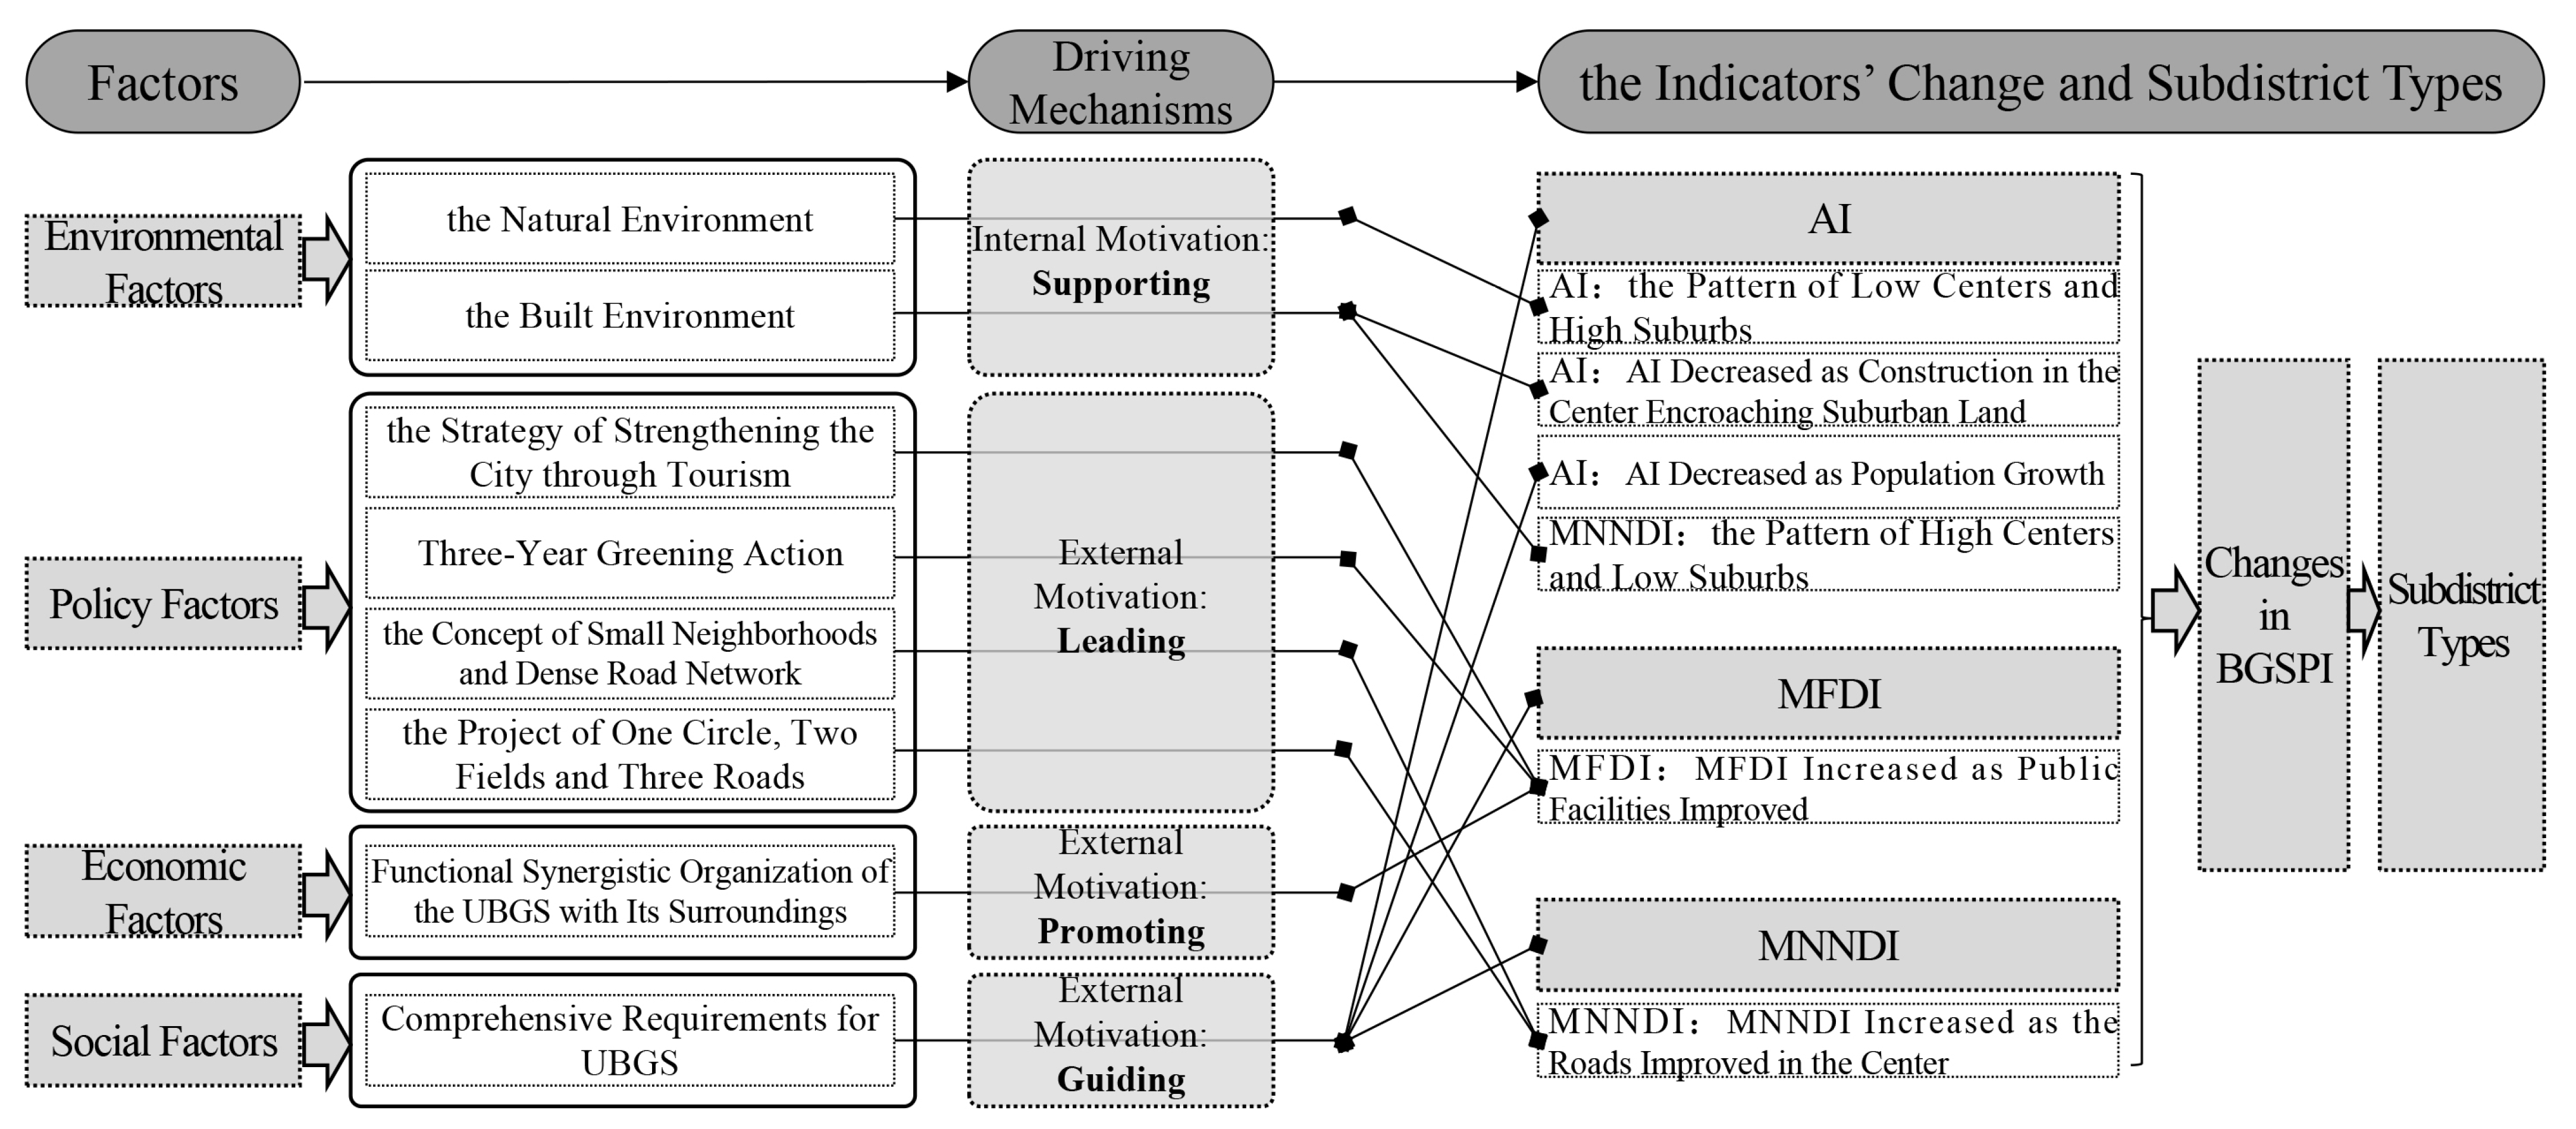
Environmental, policy, economic, and social factors all influence and drive the evolution of Changsha’s publicness pattern of UBGS (Figure 8).
Environmental factors are the intrinsic driving force for the evolution of the pattern of UBGS publicness. The Xiangjiang River passes through the city from south to north. Yuelu Mountain stands on the west bank, and Juzi Island stands in the middle of the river, forming a general image of mountains, rivers, islands, and the city and laying down the basic framework of Changsha’s UBGS. Regarding the natural environment, the UBGS is scattered at points in the central area, while there are rich natural resources such as mountains and water systems in the suburban area. The difference in resource endowment between the central area and the suburbs is an essential reason for the spatial pattern of AI low in the central area and high in the suburbs. As far as the built environment is concerned, the road system in the central area is well-developed, providing corridor carriers for public movement in the UBGS and triggering a spatial pattern of MNNDI in the high central area and low peri-urban area. From 2012 to 2020, the scope of Changsha’s built-up area continued to expand. Industrial land, land for transportation facilities, and residential land extended outward, encroaching on ecological land in the periphery. The increasingly scarce land resources in the central area greatly limited the increase of UBGS’ scale and indirectly impeded the improvement of the BGSPI. It triggered an overall decline in AI in central and peri-urban areas. The outward extension of urban roads created segmentation of large areas of UBGS from 2012 to 2020, triggering a shift in the type of UBGS, e.g., from urban-type UBGS to district-type or community-type and district-type UBGS to community-type. At the same time, the increase in road density improved the connectivity between UBGS units, contributing to the overall rise in MNNDI.
Policy factors play a dominant role in the evolution of Changsha’s UBGS publicness pattern. The government’s behavior is essential in donating the focus of urban development and construction in China. The formulation and implementation of institutional policies directly reflect the government’s behavior. Changsha proposed strengthening the city through tourism, relying on UBGS such as Yuelu Mountain, Juzi Island, and the Xiangjiang River in 2012. In order to provide tourists with good tourism services, the type and number of cultural facilities and commercial facilities were increased in UBGS and its surrounding environment, mainly in the central area, triggering the rise of MFDI in the central area. Changsha proposed the “Three-Year Greening Action” to build a higher standard of UBGS in 2013, improving the public facilities in UBGS and its surrounding environment and contributing to the rise of MFDI in the central district. Changsha implemented the construction concept of “small neighborhoods and dense road network” in 2017. Moreover, Changsha completed the “One Circle, Two Fields and Three Roads” project in 2019. The construction of living circles improved the UBGS and the pedestrian paths, bicycle paths, and historical and cultural trails that connected the UBGS units effectively. These policies promoted the connectivity between UBGS units and led to a more networked and structured UBGS system. Accordingly, the MNNDI of Changsha’s UBGS increased substantially in 2020.
Economic factors contribute to the evolution of the pattern of UBGS publicness in Changsha. The people gathered in the UBGS, and their activity demand attracted commercial, recreational, and cultural facilities adjacent to UBGS. For example, art museums and commercial facilities were near the lake in Changsha’s Houhu International Art Zone, the Youyou Commercial Town was adjacent to the Guitang River, and so on. The synergistic organization of the functions of UBGS and its surrounding environment is an effective way to promote the rise of MFDI of the corresponding subdistricts’ UBGS. Additionally, it eases the burden of building supporting facilities for UBGS. Changsha will further develop its tertiary recreation and cultural consumption industries by promoting the tourism city strategy. UBGS, as an essential support carrier for the strategy, will further increase its MFDI.
Social factors play a guiding role in the evolution of the publicness pattern of UBGS in Changsha. The results of Changsha’s sixth and seventh national census showed that the population of Changsha grew by nearly 3 million from 2010 to 2020, with different growth in the subdistricts. The public demand for UBGS increased substantially. The population grew, and UBGS decreased simultaneously, triggering a decrease in AI. On the other hand, Changsha’s per capita disposable income rose from 29,100 yuan to 51,500 yuan from 2012 to 2020, and the public’s standard of living greatly improved. Open, diversified, and shared public life has become essential to the public’s life. UBGS is the material carrier of public life, and catering to the public’s needs has become an essential goal of UBGS construction. Publicness is the consistent value orientation of UBGS, and the public demand puts forward specific requirements for UBGS—whether the spatial scale can match the total public population, whether the functional types can enrich the public’s choices, and whether the structural connectivity can conform to the law of public activities. Therefore, public interest guides the construction of UBGS and its system from the demand side, and the influence on UBGS publicness is comprehensive. AI of UBGS in Changsha decreased from 2012 to 2020, while MFDI and MNNDI increased to different degrees.
The BGSPI of UBGS publicness is obtained by linearly weighting the single indicators, and its spatial pattern and evolution are closely related to the changes of each single indicator. From a comprehensive point of view, the BGSPI maintains its growth because both MFDI and MNNDI show an increasing trend from 2012 to 2020, which drives the BGSPI to increase. MFDI and MNNDI maintain the pattern of being high in the center area and low in the suburbs. Meanwhile, the construction of several landscape belts in Changsha, such as the Xiangjiang River, Liuyang River, Guitang River, Jinjiang River, etc., has driven the construction of waterfront roads and the improvement of facilities along the waterfront areas. The construction of landscape belts has driven the MFDI and MNNDI indicators to form fan-shaped zones extending from the central area to the peripheral areas and to form localized sub-central zones in the peripheral areas. It is an essential reason for driving the BGSPI from a circle-type spatial pattern with a single-core edge to a composite spatial pattern with a core edge as the main focus and a fan-shaped expansion as a supplement. We should pay more attention to the fact that AI is opposite to the performance of MFDI and MNNDI. The overall reduction of AI and the maintenance of the pattern of low in the central area and high in the peripheral area are the reasons triggering the development of BGSPI from polarization to balanced spatial characteristics.
The types of subdistricts are closely related to the change in UBGS’ BGSPI.
- (1)
- The reasons why the subdistricts of Type I are located in the suburban area and distributed in a belt shape are as follows: The suburban area is rich in natural resources. The construction of the waterfront scenic zone in the suburban area has improved the UBGS’ greening quality, public facilities, and waterfront roads. AI of these subdistricts maintains a high level, and MFDI and MNNDI rise. That further contributes to the continued rise in BGSPI of the subdistricts along the water.
- (2)
- The reasons why the subdistricts of Type II are primarily located on the west bank of the Xiangjiang River are as follows: The development of the Xiangjiang New Area on the west bank of the Xiangjiang River has led to the continuous growth of the population, resulting in the decrease in AI. However, the types of public facilities in the UBGS and its surroundings have changed due to the influence of market factors. These factors trigger the fluctuating increase in the BGSPI.
- (3)
- The reasons why the subdistricts of Type III are primarily located in the core of the central area are as follows: The population and density in the central area continue to grow, significantly reducing AI. Despite the abundance of public facilities within the UBGS and its surroundings and the convenience of connections between the UBGS units, the lack of land resources still severely restricts the increase in BGSPI of these subdistricts.
- (4)
- The subdistricts of Type IV are where insufficient land resources are the key reason for the continuous decline in BGSPI.
The results of the subdistrict types show that urban construction has effectively promoted the development of UBGS, and its BGSPI has improved as a whole. However, the continuous decline or fluctuating decline in the BGSPI of some subdistricts in the central area primarily stems from the fact that scarce land resources restrict the growth of UBGS. At the same time, the increasing population exacerbates the mismatch between supply and demand, greatly restricting the enhancement of AI and indirectly contributing to the continuous decline in BGSPI. It suggests that city governments and relevant subdistrict governments should pay more attention to population changes, incorporate UBGS construction, layout, and quality improvement plans in urban renewal projects, and increase financial investment in UBGS construction to alleviate the contradiction between population growth and UBGS shortage.
Overall, the factors and driving mechanisms for the evolution of the publicness pattern of UBGS in Changsha are as follows: First, environmental factors, as the supportive elements of UBGS, have an intrinsic driving force for the formation and evolution of the publicness pattern of UBGS. Second, policy factors dominate the direction of urban development and the focus of construction, which determines the status and role of UBGS in the city and has a dominant role in the evolution of the publicness pattern of UBGS. Third, the agglomeration effect of UBGS on the public attracts various cultural and commercial facilities to be located nearby, stimulating potential social interactions and promoting the evolution of the UBGS pattern. Finally, the social factors put forward specific requirements on the scale, function, and layout of UBGS from the demand side and have a guiding effect on the evolution of the pattern of publicness of UBGS.
5.4. Limitations and Future Research
UBGS publicness is crucial for public well-being and sustainable urban development. This study established a theoretical framework for UBGS publicness based on the theory of the man–land relationship. UBGS should support the public arriving at UBGS, choosing the type of activity, and carrying out a wide range of social interactions. However, this study cannot specifically analyze the public’s age, gender, socioeconomic status, and behavioral preferences. In future research, the group categories of the public should be analyzed in detail to explore the differences in the performance of UBGS in supporting public life for different groups, to promote equal opportunities for different groups to access UBGS, to realize a higher level of UBGS publicness, and to promote a broader range of human well-being. This study synthesized land cover and planning information to obtain data on urban UBGS. In future research, we can use deep learning methods to improve the accuracy of UBGS, covering green spaces within the neighborhood, around the buildings and roads, refining the UBGS samples, and improving the fineness of UBGS publicness evaluation. At the same time, future research will further consider the performance of UBGS at the macro scale of city clusters, watersheds, and even countries or the micro scale of communities and neighborhoods to further enrich the spatial scale.
6. Conclusions
From the perspective of the man–land relationship, the key to realizing UBGS publicness is that UBGS should have the essential features to support public life—accessible elements, selectable functions, and shared connectivity, taking into account the process and state of public life. We employed the 2SFCA method, Shannon’s diversity index, and the mean nearest-neighbor distance index to measure element accessibility, functional diversity, and structural connectivity, respectively. The comprehensive indicator index was synthesized using the linear weighting method. The empirical study of the publicness of UBGS in Changsha showed that the evaluation idea and method are operable.
The results of Changsha’s UBGS publicness evaluation were as follows:
- (1)
- From the perspective of changes in the scale of UBGS, the total amount decreased from 2012 to 2020, with a continuous decline in city-type UBGS and a continuous increase in district-type and community-type UBGS yearly.
- (2)
- Regarding the element accessibility indicator, AI showed a yearly decreasing trend and maintained the spatial pattern of the low central and high peri-urban areas from 2012 to 2020. The city and the relevant subdistrict governments should pay attention to the UBGS’s size and population changes in the central area. On the one hand, UBGS’s encroachment by construction projects should be avoided, and on the other hand, urban renewal projects should be used to increase the size of UBGS. In this way, the contradiction between UBGS and population size can be alleviated, and the public’s access to UBGS can be improved.
- (3)
- Regarding the functional diversity indicator, MFDI gradually evolved from a monocentric polarized spatial pattern of high in the central and low in peripheral areas to a polycentric and balanced spatial pattern from 2012 to 2020. This indicates that the gap in UBGS’ MFDI between peri-urban and central areas has decreased. In the construction of UBGS, the functional organization of UBGS and its surrounding public facilities should be further coordinated to enrich the public’s choice of activities.
- (4)
- Regarding the structural connectivity indicator, MNNDI improved overall and transformed from a monocentric core-edge pattern to a polycentric core-edge pattern. This indicates that the gap in UBGS’ MNNDI between peri-urban and central areas has decreased. Good connectivity between UBGS units provides corridors for the public to move around a wider area and opportunities to break out of the rigid space of social life.
- (5)
- Regarding the comprehensive indicator, BGSPI developed from the core-edge circled spatial differentiation pattern to a composite spatial differentiation pattern dominated by core-edge areas and supplemented by fan-shaped areas from 2012 to 2020.
- (6)
- Regarding the subdistrict types, nearly 70% of the subdistricts in the study area showed an increase in UBGS publicness from 2012 to 2020, and about 9.41% continued to decline. The scarcity of land resources was the critical reason limiting the increase in the publicness of the UBGS.
The findings of this study showed that the environmental construction, urban strategy, economic development, and population characteristics had an impact on the UBGS publicness and its spatial pattern. Based on the UBGS publicness evaluation results, city governments and relevant subdistrict governments should propose specific strategies to enhance UBGS publicness through environmental construction, policy formulation, population analysis, etc. In this way, the city can increase public access to UBGS, enrich the public’s choice of activities, develop a broader range of socialization, and promote its livability and sustainability.
Author Contributions
Conceptualization, methodology, writing—editing, software, C.Z. and P.Z.; writing—original draft, C.Z. and N.Z.; writing—review and editing, S.Q. and Y.Z. All authors have read and agreed to the published version of the manuscript.
Funding
This work was funded by the National Natural Science Fund Project of China (42171202) and the Hunan Provincial Social Science Foundation Key Project of Hunan Province (20ZDB034).
Institutional Review Board Statement
Not applicable.
Informed Consent Statement
Not applicable.
Data Availability Statement
The original contributions presented in the study are included in the article, further inquiries can be directed to the corresponding author.
Conflicts of Interest
Author Yong Zhang was employed by the company Hunan Sidayuan Planning Consulting and Research Co., Ltd. The remaining authors declare that the research was conducted in the absence of any commercial or financial relationships that could be construed as a potential conflict of interest.
References
- Cysek-Pawlak, M.; Krzysztofik, S.; Makowski, A. Urban regeneration and urban resilience planning through connectivity: The importance of this principle of new urbanism. Eur. Spat. Res. Policy 2022, 29, 111–133. [Google Scholar] [CrossRef]
- Wang, S.; Yung, E.H.K.; Sun, Y. Effects of open space accessibility and quality on older adults’ visit: Planning towards equal right to the city. Cities 2022, 125, 103611. [Google Scholar] [CrossRef]
- Moore, G.M. Connectivity of public open space: Its meaning for different functions. J. Urban Des. 2021, 26, 279–295. [Google Scholar] [CrossRef]
- Peters, K.; Elands, B.; Buijs, A. Social interactions in urban parks: Stimulating social cohesion? Urban For. Urban Green. 2010, 9, 93–100. [Google Scholar] [CrossRef]
- Jennings, V.; Bamkole, O. The Relationship between Social Cohesion and Urban Green Space: An Avenue for Health Promotion. Int. J. Environ. Res. Public Health 2019, 16, 452. [Google Scholar] [CrossRef] [PubMed]
- Kweon, B.; Sullivan, W.C.; Wiley, A.R. Green Common Spaces and the Social Integration of Inner-City older adults. Environment and behavior. Environ. Behav. 1998, 30, 832–858. [Google Scholar] [CrossRef]
- Hoppenbrouwer, E.; Louw, E. Mixed-use development: Theory and practice in Amsterdam’s Eastern Docklands. Eur. Plan. Stud. 2005, 13, 967–983. [Google Scholar] [CrossRef]
- Francis, J.; Giles-Corti, B.; Wood, L.; Knuiman, M. Creating sense of community: The role of public space. J. Environ. Psychol. 2012, 32, 401–409. [Google Scholar] [CrossRef]
- Liu, L.; Huang, Y.; Zhang, W. Residential segregation and perceptions of social integration in Shanghai, China. Urban Stud. 2018, 55, 1484–1503. [Google Scholar] [CrossRef]
- Tiesdell, S.; Oc, T. Beyond ‘fortress’ and ‘panoptic’ cities—Towards a safer urban public realm. Environ. Plan. B Plan. Des. 1998, 25, 639–655. [Google Scholar] [CrossRef]
- Qian, J. Geographies of public space: Variegated publicness, variegated epistemologies. Prog. Hum. Geogr. 2020, 44, 77–98. [Google Scholar] [CrossRef]
- Madanipour, A. Why are the design and development of public spaces significant for cities? Environ. Plan. B Plan. Des. 1999, 26, 879–891. [Google Scholar] [CrossRef]
- Németh, J. Security in Public Space: An Empirical Assessment of Three US Cities. Environ. Plan. A Econ. Space 2010, 42, 2487–2507. [Google Scholar] [CrossRef]
- Varna, G. Measuring Public Space: The Star Model; Routledge: London, UK; New York, NY, USA, 2016; pp. 1–275. [Google Scholar]
- Varna, G.; Tiesdell, S. Assessing the Publicness of Public Space:The Star Model of Publicness. J. Urban Des. 2010, 15, 575–598. [Google Scholar] [CrossRef]
- Van Melik, R.; Van Aalst, I.; Van Weesep, J. Fear and Fantasy in the Public Domain: The Development of Secured and Themed Urban Space. J. Urban Des. 2007, 12, 25–42. [Google Scholar] [CrossRef]
- Németh, J.; Schmidt, S. The privatization of public space: Modeling and measuring publicness. Environ. Plan. B Plan. Des. 2011, 38, 5–23. [Google Scholar] [CrossRef]
- Mantey, D. The ‘publicness’ of suburban gathering places: The example of Podkowa Leśna (Warsaw urban region, Poland). Cities 2017, 60, 1–12. [Google Scholar] [CrossRef]
- Langstraat, F.; Van Melik, R. Challenging the ‘End of Public Space’: A Comparative Analysis of Publicness in British and Dutch Urban Spaces. J. Urban Des. 2013, 18, 429–448. [Google Scholar] [CrossRef]
- Lopes, M.; Santos Cruz, S.; Pinho, P. Revisiting Publicness in Assessment of Contemporary Urban Spaces. J. Urban Plan. Dev 2019, 145, 4019013. [Google Scholar] [CrossRef]
- Lopes, M.; Santos Cruz, S.; Pinho, P. Publicness of Contemporary Urban Spaces: Comparative Study Between Porto and Newcastle. J. Urban Plan. Dev 2020, 146. [Google Scholar] [CrossRef]
- Németh, J.; Schmidt, S. Toward a Methodology for Measuring the Security of Publicly Accessible Spaces. J. Am. Plan. Assoc. 2007, 73, 283–297. [Google Scholar] [CrossRef]
- Schmidt, S.; Nemeth, J.; Botsford, E. The evolution of privately owned public spaces in New York City. Urban Des. Int. 2011, 16, 270–284. [Google Scholar] [CrossRef]
- Wu, Y.; Wang, J.; Lau, S.S.; Lau, S.S.Y.; Miao, Y. An Improved Publicness Assessment Tool Based on a Combined Spatial Model: Case Study of Guangzhou, China. Sustainability 2022, 14, 14711. [Google Scholar] [CrossRef]
- Qian, J. Re-visioning the public in post-reform urban China: Poetics and politics in Guangzhou; Springer: Singapore, 2017. [Google Scholar]
- Wang, Y.; Chen, J. Does the rise of pseudo-public spaces lead to the ‘end of public space’ in large Chinese cities? Evidence from Shanghai and Chongqing. Urban Des. Int. 2018, 23, 215–235. [Google Scholar] [CrossRef]
- Jiang, M.; Nakajima, N. Chongqing People’s Square after 1997: Situated publicness of municipal squares in reform-era China. Urban Res. Pract. 2023, 16, 489–517. [Google Scholar] [CrossRef]
- Chitrakar, R.M.; Baker, D.C.; Guaralda, M. How accessible are neighbourhood open spaces? Control of public space and its management in contemporary cities. Cities 2022, 131, 103948. [Google Scholar] [CrossRef]
- Mantey, D.; Kępkowicz, A. Types of Public Spaces: The Polish Contribution to the Discussion of Suburban Public Space. Prof. Geogr. 2018, 70, 633–654. [Google Scholar] [CrossRef]
- Mantey, D.; Kępkowicz, A. Models of Community-Friendly Recreational Public Space in Warsaw Suburbs. Methodological Approach. Sustainability 2020, 12, 6764. [Google Scholar] [CrossRef]
- Li, X.; Yang, Y.; Liu, Y. Research progress in man-land relationship evolution and its resource-environment base in China. J. Geogr. Sci. 2017, 27, 899–924. [Google Scholar] [CrossRef]
- Zhou, D.; Xu, J.; Wang, L.; Lin, Z. Assessing urbanization quality using structure and function analyses: A case study of the urban agglomeration around Hangzhou Bay (UAHB), China. Habitat Int. 2015, 49, 165–176. [Google Scholar] [CrossRef]
- Madanipour, A. Whose Public Space? Routledge: London, UK; New York, NY, USA, 2010; pp. 237–242. [Google Scholar]
- Zhang, R.; Peng, S.; Sun, F.; Deng, L.; Che, Y. Assessing the social equity of urban parks: An improved index integrating multiple quality dimensions and service accessibility. Cities 2022, 129, 103839. [Google Scholar] [CrossRef]
- Wu, W.; Chen, W.Y.; Yun, Y.; Wang, F.; Gong, Z. Urban greenness, mixed land-use, and life satisfaction: Evidence from residential locations and workplace settings in Beijing. Landsc. Urban Plan. 2022, 224, 104428. [Google Scholar] [CrossRef]
- Madanipour, A. “Social Exclusion and Space” from Ali Madanipour, Goran Cars, and Judith Allen (eds), Social Exclusion in European Cities: Processes, Experiences, and Responses (1998). In The City Reader; Routledge: Hoboken, NJ, USA, 2011; pp. 186–194. [Google Scholar]
- Boessen, A.; Hipp, J.R.; Butts, C.T.; Nagle, N.N.; Smith, E.J. The built environment, spatial scale, and social networks: Do land uses matter for personal network structure? Environ. Plan. B Urban Anal. City Sci. 2018, 45, 400–416. [Google Scholar] [CrossRef]
- Boessen, A.; Hipp, J.R.; Smith, E.J.; Butts, C.T.; Nagle, N.N.; Almquist, Z. Networks, Space, and Residents’ Perception of Cohesion. Am. J. Community Psychol. 2014, 53, 447–461. [Google Scholar] [CrossRef]
- Thompson, C.W. Urban open space in the 21st century. Landsc. Urban Plan. 2002, 60, 59–72. [Google Scholar] [CrossRef]
- Madureira, H.; Monteiro, A. Going Green and Going Dense: A Systematic Review of Compatibilities and Conflicts in Urban Research. Sustainability 2021, 13, 10643. [Google Scholar] [CrossRef]
- Changsha City Urban Management and Law Enforcement Bureau. Available online: http://cgj.changsha.gov.cn/zfxxgk/tzgg/202304/t20230427_11079084.html (accessed on 13 February 2024).
- Yang, J.; Huang, X. The 30 m annual land cover dataset and its dynamics in China from 1990 to 2019. Earth Syst. Sci. Data 2021, 13, 3907–3925. [Google Scholar] [CrossRef]
- CJJ/T 85-2017; Standard for Classification of Urban Green Space. China Architecture & Building Press: Beijing, China, 2018.
- Feng, S.; Chen, L.; Sun, R.; Feng, Z.; Li, J.; Khan, M.S.; Jing, Y. The Distribution and Accessibility of Urban Parks in Beijing, China: Implications of Social Equity. Int. J. Environ. Res. Public Health 2019, 16, 4894. [Google Scholar] [CrossRef] [PubMed]
- Tannous, H.O.; Major, M.D.; Furlan, R. Accessibility of green spaces in a metropolitan network using space syntax to objectively evaluate the spatial locations of parks and promenades in Doha, State of Qatar. Urban For. Urban Green. 2021, 58, 126892. [Google Scholar] [CrossRef]
- Chen, X.; Jia, P. A comparative analysis of accessibility measures by the two-step floating catchment area (2SFCA) method. Int. J. Geogr. Inf. Sci. 2019, 33, 1739–1758. [Google Scholar] [CrossRef]
- Kong, L.; Liu, Z.; Pan, X.; Wang, Y.; Guo, X.; Wu, J. How do different types and landscape attributes of urban parks affect visitors’ positive emotions? Landsc. Urban Plan. 2022, 226, 104482. [Google Scholar] [CrossRef]
- GB 50180-2018; Standard for Urban Residential Area Planning and Design. China Architecture & Building Press: Beijing, China, 2018.
- GB/T 51328-2018; Standard for Urban Comprehensive Transport System Planning. China Architecture & Building Press: Beijing, China, 2019.
- Shen, Y.; Karimi, K. Urban function connectivity: Characterisation of functional urban streets with social media check-in data. Cities 2016, 55, 9–21. [Google Scholar] [CrossRef]
- Zhou, C.; An, Y.; Zhao, J.; Xue, Y.; Fu, L. How do mini-parks serve in groups? A visit analysis of mini-park groups in the neighbourhoods of Nanjing. Cities 2022, 129, 103804. [Google Scholar] [CrossRef]
- Yu, P.; Yung, E.H.K.; Chan, E.H.W.; Wang, S.; Chen, Y.; Chen, Y. Capturing open space fragmentation in high–density cities: Towards sustainable open space planning. Appl. Geogr. 2023, 154, 102927. [Google Scholar] [CrossRef]
- Li, Y.; Li, D. Assessment and forecast of Beijing and Shanghai’s urban ecosystem health. Sci. Total Environ. 2014, 487, 154–163. [Google Scholar] [CrossRef] [PubMed]
- Kors, J.A.; van Bemmel, J.H. The Delphi method: A review of its applications in medicine. Medinfo 1989, 89, 156–160. [Google Scholar]
Figure 1.
Study area.

Figure 2.
Technology path.

Figure 3.
Spatial patterns of AI, MFDI, and MNNDI from 2012 to 2020.

Figure 4.
Changes in BGSPI of the subdistricts from 2012 to 2020.

Figure 5.
Spatial Patterns of BGSPI from 2012 to 2020.

Figure 6.
Schematic representation of the evolution of the Spatial Patterns of UBGS publicness in Changsha from 2012 to 2020.
Figure 6.
Schematic representation of the evolution of the Spatial Patterns of UBGS publicness in Changsha from 2012 to 2020.

Figure 7.
Changes in BGSPI, and subdistrict types.

Figure 8.
The evolution and driving mechanisms of UBGS publicness pattern in Changsha.


Table 1.
UBGS publicness evaluation indicators and their meanings.
| Dimension | Indicator | Index | Indicator Direction | Meaning of Indicators |
|---|---|---|---|---|
| Element | Element accessibility | Weighted per capita area index | + | Opportunities for the public to access UBGS |
| Function | Functional diversity | Shannon’s diversity index | + | The richness of public life options available to the public in UBGS and its surroundings |
| Structure | Structural connectivity | Mean nearest-neighbor distance index | − | The breadth of social contact that the public can achieve in UBGS |
Table 2.
Classification of subdistricts.
| Categories | Category Name | Standard of Judgment |
|---|---|---|
| Type I | Steadily rising type | BGSPI is trending up in both phases, 2012–2016 and 2016–2020. |
| Type II | Fluctuation rise type | BGSPI is trending up in 2012–2016, down in 2016–2020, and generally up in 2012–2020. Alternatively, BGSPI is trending down in 2012–2016, up in 2016–2020, and generally up in 2012–2020. |
| Type III | Fluctuation decline type | BGSPI is trending up in 2012–2016, down in 2016–2020, and generally down in 2012–2020. Alternatively, BGSPI is trending down in 2012–2016, up in 2016–2020, and generally down in 2012–2020. |
| Type IV | Continuously declining type | BGSPI is trending down in the 2012–2016 and 2016–2020 phases. |
Table 3.
Changes in the scale of UBGS, 2012–2020 (unit: km2).
| Year | City-Type | District-Type | Community-Type | Total | ||||
|---|---|---|---|---|---|---|---|---|
| Area | Proportion | Area | Proportion | Area | Proportion | Area | Change | |
| 2012 | 1109.25 | 95.47% | 42.74 | 3.68% | 9.94 | 0.86% | 1161.93 | −4.47% |
| 2016 | 1026.29 | 92.72% | 66.99 | 6.05% | 13.56 | 1.23% | 1106.84 | −5.44% |
| 2020 | 922.97 | 88.19% | 106.11 | 10.14% | 17.52 | 1.67% | 1046.60 | −9.93% |
The change in 2012 refers to 2016 relative to 2012, with 2012 as the base year. The change in 2016 refers to 2020 relative to 2016, using 2016 as the base year. The change in 2020 refers to 2020 relative to 2012, using 2012 as the base year.
Table 4.
Statistics on the changes in the number of subdistricts with different grades of the single indicators from 2012 to 2020 (unit: %).
Table 4.
Statistics on the changes in the number of subdistricts with different grades of the single indicators from 2012 to 2020 (unit: %).
| Year | Single Indicator | The Lowest-Value | The Lower-Value | The Middle-Value | The Higher-Value | The Highest-Value | |||||
|---|---|---|---|---|---|---|---|---|---|---|---|
| Proportion | Change | Proportion | Change | Proportion | Change | Proportion | Change | Proportion | Change | ||
| 2012 | AI | 61.18 | 0.00 | 12.94 | 0.00 | 4.71 | 0.00 | 10.59 | 0.00 | 10.59 | 0.00 |
| MFDI | 41.18 | −65.71 | 36.47 | 29.03 | 11.76 | 50.00 | 5.88 | 200.00 | 4.71 | −25.00 | |
| MNNDI | 21.18 | −44.44 | 3.53 | 133.33 | 22.35 | −21.05 | 47.06 | 7.50 | 5.88 | 100.00 | |
| 2016 | AI | 61.18 | 13.46 | 12.94 | −45.45 | 4.71 | 0.00 | 10.59 | 0.00 | 10.59 | −22.22 |
| MFDI | 14.12 | 41.67 | 47.06 | −2.50 | 17.65 | 6.67 | 17.65 | −33.33 | 3.53 | 0.00 | |
| MNNDI | 11.76 | −60.00 | 8.24 | −14.29 | 17.65 | 6.67 | 50.59 | −6.98 | 11.76 | 90.00 | |
| 2020 | AI | 69.41 | 13.45 | 7.06 | −45.44 | 4.71 | 0.00 | 10.59 | 0.00 | 8.24 | −22.19 |
| MFDI | 20.00 | −51.43 | 45.88 | 25.82 | 18.82 | 60.03 | 11.76 | 100.00 | 3.53 | −25.05 | |
| MNNDI | 4.71 | −77.76 | 7.06 | 100.00 | 18.82 | 15.79 | 47.06 | 0.00 | 22.35 | 280.10 | |
The change in 2012 refers to 2016 relative to 2012, with 2012 as the base year. The change in 2016 refers to 2020 relative to 2016, using 2016 as the base year. The change in 2020 refers to 2020 relative to 2012, using 2012 as the base year.
Table 5.
Statistics on the changes in the number of subdistricts with different grades of the comprehensive indicator from 2012 to 2020 (unit: %).
Table 5.
Statistics on the changes in the number of subdistricts with different grades of the comprehensive indicator from 2012 to 2020 (unit: %).
| Year | The Lowest-Value | The Lower-Value | The Middle-Value | The Higher-Value | The Highest-Value | |||||
|---|---|---|---|---|---|---|---|---|---|---|
| Proportion | Change | Proportion | Change | Proportion | Change | Proportion | Change | Proportion | Change | |
| 2012 | 45.88 | −76.92 | 20.00 | 52.94 | 14.12 | 91.67 | 9.41 | 37.50 | 10.59 | 77.78 |
| 2016 | 10.59 | 33.33 | 30.59 | −30.77 | 27.06 | 30.43 | 12.94 | 0.00 | 18.82 | −12.50 |
| 2020 | 14.12 | −69.23 | 21.18 | 5.88 | 35.29 | 150.00 | 12.94 | 37.50 | 16.47 | 55.56 |
The change in 2012 refers to 2016 relative to 2012, with 2012 as the base year. The change in 2016 refers to 2020 relative to 2016, using 2016 as the base year. The change in 2020 refers to 2020 relative to 2012, using 2012 as the base year.
Table 6.
Statistics of Subdistrict types.
| Categories | Number | Proportion | Subdistrict Name |
|---|---|---|---|
| Type I | 31 | 36.47% | Baishazhou; Chaoyangjie; Chilinglu; Datuopu; Dongan; Dongfenglu; Dongtundu; Dongjing; Guanchaling; Hehuayuan; Huangjinyuan; Huangxingzhen; Jinpenling; Jingwanzi; Laodaohe; Leifeng; Mapoling; Meixihu; Muyun; Nantuoling; Pingtang; Qingshuitang; Shaping; Shazitang; Wangluyuan; Xianfeng; Xianglong; Xinkaipu; Yuhuating; Yueliangdao; Zuojiatang |
| Type II | 29 | 34.12% | Dingziwan; Dongtang; Gaoqiao; Guitang; Hanpu; Heishipu; Houjiatang; Jinshanqiao; Juzizhou; Liuyanghe; Lugu; Mawangdui; Qingzhuhu; Quantang; Tianding; Tongtaijie; Wangchengpo; Wangyuehu; Wangyue; Wenyuan; Wujialing; Xianjiahu; Xinhe; Xiufeng; Xueshi; Yinpenling; Yuehu; Yuelu; Changlong |
| Type III | 17 | 20.00% | Dingwangtai; Donghu; Dongshan; Guihuaping; Huanghuazhen; Jiucaiyuan; Langli; Lituo; Pozijie; Qingyuan; Sifangping; Tongsheng; Wenyilu; Xihu; Xianghu; Xingsha; Yunanjie |
| Type IV | 8 | 9.41% | Chengnanlu; Dazehu; Furongbeilu; Hongshanqiao; Huoxing; Wulipai; Xiangyalu; Yanghu. |
Disclaimer/Publisher’s Note: The statements, opinions and data contained in all publications are solely those of the individual author(s) and contributor(s) and not of MDPI and/or the editor(s). MDPI and/or the editor(s) disclaim responsibility for any injury to people or property resulting from any ideas, methods, instructions or products referred to in the content. |
© 2024 by the authors. Licensee MDPI, Basel, Switzerland. This article is an open access article distributed under the terms and conditions of the Creative Commons Attribution (CC BY) license (https://creativecommons.org/licenses/by/4.0/).
Share and Cite
MDPI and ACS Style
Zhang, C.; Zhang, N.; Zhu, P.; Qin, S.; Zhang, Y. The Evolution and Driving Mechanisms of the Blue-Green Space Publicness Pattern in Changsha, China. Land 2024, 13, 403. https://doi.org/10.3390/land13040403
AMA Style
Zhang C, Zhang N, Zhu P, Qin S, Zhang Y. The Evolution and Driving Mechanisms of the Blue-Green Space Publicness Pattern in Changsha, China. Land. 2024; 13(4):403. https://doi.org/10.3390/land13040403
Chicago/Turabian StyleZhang, Chen, Nan Zhang, Peijuan Zhu, Shuqian Qin, and Yong Zhang. 2024. "The Evolution and Driving Mechanisms of the Blue-Green Space Publicness Pattern in Changsha, China" Land 13, no. 4: 403. https://doi.org/10.3390/land13040403
Note that from the first issue of 2016, this journal uses article numbers instead of page numbers. See further details here.