


Your Favourite Park Is Not My Favourite Park: A Participatory Geographic Information System Approach to Improving Urban Green and Blue Spaces—A Case Study in Edinburgh, Scotland
 ,
,  ,
,
Abstract
:1. Introduction
- Who visits UGBSs in the city, which UGBSs do they visit and/or avoid, how do they get there, and what activities do they engage in?
- Are the UGBSs visited and/or avoided distinguishable by the demographic characteristics of the respondents?
- What are the characteristics of UGBSs that attract or deter people?
2. Context, Materials, and Methods
2.1. City of Edinburgh
2.2. Project Design
2.2.1. Survey Design and Collection of Baseline Data
2.2.2. Respondent Recruitment and Sampling Strategy
3. Results
3.1. Visitor Profiles
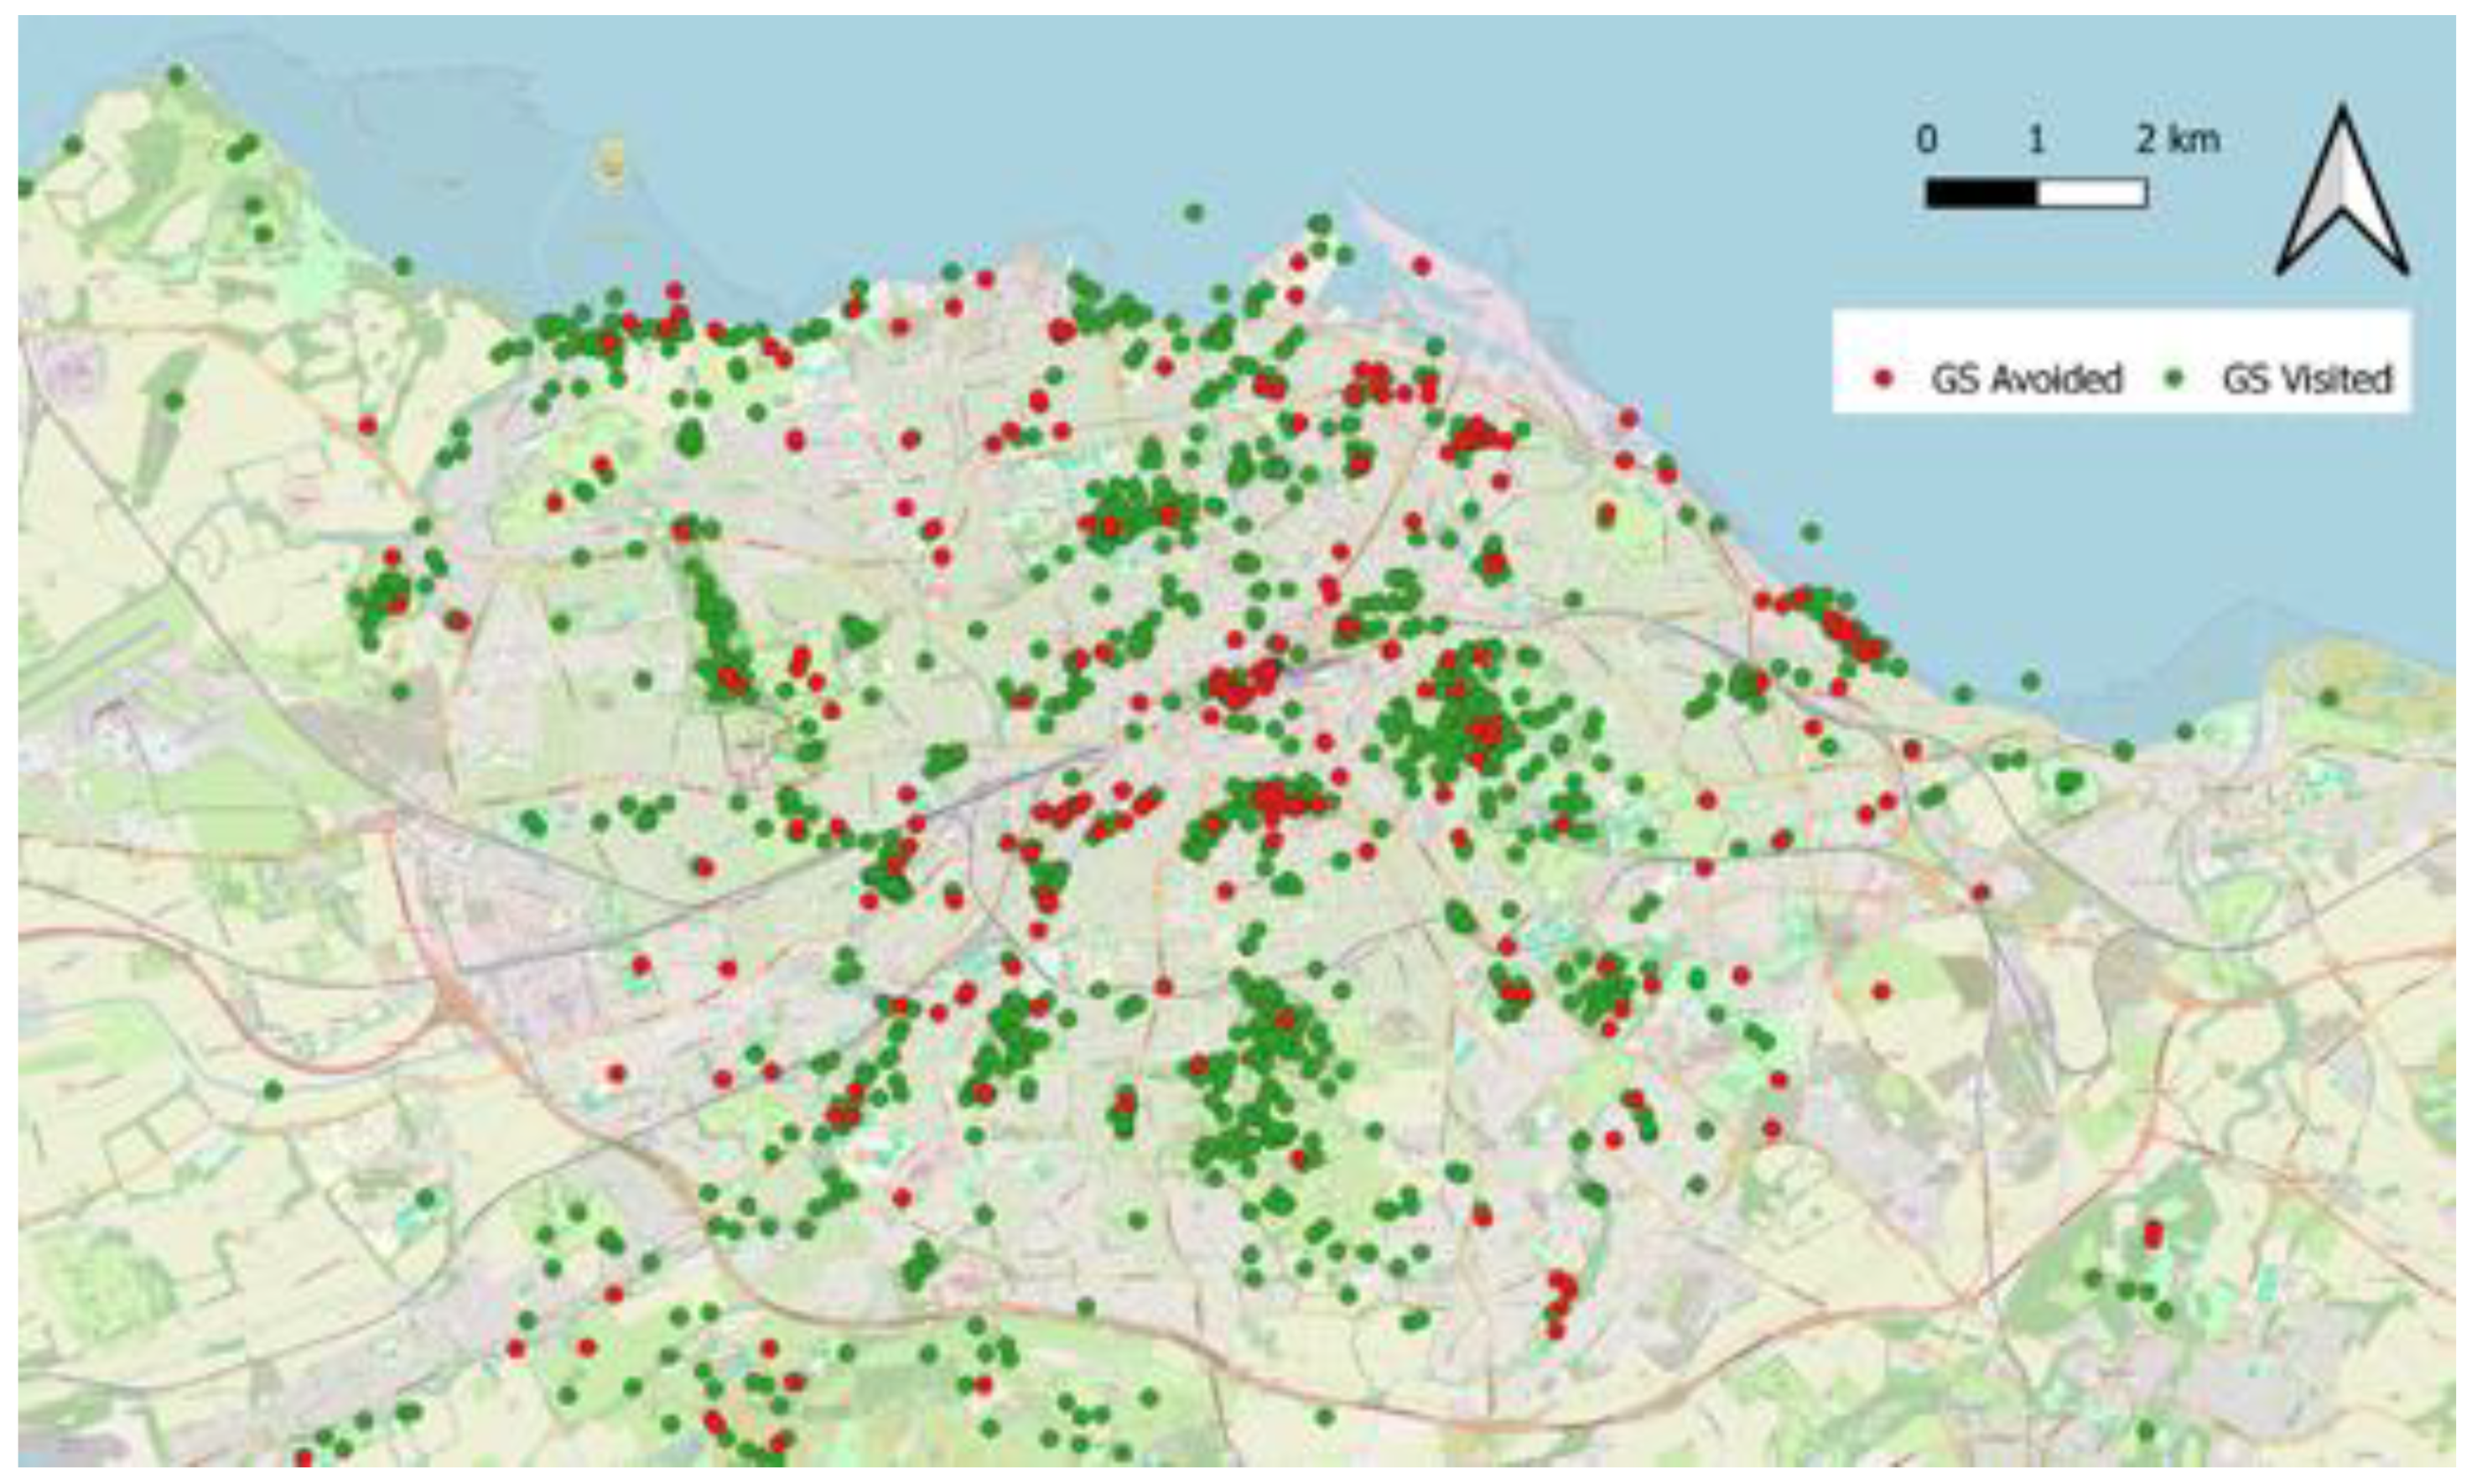
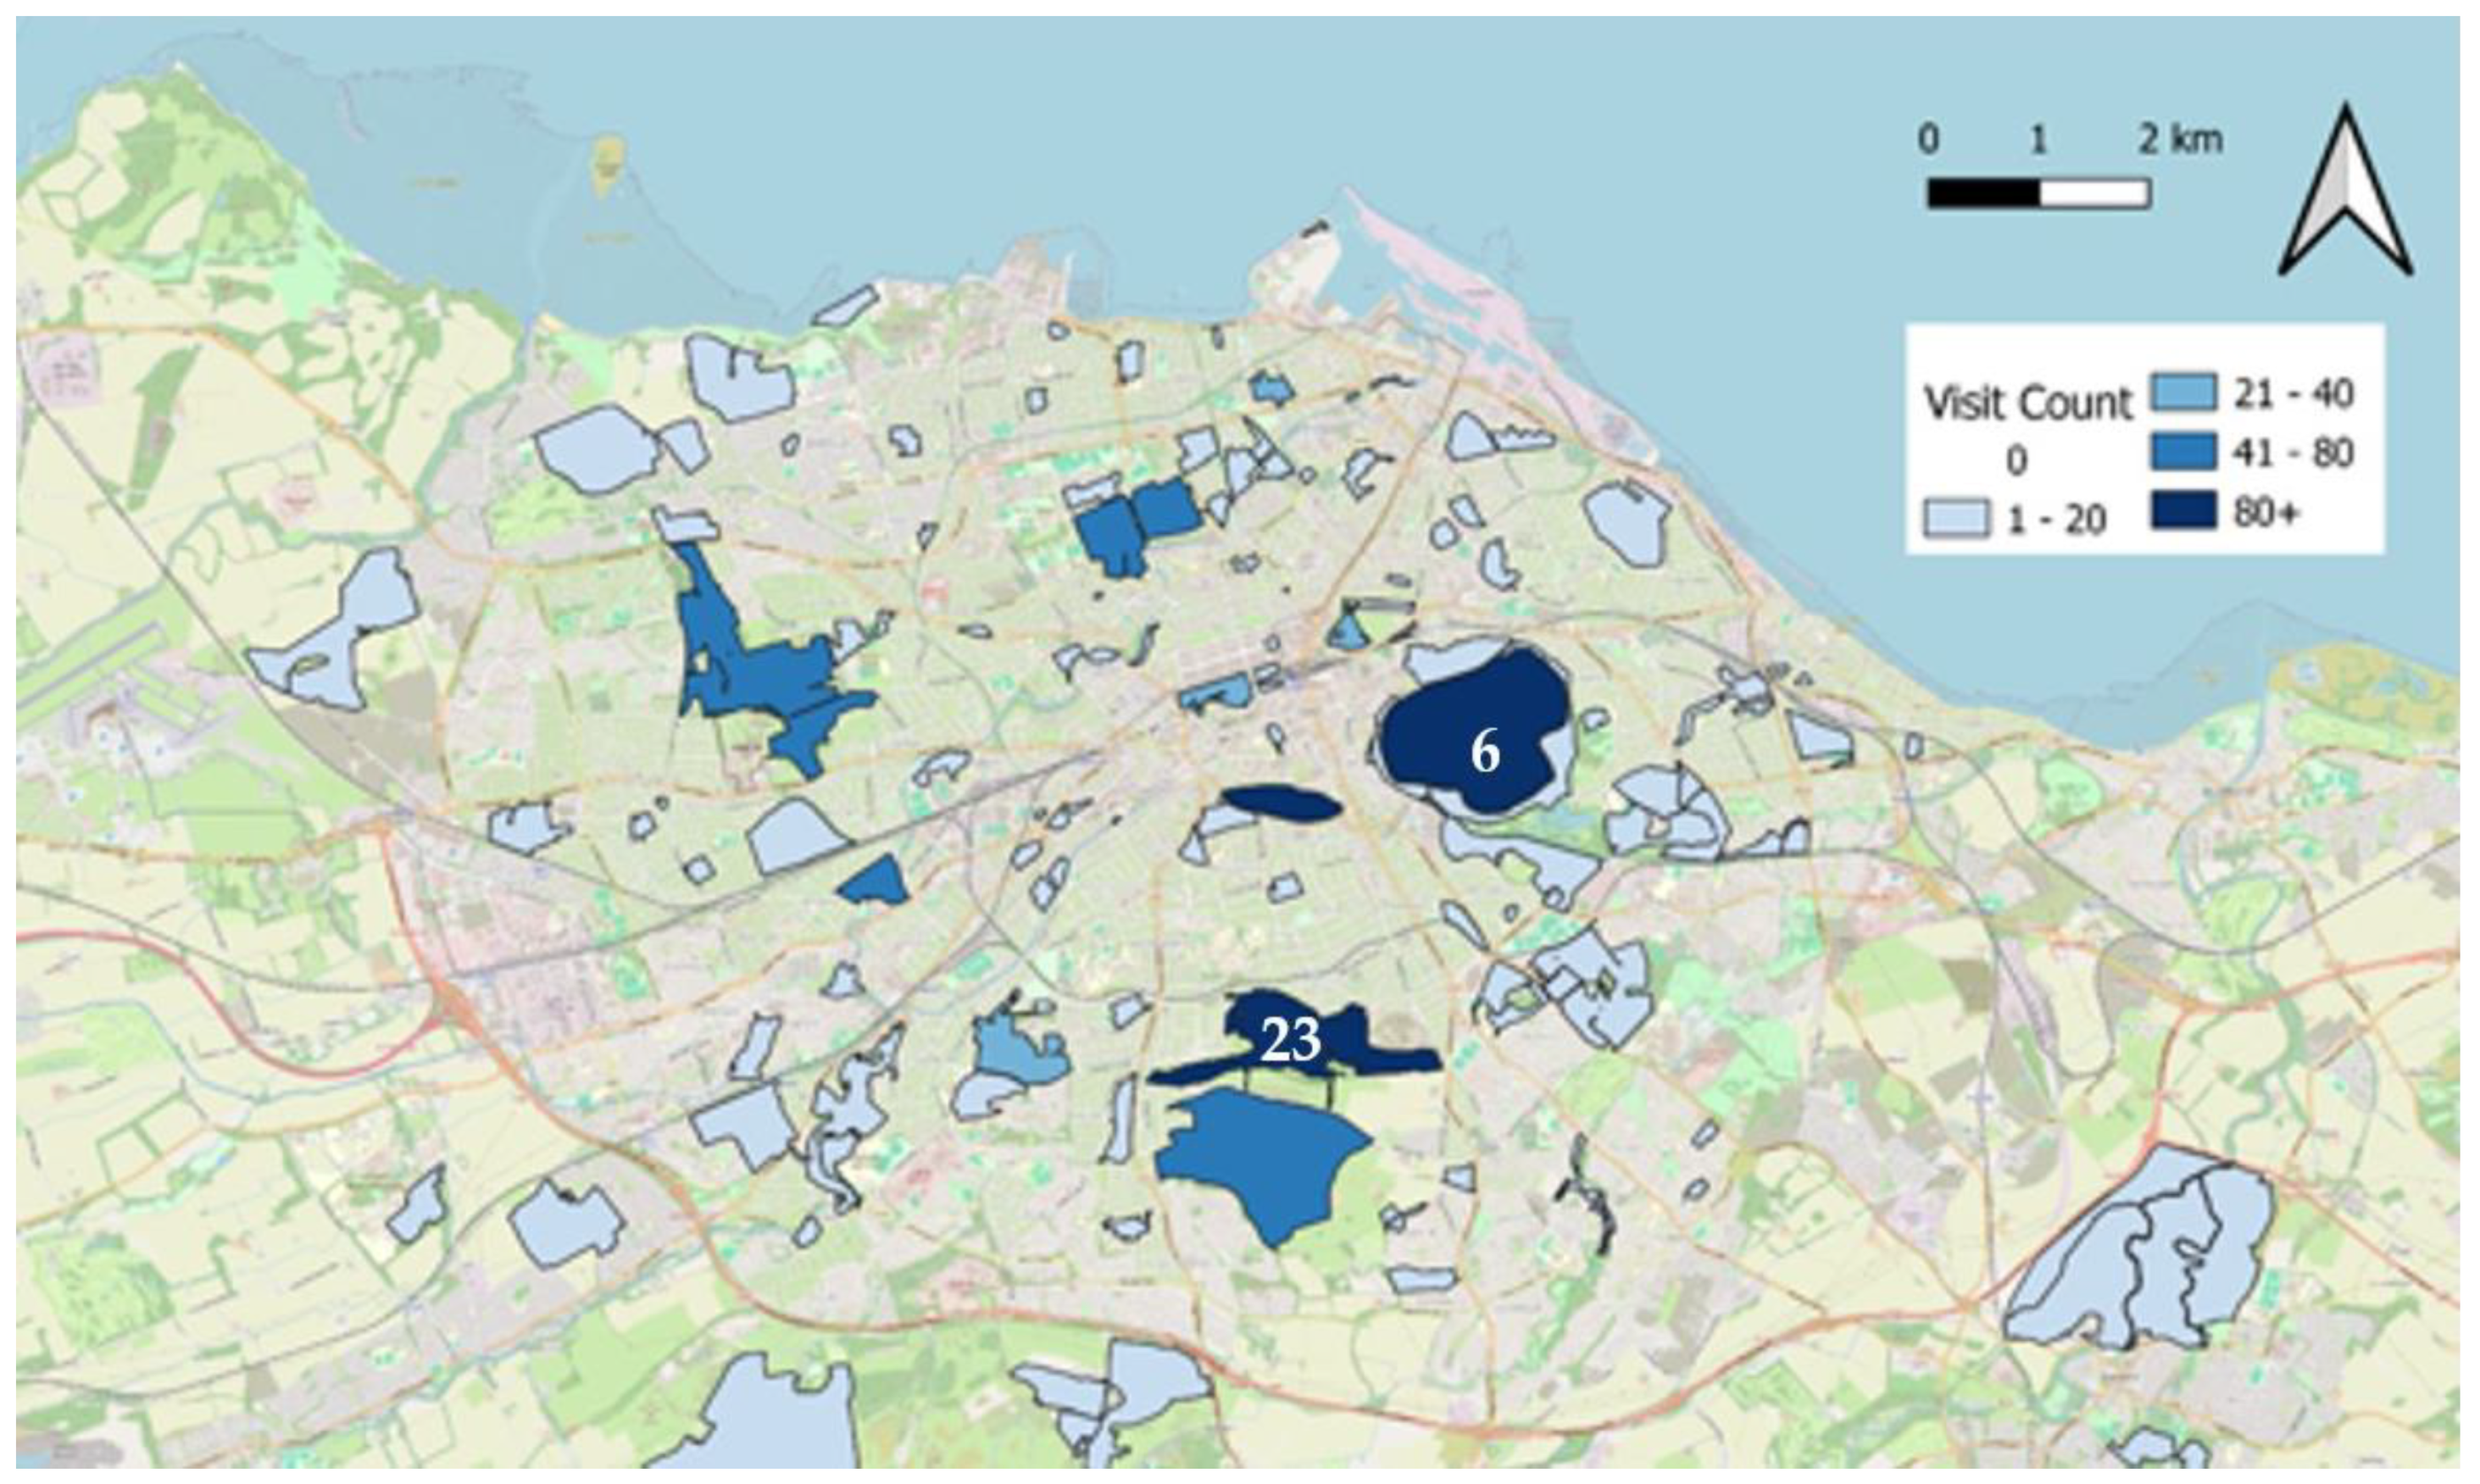
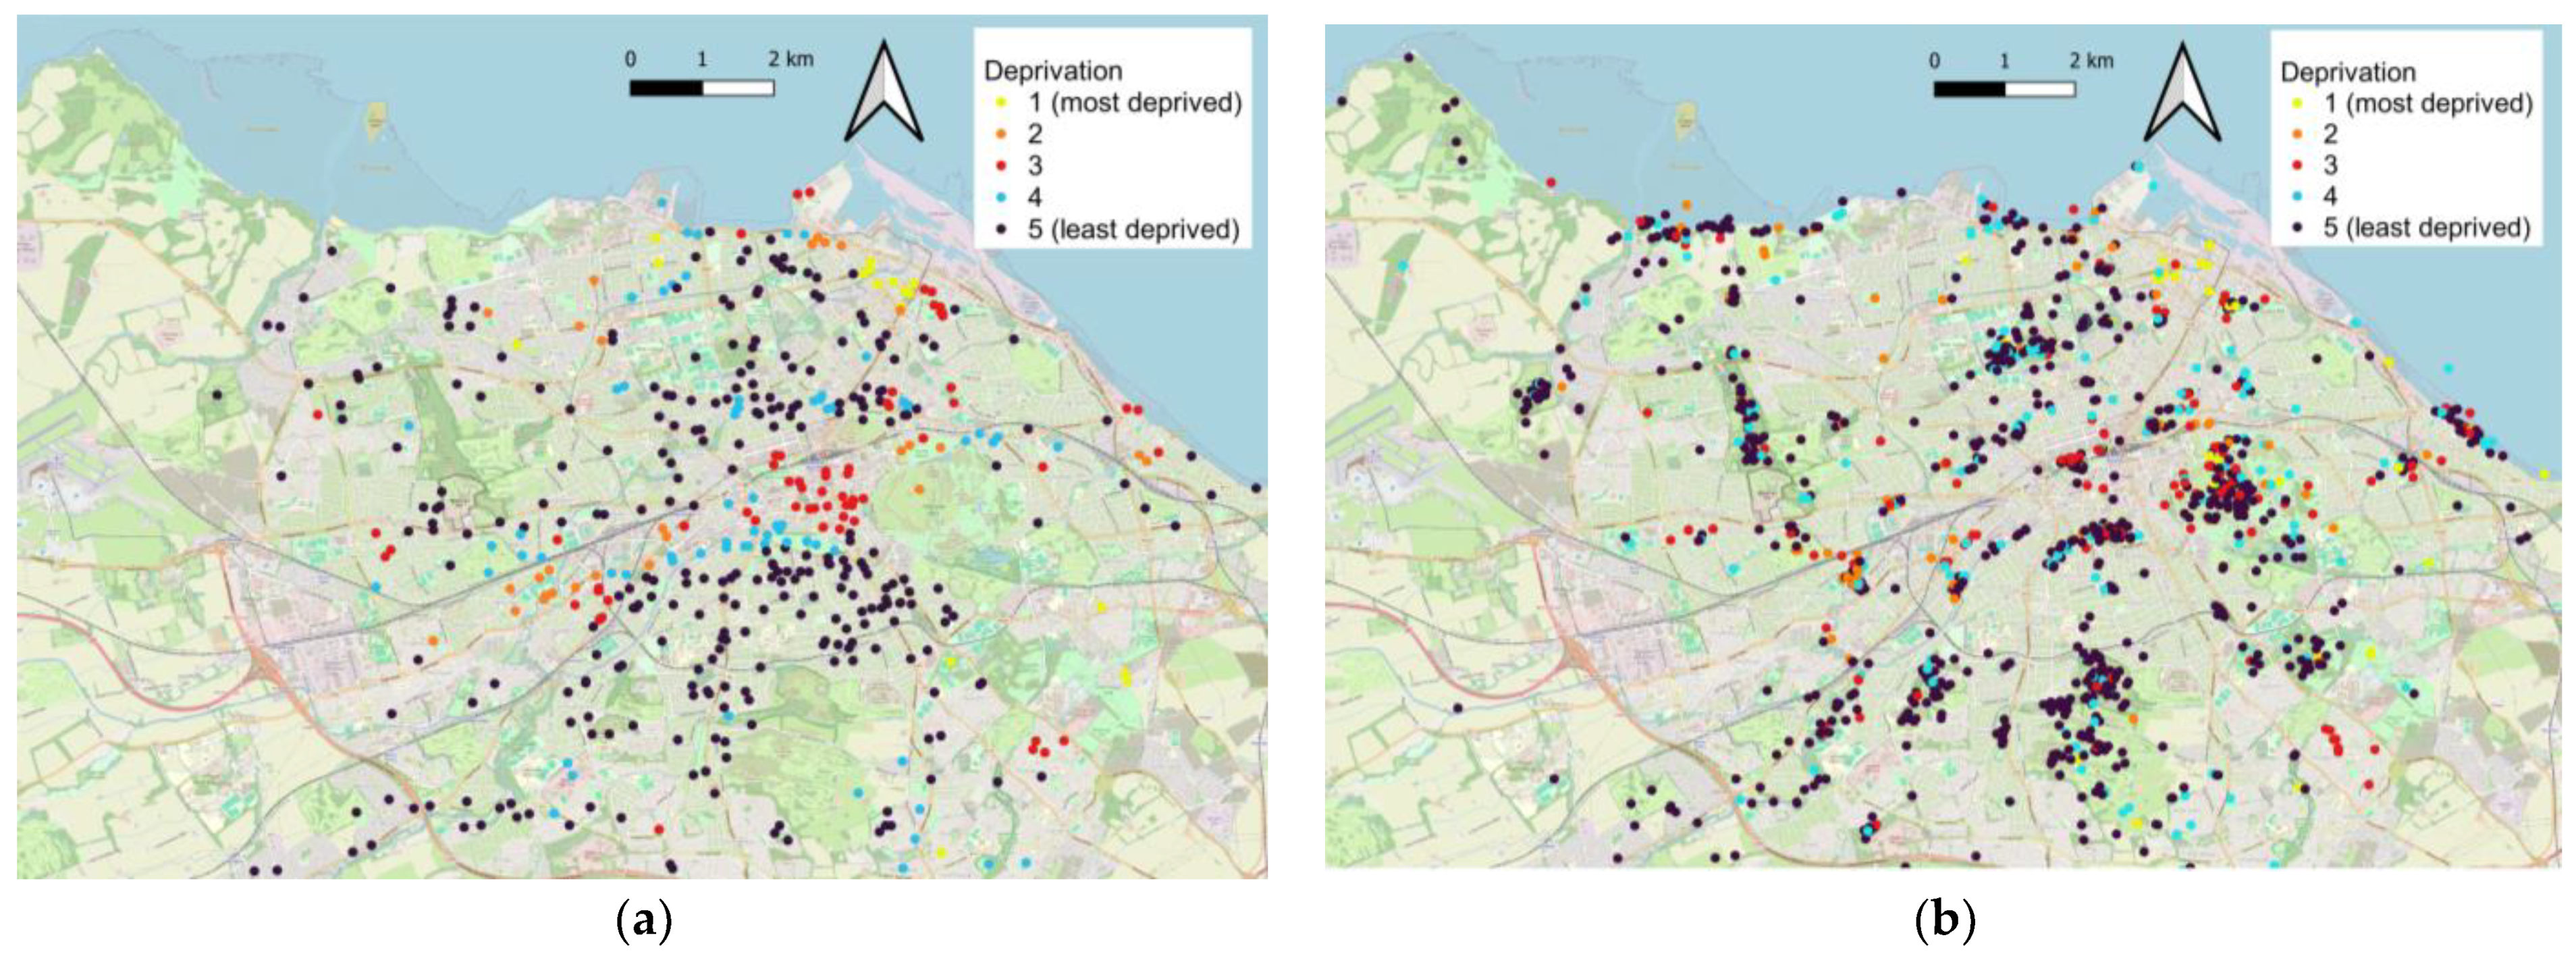
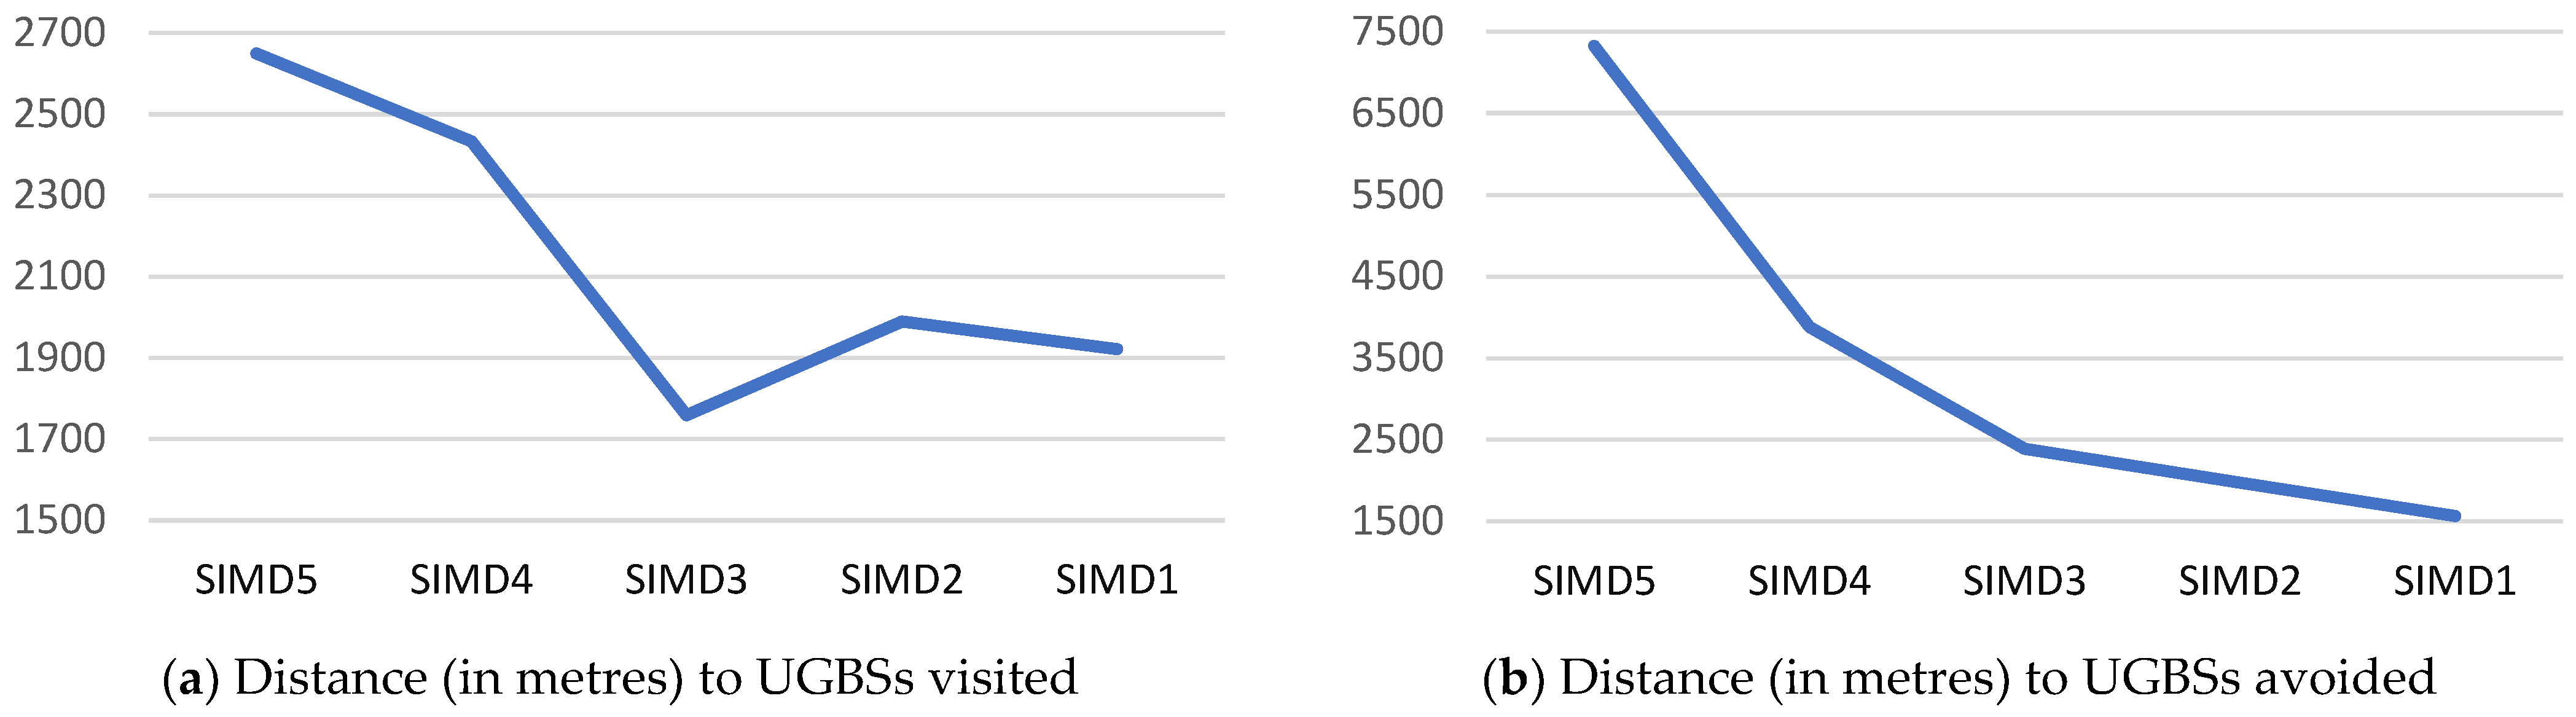
3.2. Visiting Patterns
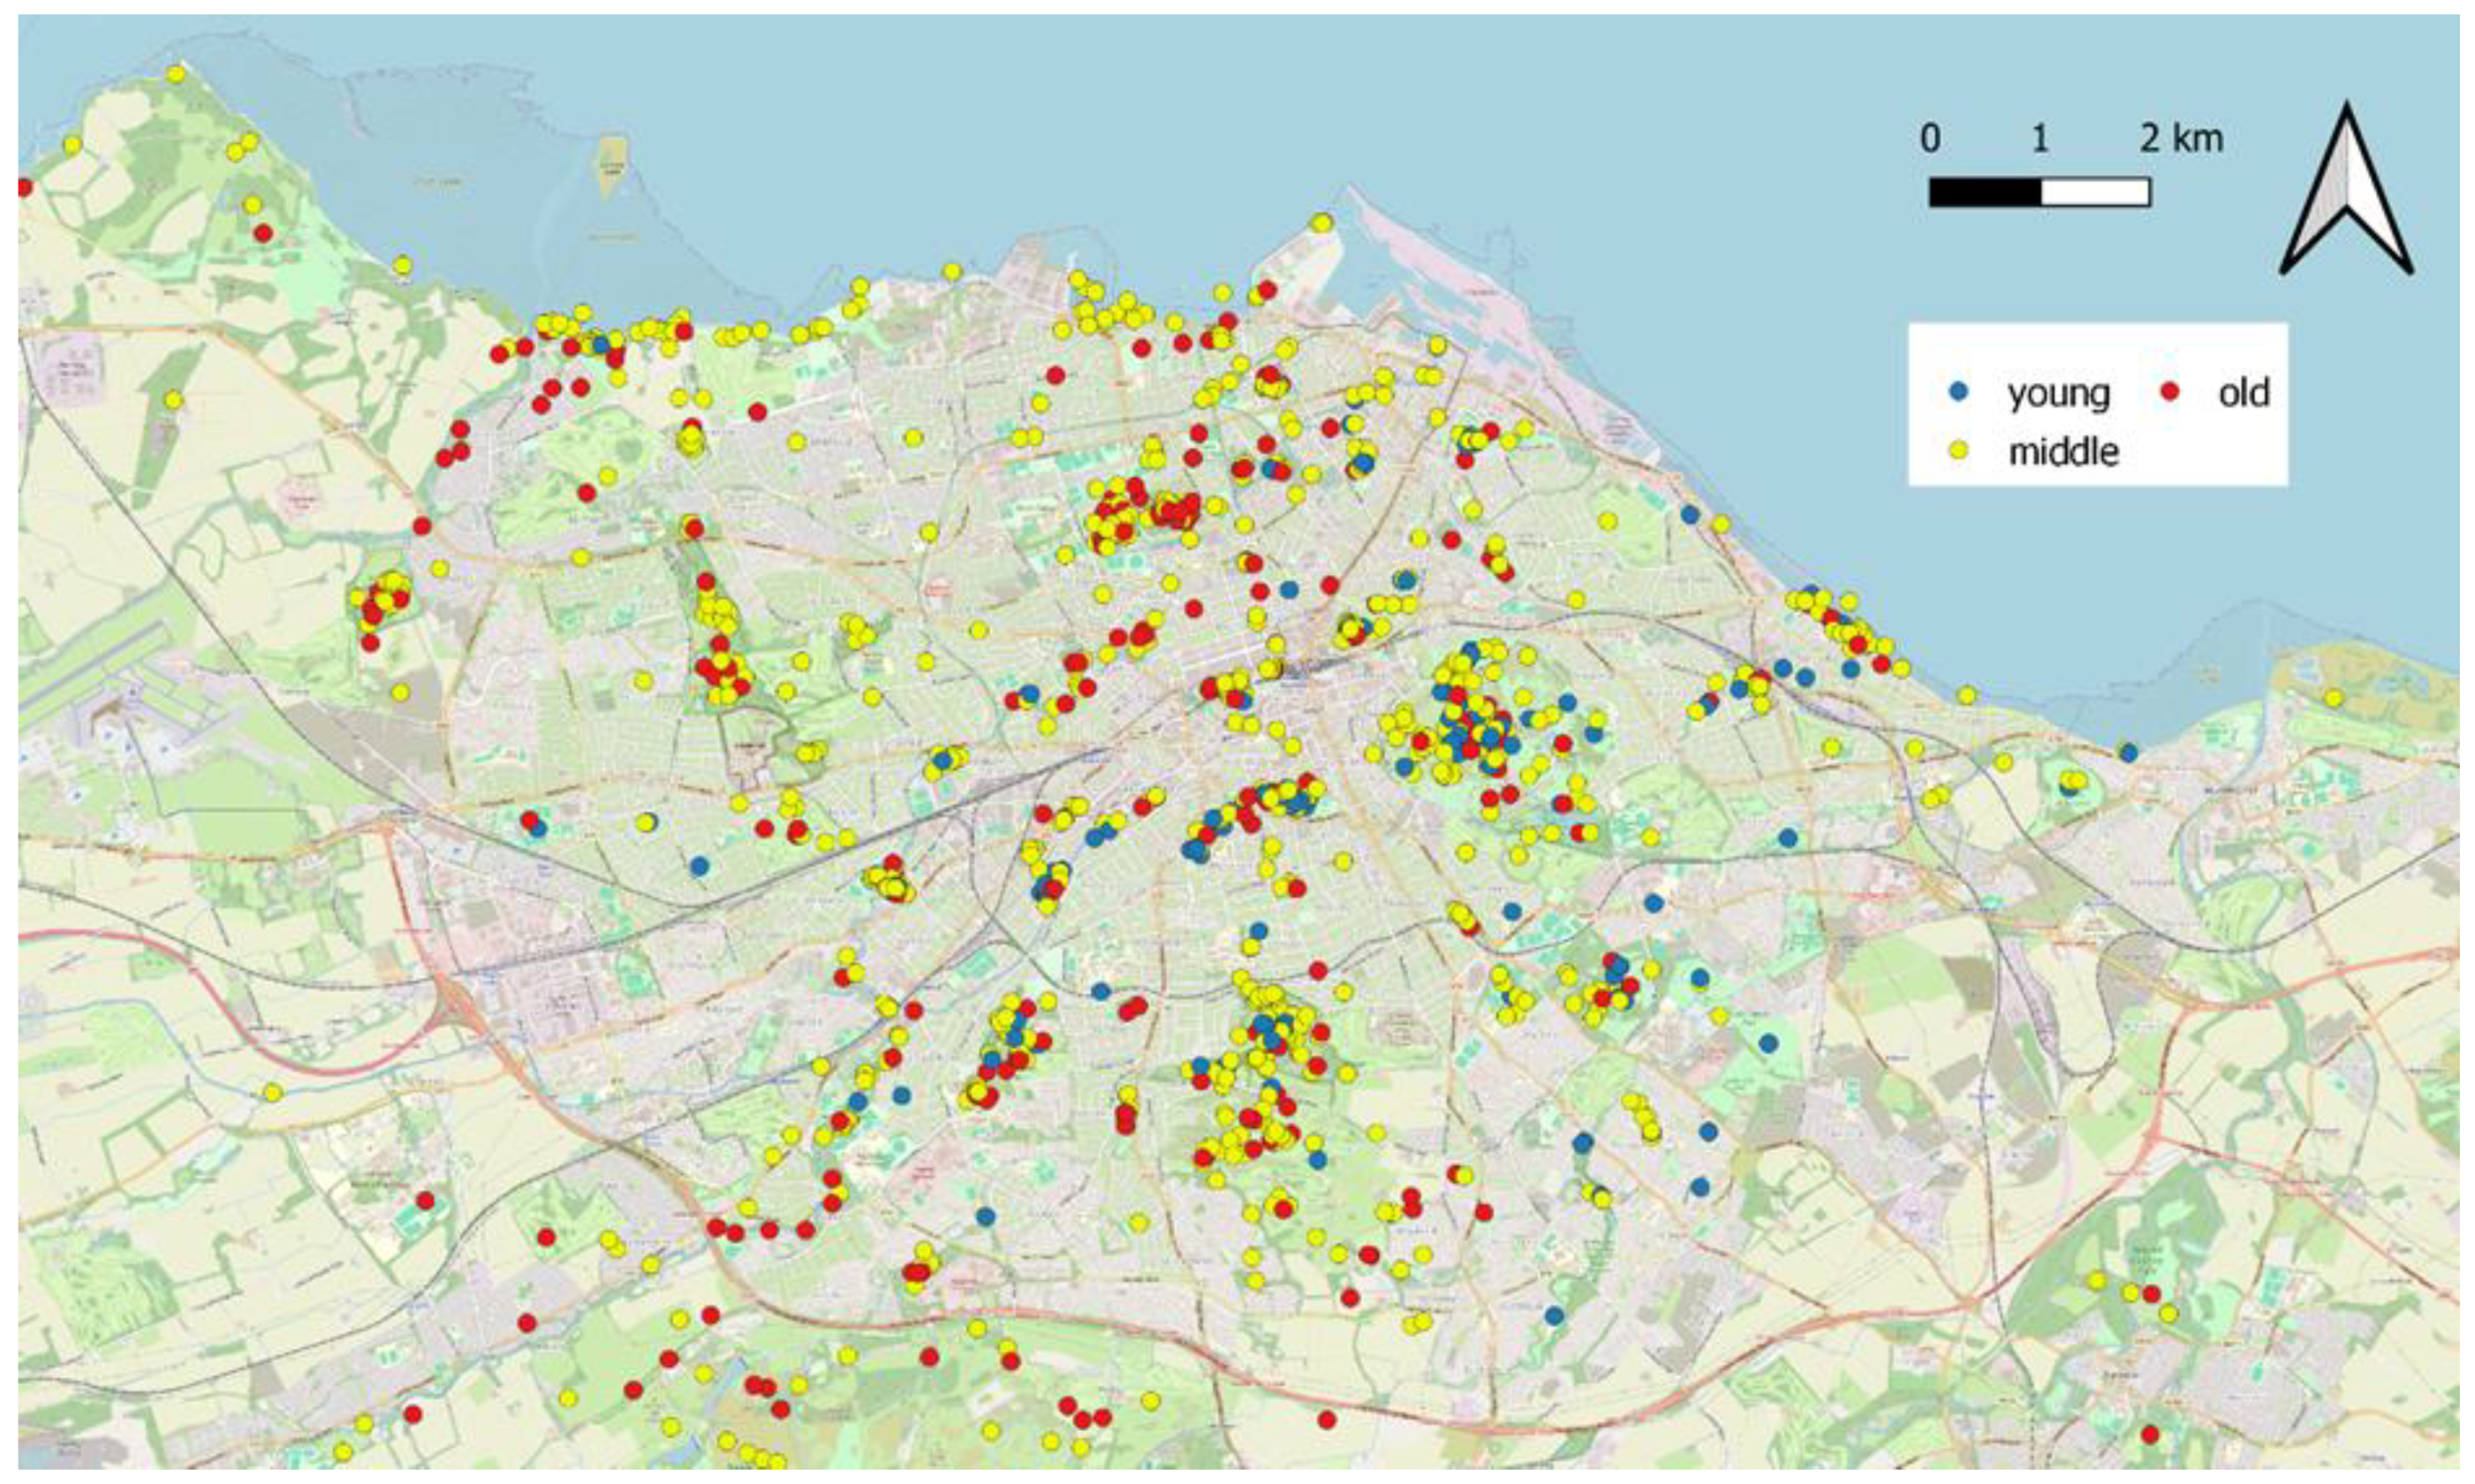
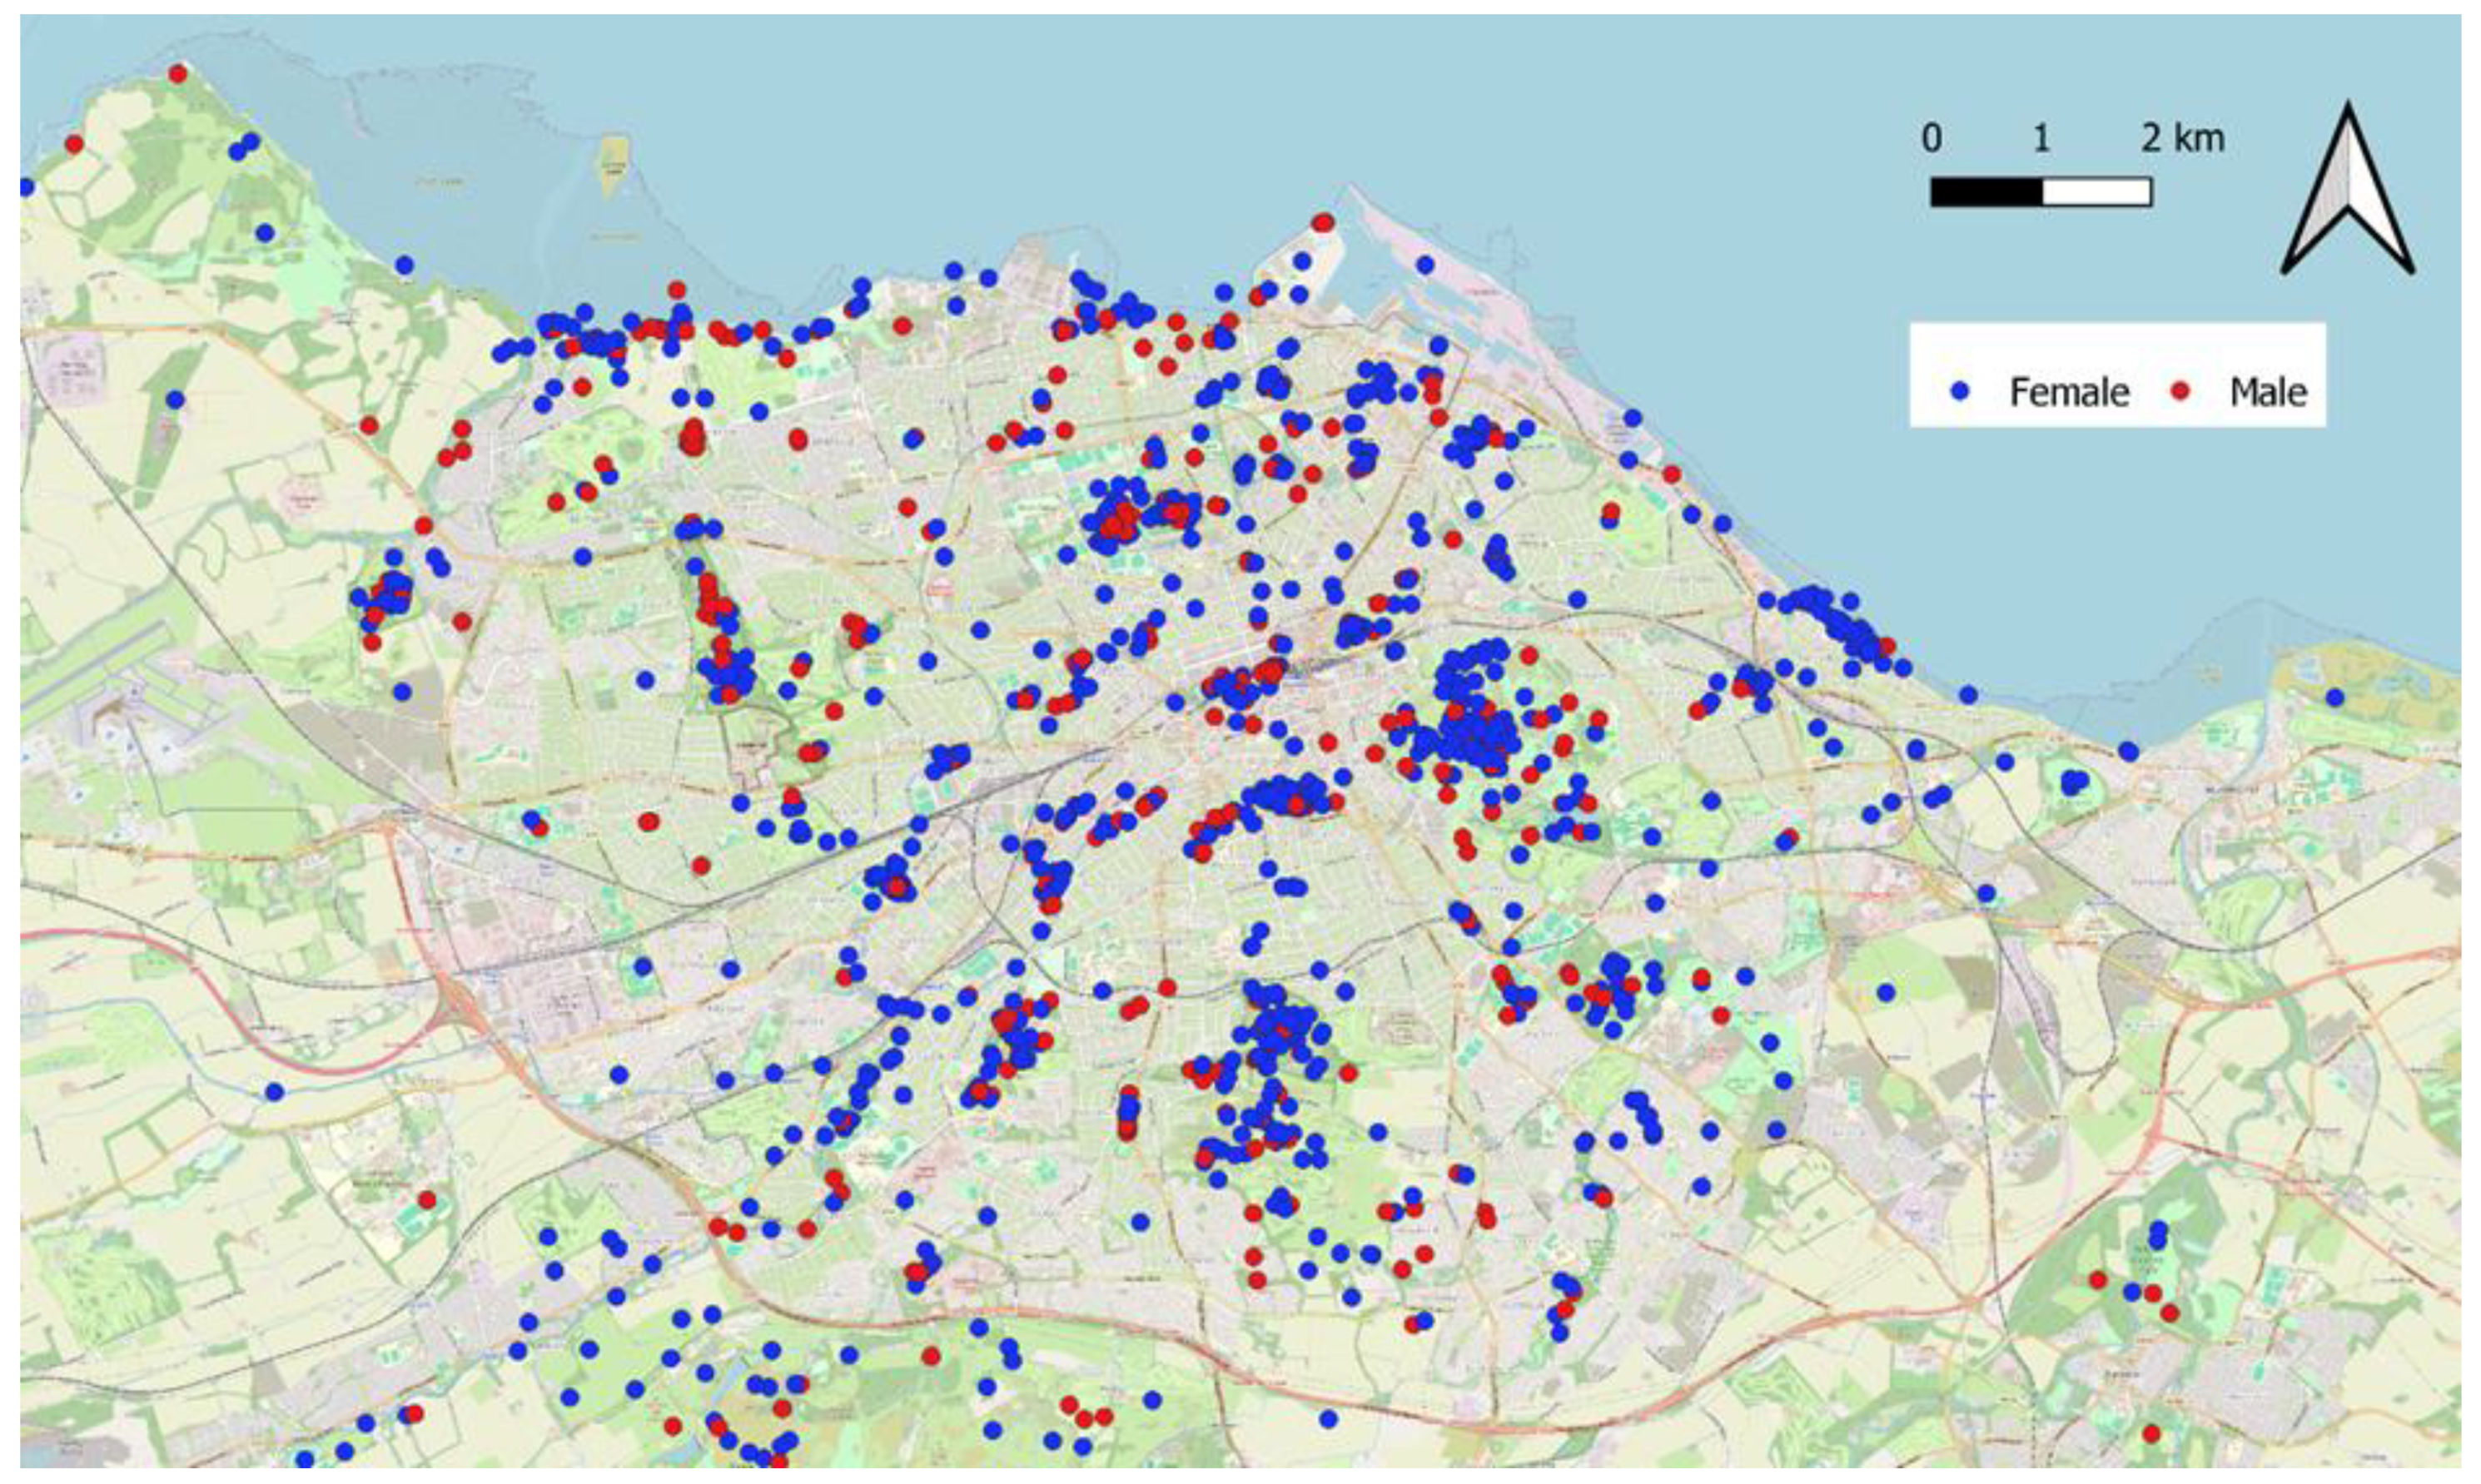
3.3. Demographic Variability
3.4. Urban Green and Blue Spaces’ Characteristics
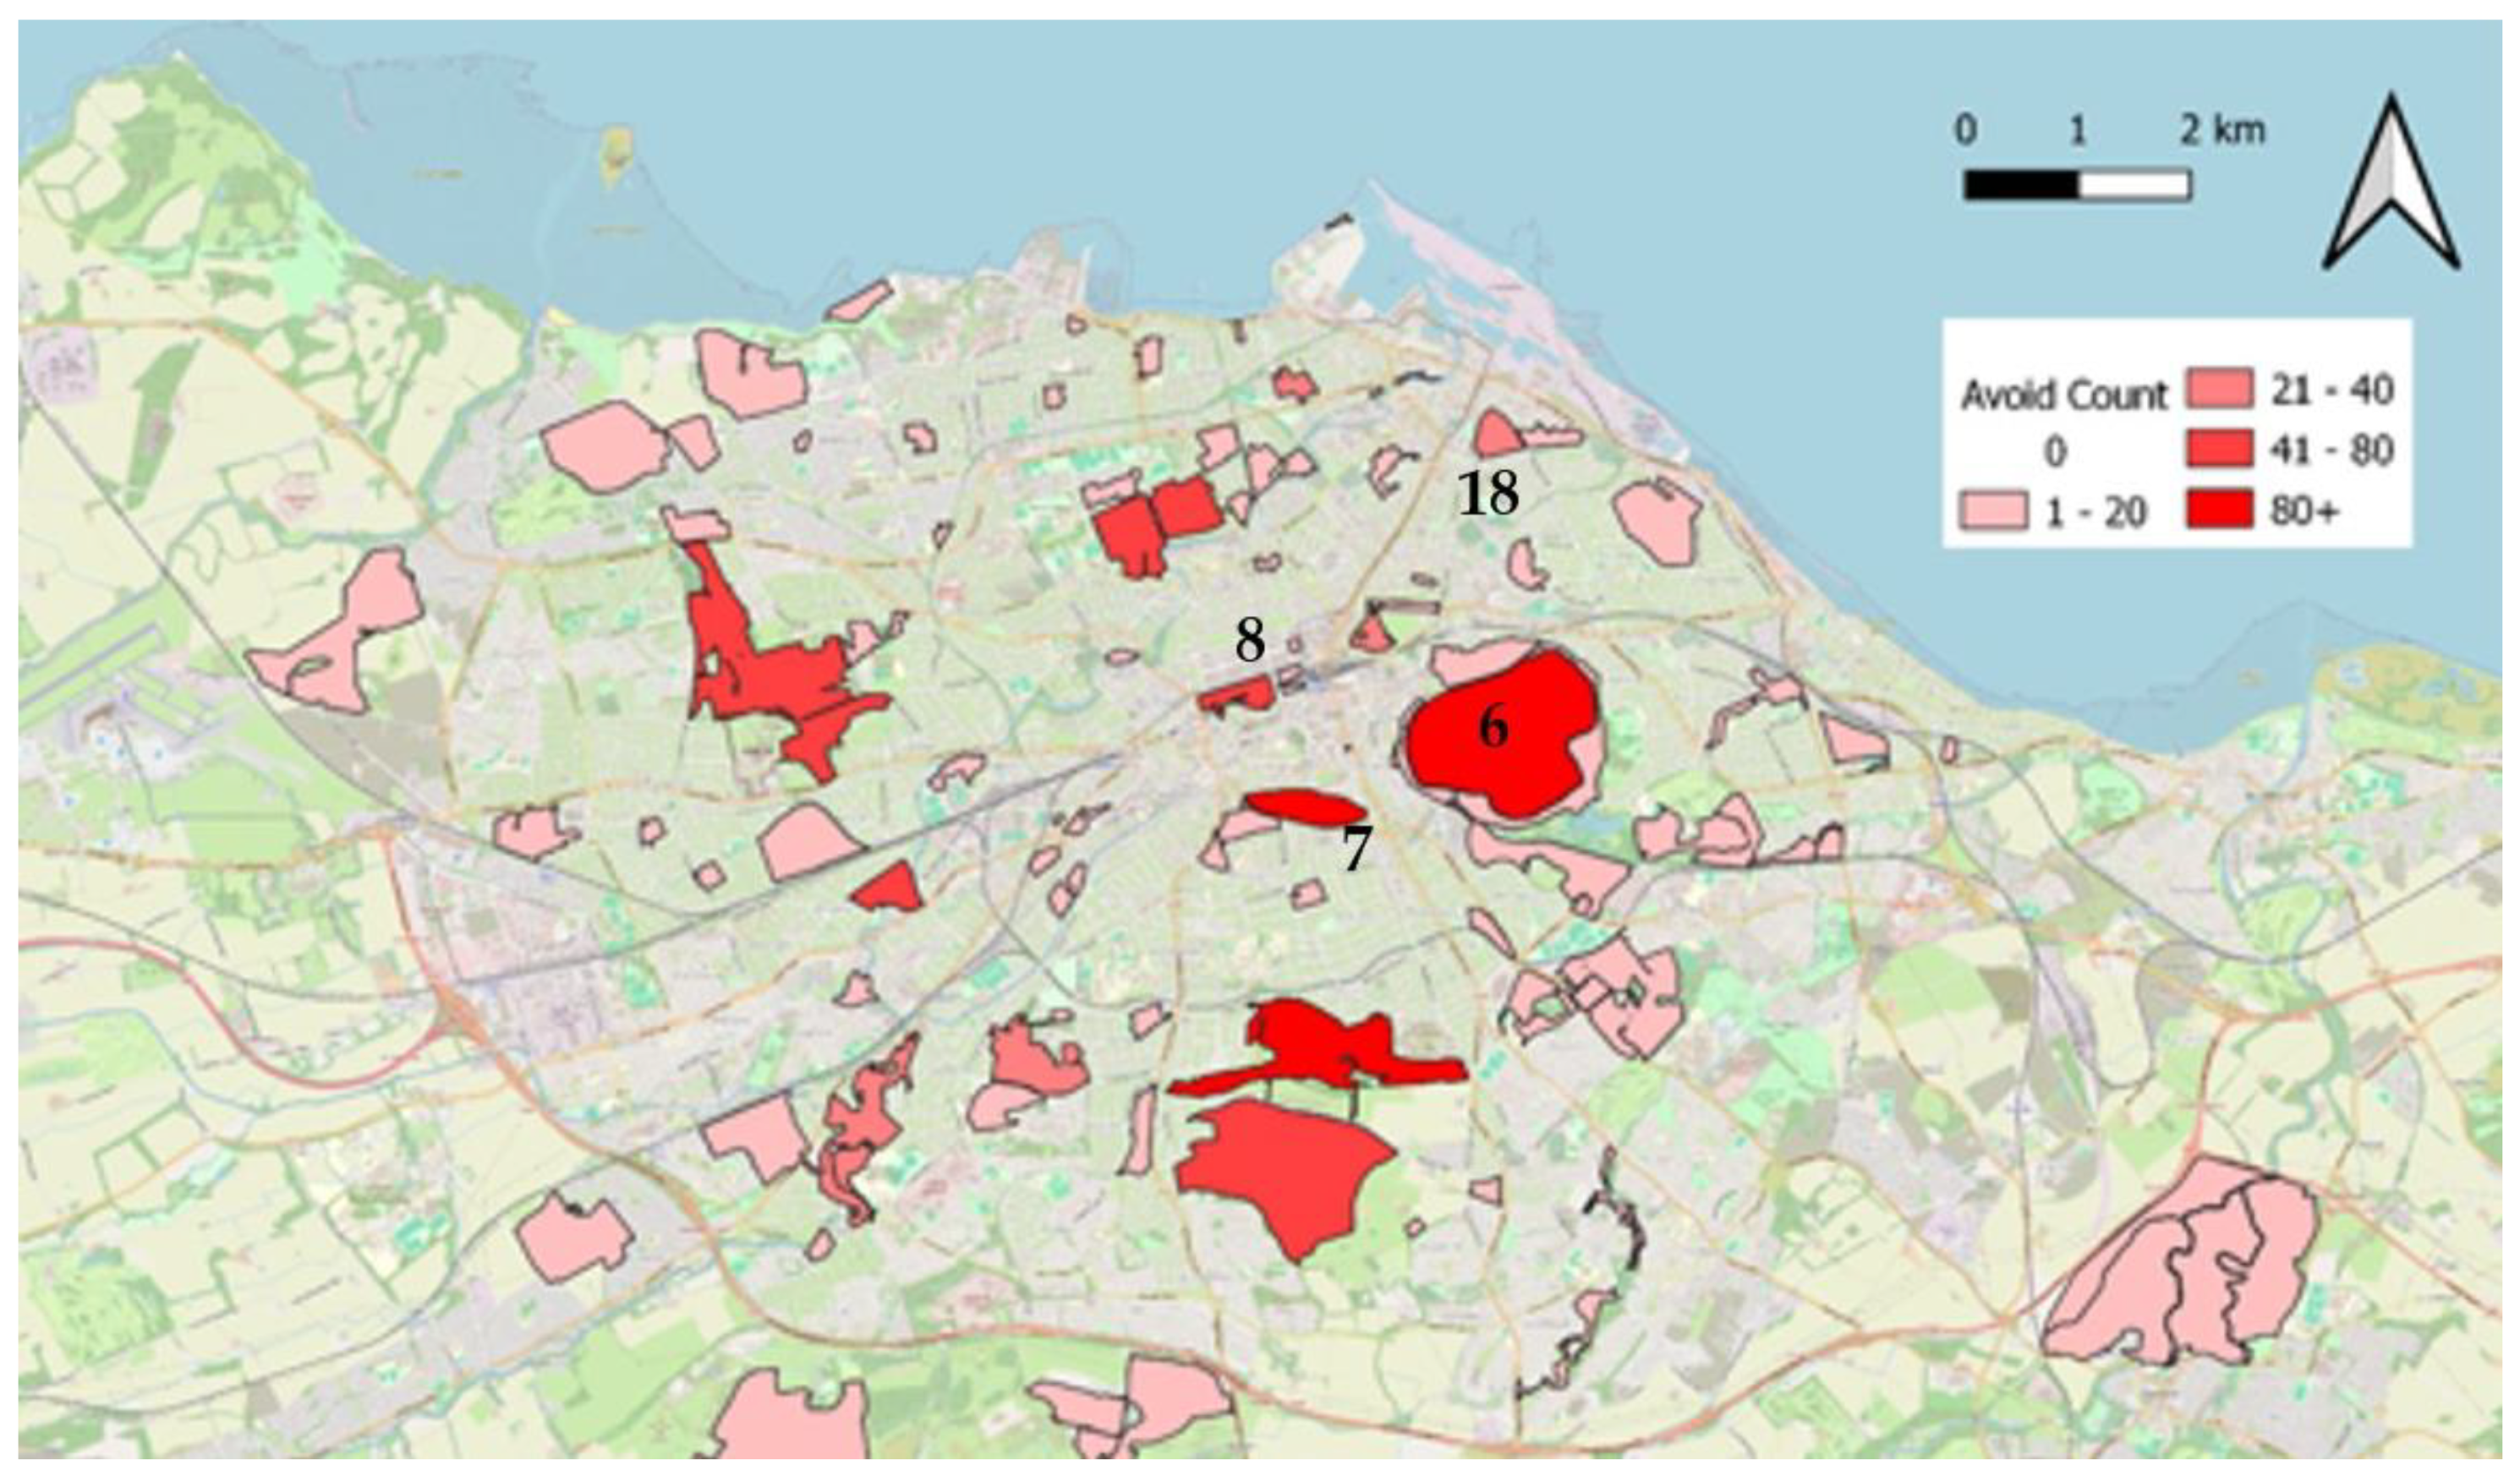
3.4.1. Barriers to Visiting Urban Green and Blue Spaces
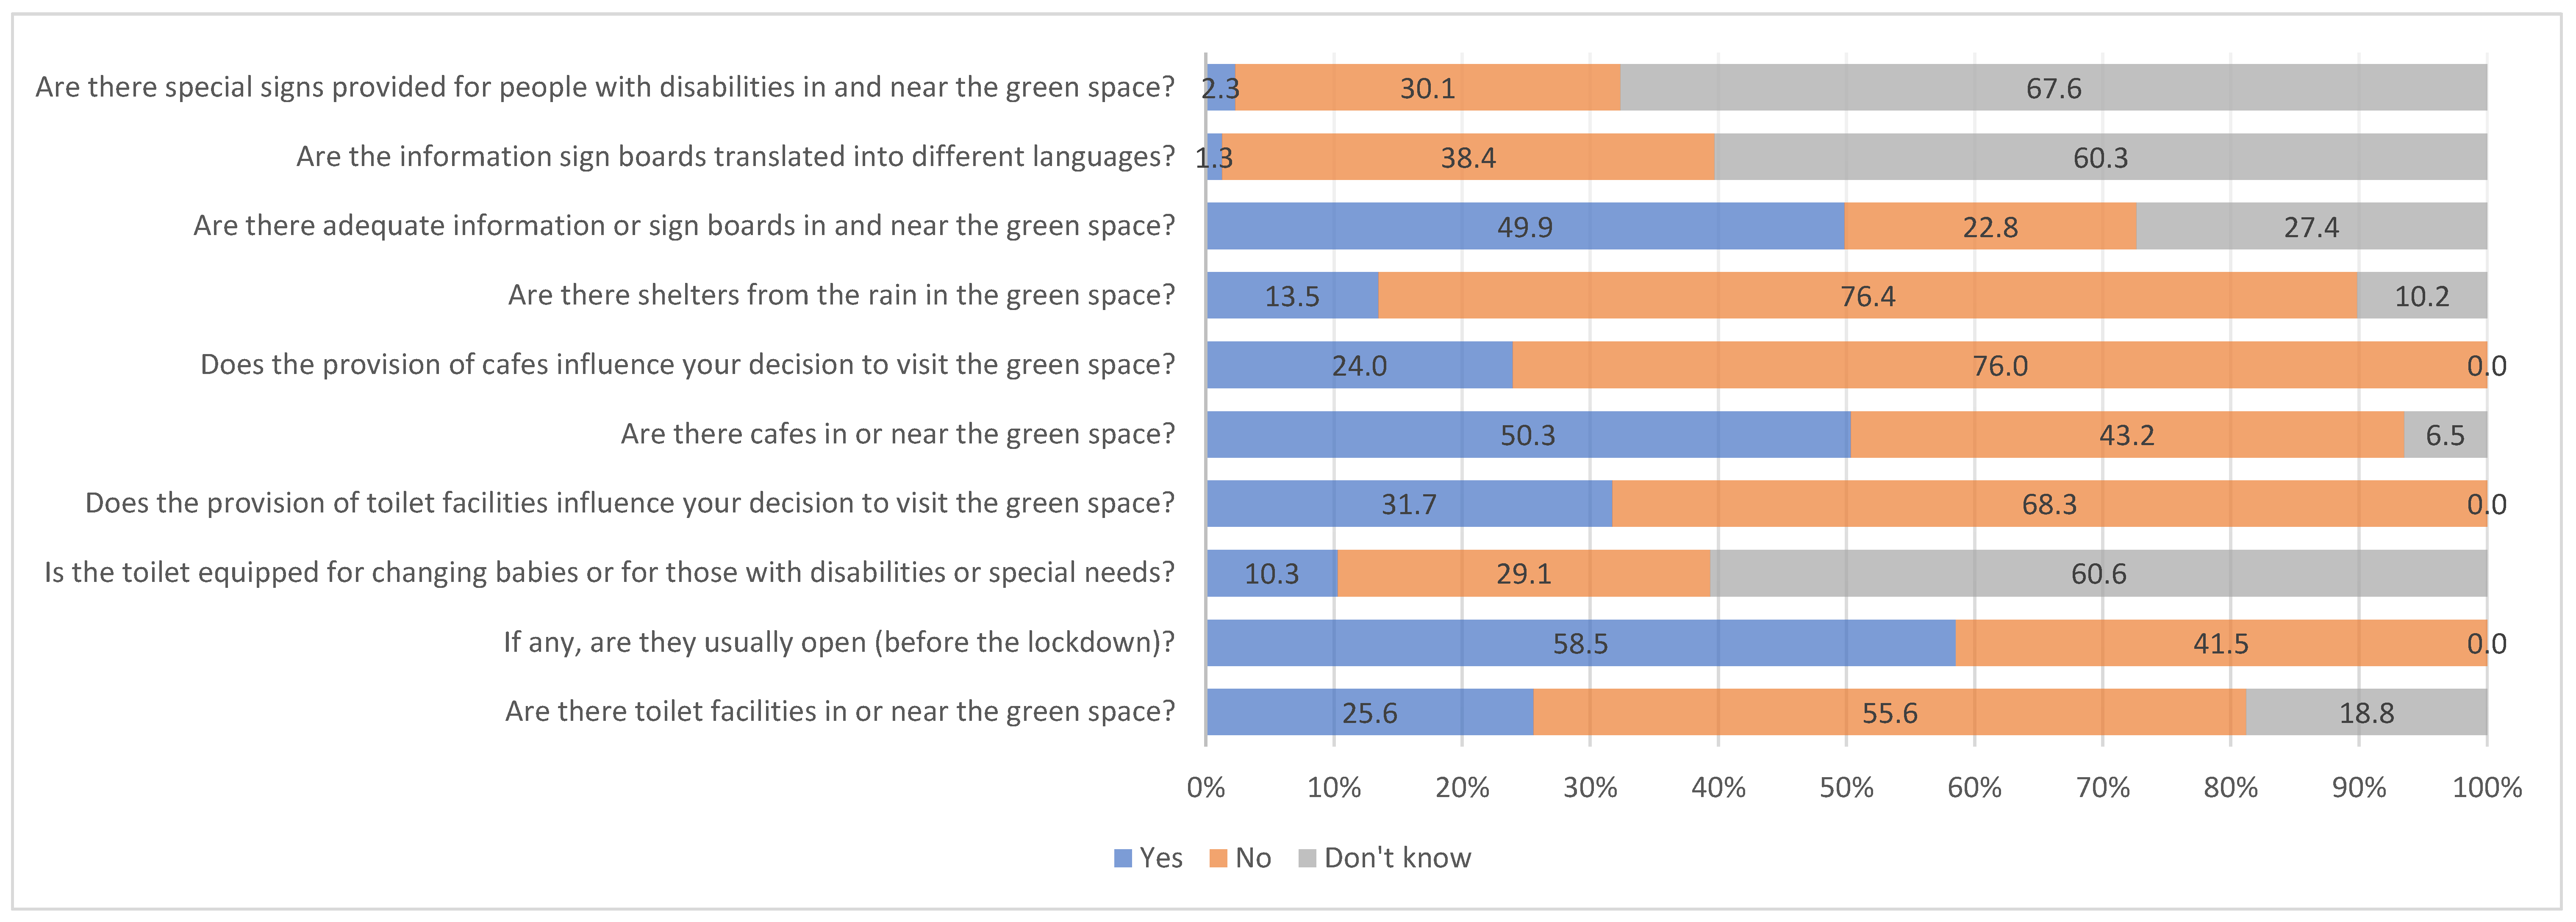
3.4.2. Facilitators for Visiting Urban Green and Blue Spaces
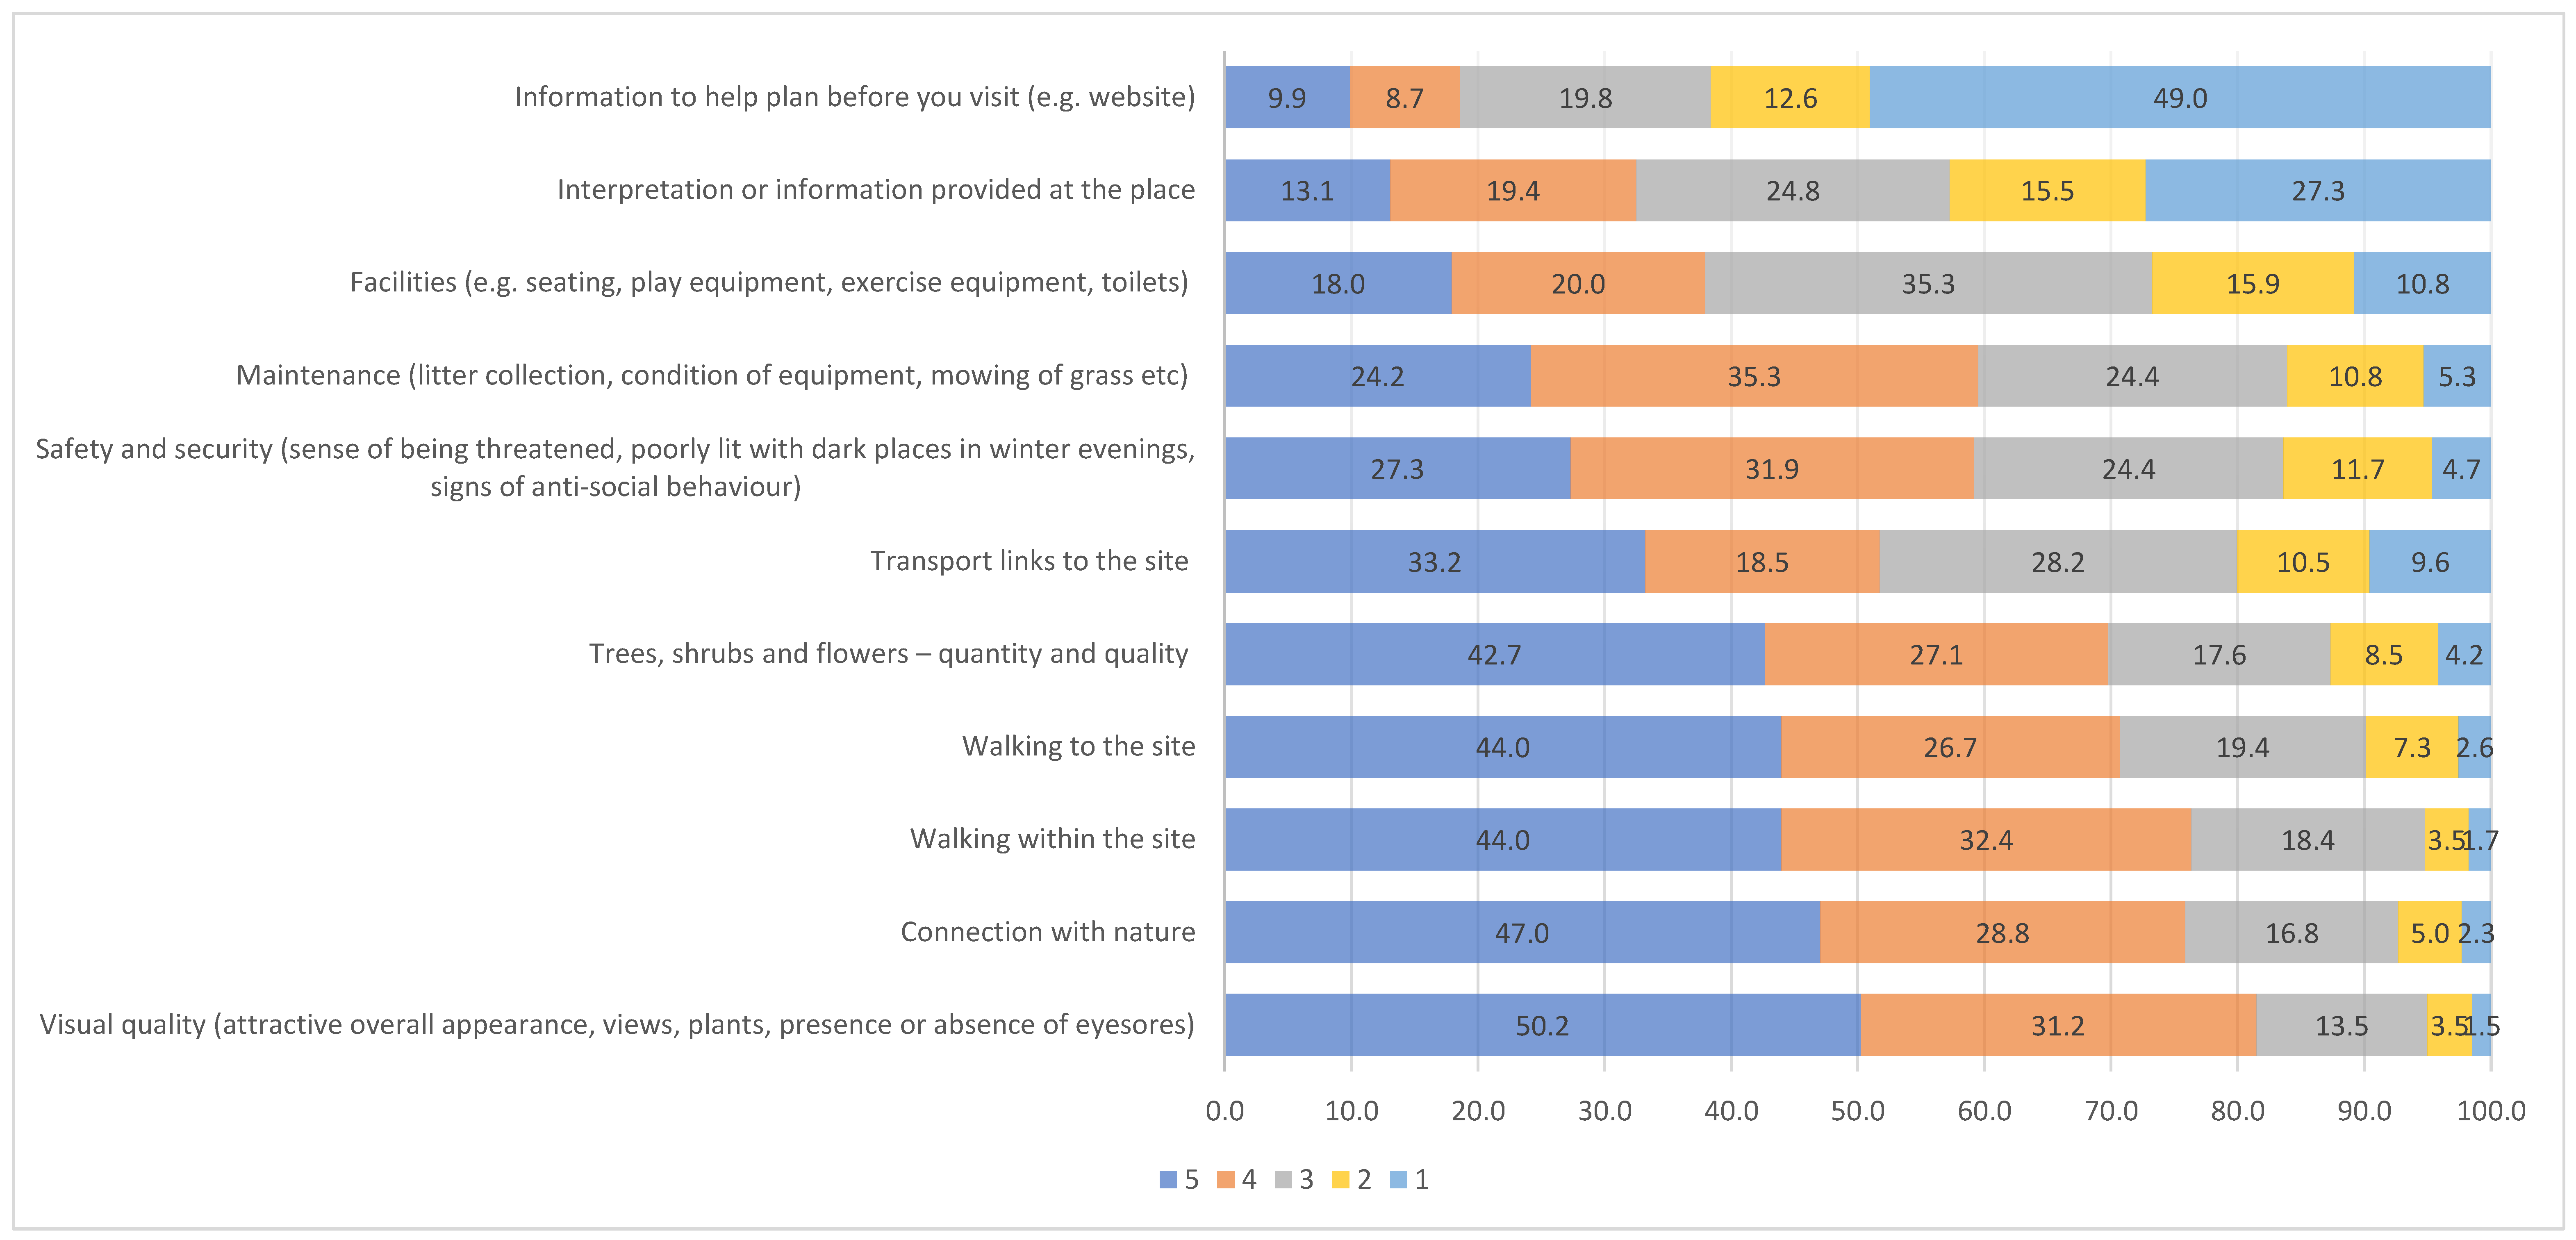
3.4.3. Urban Green and Blue Spaces Visitor Satisfaction
4. Discussion
4.1. Visitor Patterns of Urban Green and Blue Spaces Use and Demographic Variables
4.2. Urban Green and Blue Spaces Characteristics—Barriers and Facilitators
4.3. Future Vision for Urban Green and Blue Spaces
4.4. Limitations
5. Conclusions
- Who visits UGBSs in the city, which UGBSs do they visit and/or avoid, how do they get there, and what activities do they engage in?
- Are the UGBSs visited and/or avoided distinguishable by demographics?
- What are the characteristics of UGBSs that attracts people and that people dislike?
5.1. Visitor Profiles and Patterns
5.2. Demographic Influences
5.3. Perceived Barriers and Facilitators
Author Contributions
Funding
Data Availability Statement
Acknowledgments
Conflicts of Interest
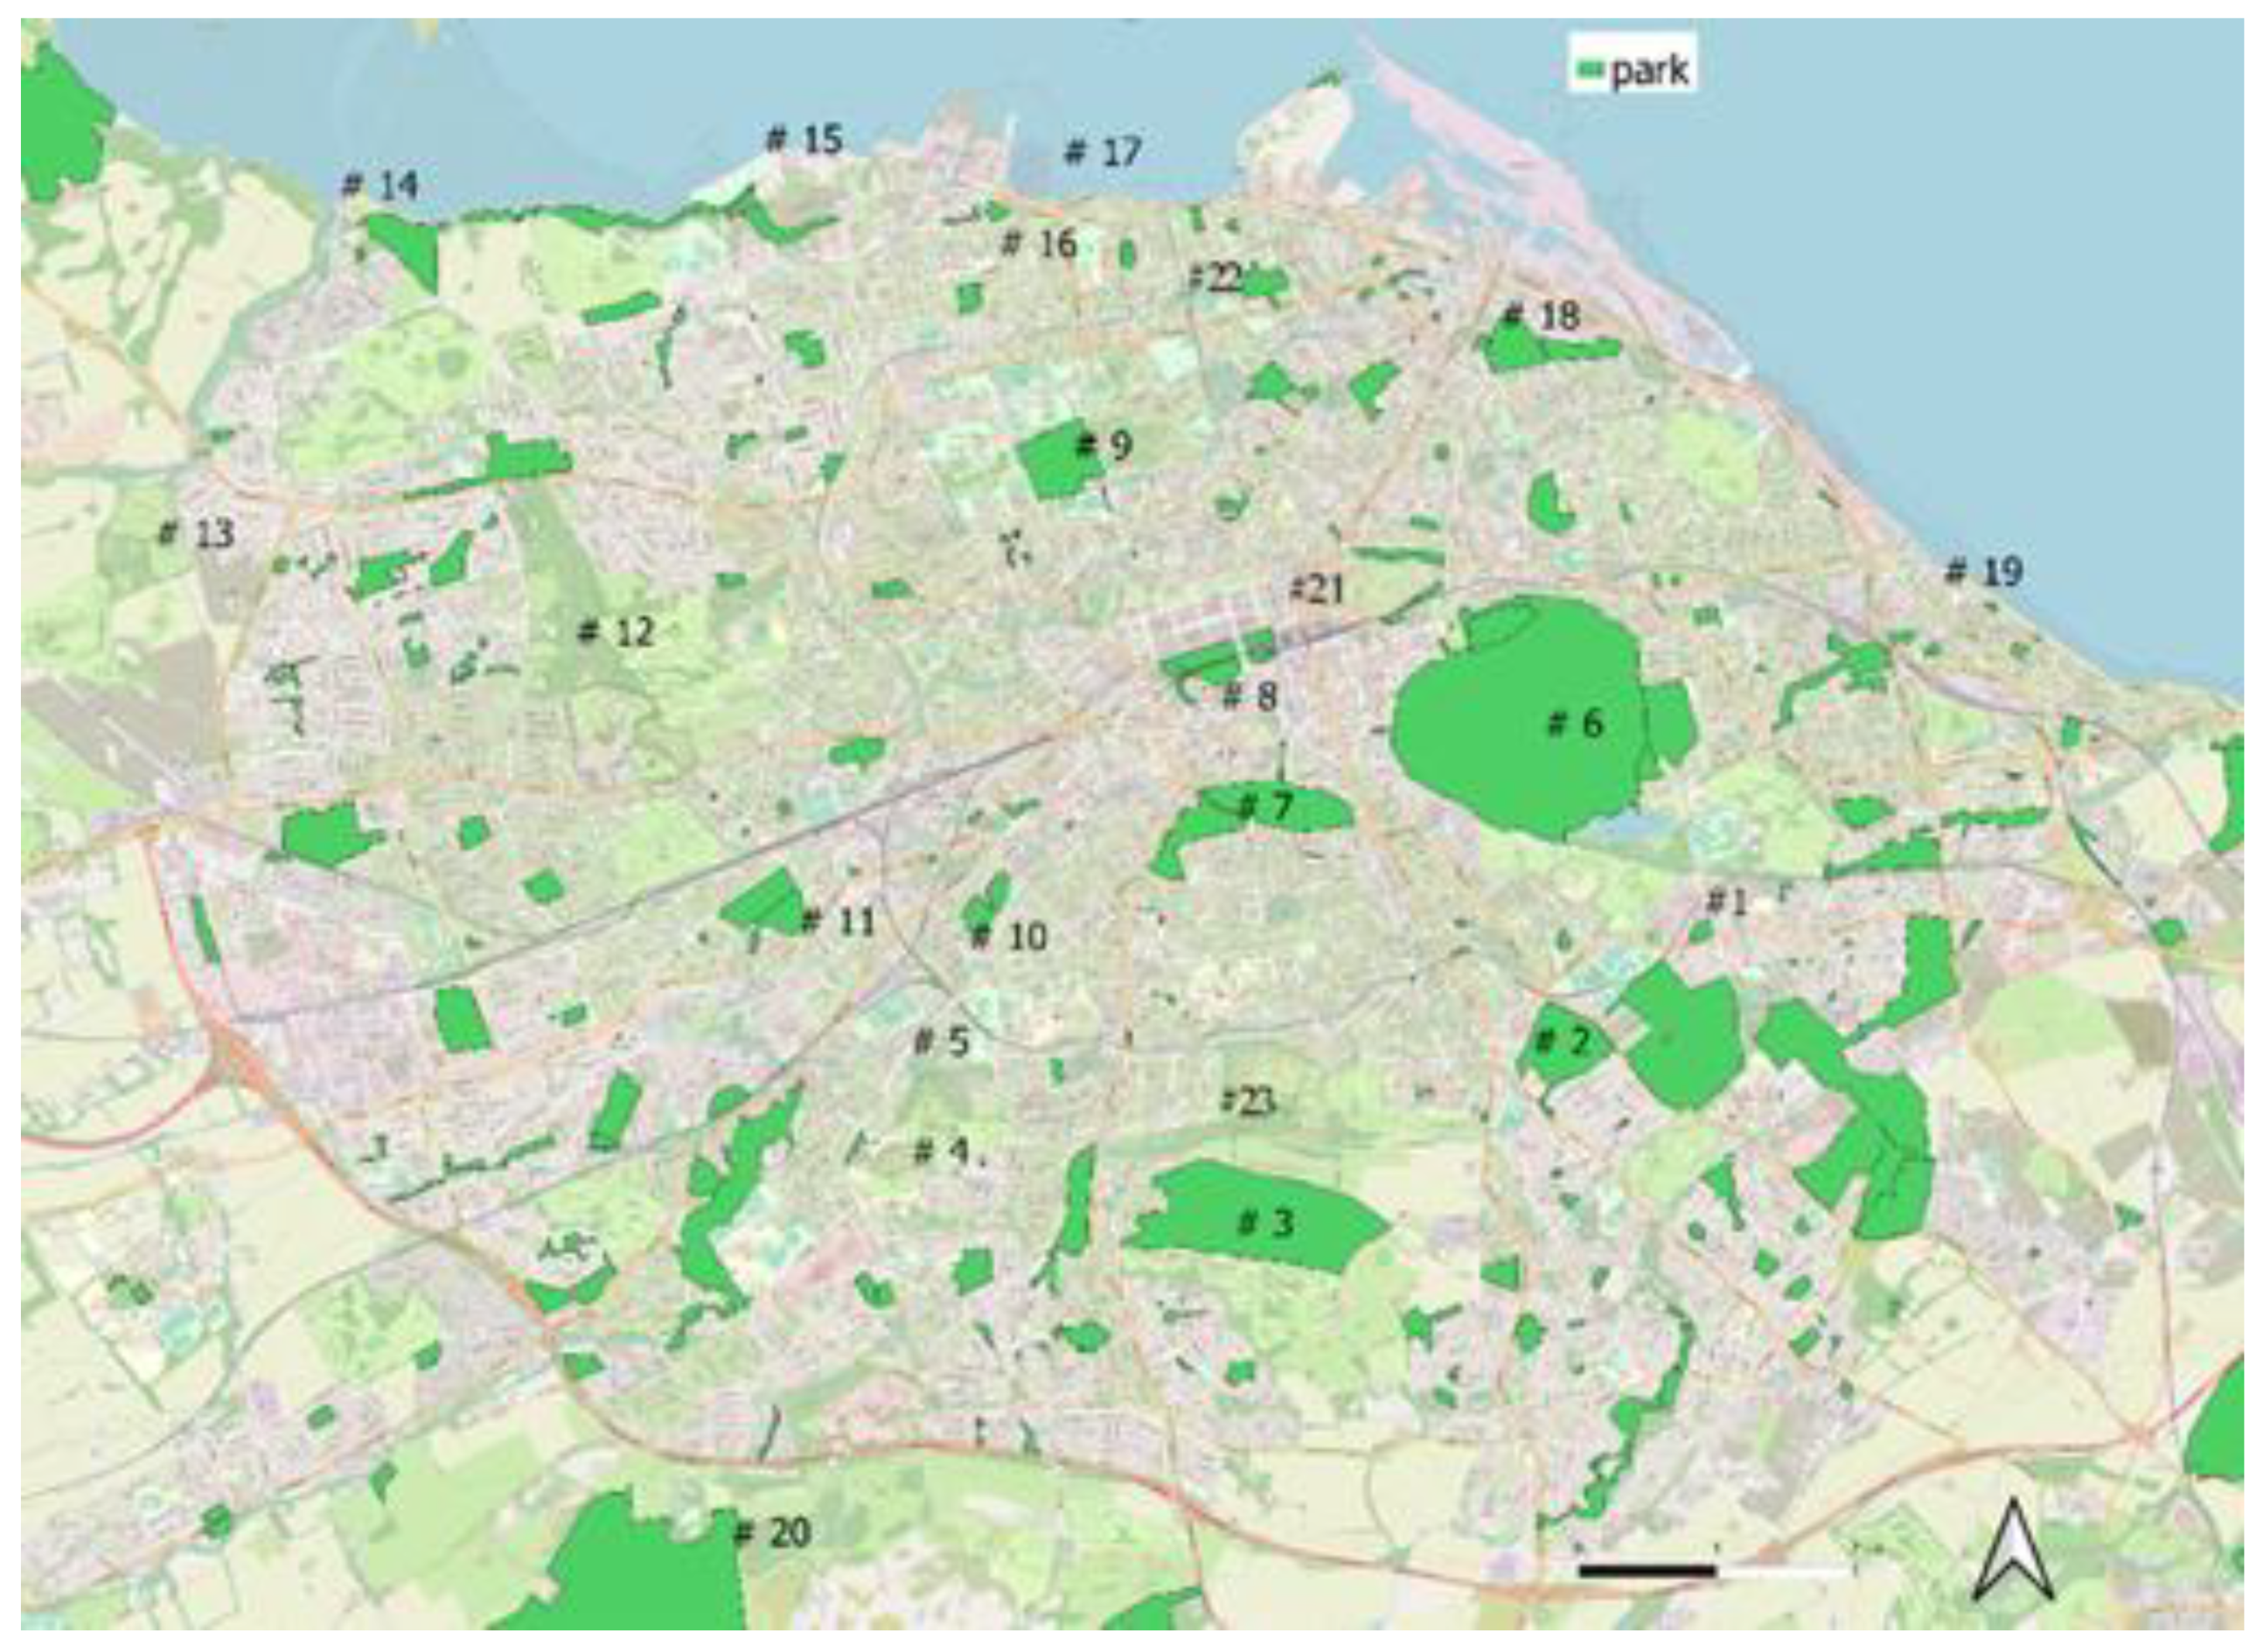
Appendix A. Map of Edinburgh’s Green/Blue Spaces

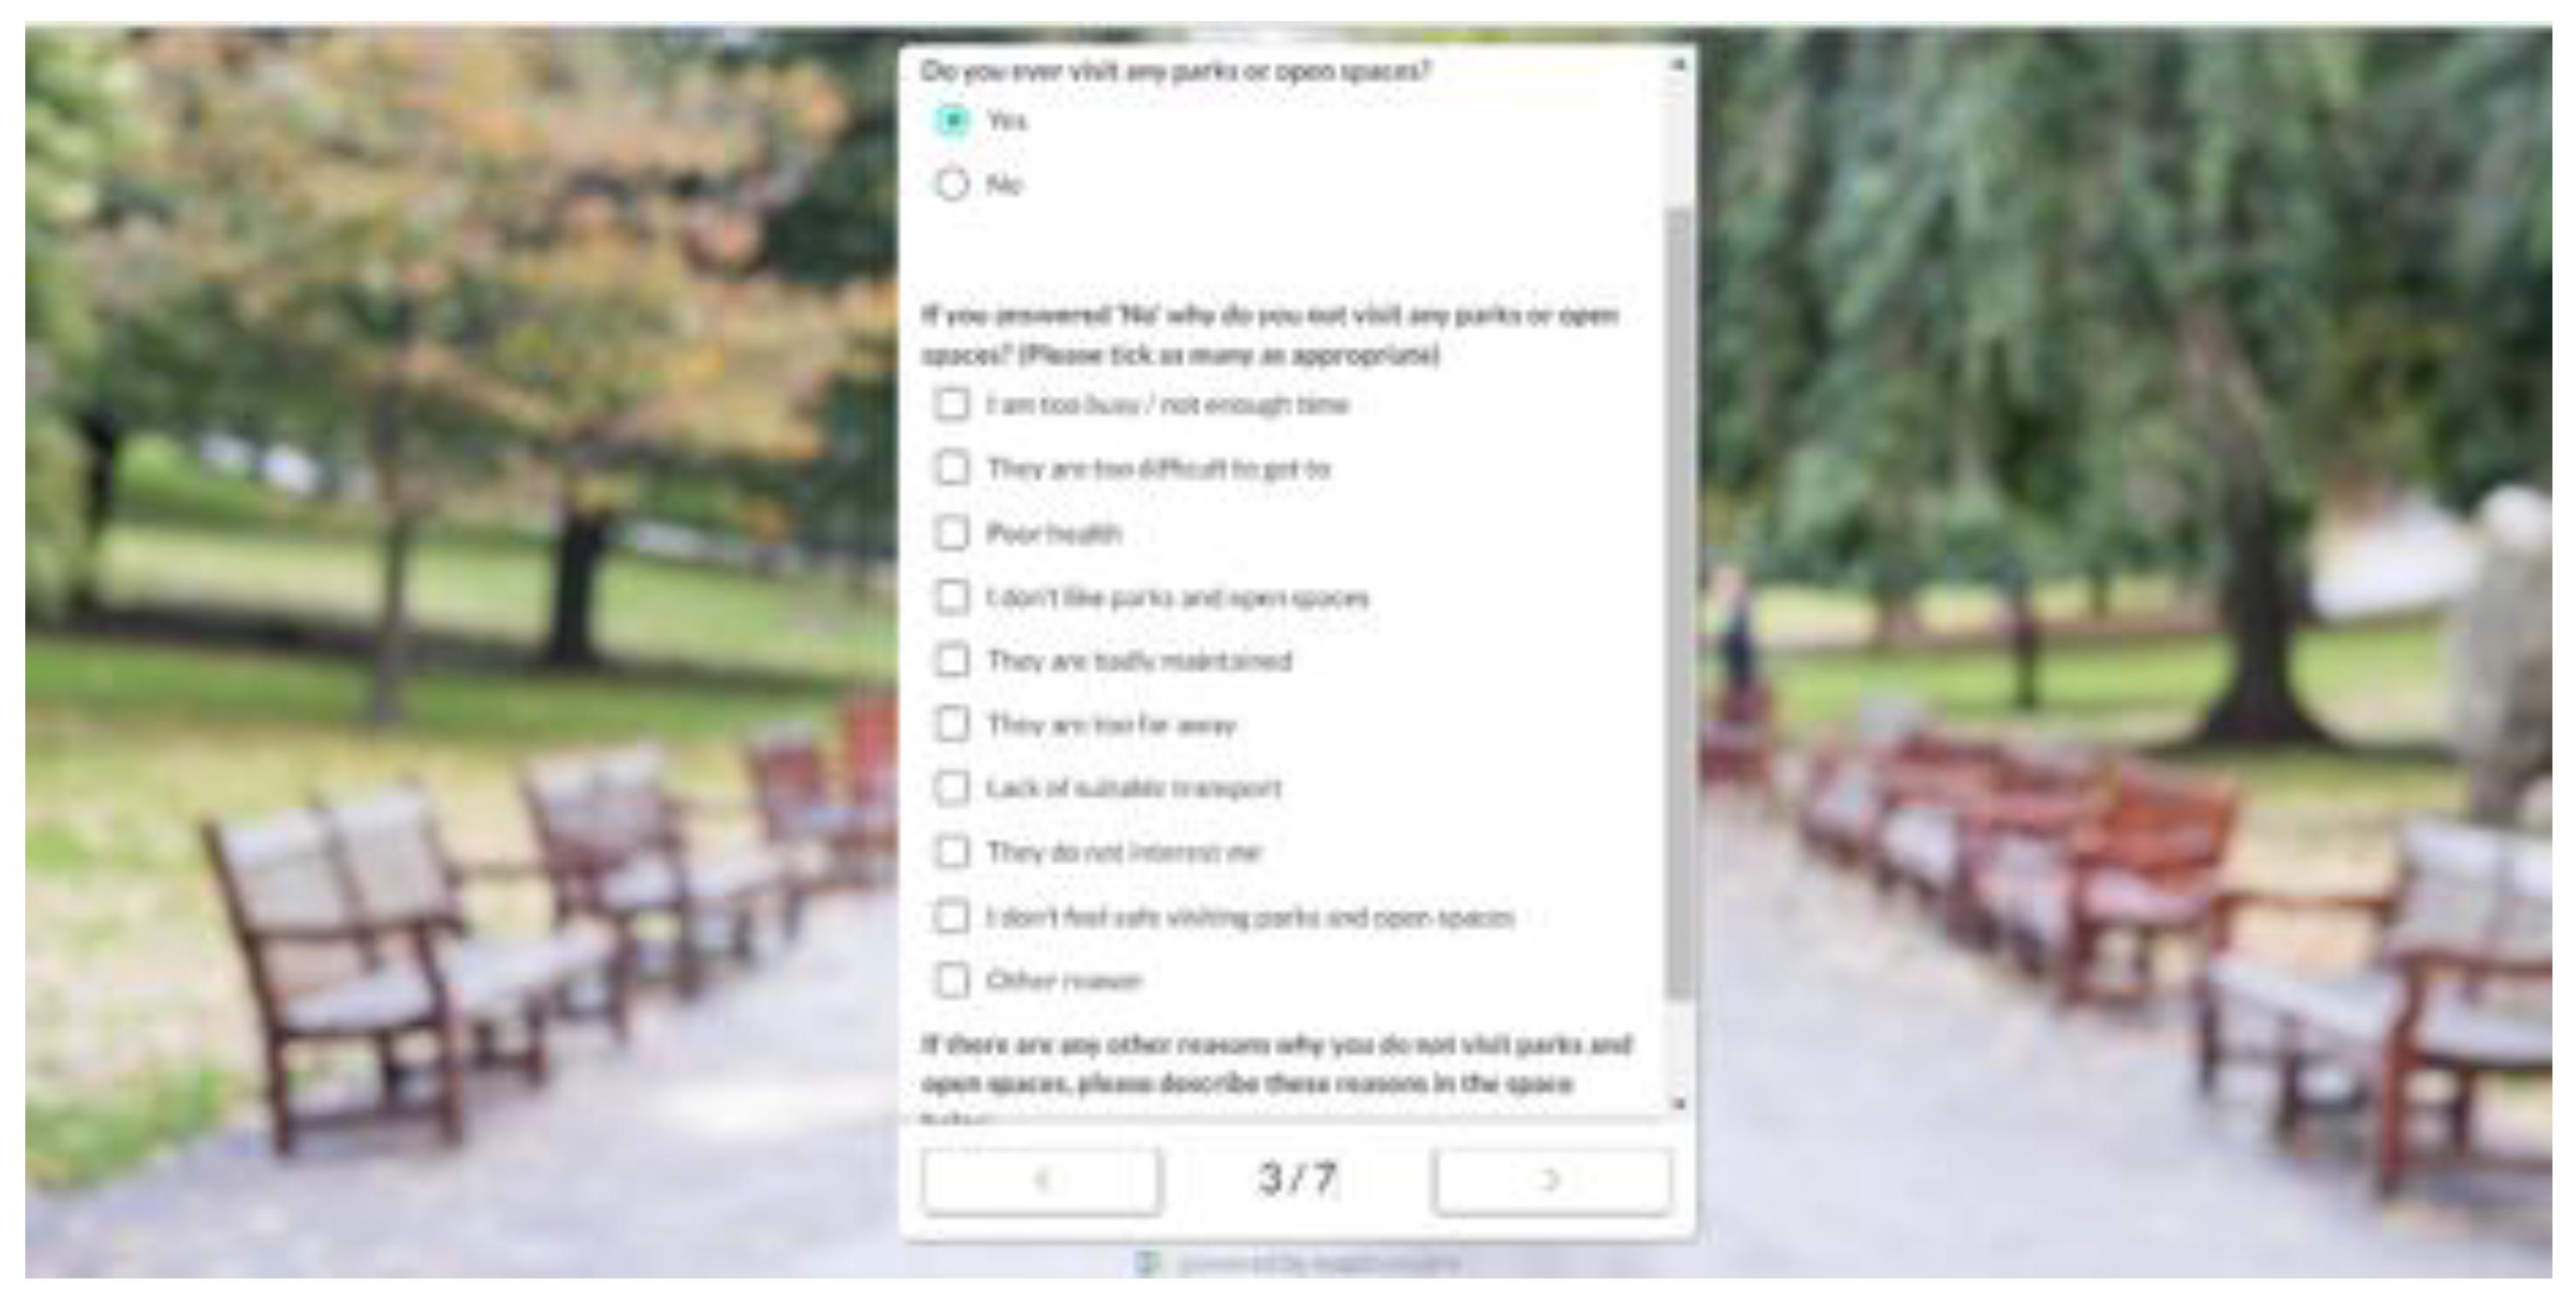
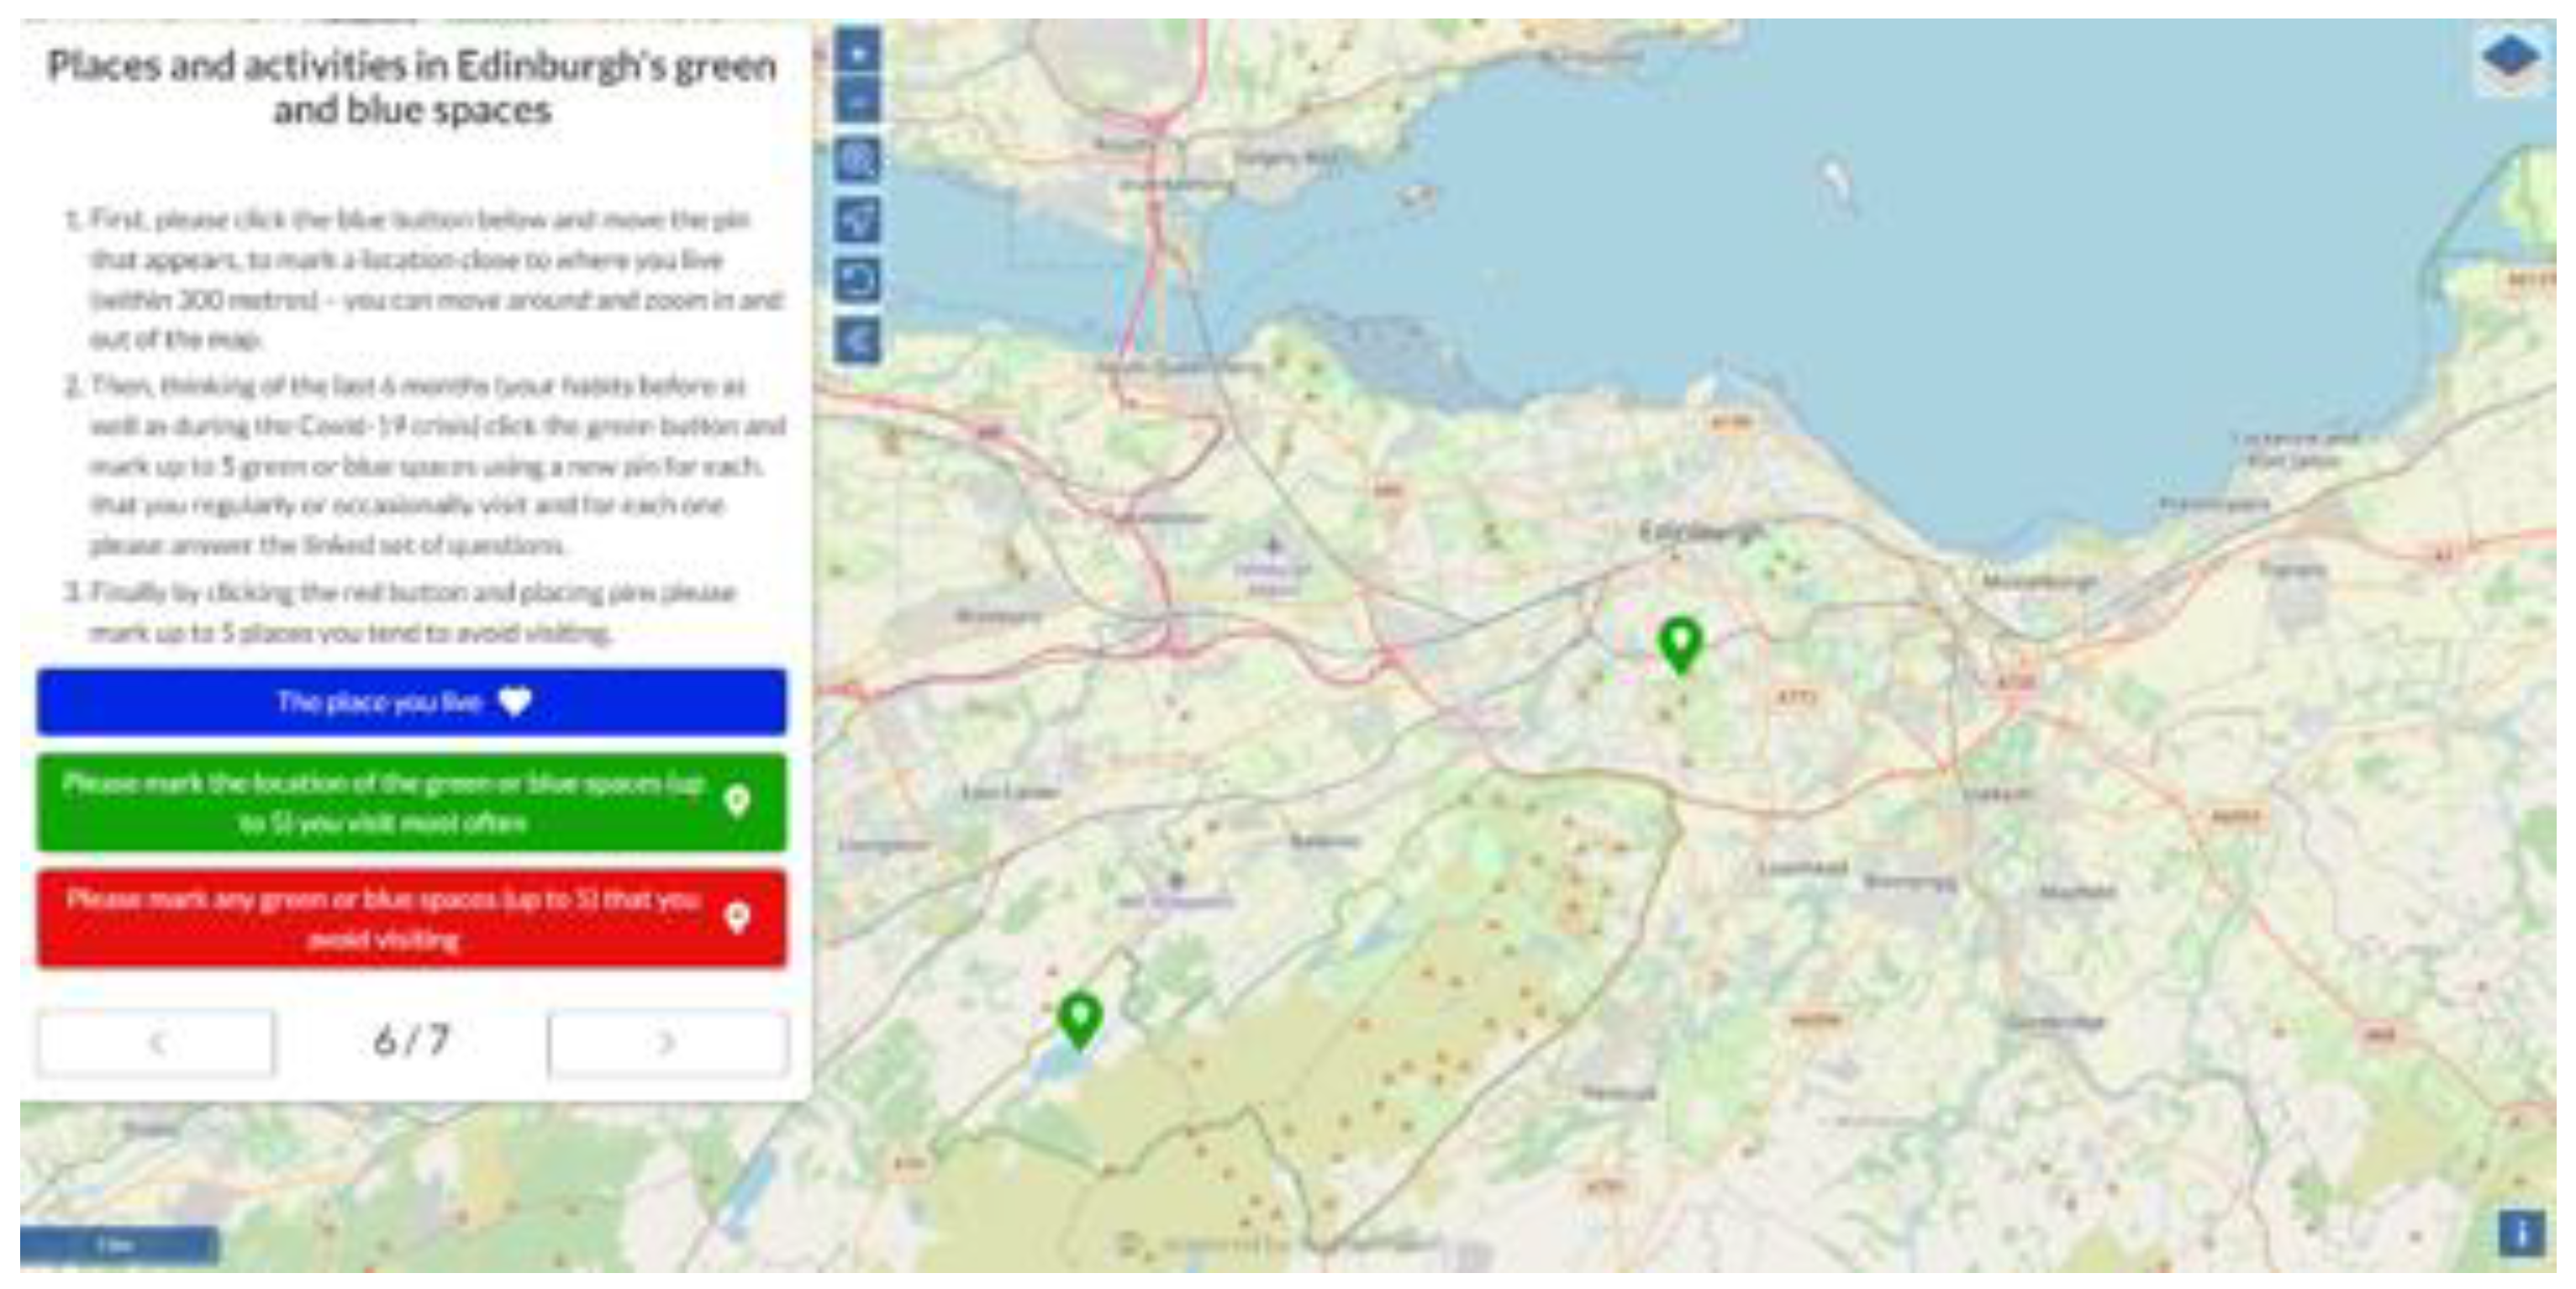
Appendix B. Maptionnaire Questionnaire


| Q1. In the Last 6 Months, How Often, on Average, Did You Visit? | Q2. Considering the Impact of the Recent Lockdown. Where You Able to Keep Visiting This Place as Part of Your Daily Exercise Allowance? | Q3. How Do You Travel There? | Q4. How Do You Visit? | Q5. How Long Does You Visit Usually Last? | Q6. What Do You Usually Do There? |
|---|---|---|---|---|---|
| Every day | No | Walk | On my own | <30 min | Walking with/without a dog |
| Several times a week | Yes | Cycle | Whit my partner and friend | 30 min to 1 h | Cycling/mountain biking |
| Once a week | If yes, did you visit more or less frequently than pre lockdown? | By car | With family | 1 to 2 h | Running/Jogging |
| Once or twice a month | By bus | In a group | 2 to 3 h | Playing with children | |
| A few times in the last 6 months | By tram | 3 to 4 h | Informal games and sports (e.g., frisbee, football, volleyball, etc.) | ||
| Not in the last 6 months | Other | 4 to 5 h | Through route/commuting | ||
| If other, please specify | 5 to 8 h | Eating or drinking | |||
| >8 h | Picnic/barbecue | ||||
| Visiting an attraction or event (e.g., museum, market, art, concert etc.) | |||||
| Art, photography, or similar hobbies | |||||
| Sunbathing | |||||
| Quiet activities (e.g., reading, meditating) | |||||
| Watching wildlife | |||||
| Participating in voluntary activities, e.g., Friends of Parks or other groups | |||||
| Others |
| Questions | Answer Options | ||
|---|---|---|---|
| Q1. Are there toilet facilities in or near the green space? | Yes | No | Don’t know |
| If any, are they usually open (before the lockdown)? | Yes | No | - |
| Q2. If there are any toilets, are they equipped for changing babies or for those with disabilities or special needs? | Yes | No | Don’t know |
| Q3. Does the provision of toilet facilities influence your decision to visit the green space? | Yes | No | - |
| Q4. Are there cafes in or near the green space? | Yes | No | Don’t know |
| Q5. Does the provision of cafes influence your decision to visit the green space? | Yes | No | - |
| Q6. Are there shelters from the rain in the green space? | Yes | No | Don’t know |
| Q7. Are there adequate information or sign boards in and near the green space? | Yes | No | Don’t know |
| Q8. Are the information sign boards translated into different languages? | Yes | No | Don’t know |
| Q9. Are there special signs provided for people with disabilities in and near the green space? | Yes | No | Don’t know |
References
- HM Government UK. Levelling up the United Kingdom Executive Summary. Available online: https://assets.publishing.service.gov.uk/government/uploads/system/uploads/attachment_data/file/1095544/Executive_Summary.pdf (accessed on 12 March 2024).
- Who Benefits from Nature in Cities? Social Inequalities in Access to Urban Green and Blue Spaces Across Europe—European Environment Agency. 2023. Available online: https://www.eea.europa.eu/publications/who-benefits-from-nature-in (accessed on 12 March 2024).
- Wittchen, H.U.; Jacobi, F. Size and burden of mental disorders in Europe—A critical review and appraisal of 27 studies. Eur. Neuropsychopharmacol. 2005, 15, 357–376. Available online: https://linkinghub.elsevier.com/retrieve/pii/S0924977×05000751 (accessed on 12 March 2024). [CrossRef]
- Hubbard, G.; den Daas, C.; Johnston, M.; Dixon, D. Sociodemographic and Psychological Risk Factors for Anxiety and Depression: Findings from the COVID-19 Health and Adherence Research in Scotland on Mental Health (CHARIS-MH) Cross-sectional Survey. Int. J. Behav. Med. 2021, 28, 788–800. [Google Scholar] [CrossRef]
- Hubbard, G.; Den Daas, C.; Johnston, M.; Murchie, P.; Thompson, C.W.; Dixon, D. Are rurality, area deprivation, access to outside space, and green space associated with mental health during the COVID-19 pandemic? A cross sectional study (charis-e). Int. J. Environ. Res. Public Health 2021, 18, 3869. [Google Scholar] [CrossRef]
- Hardcastle, K.; Wales, P.H. How Are We Doing Wales? Public Engagement Survey on Health and Wellbeing during Coronavirus Measures. Available online: https://phw.nhs.wales/topics/latest-information-on-novel-coronavirus-covid-19/how-are-you-doing/how-are-we-doing-in-wales-reports/how-are-we-doing-by-demographics-report/ (accessed on 12 March 2024).
- Burnett, H.; Olsen, J.R.; Nicholls, N.; Mitchell, R. Change in time spent visiting and experiences of green space following restrictions on movement during the COVID-19 pandemic: A nationally representative cross-sectional study of UK adults. BMJ Open 2021, 11, e044067. [Google Scholar] [CrossRef]
- Sallis, J.F.; Cervero, R.B.; Ascher, W.; Henderson, K.A.; Kraft, M.K.; Kerr, J. An Ecological Approach to Creating Active Living Communities. Annu. Rev. Public Health 2006, 27, 297–322. [Google Scholar] [CrossRef]
- Velarde, M.D.; Fry, G.; Tveit, M. Health effects of viewing landscapes—Landscape types in environmental psychology. Urban. Urban. Green. 2007, 6, 199–212. Available online: https://www.sciencedirect.com/science/article/pii/S1618866707000416 (accessed on 12 March 2024). [CrossRef]
- Bratman, G.N.; Hamilton, J.P.; Hahn, K.S.; Daily, G.C.; Gross, J.J. Nature experience reduces rumination and subgenual prefrontal cortex activation. Proc. Natl. Acad. Sci. USA 2015, 112, 8567–8572. [Google Scholar] [CrossRef]
- Gidlow, C.J.; Jones, M.V.; Hurst, G.; Masterson, D.; Clark-Carter, D.; Tarvainen, M.P.; Smith, G.; Nieuwenhuijsen, M. Where to put your best foot forward: Psycho-physiological responses to walking in natural and urban environments. J. Environ. Psychol. 2016, 45, 22–29. Available online: https://www.sciencedirect.com/science/article/pii/S0272494415300438 (accessed on 12 March 2024). [CrossRef]
- Berman, M.G.; Jonides, J.; Kaplan, S. The Cognitive Benefits of Interacting With Nature. Psychol. Sci. 2008, 19, 1207–1212. [Google Scholar] [CrossRef] [PubMed]
- Berman, M.G.; Kross, E.; Krpan, K.M.; Askren, M.K.; Burson, A.; Deldin, P.J.; Kaplan, S.; Sherdell, L.; Gotlib, I.H.; Jonides, J. Interacting with nature improves cognition and affect for individuals with depression. J. Affect. Disord. 2012, 140, 300–305. Available online: https://www.sciencedirect.com/science/article/pii/S0165032712002005 (accessed on 12 March 2024). [CrossRef]
- Why Research, L.; Scotland, G. Greenspace Use and Attitudes Survey 2017 Research Findings 2017. Available online: https://www.greenflagaward.org/media/1209/greenspace-survey-2017-final-report_021017.pdf (accessed on 12 March 2024).
- Reid, G. Managing budget cuts in Edinburgh’s sport and recreation services: Progressive localism in a resilient local authority? Int. J. Sport. Policy Politics 2018, 10, 113–129. [Google Scholar] [CrossRef]
- Lowndes, V.; Squires, S. Cuts, collaboration and creativity. Public Money Manag. 2012, 32, 401–408. [Google Scholar] [CrossRef]
- Bramley, G. Local Services Under Siege; Attitudes to Public Services in a Time of Austerity. 2012 April. Available online: https://www.academia.edu/18196128/Local_Services_Under_Siege_attitudes_to_public_services_in_a_time_of_austerity (accessed on 12 March 2024).
- Bourassa, S.C. The Aesthetics of Landscape; Belhaven Press: Belhaven, UK, 1991; pp. 1–168. [Google Scholar]
- Picascia, S.; Mitchell, R. Social integration as a determinant of inequalities in green space usage: Insights from a theoretical agent-based model. Health Place 2022, 73, 102729. [Google Scholar] [CrossRef] [PubMed]
- Mears, M.; Brindley, P.; Maheswaran, R.; Jorgensen, A. Understanding the socioeconomic equity of publicly accessible greenspace distribution: The example of Sheffield, UK. Geoforum. 2019, 103, 126–137. [Google Scholar] [CrossRef]
- Ode Sang, Å.; Knez, I.; Gunnarsson, B.; Hedblom, M. The effects of naturalness, gender, and age on how urban green space is perceived and used. Urban. For. Urban. Green. 2016, 18, 268–276. [Google Scholar] [CrossRef]
- Ode Sang, Å.; Sang, N.; Hedblom, M.; Sevelin, G.; Knez, I.; Gunnarsson, B. Are path choices of people moving through urban green spaces explained by gender and age? Implications for planning and management. Urban. Urban. Green. 2020, 49, 126628. Available online: https://www.sciencedirect.com/science/article/pii/S161886671930336X (accessed on 12 March 2024). [CrossRef]
- Edinburgh City Council, Heritage Fund, National Trust. Edinburgh’s Thriving Green Spaces. Available online: https://www.thrivinggreenspaces.scot/ (accessed on 12 March 2024).
- Heritage Fund, National Trust, Department for Levelling Up Housing & Communities. Future Parks Accelerator. Available online: https://www.futureparks.org.uk/ (accessed on 12 March 2024).
- Marselle, M.R. Theoretical Foundations of Biodiversity and Mental Well-being Relationships. In Biodiversity and Health in the Face of Climate Change; Marselle, M.R., Stadler, J., Korn, H., Irvine, K.N., Bonn, A., Eds.; Springer International Publishing: Cham, Switzerland, 2019; pp. 133–158. [Google Scholar] [CrossRef]
- Lovell, R.; Wheeler, B.W.; Higgins, S.L.; Irvine, K.N.; Depledge, M.H. A Systematic Review of the Health and Well-Being Benefits of Biodiverse Environments. J. Toxicol. Environ. Health Part B 2014, 17, 1–20. [Google Scholar] [CrossRef]
- Marselle, M.R.; Hartig, T.; Cox, D.T.; De Bell, S.; Knapp, S.; Lindley, S.; Triguero-Mas, M.; Böhning-Gaese, K.; Braubach, M.; Cook, P.A.; et al. Pathways linking biodiversity to human health: A conceptual framework. Environ. Int. 2021, 150, 106420. Available online: https://www.sciencedirect.com/science/article/pii/S0160412021000441 (accessed on 12 March 2024). [CrossRef]
- Aronson, M.F.J.; Lepczyk, C.A.; Evans, K.L.; Goddard, M.A.; Lerman, S.B.; MacIvor, J.S.; Nilon, C.H.; Vargo, T. Biodiversity in the city: Key challenges for urban green space management. Front. Ecol. Environ. 2017, 15, 189–196. Available online: https://onlinelibrary.wiley.com/doi/abs/10.1002/fee.1480 (accessed on 12 March 2024). [CrossRef]
- Edinburgh City Council. Edinburgh by Numbers 2022. Available online: https://www.edinburgh.gov.uk/downloads/file/30669/edinburgh-by-numbers-2021#:~:text=In%20the%20ten%20years%20to,2020%20was%20almost%20evenly%20distributed (accessed on 12 March 2024).
- First Mile. UK’s Green Hotspots. Available online: https://www.thefirstmile.co.uk/the-big-picture/uks-greenest-hotspots (accessed on 12 March 2024).
- City of Edinburgh Council. The City of Edinburgh Council: One Million Tree City. Available online: https://www.edinburgh.gov.uk/parks-greenspaces/one-million-tree-city/1 (accessed on 12 March 2024).
- Maptionnaire by Mapita Oy. Maptionnaire: The Platform to Design and Manage Community Engagement. Available online: https://www.maptionnaire.com/ (accessed on 12 March 2024).
- Brown, G.; Kyttä, M. Key issues and priorities in participatory mapping: Toward integration or increased specialization? Appl. Geogr. 2018, 95, 1–8. Available online: https://www.sciencedirect.com/science/article/pii/S0143622817313176 (accessed on 12 March 2024). [CrossRef]
- Fagerholm, N.; Raymond, C.M.; Olafsson, A.S.; Brown, G.; Rinne, T.; Hasanzadeh, K.; Broberg, A.; Kyttä, M. A methodological framework for analysis of participatory mapping data in research, planning, and management. Int. J. Geogr. Inf. Sci. 2021, 35, 1848–1875. [Google Scholar] [CrossRef]
- Faunalia, P.C.; Lami, L. Free GIS Desktop and Analyses: QuantumGIS, the Easy Way Geospatial World. 2010. Available online: https://www.geospatialworld.net/article/free-gis-desktop-and-analyses-quantumgis-the-easy-way/ (accessed on 12 March 2024).
- Team, Q.D. Getting Started—QGIS User Guide QGIS Geographic Information System. Open Source Geospatial Foundation Project. 2023. Available online: https://docs.qgis.org/2.8/en/docs/user_manual/introduction/getting_started.html (accessed on 12 March 2024).
- Scottish Government. Scottish Index of Multiple Deprivation. Available online: https://simd.scot/#/simd2016/BTTTFTT/9/-4.0000/55.9000/ (accessed on 12 March 2024).
- Wen, C.; Albert, C.; Von Haaren, C. The elderly in green spaces: Exploring requirements and preferences concerning nature-based recreation. Sustain. Cities Soc. 2018, 38, 582–593. Available online: https://www.sciencedirect.com/science/article/pii/S2210670717307977 (accessed on 12 March 2024). [CrossRef]
- Macintyre, S.; Macdonald, L.; Ellaway, A. Do poorer people have poorer access to local resources and facilities? The distribution of local resources by area deprivation in Glasgow, Scotland. Soc. Sci. Med. 2008, 67, 900–914. [Google Scholar] [CrossRef]
- Comber, A.; Brunsdon, C.; Green, E. Using a GIS-based network analysis to determine urban greenspace accessibility for different ethnic and religious groups. Landsc. Urban. Plan. 2008, 86, 103–114. Available online: https://www.sciencedirect.com/science/article/pii/S0169204608000066 (accessed on 12 March 2024). [CrossRef]
- Ward Thompson, C. Activity, exercise and the planning and design of outdoor spaces. J. Environ. Psychol. 2013, 34, 79–96. Available online: https://www.sciencedirect.com/science/article/pii/S0272494413000054 (accessed on 12 March 2024). [CrossRef]
- Floyd, M.F.; Spengler, J.O.; Maddock, J.E.; Gobster, P.H.; Suau, L.J. Park-based physical activity in diverse communities of two U.S. cities. An observational study. Am. J. Prev. Med. 2008, 34, 299–305. [Google Scholar] [CrossRef]
- Rhodes, R.E. The Built-In Environment: The Role of Personality and Physical Activity. Exerc. Sport. Sci. Rev. 2006, 34, 83–88. Available online: https://journals.lww.com/acsm-essr/fulltext/2006/04000/the_built_in_environment__the_role_of_personality.8.aspx (accessed on 12 March 2024). [CrossRef] [PubMed]
- Rhodes, R.E.; Courneya, K.S.; Blanchard, C.M.; Plotnikoff, R.C. Prediction of leisure-time walking: An integration of social cognitive, perceived environmental, and personality factors. Int. J. Behav. Nutr. Phys. Act. 2007, 4, 51. Available online: https://europepmc.org/articles/PMC2174941 (accessed on 12 March 2024). [CrossRef]
- Van Vliet, E.; Dane, G.; Weijs-Perrée, M.; van Leeuwen, E.; van Dinter, M.; van den Berg, P.; Borgers, A.; Chamilothori, K. The influence of urban park attributes on user preferences: Evaluation of virtual parks in an online stated-choice experiment. Int. J. Environ. Res. Public Health 2021, 18, 1–20. [Google Scholar] [CrossRef]
- Andrews, B.; Ferrini, S.; Bateman, I. Good parks—Bad parks: The influence of perceptions of location on WTP and preference motives for urban parks. J. Environ. Econ. Policy 2017, 6, 204–224. [Google Scholar] [CrossRef]
- Luo, S.; Xie, J.; Furuya, K. Assessing the preference and restorative potential of urban park blue space. Land. 2021, 10, 1233. [Google Scholar] [CrossRef]
- The City of Edinburgh Council. Saughton Park Restoration Project. Available online: https://www.edinburgh.gov.uk/downloads/download/12938/saughton-park-restoration-project (accessed on 12 March 2024).
- Association, L.G. Achieving Integrated Care through Community and Neighbourhood Working. 2021 December. Available online: https://www.local.gov.uk/sites/default/files/documents/25.184_High_Impact_Change_Model_guide_web%20accessible.pdf (accessed on 12 March 2024).
- CPRE T Countryside Charity. Local Green Spaces 2023: Increasingly Important for Community Well-Being and Nature Recovery. 2023 October. Available online: https://www.cpre.org.uk/wp-content/uploads/2023/10/Local-Green-Spaces-report.pdf (accessed on 12 March 2024).


| Characteristics | Survey Respondents | Edinburgh | Test of Difference, p-Value b | |
|---|---|---|---|---|
| Gender n = 412 | Female | 65.5 | 48.8 | 0.002 |
| Male | 31.5 | 51.2 | 0.002 | |
| Non-binary | 0.5 | - | - | |
| Prefer not to say | 2.5 | - | - | |
| Age n = 366 | 18 to 44 | 26.0 | 54.2 | 0.002 |
| 45 to 64 | 48.0 | 27.7 | 0.019 | |
| 65 to 74 | 19.0 | 9.8 | 0.000 | |
| Above 75 | 7.0 | 8.3 | 0.733 | |
| Ethnicity n = 320 | White: Total | 94.0 | 91.7 | 0.682 |
| Mixed or multiple ethnic groups | 0.5 | 0.9 | 0.775 | |
| Asian, Asian Scottish, or Asian British | 1.5 | 5.5 | 0.142 | |
| African | 0.0 | 1.2 | 0.291 | |
| Caribbean or Black | 0.5 | 0.8 | 0.835 | |
| Another ethnic group | 0.5 | - | - | |
| Prefer not to say | 3.5 | - | - | |
| Marital status n = 283 | Married, civil union, partner | 69.0 | 38.4 | 0.001 |
| Single, separated, widowed | 24.0 | 61.6 | 0.000 | |
| Neither of these | 3.0 | - | - | |
| Prefer not to answer | 4.0 | - | - | |
| Employment n = 293 | In paid work | 65.18 | 59.6 | 0.616 |
| In education | 3.07 | 15.8 | 0.003 | |
| Unemployed | 1.36 | 3.9 | 0.268 | |
| Permanently sick/ disabled | 2.04 | 3.7 | 0.489 | |
| Retired | 24.91 | 11.6 | 0.028 | |
| House person/carer | 1.36 | 3.5 | 0.332 | |
| Other | 2.04 | 1.9 | 0.943 | |
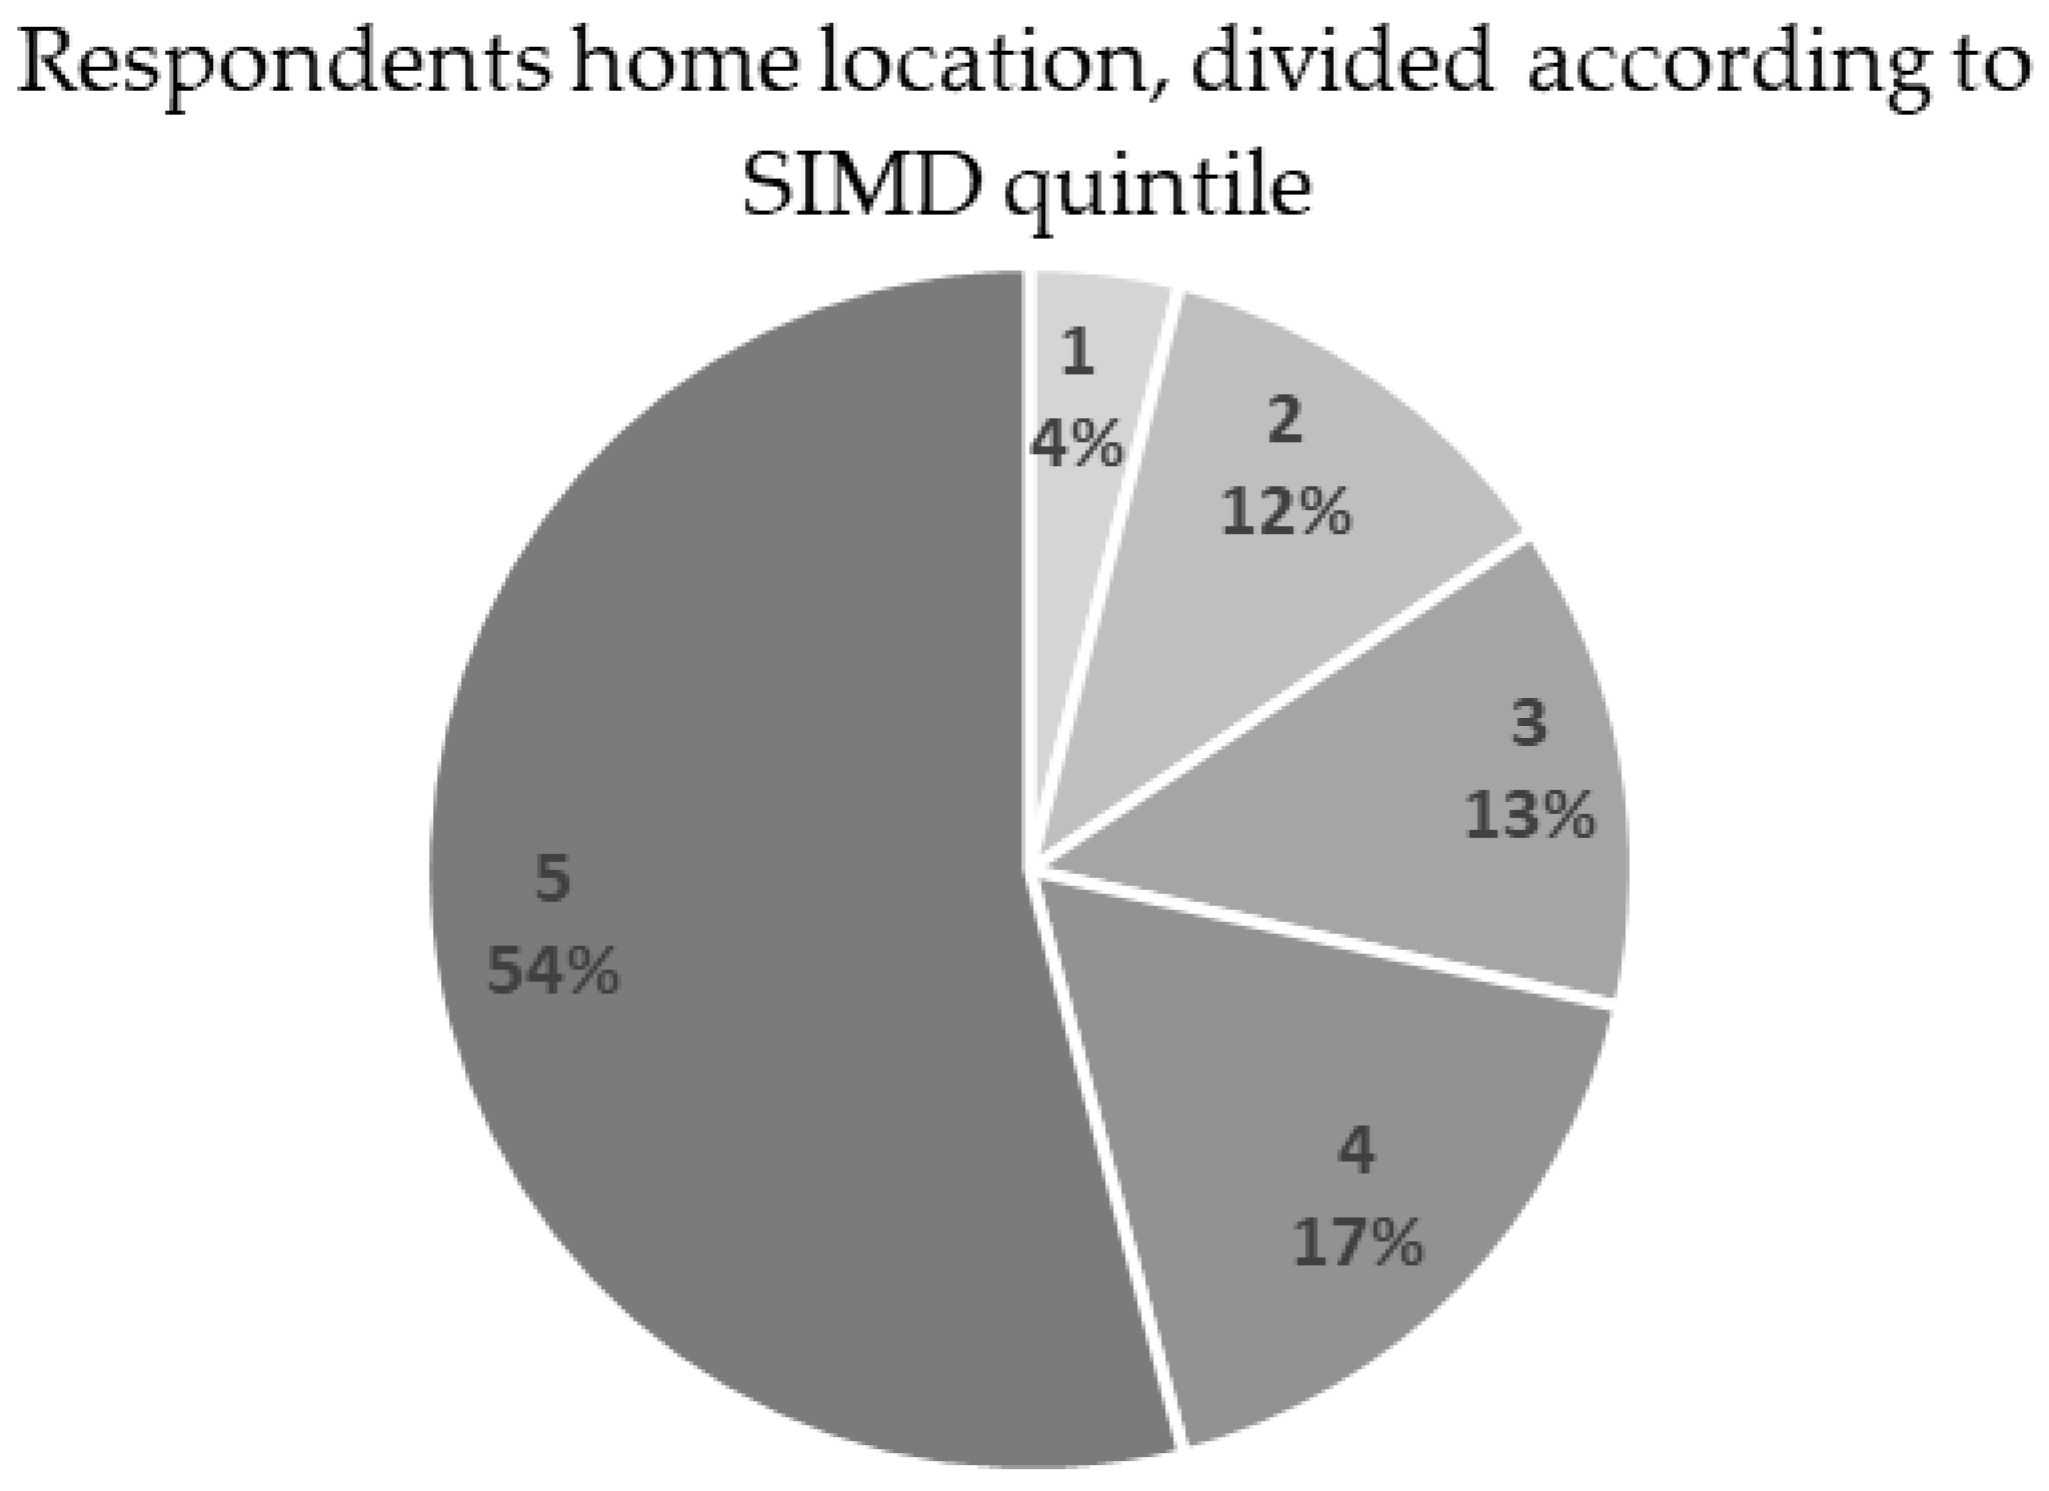
| Social class c n = 292 | 1 | 4 | 11.6 | 0.054 |
| 2 | 12 | 14.1 | 0.681 | |
| 3 | 13 | 14.1 | 0.833 | |
| 4 | 17 | 16.7 | 0.959 | |
| 5 | 54 | 43.5 | 0.288 | |
| Social class | Survey respondents | Scotland | ||
| 1 | 4 | 19.5 | 0.001 | |
| 2 | 12 | 19.5 | 0.181 | |
| 3 | 13 | 19.8 | 0.235 | |
| 4 | 17 | 20.5 | 0.568 | |
| 5 | 54 | 20.7 | 0.000 |
| Count | % | |
|---|---|---|
| How often do you visit? | N = 1423 | |
| Every day | 119 | 8.36 |
| Several times a week | 458 | 32.19 |
| Once a week | 261 | 18.34 |
| Once or twice a month | 350 | 24.60 |
| A few times in the last 6 months | 214 | 15.04 |
| Not in the last 6 months | 21 | 1.48 |
| Duration of green space visit? | N = 1019 | |
| Less than 30 min | 154 | 15.11 |
| 30 min to 1 h | 410 | 40.24 |
| 1 up to 2 h | 314 | 30.81 |
| 2 up to 3 h | 111 | 10.89 |
| 3 up to 4 h | 21 | 2.06 |
| 4 up to 5 h | 9 | 0.88 |
| Mode of transport? | N = 1213 | |
| Walk | 771 | 63.58 |
| Cycle | 225 | 18.53 |
| By car | 145 | 11.93 |
| Bus | 60 | 4.95 |
| By tram | 3 | 0.25 |
| Other | 9 | 0.76 |
| Visiting alone or with others? | N = 1017 | |
| On my own | 424 | 41.68 |
| With my partner or friend | 359 | 35.30 |
| With my family | 174 | 17.13 |
| In a group | 60 | 5.89 |
| Ability to continue visiting UGBSs as part of daily exercise routine during COVID-19 lockdown? | N = 1332 | |
| Yes | 1039 | 78.00 |
| No | 293 | 22.00 |
| Activities engaged in when visiting green spaces | N = 988 | |
| Walking without a dog | 230 | 23.30 |
| Watching wildlife | 117 | 11.80 |
| Meeting friends/socializing | 67 | 6.80 |
| Quiet activities (e.g., reading, meditating) | 65 | 6.60 |
| Walking with a dog | 62 | 6.30 |
| Cycling | 60 | 6.10 |
| Through route/commuting | 54 | 5.50 |
| Eating or drinking | 51 | 5.20 |
| Playing with children | 44 | 4.50 |
| Jogging | 41 | 4.20 |
| Art, photography, hobbies | 41 | 4.10 |
| Running | 38 | 3.80 |
| Picnic/barbecue | 28 | 2.80 |
| Sunbathing | 26 | 2.60 |
| Informal games and sports (e.g., frisbee, football, volleyball, etc.) | 12 | 1.20 |
| Visiting an attraction (e.g., a museum in a park or an art installation) | 11 | 1.10 |
| Participating in voluntary activities, e.g., Friends of Parks or other groups | 10 | 1.00 |
| Others | 9 | 0.90 |
| Paddling | 8 | 0.80 |
| Swimming | 6 | 0.60 |
| Adventure sport (e.g., mountain biking, horse riding) | 3 | 0.30 |
| Attending an event (such as a concert or show) | 3 | 0.30 |
| Fishing (including angling and crabbing) | 1 | 0.10 |
| Boating (e.g., yachting, canoeing, kayaking, pedalo/paddle boat, etc.) | 1 | 0.10 |
Disclaimer/Publisher’s Note: The statements, opinions and data contained in all publications are solely those of the individual author(s) and contributor(s) and not of MDPI and/or the editor(s). MDPI and/or the editor(s) disclaim responsibility for any injury to people or property resulting from any ideas, methods, instructions or products referred to in the content. |
© 2024 by the authors. Licensee MDPI, Basel, Switzerland. This article is an open access article distributed under the terms and conditions of the Creative Commons Attribution (CC BY) license (https://creativecommons.org/licenses/by/4.0/).
Share and Cite
Wendelboe-Nelson, C.; Wang, Y.; Bell, S.; McDougall, C.W.; Ward Thompson, C. Your Favourite Park Is Not My Favourite Park: A Participatory Geographic Information System Approach to Improving Urban Green and Blue Spaces—A Case Study in Edinburgh, Scotland. Land 2024, 13, 395. https://doi.org/10.3390/land13030395
Wendelboe-Nelson C, Wang Y, Bell S, McDougall CW, Ward Thompson C. Your Favourite Park Is Not My Favourite Park: A Participatory Geographic Information System Approach to Improving Urban Green and Blue Spaces—A Case Study in Edinburgh, Scotland. Land. 2024; 13(3):395. https://doi.org/10.3390/land13030395
Chicago/Turabian StyleWendelboe-Nelson, Charlotte, Yiyun Wang, Simon Bell, Craig W. McDougall, and Catharine Ward Thompson. 2024. "Your Favourite Park Is Not My Favourite Park: A Participatory Geographic Information System Approach to Improving Urban Green and Blue Spaces—A Case Study in Edinburgh, Scotland" Land 13, no. 3: 395. https://doi.org/10.3390/land13030395