Article

Applying Multi-Sensor Satellite Data to Identify Key Natural Factors in Annual Livestock Change and Winter Livestock Disaster (Dzud) in Mongolian Nomadic Pasturelands

by
Sinkyu Kang
1,*,†,
Nanghyun Cho
1,†,
Amartuvshin Narantsetseg
2,
Bolor-Erdene Lkhamsuren
1,3,
Otgon Khongorzul
1,
Tumendemberel Tegshdelger
1,
Bumsuk Seo
1,4 and
Keunchang Jang
5
1
Department of Environmental Science, Kangwon National University, Chuncheon 24341, Republic of Korea
2
Botanic Garden and Research Institute, Mongolian Academy of Sciences, Ulaanbaatar 13330, Mongolia
3
Khomiin Tal National Park, Ulaanbaatar 13381, Mongolia
4
Karlsruhe Institute of Technology (KIT), 82467 Garmisch-Partenkirchen, Germany
5
Forest Environment and Conservation Department, National Institute of Forest Science, Seoul 02455, Republic of Korea
*
Author to whom correspondence should be addressed.
These authors contributed equally to this work.
Land 2024, 13(3), 391; https://doi.org/10.3390/land13030391
Submission received: 30 January 2024 / Revised: 14 March 2024 / Accepted: 15 March 2024 / Published: 19 March 2024
(This article belongs to the Special Issue Spatial Big Data for Rangeland Ecology and Management)

Abstract

:
In the present study, we tested the applicability of multi-sensor satellite data to account for key natural factors of annual livestock number changes in county-level soum districts of Mongolia. A schematic model of nomadic landscapes was developed and used to select potential drivers retrievable from multi-sensor satellite data. Three alternative methods (principal component analysis, PCA; stepwise multiple regression, SMR; and random forest machine learning model, RF) were used to determine the key drivers for livestock changes and Dzud outbreaks. The countrywide Dzud in 2010 was well-characterized by the PCA as cold with a snowy winter and low summer foraging biomass. The RF estimated the annual livestock change with high accuracy (R2 > 0.9 in most soums). The SMR was less accurate but provided better intuitive insights on the regionality of the key factors and its relationships with local climate and Dzud characteristics. Summer and winter variables appeared to be almost equally important in both models. The primary factors of livestock change and Dzud showed regional patterns: dryness in the south, temperature in the north, and foraging resource in the central and western regions. This study demonstrates a synergistic potential of models and satellite data to understand climate–vegetation–livestock interactions in Mongolian nomadic pastures.

1. Introduction

In arid regions of Central Asia, extreme climatic conditions sometimes induce multifaceted livestock disasters, called Dzud, an event in which winter livestock mortality is abnormally high due to harsh winter weather and/or summer drought [1,2,3]. This winter livestock disaster has traditionally occurred throughout the Eurasian Steppe and northern China and is named differently by regions: Dzud in Mongolia, Dzhut in Kazakhstan, and Kengschi in Tibet [1,4]. Dzud causes serious damages to livestock as well as wildlife antelope populations through the process of mass debilitation, starvation, and death of livestock [4,5]. Though Dzud was a traditional endemic disaster, the recent increase in weather volatility and expanding livestock husbandry can exacerbate its frequency and the severity of its impacts on nomadic pastoral system of Mongolia.
In Mongolia, two powerful Dzud events occurred during 1999–2002 and 2009–2010 winters, in which more than 20% livestock losses happened both times across the country [6]. Both events were the case of a combination Dzud, known as the most serious type related with summer drought followed by harsh winter weather [1,7,8]. Previous research has identified six types of Dzud: white (characterized by deep snow); black (characterized by cold temperature); iron (characterized by ice cover); storm (characterized by stormy weather); combined; and hooped (characterized by shortages in foraging resources due to livestock immigration from Dzud-affected regions) [8,9,10]. The multiple Dzud types indicate the nomadic pastoral system, which is naturally highly vulnerable to extreme weather conditions, and the driver combinations that occasionally occur.
For the last two decades, our understanding of the natural factors and socio-ecological contexts of Dzud disasters have been advanced. Researchers evaluated the key natural factors that caused the 1999–2002 and 2009–2010 Dzuds [11,12,13]. Some studies have used satellite data as proxies of grassland production and snow depth to evaluate the potential factors driving and influencing Dzud disasters [13,14,15,16]. Moreover, the socio-ecological context of Dzud phenomena was also investigated as a function of interacting physical, biological, socio-economic, and institutional factors. In the studies, the role of herders’ groups and local governments (i.e., organized collective action and government support) was emphasized in preparing for and lessening the impacts of Dzud disasters [8,10,17,18,19].
Taken together, those research outcomes raise a new question that integrates the natural factors and social contexts of Dzud disasters. The issue is fundamentally related to the question of how to integrate phenomena occurring at different scales, wherein climate and vegetation characteristics changes and social contexts are shifted. In Mongolia, herders’ daily pastoral decisions are usually made at a nomadic scale, i.e., the nomadic landscape covering their seasonal pastures; compromises between herder groups are made at a village level (bagh); and governance and commercial activity are coordinated at county (soum) and province (aimag) levels [20]. Because the nomadic scale determines the spatial extent of key natural interactions between climate, vegetation, and livestock, the natural interactions inherent in nomadic pastoralism need to be addressed at the landscape level of herders’ seasonal pastures [21]. In contrast, the governance at the soum or aimag level can influence the natural interactions in the nomadic landscapes, thus creating a mismatch in scales between the natural processes and the socio-economic activities.
The scale inconsistency, however, seems negotiable, taking into account regional similarities in nomadic pastoralism that reflect regional climate and vegetation characteristics [21]. The compromise in scale inconsistency can serve as a conceptual basis for using livestock census data that are collected at the level of the soum administrative district [22]. However, this requires an implicit assumption that the soum district is a collection of nomadic landscapes with identical climates, livestock, vegetation conditions, and their interactions. On this basis, using the aimag administrative district, which has a much larger area than the soum, as the basic unit of analysis is problematic in reflecting the scale of natural heterogeneities in climate and vegetation [23]. Nevertheless, most Dzud studies have been conducted at the scale of the aimag district level, which inevitably leads to the underestimation of the effects of natural heterogeneities as well as local governance. This matter is partly due to the lack of climate and biophysical data suitable for the soum scale covering the whole of Mongolia, which is necessary for analyzing the climate–vegetation–livestock relationships. In this context, multi-sensor remote sensing technology can be a good alternative to solve the problem as it provides diverse climate and biophysical datasets with spatial and temporal resolutions that are high enough for the soum district scale across Mongolia [24,25,26].
To fill the research gaps mentioned above, this study (1) developed a schematic model of nomadic pastoral landscapes that describes the natural causal relationships between climate, vegetation, and livestock; (2) used the model as a conceptual basis to select variables that could be retrieved from multi-sensor satellite data, and (3) investigated how well these variables can explain the changes in livestock numbers and Dzud occurrences in soums across Mongolia. In this study, multi-sensor satellite data were used to produce datasets for the selected variables at the soum district level, and multivariate statistical analyses methods were applied to determine the applicability of data extracted from multi-sensor satellites to answer the question.

2. Materials and Methods

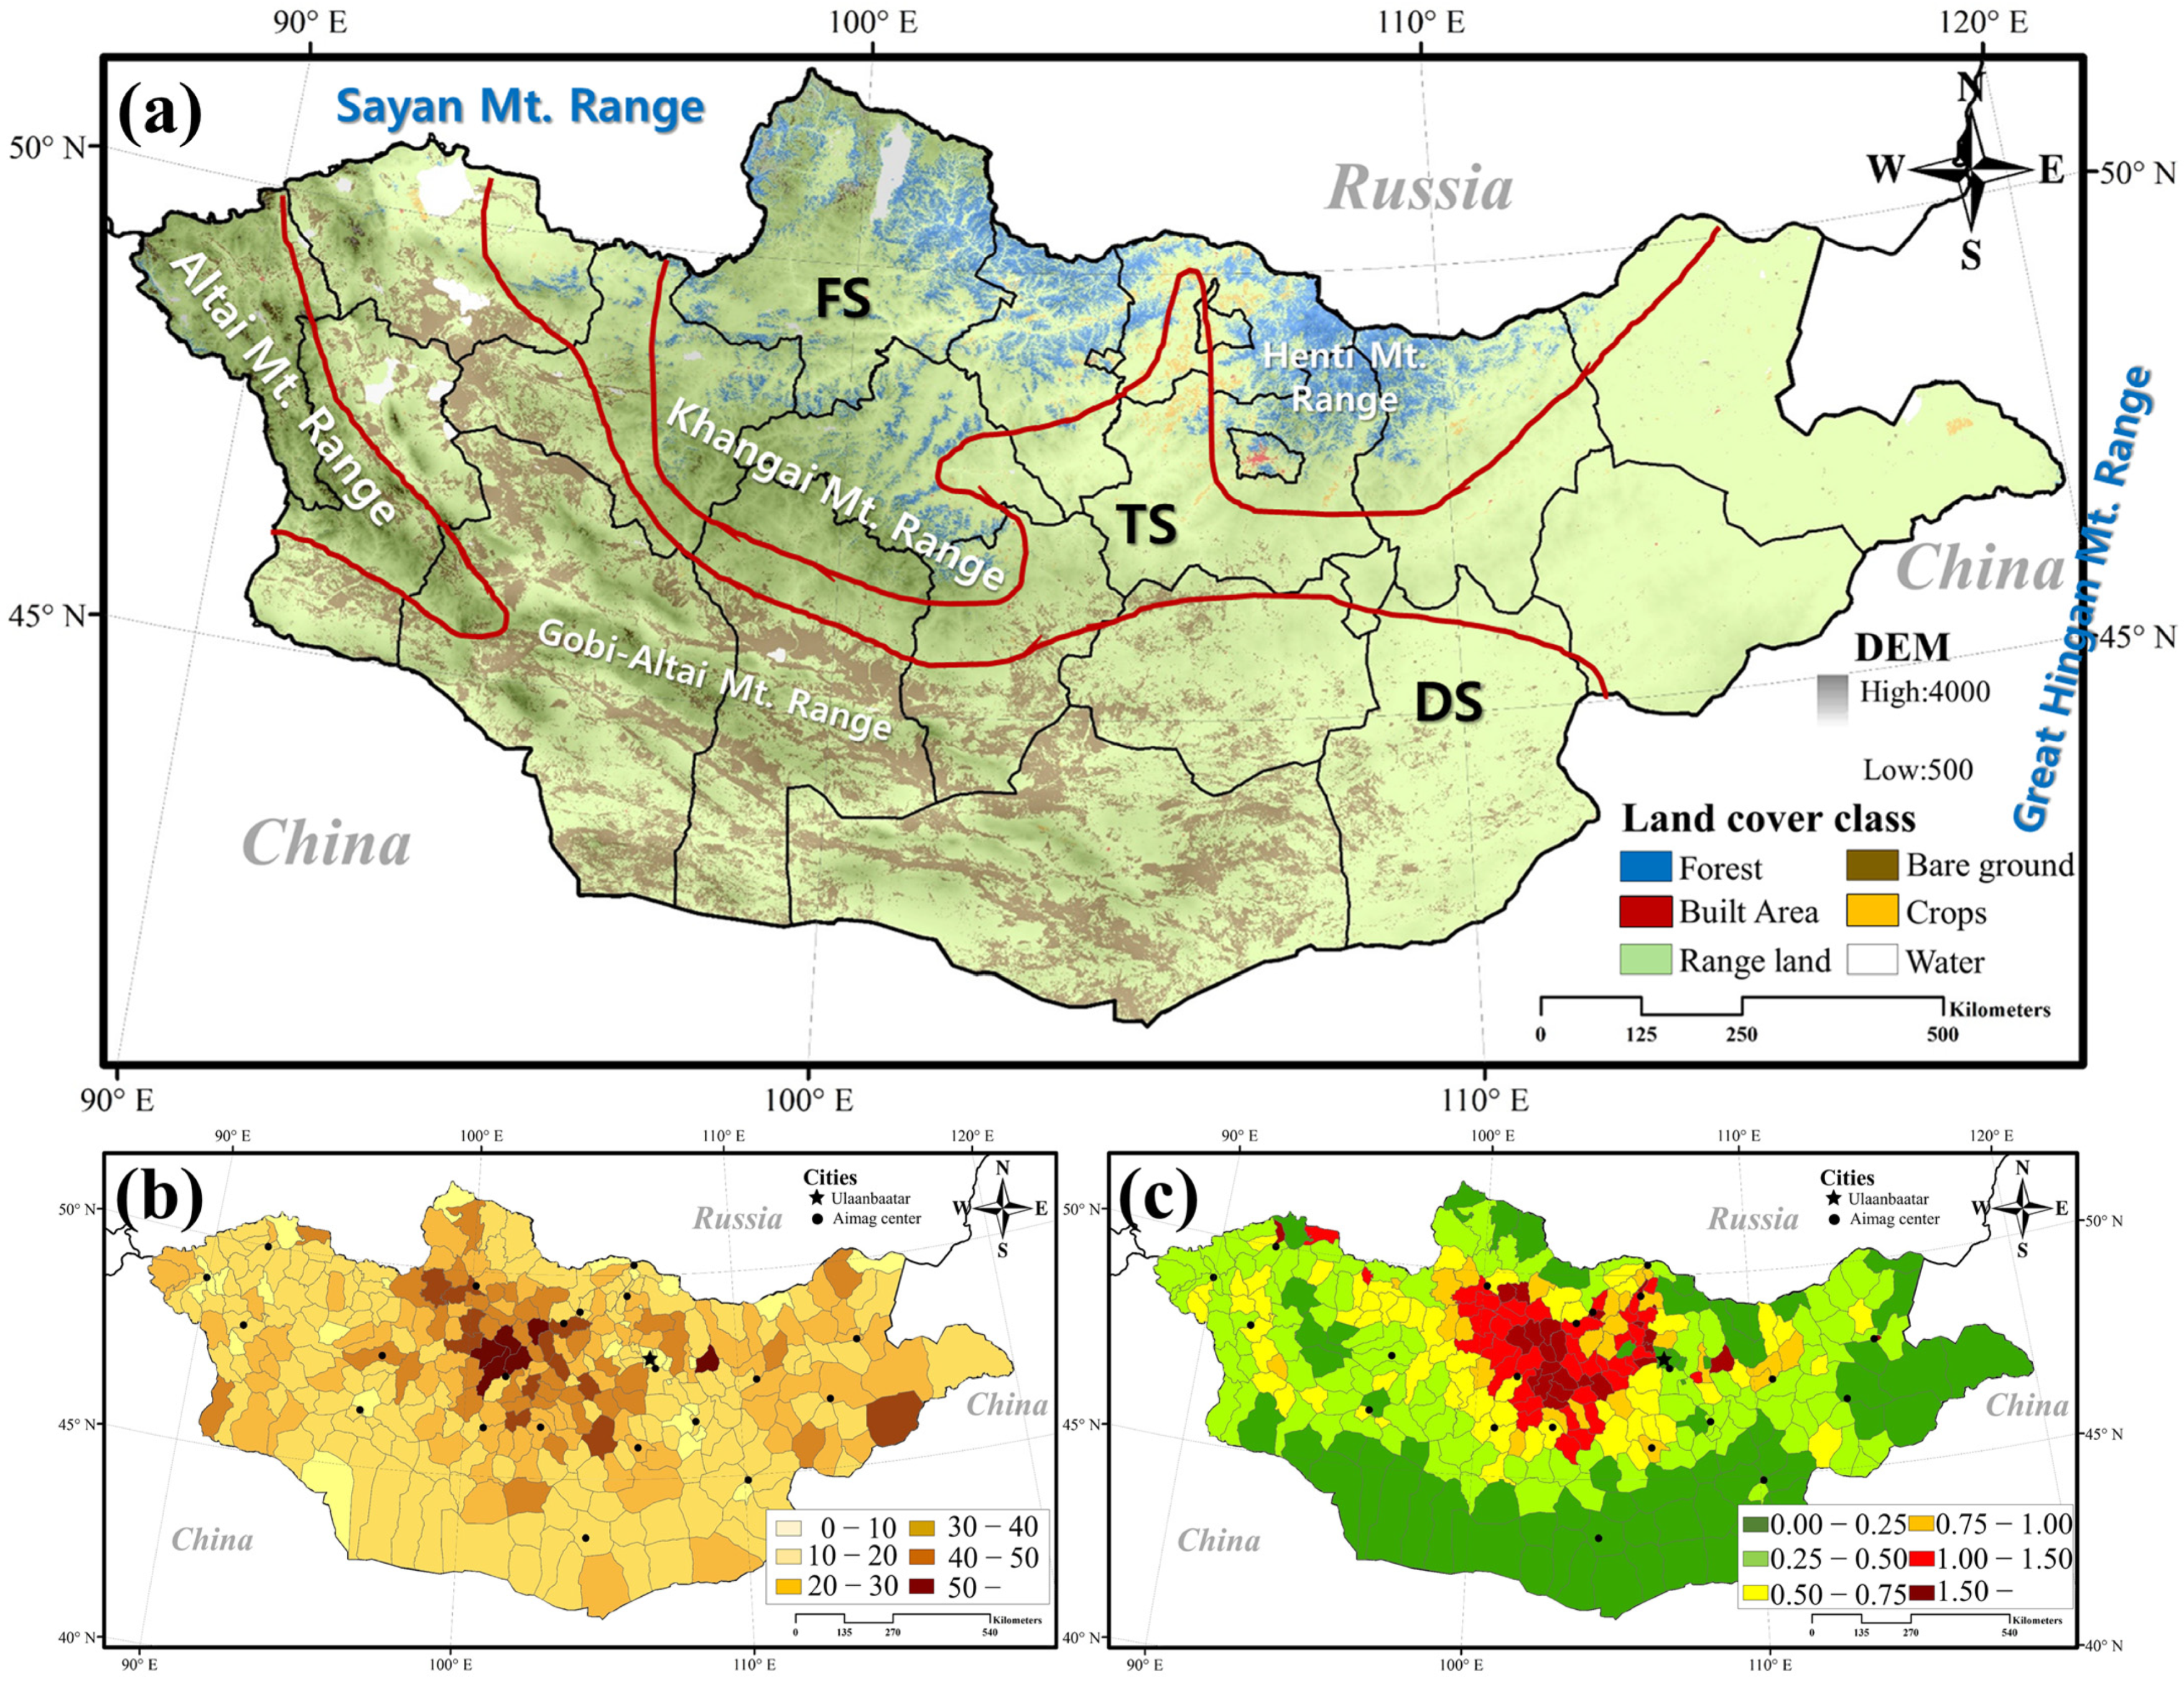
2.1. Climatic and Geodemographic Characteristics of the Study Area

Mongolia has a territory of 1.56 million km2 and encompasses diverse types of steppe land, with varied regional climates and topographic gradients [23] (Figure 1a). The country is composed of 21 aimags, which are divided further into about 330 soums; a soum is the lowest administrative unit from which livestock census data are available. Major mountain ranges (e.g., the Altai and Sayan Range in the northwest, the Khangai Range in the central region, and the Great Hingan Range in the east) intercept moisture, resulting in rain shadow regions in the west, south, and southeast [21]. Precipitation decreases gradually from the northern to the southern territory, where forest steppe, typical steppe, desert steppe, and desert occur in turn; vegetation production and biodiversity are positively correlated with precipitation [3,27,28].
Moisture in the Mongolian Plateau mainly comes from the North Atlantic Ocean and Western Pacific Ocean [29,30]. The relative contributions of the two oceans are different in the west and east, being greatly influenced by the North Atlantic and Western Pacific Oceans, respectively. Moisture originates from the Pacific Ocean flows westward to the plateau against westerly winds, entangled in the whirlpools of high and low pressures that occur; then, it migrates and disappears in mid-latitude Northeast Asia. The Great Hingan Mt. Range blocks moisture blowing in from the Pacific Ocean, forming a rain shadow on the southeast Mongolian Plateau on the west side of the mountain range. Despite its remote location, moisture from the North Atlantic Ocean moves as far east as Siberia and the drylands of East Asia with the aid of westerly winds through repeated precipitation and evaporation [31]. Moisture that flows mainly from the northwest of the plateau via Siberia is intercepted by the Altai, Sayan, and Khangai mountain ranges, forming huge rain shadows in Western and Southern Mongolia.
Figure 1. Maps of (a) Sentinel land cover of Mongolia (credit: Impact Observatory, Microsoft, and Esri) with major mountainous ranges and (b) livestock numbers (sheep unit, × 10,000) and (c) density (sheep unit per ha) in 2009. In (a), altitude (DEM) is expressed in shading, and the red lines are approximate boundaries between the desert steppe (DS), typical steppe (TS), and forest steppe (FS), modified from Tuvshintogtokh [32]. The black (a) and grey (b,c) lines are boundaries of aimag and soum districts, respectively.
Land 13 00391 g001
Livestock numbers increased from 25.7 to 76.9 million between 1992 and 2018 across Mongolia [22]. The livestock number and density were particularly high in the north-central region of Mongolia (Figure 1b,c). Since the early 1990s, two episodic countrywide Dzud events have occurred: one from 1999 to 2002 and one from 2009 to 2010, each resulting in more than 20% livestock mortality [8,33]. The catastrophic 1999–2002 Dzud called great attention to international, government, and individual herder efforts to improve pasture and livestock management and risk preparedness [11]. After the 1999–2002 Dzud, the national herd of Mongolia steadily grew until 2009 before dropping sharply with the 2010 Dzud. The period from 2003 to 2010 may therefore be considered a Dzud–recovery–Dzud cycle. This study focused on that period and tried to characterize the climatic and biotic factors regulating the recovery process and causing the 2010 Dzud. This temporal limit reduces complexity in dealing with multiple Dzud phenomena because each Dzud can be triggered by temporally different factors [1].

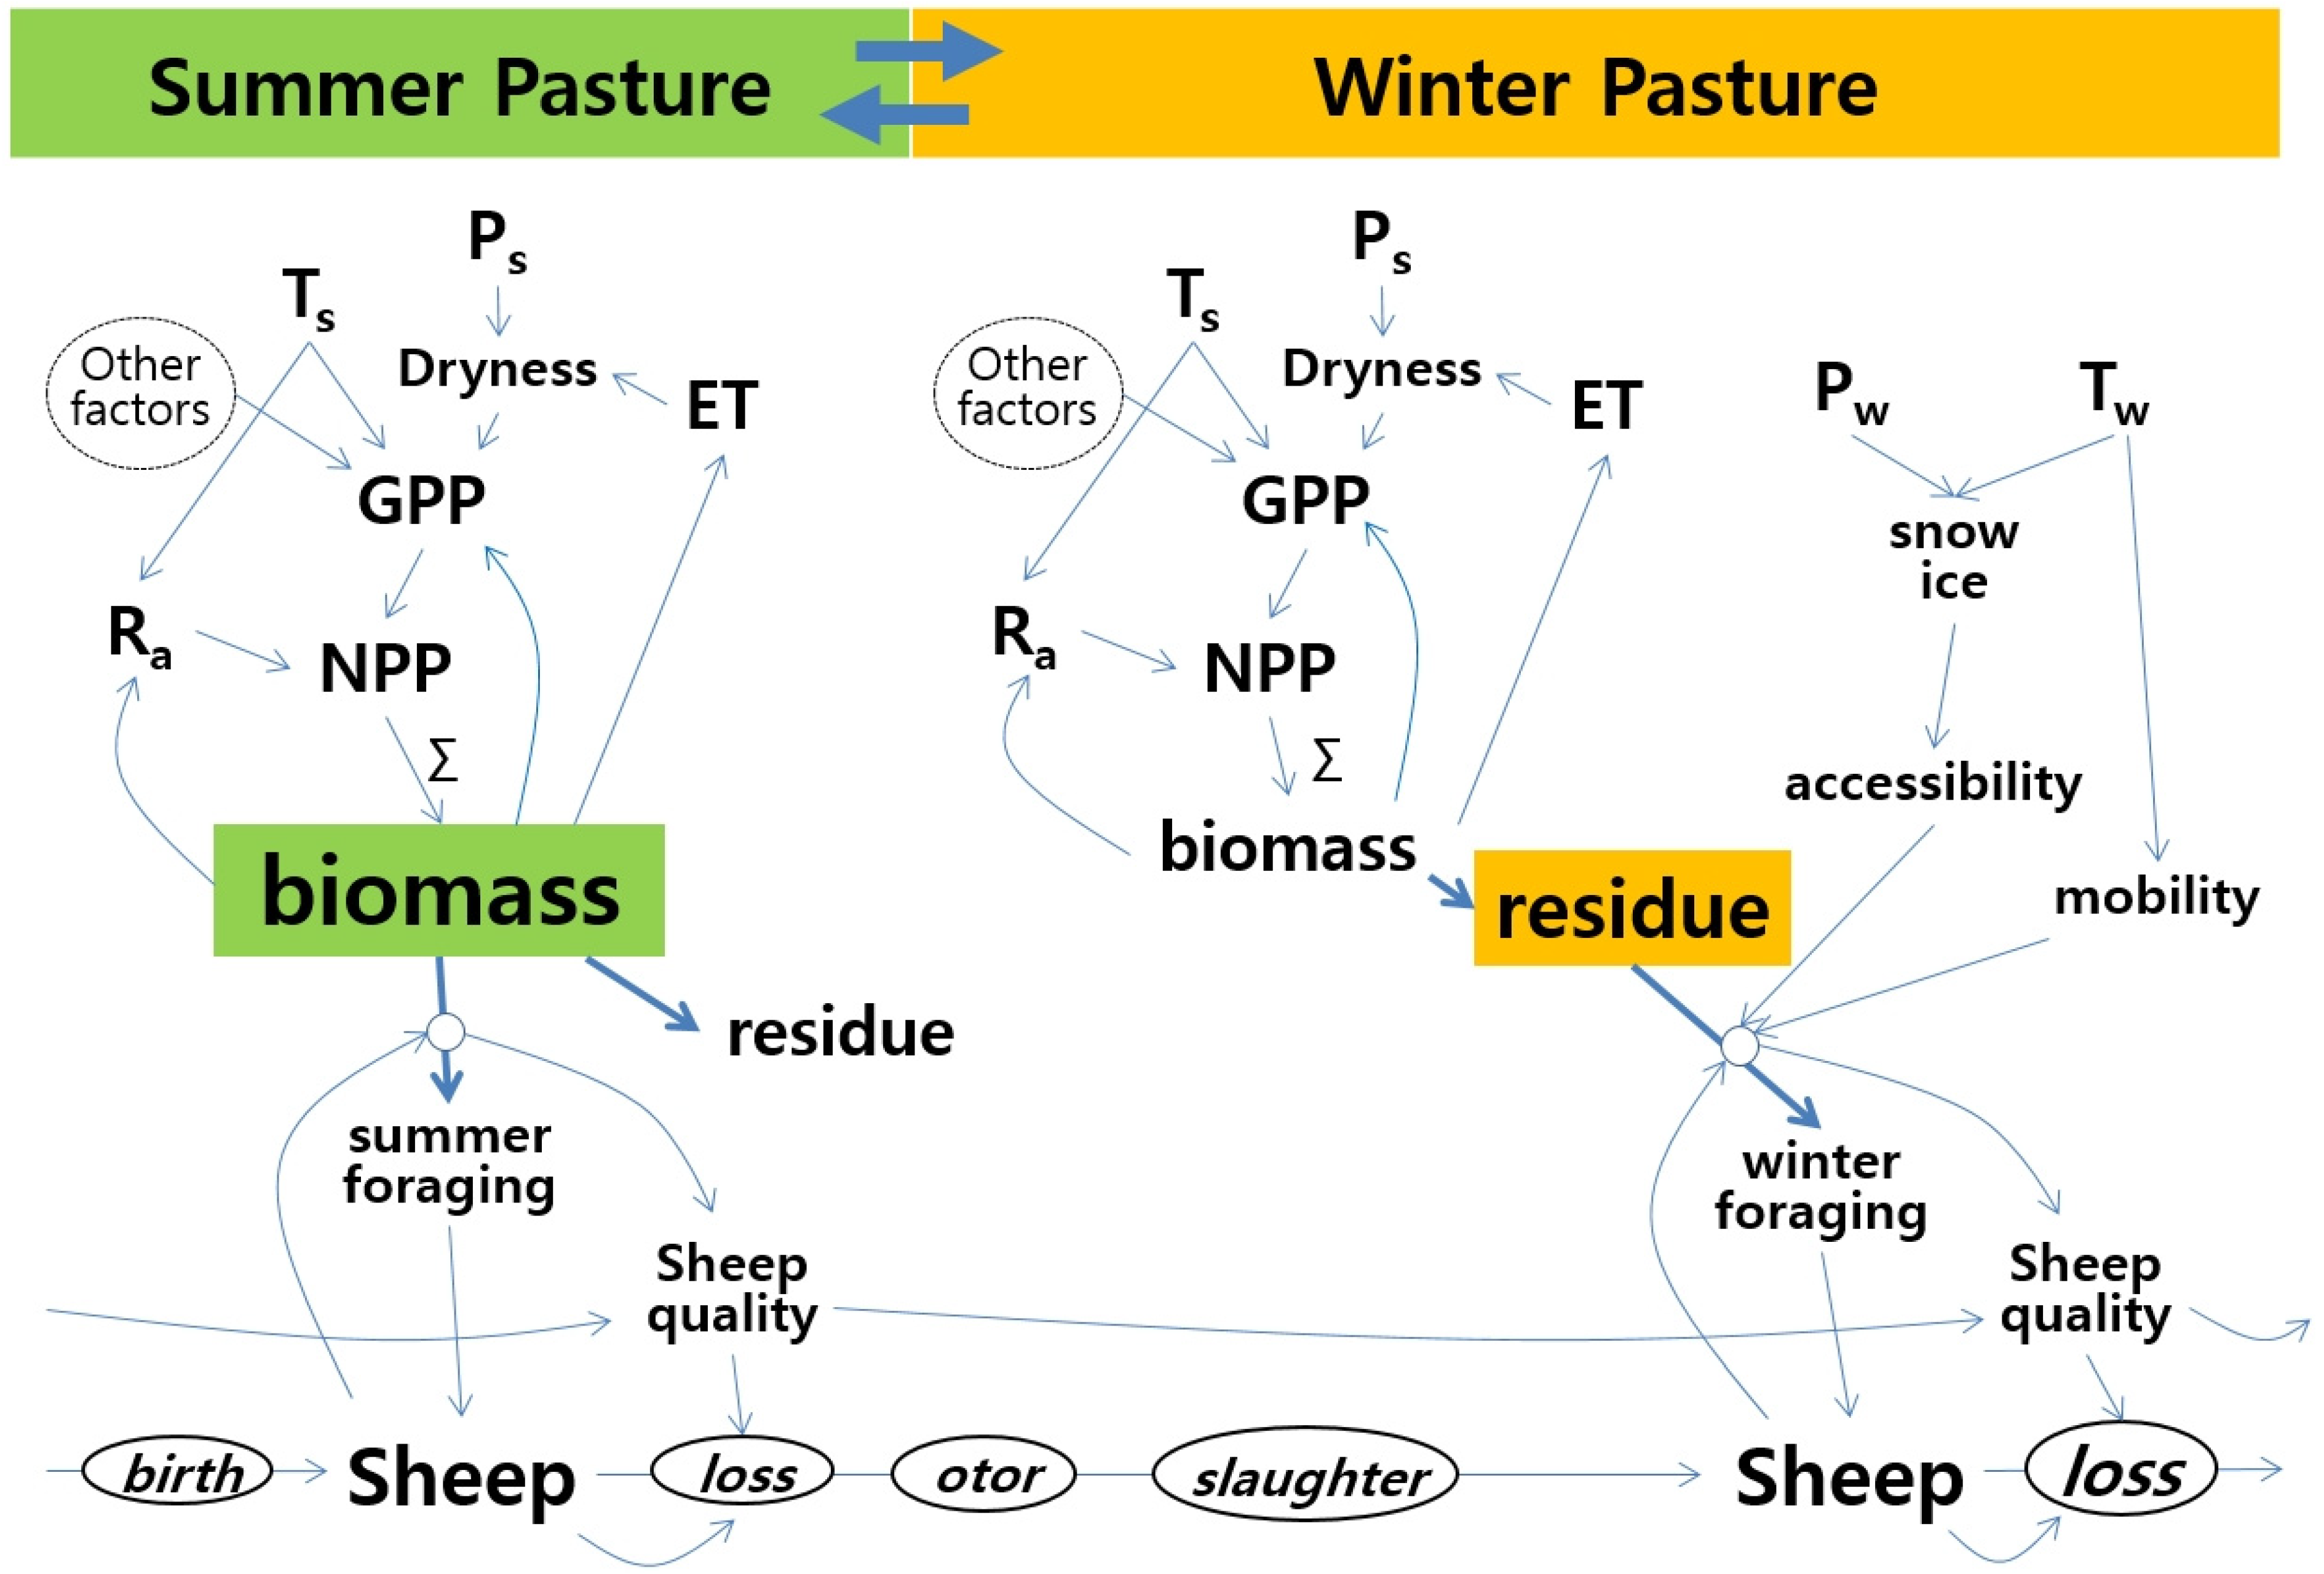
2.2. Developing a Nomadic Landscape Model: Climate–Vegetation–Livestock Interactions

Together, Mongolian summer and winter pastures make up a peculiar nomadic landscape where pastures feed livestock and livestock move seasonally between pastures [21]. Livestock fatten in summer pastures with fresh biomass and survive in winter pastures with standing dry biomass (i.e., residue). Summer temperature, precipitation, and aridity determine summer vegetation growth, while winter temperature and precipitation affect the accessibility of livestock foraging to the residue forage in winter pasture [1]. Here, deep snow or ice cover prevent livestock from foraging the residue in winter pasture (i.e., low accessibility), and cold stormy weather can restrict the foraging range nearby winter shelter (i.e., low mobility).
Winter mortality and summer reproduction are the primary causes of interannual changes in livestock numbers in Mongolia. With favorable winter and summer conditions, reproduction (i.e., birth) exceeds mortality (i.e., loss), causing net livestock increase. However, in harsh winter conditions, sometimes following poor summer pasture conditions, livestock loss is high and usually peaks in mid or late winter (i.e., January or later); this may last until the spring gestation period, resulting in a low birth rate. Emergency migration, otor, is a rapid and sometimes long-distance movement of herders and their pastoral household in autumn to seek better pastures or to flee bad weather and poor foraging in a coming Dzud [11,34]. Because of the complex social and administrative factors that influence this migration [34], it is difficult to predict the timing, magnitude, and destination of otor. Hence, this study excludes the otor effect in our analyses. Though slaughtering (i.e., slaughter) is performed for meat consumption and the income of local herders, it is marginal for herders who live remote and obtain major income from dairy and cashmere productions. By varying the slaughter rate for each livestock, herders use slaughter to increase goat numbers relative to sheep. We summarize the key features on nomadic pastoralism described above into a simplified schematic landscape model suggested, Figure 2. The schematic model was designed to illustrate the climate–vegetation–livestock interactions occurring in summer and winter pastures and their seasonal connectivity through nomadic movements at the level of the herder’s nomadic landscape in Mongolia.
The seasonal perspectives connecting summer and winter conditions were used in earlier studies investigating Dzud phenomena [9,10,16]. By combining the seasonal perspective with the spatial perspective of separating and connecting the seasonal pastures, our model provides a more mechanism-oriented explanation on the natural seasonal mechanisms inherent in nomadic landscapes. The schematic model describes key state variables (i.e., biomass, residue, sheep), control variables (e.g., dryness, accessibility, mobility, sheep quality), and external forcing variables (T and P). Additionally, the model distinguished and expressed two explicitly flux variables (otor and slaughter) that are affected by socioeconomic factors such as governance or markets. The schematic model provides a useful framework to select variables that can be retrieved from satellite data and, hence, to test the applicability of the multi-sensor satellite data for investigating key factors in livestock number change and Dzud occurrence.

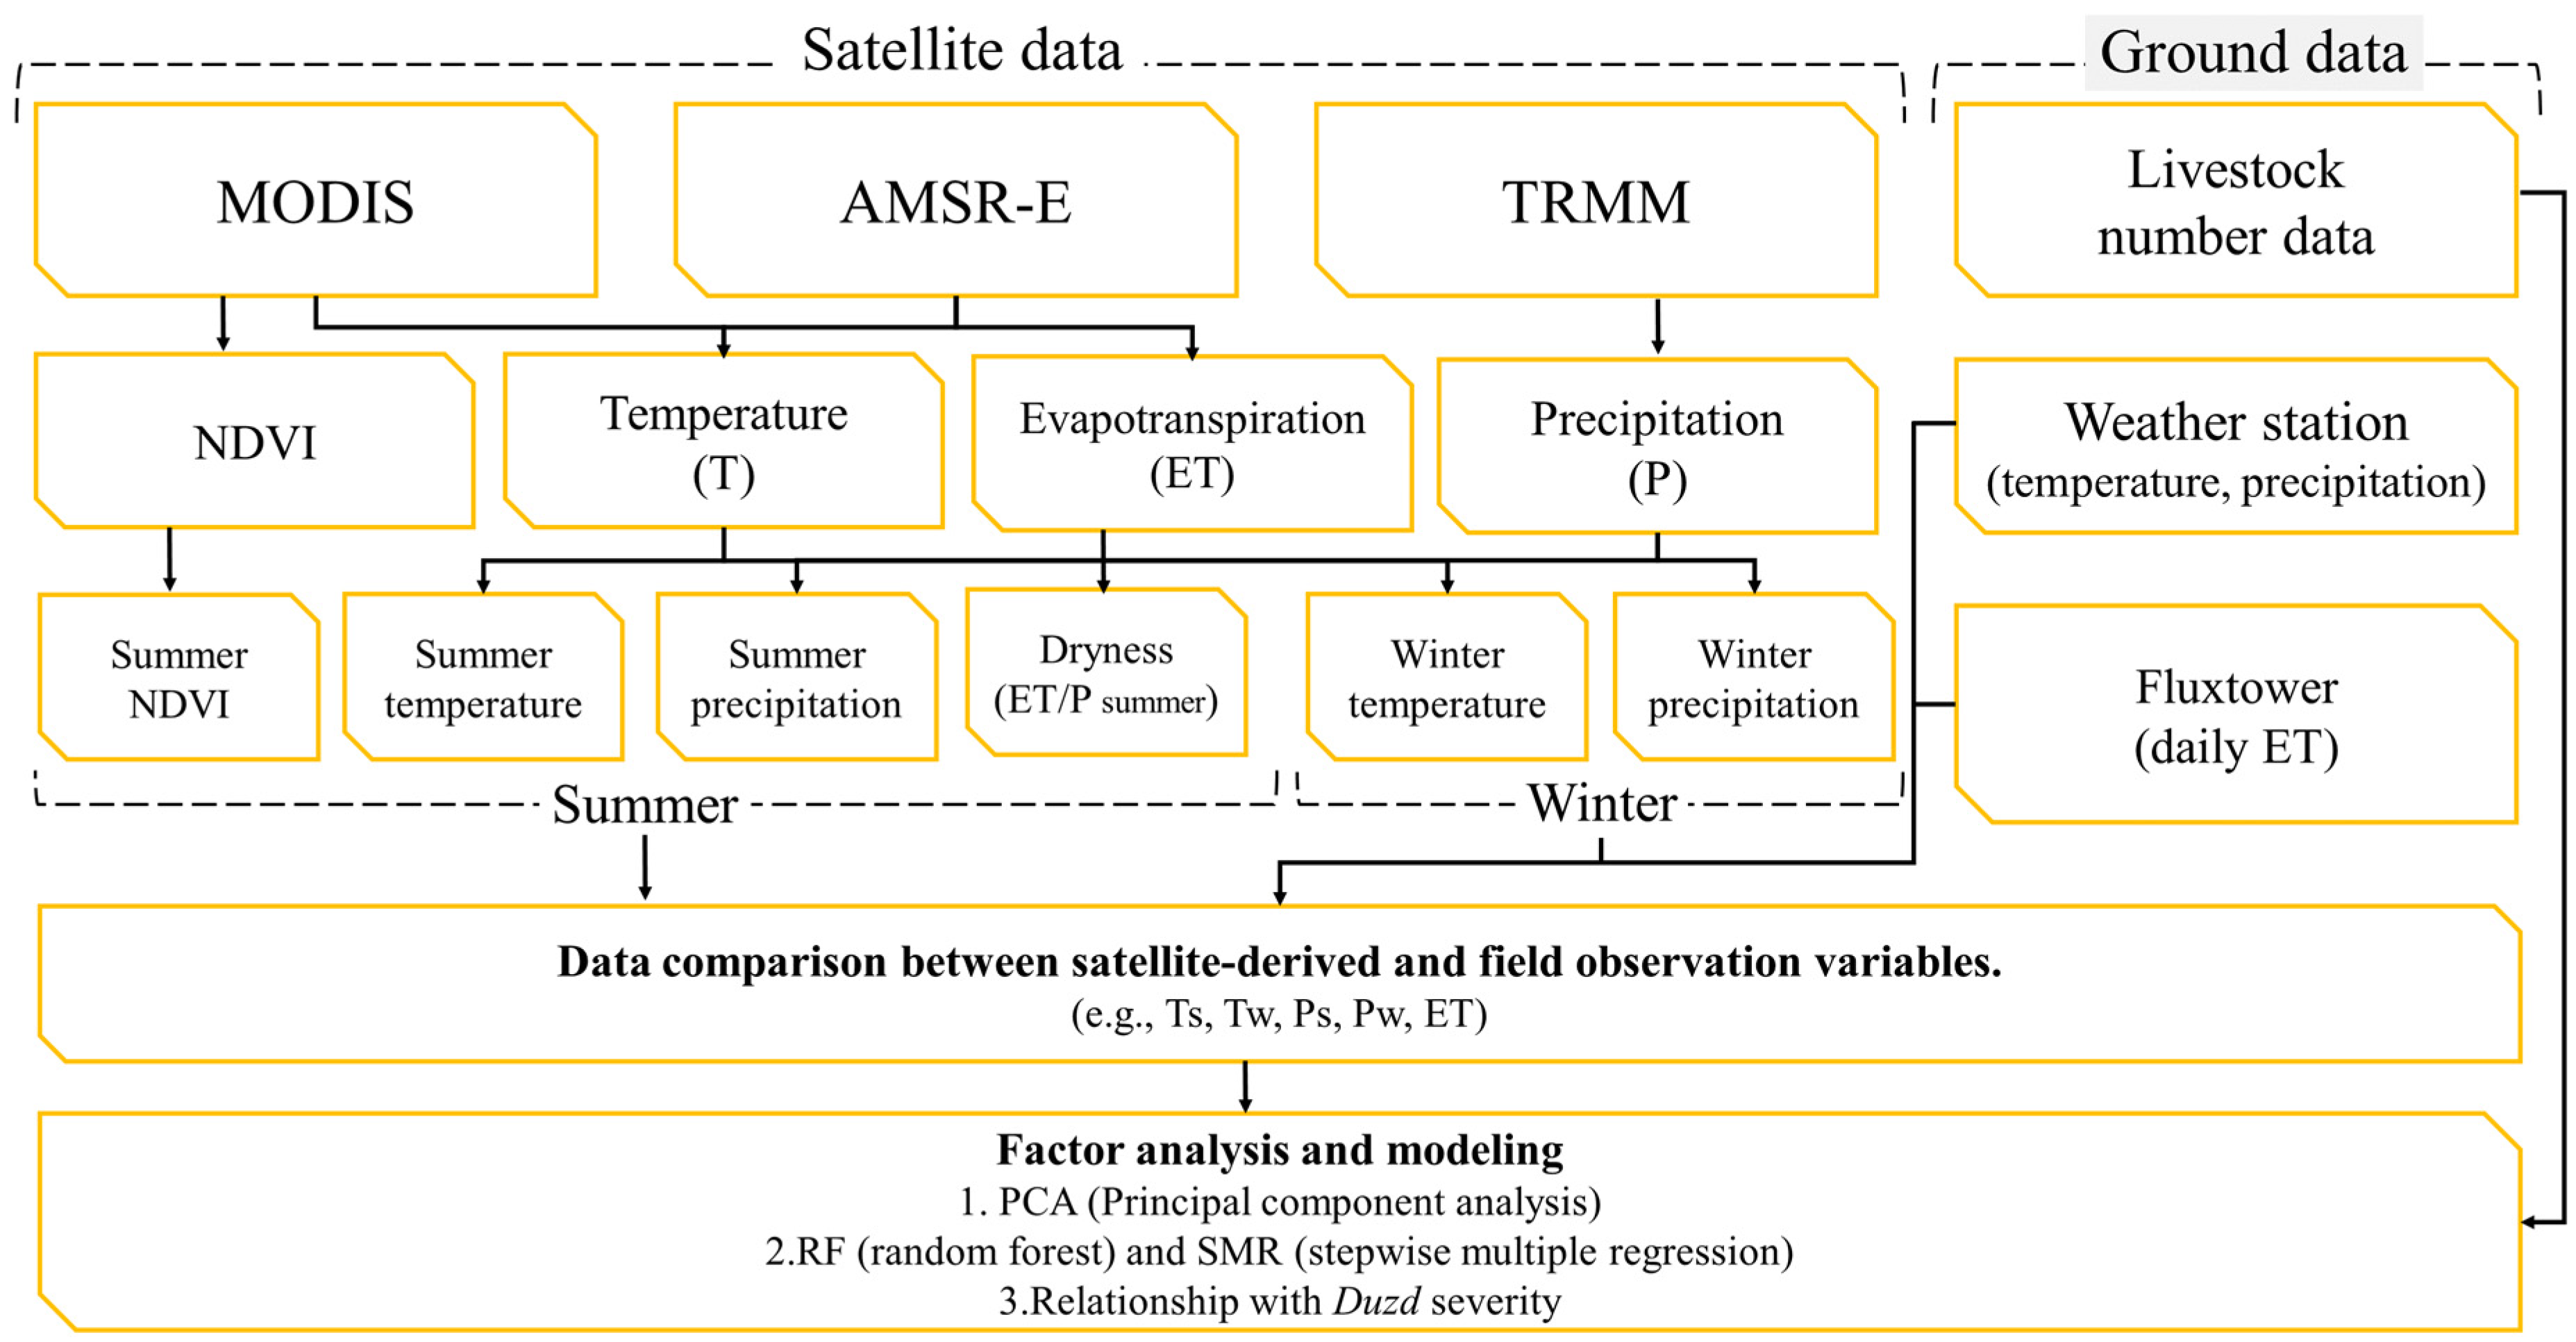
2.3. Selection of Variables and Multi-Sensor Satellite Data Productions

For the statistical analysis on the natural factors of livestock number change and Dzud occurrence between 2003 and 2010, we selected a few variables from the state, control, and forcing variables from the schematic model. Because the flux variables were either implicitly reflected in the state variables (e.g., GPP, NPP, foraging), or the target variables of this study (i.e., birth and loss), or socioeconomic variables (i.e., otor and slaughter), they were not considered in this study. Consequently, six explanatory variables were selected that could be produced from satellite data: four summer variables (biomass, dryness, Ts, and Ps) and two winter variables (Tw and Pw). Then, the variables were used to explain changes in livestock numbers (sheep).
Summer temperature (Ts) and precipitation (Ps) were selected because of their widespread influences on drought, vegetation, and livestock. Dryness was used in the multivariate analyses to account for the effects of drought. Dryness was defined as a ratio between summer ET and Ps. Summer biomass was the only biotic driver selected as a state variable aggregating other carbon flux processes. The model indicated that winter temperature (Tw) and precipitation (Pw) are key climatic variables influencing the accessibility and mobility of winter foraging resources. Because winter residue is closely correlated with summer biomass, we did not include it as a potential driver.
Various datasets were collected for study between 2003 and 2010, which include the national census data of livestock numbers from 337 soums in Mongolia [22]; the 1 km 16-day Normalized Difference Vegetation Index (NDVI) from MODIS [35] as a proxy of biomass; the 25 km monthly precipitation (P) data from the Tropical Rainfall Measuring Mission (TRMM) (Goddard Distributed Active Archive Center, NASA) [36] for preparing Ps and Pw; the 5 km daily mean temperature for calculating Ts and Tw [20,37]; and the 1 km daily evapotranspiration (ET) from the Moderate Resolution Imaging Spectroradiometer (MODIS) and Advanced Microwave Scanning Radiometer for the Earth Observing System (AMSR-E) [24,38] (Table 1). Both Ps and ETs were used for calculating dryness (ET/P). Additionally, monthly temperature and precipitation observed at 67 national weather stations in Mongolia (National Agency Meteorology and Environmental Monitoring) were used to evaluate uncertainties in satellite-derived temperature and precipitation data. Furthermore, gap-filled daily ET observed at the SKT flux tower in Mongolia [39] was used to validate our satellite-determined ET. The data streams for production, evaluation, and analysis are described in Figure 3.

2.3.1. Livestock Census Data

The national census data of livestock numbers contains soum-level livestock numbers for five major livestock species (i.e., sheep, goat, cow including yak, horse, and camel). In the present study, goat, cow, horse, and camel numbers were converted to heads of sheep (i.e., sheep unit) at conversion rates of 0.9, 6.0, 6.6, and 5.7, respectively [40]. Then, the percent change in livestock numbers was calculated for each soum (Equation (1))
S h e e p i j = S h e e p i S h e e p j S h e e p j × 100 ( % )
where Sheep is the soum-level livestock number in sheep units; subscripts i and j are the current and previous years, respectively; S h e e p i j is the percent change in livestock numbers from the previous year (Sheepj) to the current year (Sheepi).

2.3.2. Multi-Sensor Satellite Data

The collected satellite data differ in their temporal and spatial scales (Table 1). For the soum-level analysis, all satellite data were spatially and temporally aggregated for each soum district and for summer (June–August) and winter (December–February). In our multivariate statistical analyses, the seasonal variables of the previous year were related to the rate of change in livestock numbers between the current and the previous years.
The Aqua MODIS Atmospheric Profile Product (MYD07) was used to measure the daily mean temperature [41]. MYD07 records nighttime and daytime air temperature at multiple pressure heights, of which the lowest pressure–level air temperatures were averaged to the daily mean temperature [37]. For cloudy days, AMSE-E surface brightness temperature was used as ancillary information to produce nighttime and daytime temperatures [38].
Continuous daily ET is a synthetic product calculated using both optical MODIS products and microwave AMSE-E surface brightness temperature, both of which are onboard sensors on the Aqua satellite. Both of the sensors provide data necessary for retrieving input variables for a modified Penman–Monteith equation for estimating instantaneous ET at Aqua overpass time, which is temporally extrapolated to daily ET [42,43]. For cloudy days, AMSE-E brightness temperature was used to prepare air and dew point temperatures [24]. Incoming solar radiation was retrieved with a simple atmospheric radiative transfer model based on MODIS cloud cover information [42]. Total summer ET was divided by summer precipitation to derive a proxy of dryness. Finally, summertime Aqua MODIS NDVI was accumulated and used as a proxy for summer pastureland biomass [44]. Because a robust biophysical algorithm for grass biomass was not yet developed and tested in Mongolia, we adopted the empirical results of [45], which showed a statistically significant linear relationship between harvested biomass and accumulated NDVI for Sahel, Africa.
Accordingly, six input variables were prepared for multivariate analyses: four summer variables, NDVI (NDVIs), temperature (Ts), precipitation (Ps), and dryness (ET/Ps); and two winter variables, temperature (Tw) and precipitation (Pw). Then, the variables were converted to z-scores (Equation (2)) to standardize ranges and units. Due to gaps in either TRMM precipitation data or records of livestock numbers, our multivariate analyses were conducted for only 291 out of 331 soums.
z = x x m σ
where z is the z-score; and xm and σ are the mean and standard deviation of the satellite-driven variable x for the study period, respectively.

2.4. Multivariate Analyses of Regional Factors Regulating Changes in Livestock Numbers

In the present study, factors regulating regional changes in livestock numbers were evaluated with multivariate statistical analyses using livestock census and satellite remote sensing data. The percent change in livestock numbers (Equation (1)) and multiple independent variables (converted to z-scores, Equation (2)) were prepared for each soum to implement the PCA, SMR, and RF. We tested whether the key variables selected from the schematic model (Figure 2) can successfully account for the soum-level interannual changes in livestock numbers. Principal component analysis (PCA), stepwise multiple regression (SMR), and a machine learning method, random forest (RF), were used for the tests. We used a PCA algorithm to obtain an appropriate representation of the predictors by identifying the relationships between the explanatory variables and environmental characteristics with respect to year and livestock mortality. We carried out the PCA analysis using the prcomp function of GNU R (ver. 4.0.5).
SMR has been utilized in many ecological studies to identify significant factors and their relative importance. Though bias and inconsistency were pointed out for the use of SMR in ecology and behavior studies [46], SMR is regarded as a popular data-mining tool that fits the data well in-sample but performs poorly out-of-sample [47]. In the present study, we applied SMR to examine significant factors influencing soum-level changes in livestock numbers within the samples from 2003 to 2010. The prepared explanatory variables were investigated individually for insertion into or removal from the regression model to obtain an adequate minimal model that contained the fewest number of predictors that were significant only at some prescribed probability levels. The significance levels were set at 0.05 and 0.1 for the insertion and removal of each independent variable, respectively. A least squares procedure, IMSL_STEPWISE in IDL (version 8.0, ITT Visual Information Solutions), was used for the SMR analyses.
Recently, in the field of livestock vulnerability, machine learning algorithms are also used to identify the importance of and understand nonlinear relationships between multiple explanatory variables. Ye et al. [48] tried to quantify livestock vulnerability to snow disasters in the Tibetan plateau using generalized additive models, random forest, and boosted regression trees, in which RF showed the smallest prediction error. RF is designed to prevent the overfitting of a single decision tree (DT) model by ensemble results of multiple DT created through bootstrap sampling and variable bagging [49]. RF results voted on by multiple DTs allow the RF to be a more stable and accurate ruleset than any independent DT [50]. In most machine learning models, including the RF model, it is difficult to identify details of model algorithms. However, the importance of each explanatory variable can be identified with an output parameter, called increasing node purity, in the RF model. In this study, the RF modeling was conducted using the randomForest (RF) package of GNU R (ver. 4.0.5).

3. Results

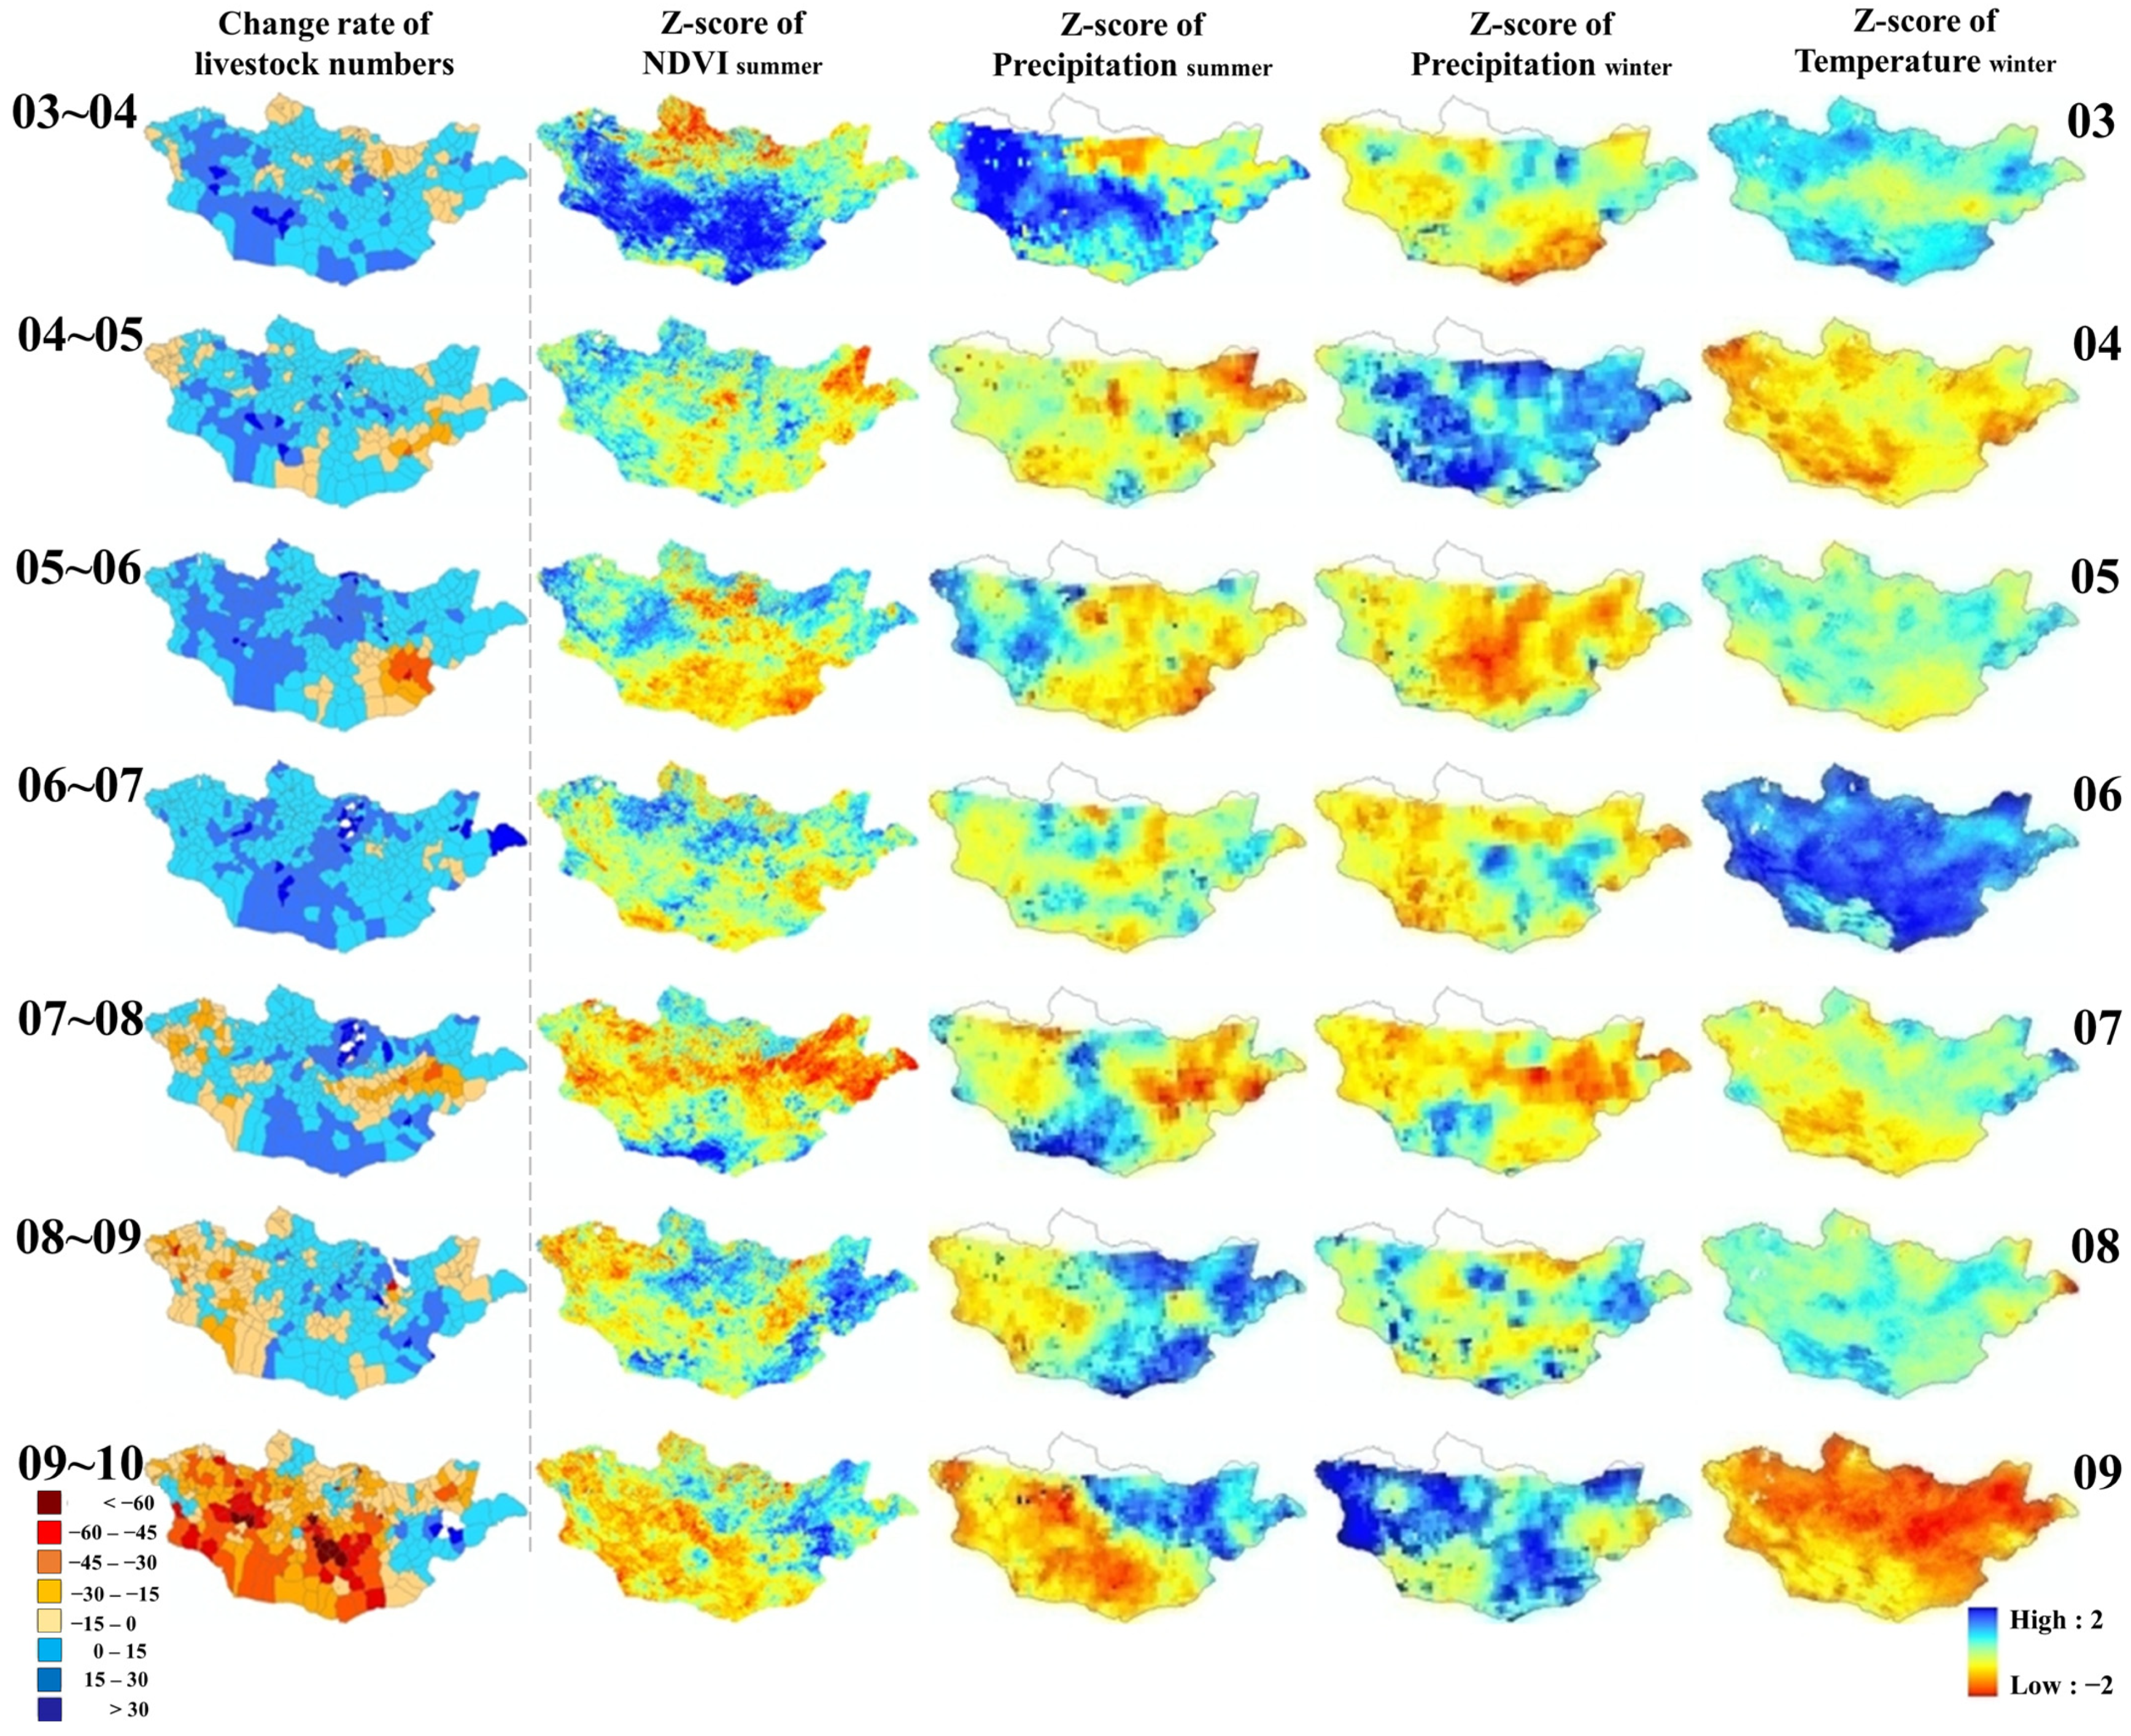
3.1. Temporal and Spatial Variations in Livestock and Environmental Variables

Before the statistical analysis, the satellite-driven climate and ET variables were evaluated against ground observations. All variables showed statistically significant (p < 0.001) linear relationships with ground observations (Table 2), which confirmed the applicability of the satellite-derived climate and ET data in reflecting their seasonal and interannual variability found by ground observation.
The percent change in livestock numbers and various explanatory variables showed distinct spatial and interannual variations from 2003 to 2010 (Figure 4). In particular, the 2009–2010 Dzud was countrywide except for Southwest Mongolia (see the last map of the first column in Figure 4), resulting in a wide range of relative change rates from −93% to +125% across 337 soums. In 2010, livestock numbers decreased in 279 soums (83%) but increased in only 58 soums (17%). In addition to the countrywide Dzud event in 2009–2010, considerable region-scale livestock reductions also occurred in the east during 2005–2006 and 2007–2008 and in the west during 2008–2009. On the other hand, the lumped spatial patterns of livestock increases and decreases are clear in the first column of Figure 4, suggesting that certain regional factors would play important roles in regulating the change. For example, negative z-scores in summer NDVI and precipitation (the second and third columns in Figure 4) were well coincident with the negative percent change of livestock numbers.

3.2. Factors Influencing Changes in Livestock Numbers

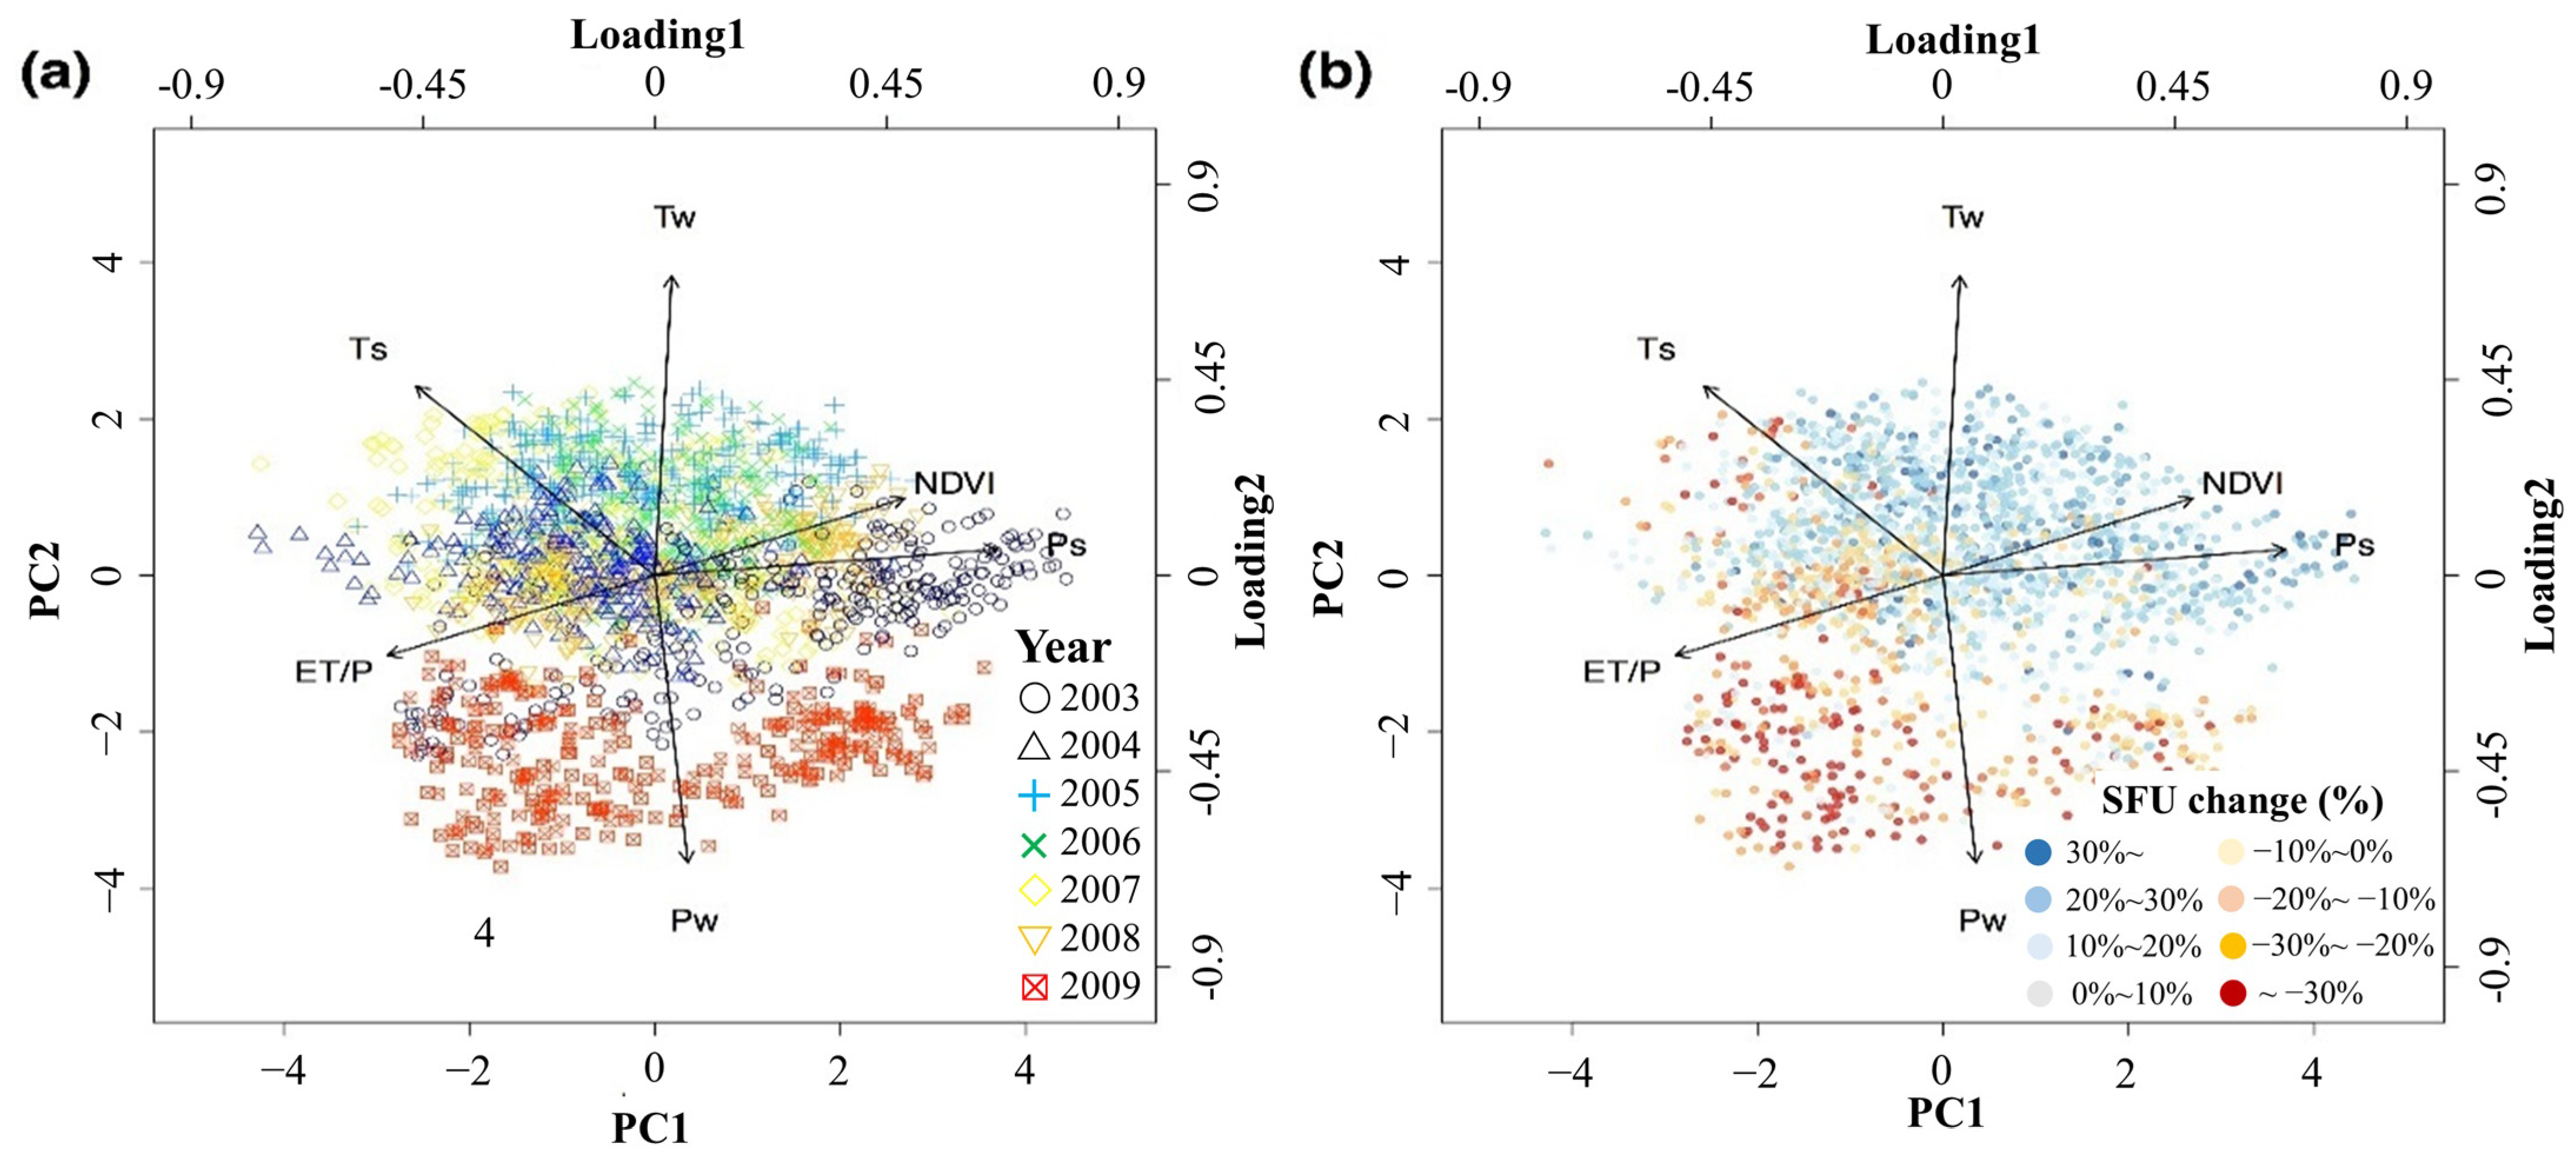
3.2.1. Principal Component Analysis (PCA)

The primary (PC1) and secondary (PC2) components in the PCA explained 39.1% and 25.6% of the total variance, respectively, or 64.7% of the variation in the data. The tertiary component (PC3) explained 11.5% of the variance but had an eigenvalue smaller than one. PC1 was strongly positively correlated (i.e., |Loading| ≥ 0.4) with NDVIs and Ps and negatively with Ts and dryness. PC2 was strongly positively correlated with Tw and Ts and negatively with Pw. Thus, a high PC1 value indicates viable vegetation growth and a high PC2 value indicates a warm and dry winter.
In the score plot, we highlighted annual changes in climate conditions in each soum (Figure 5a). The annual differences were captured well by PC2. In 2009 (i.e., 2009–2010), when a particularly severe Dzud occurred, PC2 was low for all soums, which indicates a cold winter with heavy snowfall. In contrast, the years with low livestock loss such as 2005 and 2006 had a high PC2. These patterns are apparent in the score plot colored according to the rate of livestock loss (Figure 5b). High livestock loss (i.e., change < −30%) was observed where PC1 and PC2 were both negative (i.e., cold and snowy winter with low vegetation) and vice versa. Livestock loss occurred when either PC1 or PC2 was negative, although it was greatest when both components were negative.

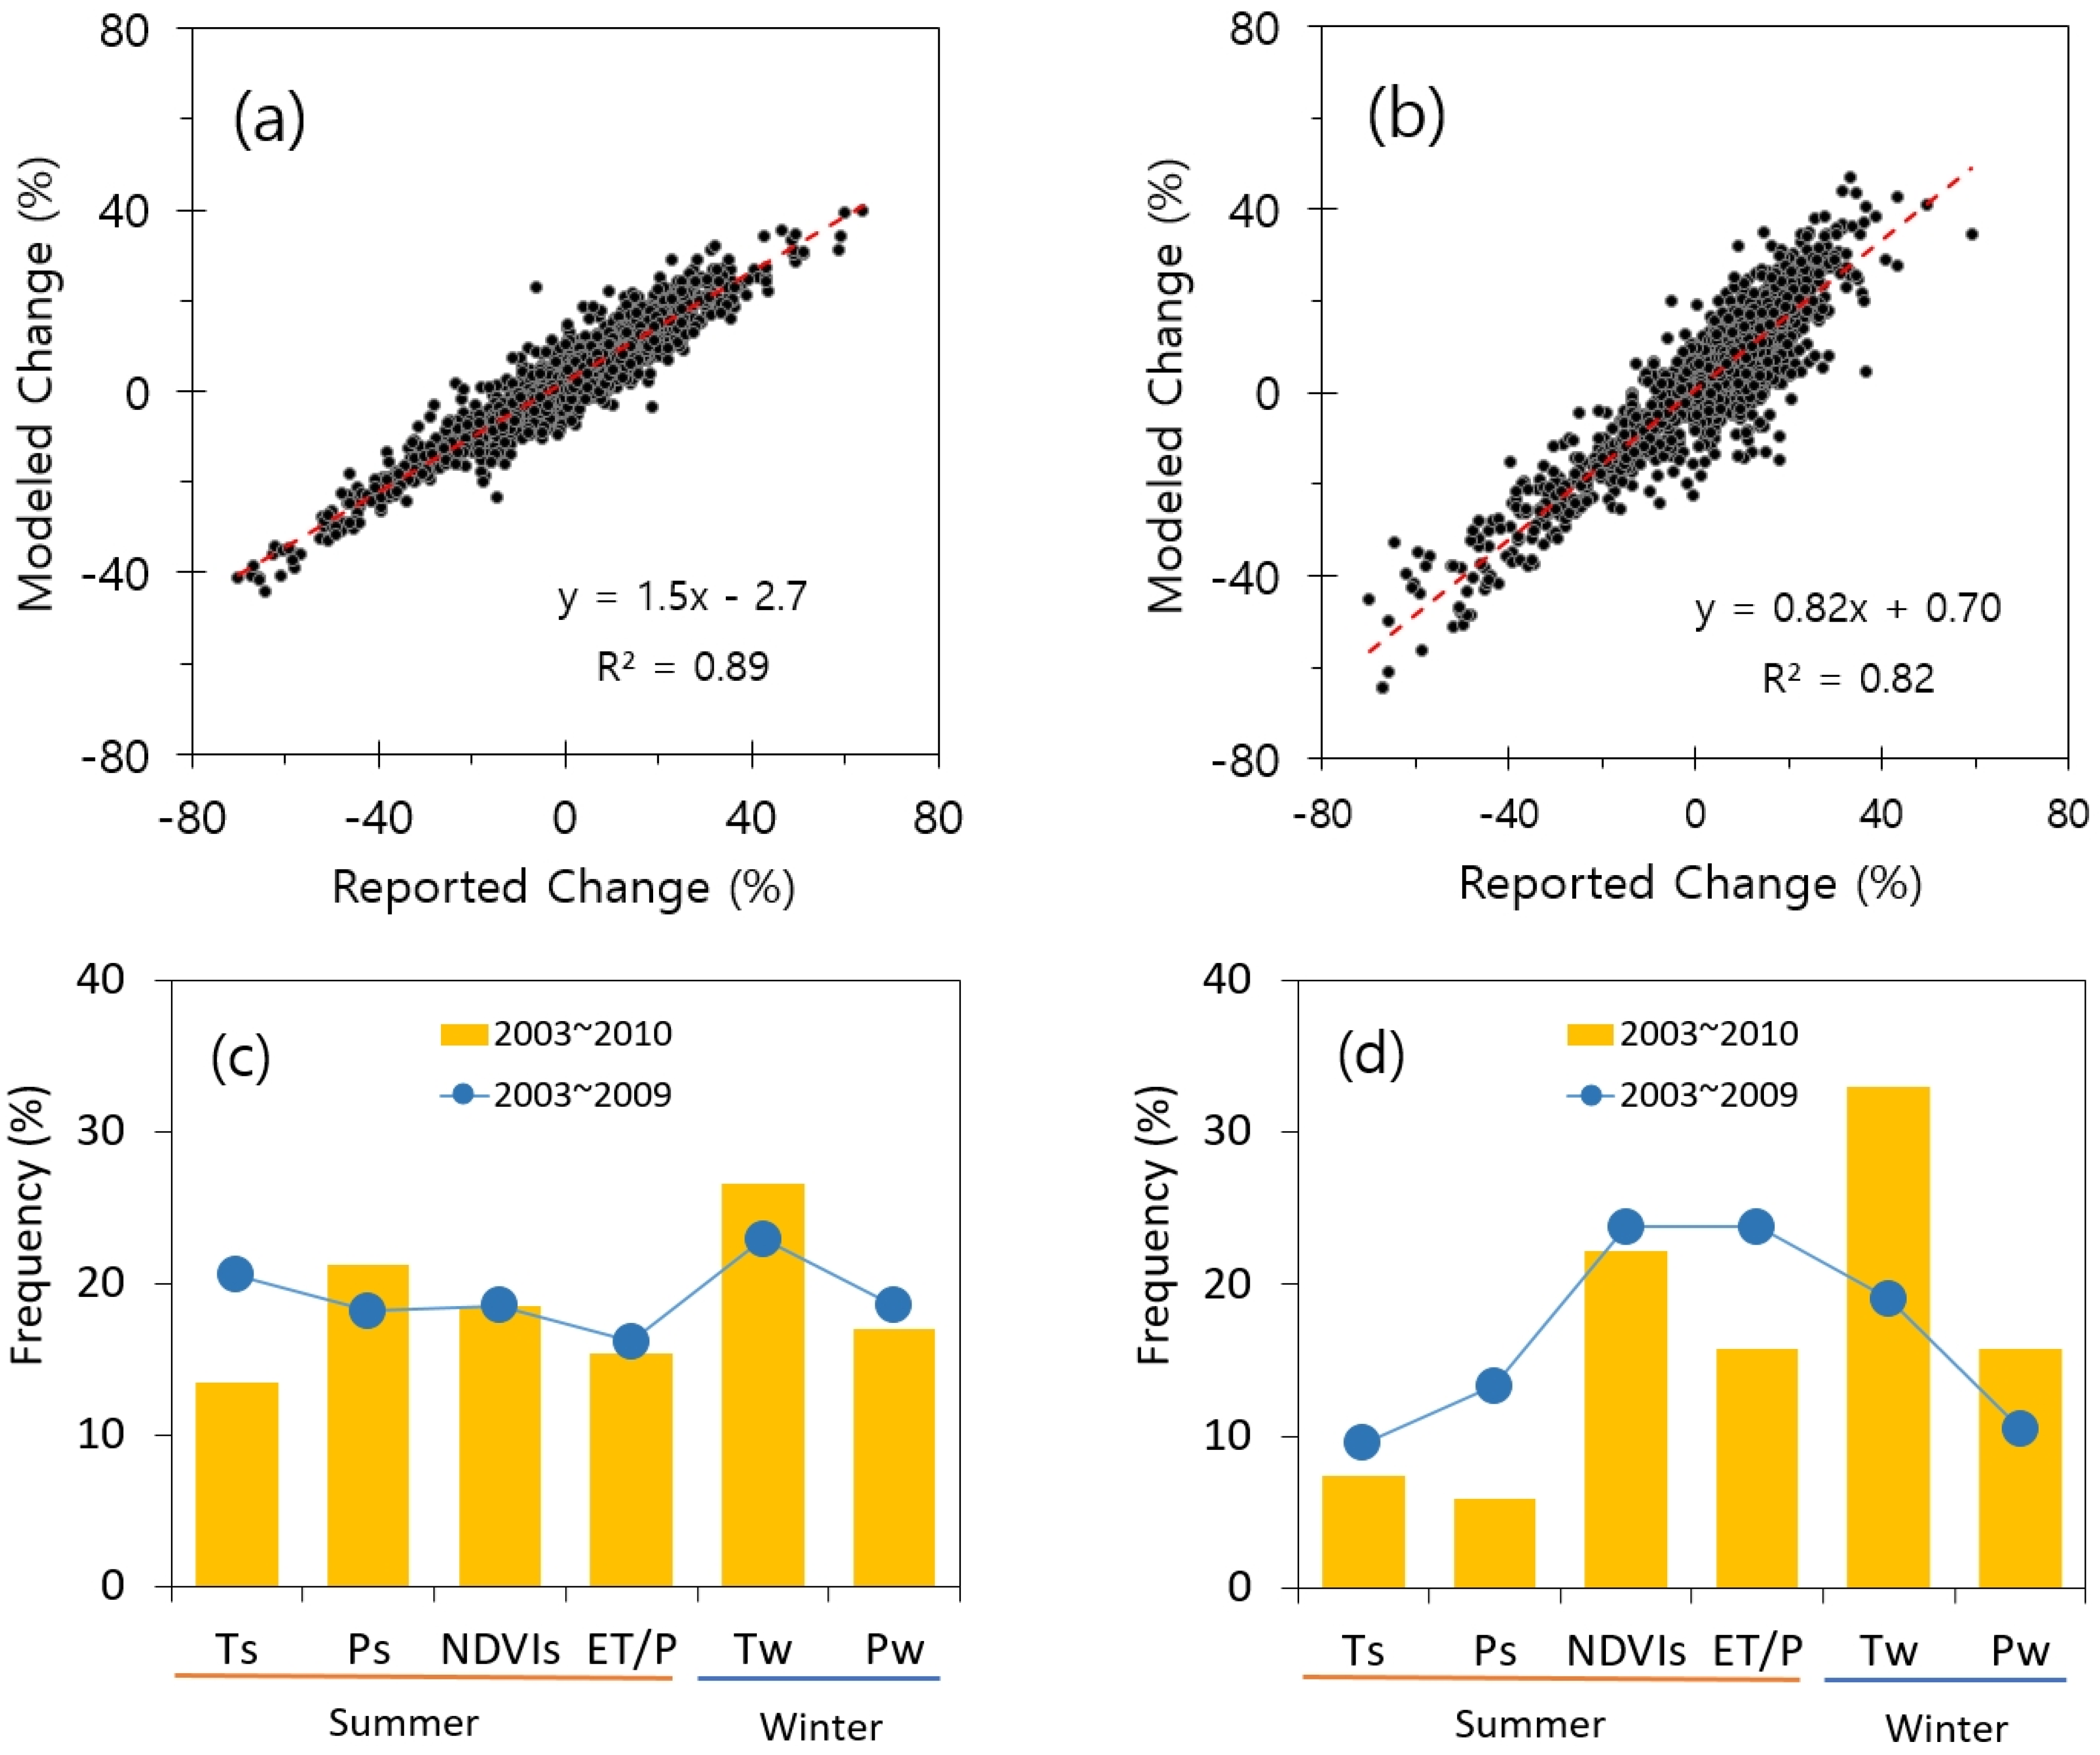
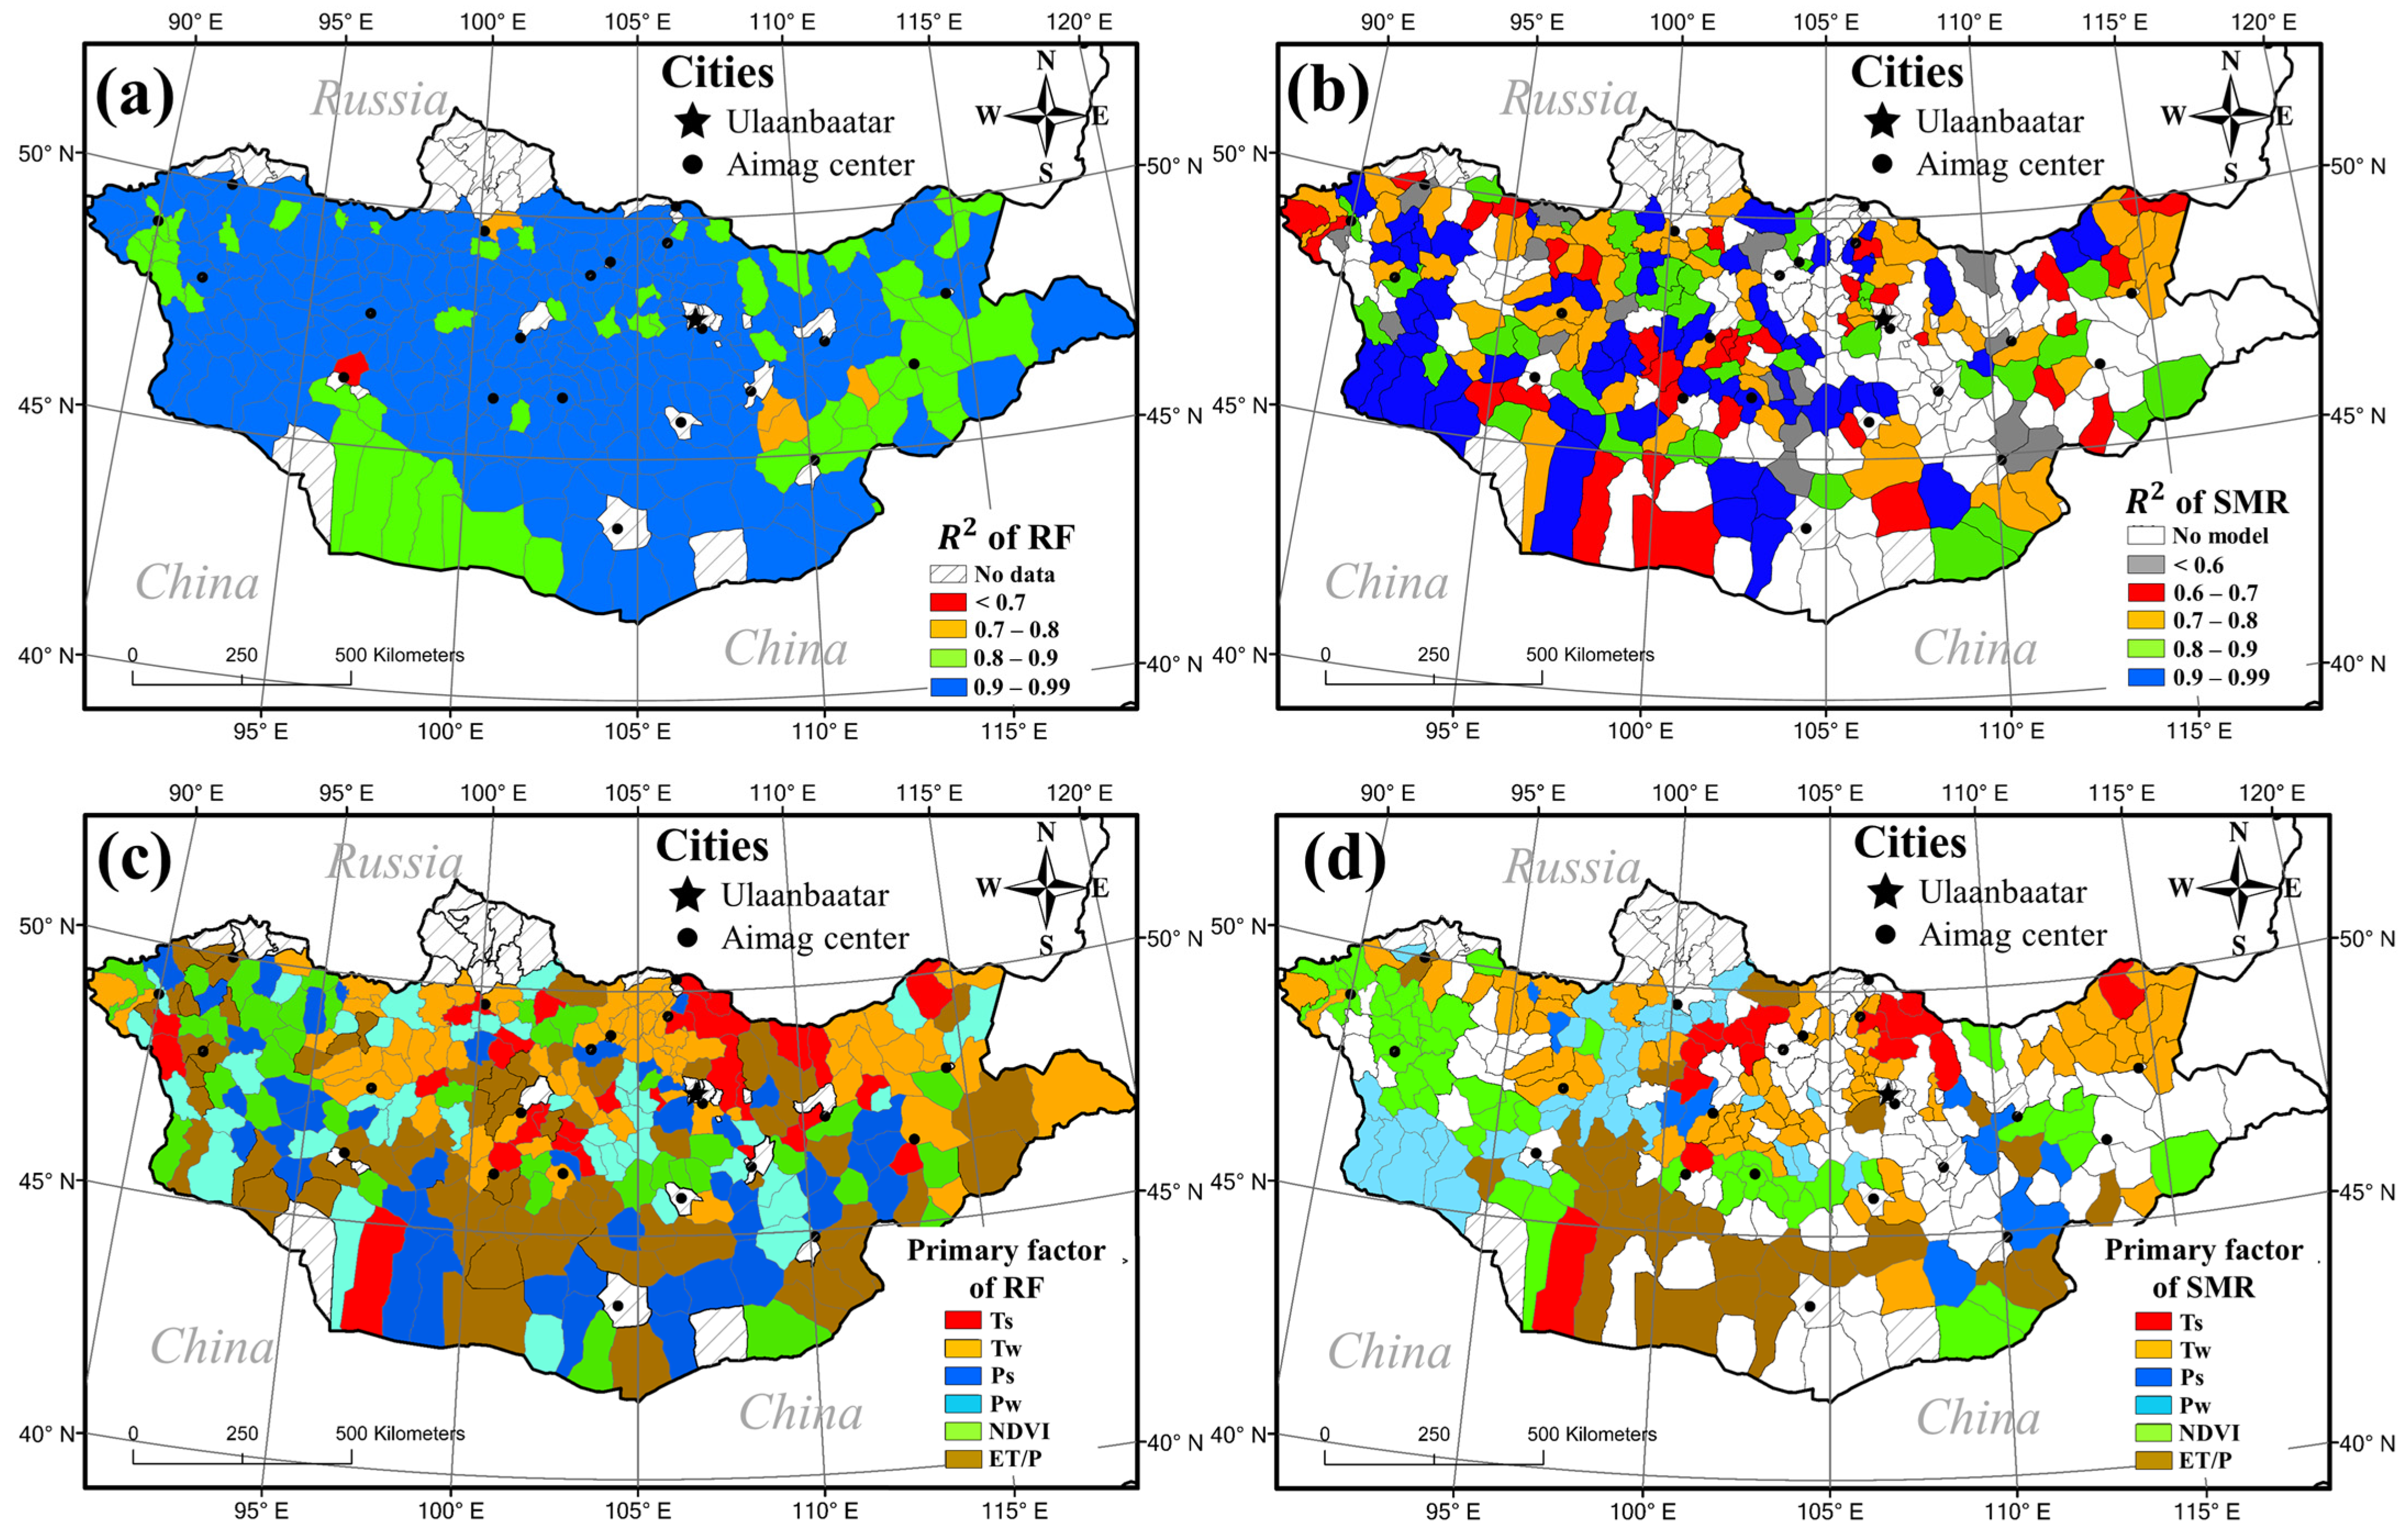
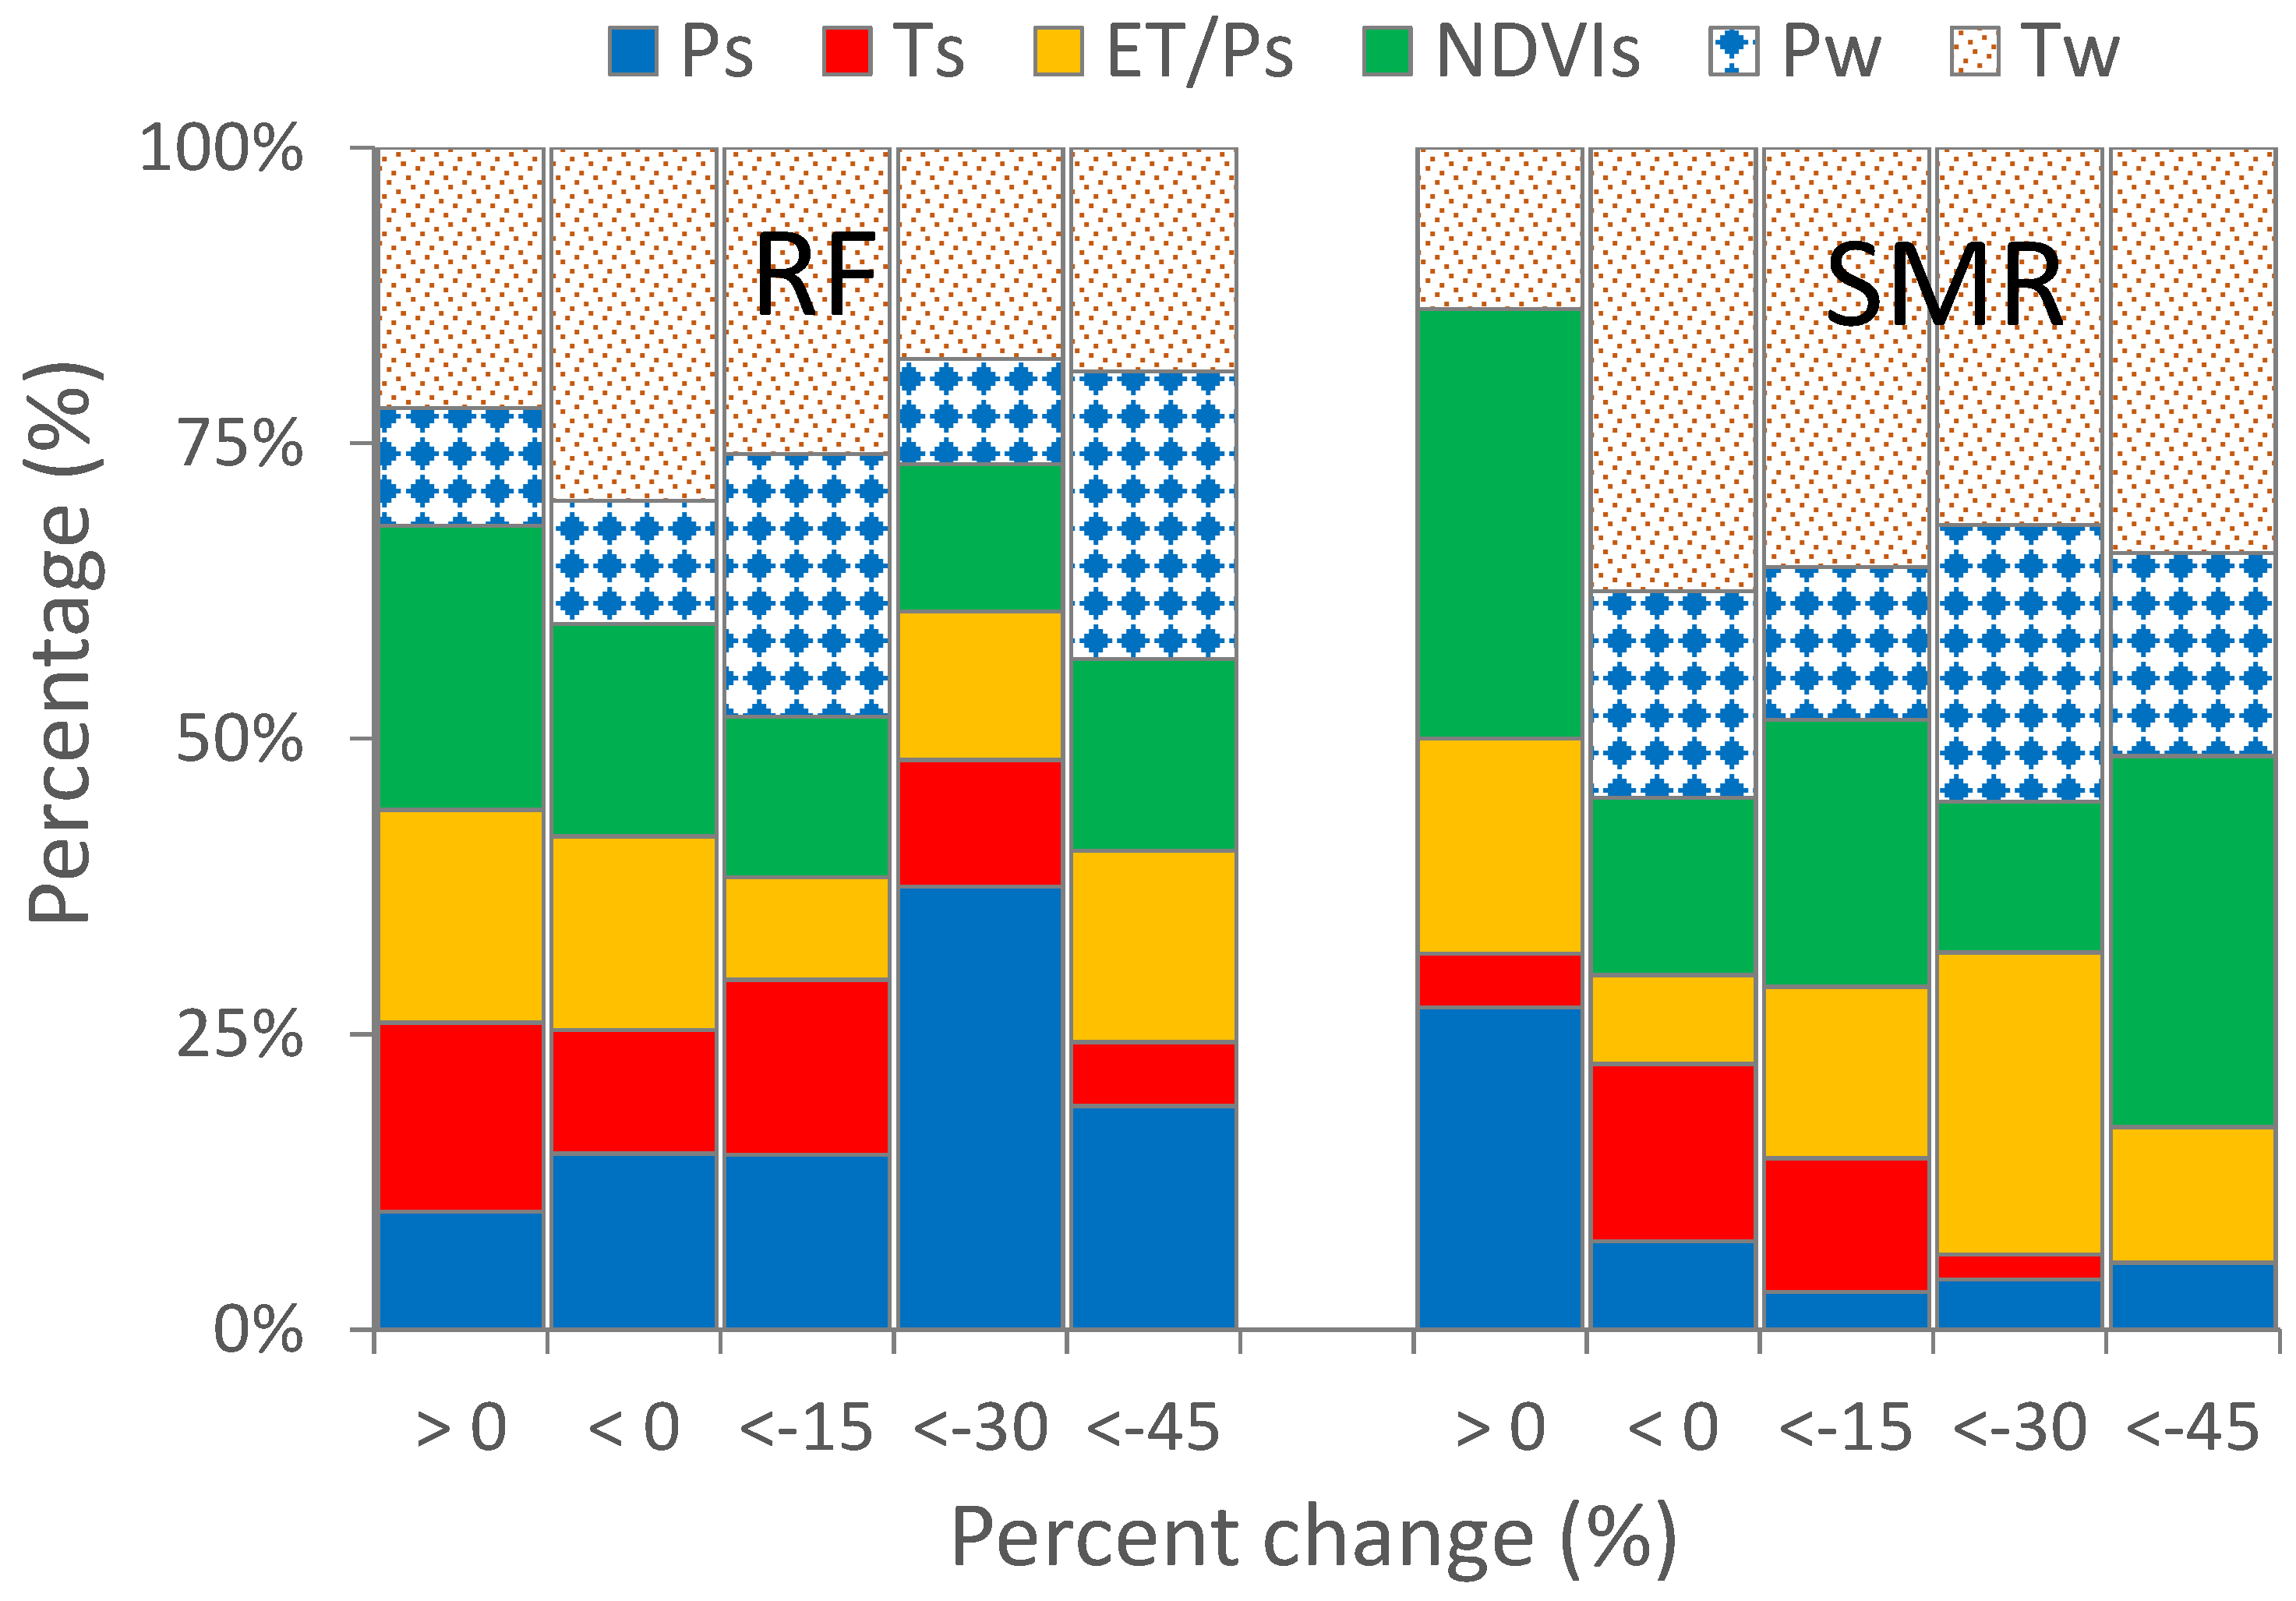
3.2.2. RF and SMR Modeling and Primary Factors

The RF model estimated the percent change in livestock number in a better linear fit with the reported percent change than the SMR, while the RF underestimated the change, resulting in a higher RMSE than the SMR (Figure 6a,b). Consequently, the RF and SMR explained 89% and 82% of the temporal and spatial variations found in the reported percent change in livestock numbers, respectively. Moreover, in the soum-level comparisons, the RF depicted the interannual livestock changes very well, showing high R2 values of over 0.9 in most soums investigated (Figure 7a). In contrast, the SMR was successful for 203 soums, equivalent to 70% of the soums investigated, but failed in the other 30% soums. Additionally, the SMR showed relatively low soum-level R2 values with 0.81 on average (Figure 7b).
The factors that had the greatest impact on the percent change in livestock numbers had similar proportions by season at both modeling analyses (Figure 6c,d). The ratios between summer winter variables were 61% vs. 39% and 51% vs. 49% for RF and SMR, respectively. However, the proportions of winter variables decreased when the Dzud year data was excluded in the modeling from 39% to 36% and from 49% to 30% for RF and SMR, respectively. Looking at the importance of each factor, winter temperature (Tw) was the most frequent primary factor across soums in both model studies. These results imply that the impacts of winter conditions on the Dzud occurrence becomes important, but that summer conditions also have an equally large influence, and even more so in normal years.
In the spatial patterns of primary factors, RF and SMR produced spatial patterns somewhat differently locally but similar regionally (Figure 7c,d). In the RF model, the summer water conditions such as Ps and dryness were the prevailing primary factors of the Gobi in the south; winter temperature (Tw) in the northern mountainous regions and in the eastern plain steppe; and NDVIs in the Altai region in the west (Figure 7c). In contrast, Ts and Pw appeared somewhat randomly scattered across Mongolia. The SMR model produced similar regional patterns but a new lumped pattern of Pw in mid-western mountainous areas (Figure 7d).

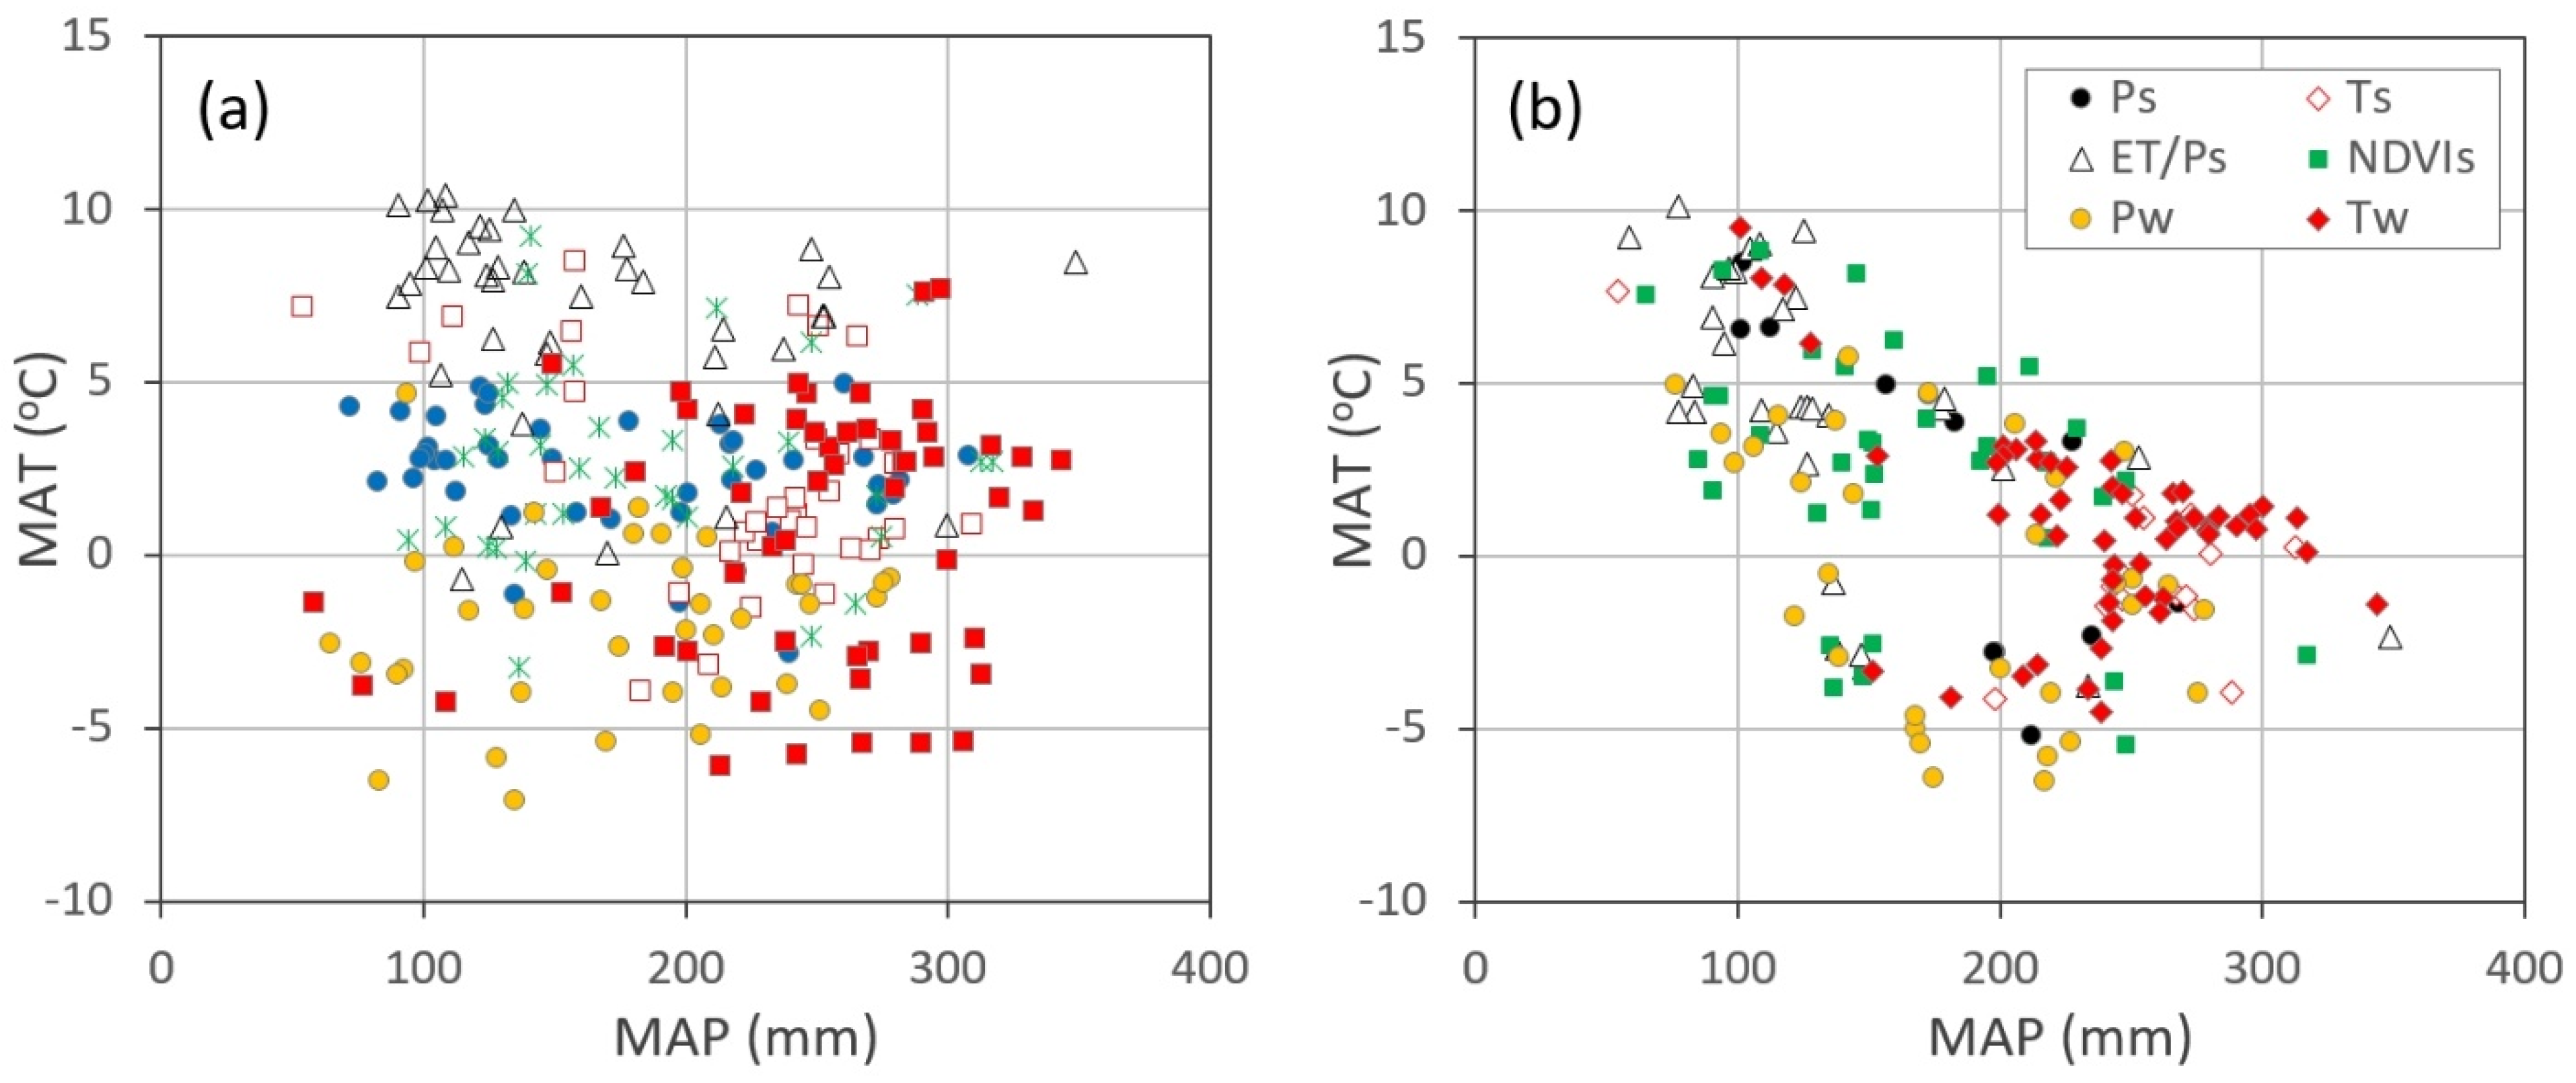
3.3. Relationships between Climate, Primary Factors, and Dzud Severity

The primary factors of each soum were plotted on a temperature–precipitation scatterplot for each model in order to investigate whether the local climate characteristics were related with the selected key variables (Figure 8). The scatterplots showed the clustering and dispersion of each key variable, which differed depending on each model. In the RF model, summer variables were concentrated and distributed according to specific temperature ranges (i.e., roughly between 0 and 5 °C for Ps, Ts, and NDVIs; over 5 °C for aridity, ET/Ps) rather than precipitation (Figure 8a). On the other hand, winter variables were widely distributed over a wide range of temperatures and precipitation, excluding high temperatures. In contrast, in the SMR model, dryness (ET/Ps) and NDVIs appeared as the popular main factor in hot-and-dry climates, and summer and winter temperature were the key variables in cold and humid climates (Figure 8b). The two scatterplots also indicate that the SMR model failed mostly in soums with hot and humid climates, where the RF model identified dryness as the most popular key factor.
When the livestock change (%) after the 2009–2010 Dzud was summarized by primary factors, the winter factors corresponded to a higher loss rate (−24.3 ± 0.17 and −27.5 ± 0.24) than the summer factors (−20.3 ± 0.11 and −21.3 ± 0.19) for the RF and SMR models, respectively (p < 0.05). We further investigated correspondence between the 2009–2010 Dzud severity and the primary factors that controlled livestock changes from 2003 to 2010. Overall, the proportions of winter variables increased in places with net livestock loss (i.e., class with negative change) compared with the soums showing net livestock gain (positive change) between 2009 and 2010 for both models. The change was, however, noticeably better for the SMR model (Figure 9). In the SMR model, the proportion of winter variables increased from 14% to 48~55% along the classes of livestock gain and losses, respectively, while the proportions varied little from the RF model, ranging from 32% to 27~48%. We also counted the number of soums for each of the six classes for each model in Figure 9. From those numbers, the success rate of the SMR model was calculated for each class and, as a result, an interesting pattern emerged where the success rate increased from 44% to 60, 77, 82, and 89% according to the class order in Figure 9.

4. Discussion

The increasing availability of multi-sensor satellite remote sensing data provides new opportunities for integrating satellite data with ecosystem models to explain the responses of a complex ecosystem to factors influencing its dynamics [25,26]. The present study tested the applicability of multi-sensor satellite data for reproducing the observed change in livestock numbers in Mongolian nomadic pastures. In this study, a process-based schematic model for producer–herbivore trophic interactions and their dependence on seasonal climate conditions was suggested for Mongolian nomadic landscapes. The model was used to select major potential drivers important for changes in livestock numbers that can be produced from multi-sensor satellite data. Then, the data were used as explanatory variables in a regression model and a machine learning model, making it possible to reproduce the livestock changes and identify key variables for the changes.
In the RF modeling results, summer variables were identified as the key factors more than winter variables to explain the annual livestock changes from 2003 to 2020 (61% vs. 39%), while the proportions were almost equal for the summer and winter variables in the SMR model (51% vs. 49%) (Figure 6). Both the RF and SMR models produced certain regional patterns of primary natural factors: e.g., dryness (ET/Ps) in the south and coldness (Tw) in the north (Figure 7). The regional patterns seem to correspond with endemic climate regions, such as hot and dry climate in the south and cold and humid climate in the north, which limits regional vegetation growth and livestock loss [21,45]. Meanwhile, grassland production (NDVIs) was a common key determinant across the middle of Mongolia, especially in the great valley region of western Mongolia with cold and dry climate but relatively abundant water resources. Our findings indicate that regional endemic conditions in weather and foraging resource availability should be primary concerns for enhancing the adaptive capacity of pastoral livelihoods in Mongolia. On the other hand, the importance of winter snow (Pw) was confirmed throughout Mongolia, likely reflecting the complexity of snowfall mechanisms.
Our PCA and modeling analyses using the satellite-driven variables provided useful insights into characterizing the impacts of the serious 2009–2010 Dzud. The countrywide Dzud was well-characterized by PCA as cold with a snowy winter and low summer foraging biomass (Figure 5). This demonstrates a strong coupling between the Dzud and critical natural conditions bringing temporary failure in livestock management [1,8]. In more detail, though Dzud was known as a winter disaster, this study reconfirmed findings from previous studies on the importance of summer factors to exert a great influence on Dzud frequency and severity [1,13,16]. In the analysis of Dzud severity (Figure 9), it was found that the damage during the 2009–2010 Dzud was severe in areas where NDVIs and ET/Ts were the main factors. This point was more noticeable in the SMR model. Dryness and NDVIs explained as much as 41% of soums, showing that the severe livestock losses were worse than −30% in 2010. The percentage was comparable with the contributions of the winter variables, Tw (33%) and Pw (20%). The results indicate that the 2009–2010 Dzud gave severe impacts to soums where summer aridity and forage availability have primarily regulated the annual change of livestock numbers. Thus, it implies that Dzud severity can be exaggerated when harsh winter climates overlap poor summer conditions, especially in areas where livestock gains and losses are controlled by endemic summer variables. The soums with such conditions are widely distributed in the desert steppe and typical steppe regions in southern and central Mongolia.
On the other hand, by comparing both the RF and SMR models, respective advantages and limitations of each can be addressed with respect to reproduction accuracy and factor analysis for the annual livestock change. First of all, the fact that the RF model successfully reproduced the annual livestock change in each soum with high accuracy (R2 above 0.9 in most soums) (Figure 7) suggests a high potential of the machine learning method in estimating the temporal livestock change across Mongolia. In contrast, the SMR model had relatively low reproducibility for the annual livestock changes and even failed to develop the regression models in about 30% of soums. Despite its shortcomings, the SMR model yields several interesting results helpful for improving our intuitive understanding of the factors causing annual livestock change as well as the issues necessary for further enhancement of our schematic landscape model (Figure 2). The model resulted in better clustered patterns of the key factors on a geographic map (Figure 7) and on the temperature–precipitation scatterplots (Figure 8); marked changes in the compositions of key factors for different Dzud strength class (Figure 9); showed a certain relationship between the Dzud strength and model success rate; and identified areas where the model was not created.
Because the SMR model emphasizes the independent linear relationship of each variable, there is a risk of excessively removing variables that contribute little to the explanatory power of the model [47]. In contrast, the RF model develops diverse nonlinear relationships between multiple variables through the number of nodes at multiple layers to fit the target variable as best as possible [49]. Likewise, in our study, the RF model explained the annual livestock change, with high R2 values (mostly above 0.8) in soums where the SMR model failed. Hence, for those soums, nonlinear relationships between natural factors were necessary to explain the livestock change. Interestingly, such soums were distributed regionally, and they were adjacent to each other rather than randomly scattered (Figure 7). For example, 90% of the soums where the SMR failed were adjacent to each other, usually near cities or along railroads or paved roads. Other failed soums are where livestock numbers increased despite the nationwide Dzud in 2010. The above discussion implies that the low explanatory power and significant failure rate of the SMR model could be caused by non-natural social and economic drivers that were not considered in this study (e.g., high slaughter near cities and frequent livestock trade through transportation, etc.). In addition, this study did not consider recognitive adaptation frameworks for lessening the Dzud, such as traditional ecological knowledge [2] or community-based rangeland management [18]. All the additional social and economic drivers suggest the need for model improvement and new data production to gain further perspectives on the natural control mechanism and effects of social drivers on the livestock change and Dzud occurrence.
This study implicitly assumed Mongolian pasturelands as a huge mosaic network composed of unit nomadic landscape pastures that are locally similar in structure and function and have similar natural conditions at the soum scale [21,51]. The concept of similarity has been widely adopted in ecosystem models for up-scaling processes (e.g., stand-level ‘big-leaf’ vegetation models) [52,53]. In Mongolia, the nomadic styles (i.e., seasonal-pasture selection and the range and timing of transient movements) are locally similar but regionally different depending on various factors, such as climate regime, steppe type, water resource availability, and topography [21,54]. When considering the regional nomadic styles, the soum is a more appropriate unit than the aimag, which is wide enough to mix several steppe types. Hence, our soum-scale studies contributed to achieving better spatial details in analyzing the local natural drivers of livestock population change across Mongolia, which has not been addressed in other studies so far. Nevertheless, in order to deal with the impact of livestock on vegetation and the resulting desertification issues, it is necessary to examine the relationship between climate–vegetation–livestock that occurs at the scale of nomadic landscapes [27,55,56,57]. It would be nearly impossible to produce landscape-scale climate–nomadic pastoral data for all of Mongolia. Thus, it will be a challenging task to link the knowledge gained from detailed seasonal pasture-level analysis for a few nomadic landscapes intensively studied with the soum-scale nationwide research as presented in this study. Here, spatially fine-scale satellite data can contribute to developing the necessary datasets such as vegetation coverage rate, biomass, aridity, etc. This cross-scale research in Mongolian nomadic pastures would advance our understanding of the complex multi-hazard mechanisms such as drought, Dzud, and desertification.
In conclusion, this study showed that the annual change in livestock numbers can be successfully estimated in county-level soum administrative districts using climate and vegetation data produced from multi-sensor satellite data. Summer and winter variables appeared to be almost equally important in determining the livestock change across Mongolia. This study confirmed that the RF machine learning model estimates the livestock changes accurately with a high R2 value of above 0.9 in most soums (81%). In contrast, the SMR model provided more intuitive insights in interpreting relationships between the key factors and the livestock change and Dzud outbreaks. The key regional factors discovered in this study generally well reflected the endemic climate characteristics of each region. However, the regionality of snowfall as the key factor was ambiguous except for some mountainous areas, which seem to be the result of the reflecting complexity of snowfall processes. These conclusions therefore suggest that ongoing climate change may have profound impacts on climate–vegetation–livestock interactions in nomadic pastures of Mongolia by causing changes in the characteristics and intensity of local endemic climate. However, as this study targeted only one Dzud–recovery–Dzud period from 2003 to 2010, generalizing the above conclusions appears to be reserved, which calls for future efforts to develop various long-term time series datasets on local climate and vegetation using satellites and other sources. Finally, it is inferred that our methodology combining the conceptual nomadic pastoralism model, multi-satellite data, and machine learning can be further applied to explain the livestock change and Dzud occurrence in places where nomadic pastoralism is still practiced, such as Kazakhstan and Tibet.

Author Contributions

Conceptualization, S.K. and N.C.; methodology, S.K., N.C. and K.J.; software, N.C. and B.S.; validation, S.K. and N.C.; formal Analysis, S.K. and N.C.; investigation, S.K.; resources, A.N., B.-E.L., O.K. and T.T.; writing—original draft preparation, S.K.; writing—review and editing, N.C.; visualization, N.C.; supervision, S.K.; funding acquisition, S.K. All authors have read and agreed to the published version of the manuscript.

Funding

This work was supported by a research grant from the National Institute of Forest Science (FM0103-2021-02).

Data Availability Statement

The raw data supporting the conclusions of this article will be made available by the authors on request.

Acknowledgments

We appreciate AsiaFlux for providing ET data at the SKT flux tower and the National Agency Meteorology and Environmental Monitoring of Mongolia for the monthly temperature and precipitation.

Conflicts of Interest

The authors declare no conflicts of interest.

References

  1. Middleton, N.J.; Sternberg, T. Climate hazards in drylands: A review. Earth-Sci. Rev. 2013, 126, 48–57. [Google Scholar] [CrossRef]
  2. Soma, T.; Schlecht, E. The relevance of herders’ local ecological knowledge on coping with livestock losses during harsh windters in western Mongolia. Pastor. Res. Policy Pract. 2018, 8, 3. [Google Scholar] [CrossRef]
  3. Stumpp, M.; Wesche, K.; Retzer, V.; Miehe, G. Impact of grazing livestock and distance from water source on soil fertility in southern Mongolia. Mt. Res. Dev. 2005, 25, 244–251. [Google Scholar] [CrossRef]
  4. Robinson, S.; Milner-Gulland, E.J. Political change and factors limiting numbers of wild and domestic ungulate in Kazakhstan. Hum. Ecol. 2003, 31, 87–110. [Google Scholar] [CrossRef]
  5. Bekenov, A.B.; Grachev, I.A.; Milner-Gulland, E.J. The ecology and management of the saiga antelope in Kazakhstan. Mammal Rev. 1998, 28, 1–52. [Google Scholar] [CrossRef]
  6. Nandintsetseg, B.; Boldgiv, B.; Chang, J.; Ciais, P.; Davaanyam, E.; Batbold, A.; Bat-Oyun, T. Risk and vulnerability of Mongolian grasslands under climate change. Environ. Res. Lett. 2021, 16, 034035. [Google Scholar] [CrossRef]
  7. Reading, R.; Bedunah, D.; Amgalanbaatar, S. Conserving Biodiversity on Mongolian Rangelands: Implications for Protected Area Development and Pastoral Uses; USDA Forest Service Proceedings RMRS-P-39; USDA: Washington, DC, USA, 2006.
  8. Sternberg, T. Unravelling Mongolia’s extreme winter disaster of 2010. Nomadic Peoples 2010, 14, 72–86. [Google Scholar] [CrossRef]
  9. Begzsuren, S.; Ellis, J.E.; Ojima, D.S.; Coughenour, M.B.; Chuluun, T. Livestock responses to drought and severe winter weather in the Gobi Three Beauty National Park, Mongolia. J. Arid Environ. 2004, 59, 786–796. [Google Scholar] [CrossRef]
  10. Fernandez-Gimenez, M.E.; Gatkhishig, B.; Batbuyan, B. Cross-boundary and cross-level dynamics increase vulnerability to severe winter disasters (dzud) in Mongolia. Glob. Environ. Chang. 2012, 22, 836–851. [Google Scholar] [CrossRef]
  11. Erdenebadrakh, M.; Shinoda, M.; Nandintsetseg, B. Effects of cold-season climate hazards on livestock health and mortality in Mongolia. Int. J. Disaster Risk Reduct. 2023, 90, 103658. [Google Scholar] [CrossRef]
  12. Morinaga, Y.; Tian, S.F.; Shinoda, M. Winter snow anomaly and atmospheric circulation in Mongolia. Int. J. Climatol. 2003, 23, 1627–1636. [Google Scholar] [CrossRef]
  13. Rao, M.P.; Davi, N.K.; D’Arrigo, R.D.; Skees, J.; Nachin, B.; Leland, C.; Lyon, B.; Wang, S.Y.; Byambasuren, O. Dzuds, droughts, and livestock mortality in Mongolia. Environ. Res. Lett. 2015, 10, 074015. [Google Scholar] [CrossRef]
  14. Du, C.; Shinoda, M.; Tachiiri, K.; Nandintsetseg, B.; Komiyama, H.; Matsushita, S. Mongolian herder’s vulnerability to dzud: A study of record livestock mortality levels during the severe 2009/2010 winter. Nat. Hazards 2018, 92, S3–S17. [Google Scholar] [CrossRef]
  15. Joly, F.; Sabatier, R.; Hubert, B.; Munkhtuya, B. Livestock productivity as indicator of vulnerability to climate hazards: A Mongolian case study. Nat. Hazards 2018, 92, 95–107. [Google Scholar] [CrossRef]
  16. Tachiiri, K.; Shinoda, M.; Klinkenberg, B.; Morinaga, Y. Assessing Mongolian snow disaster risk using livestock and satellite data. J. Arid Environ. 2008, 72, 2251–2263. [Google Scholar] [CrossRef]
  17. Chadraabal, A.; Shinoda, M.; Suzuki, Y.; Komiyama, H. Mitigation of severe wintertime disasters in northern Mongolia through the early implementation of local action. Int. J. Disaster Risk Reduct. 2020, 50, 101739. [Google Scholar] [CrossRef]
  18. Fernandez-Gimenez, M.E.; Batkhishig, B.; Batbuyan, B.; Ulambayar, T. Lessons from the Dzud: Community-based rangeland management increases the adaptive capacity of Mongolian herders to winter disaster. World Dev. 2015, 68, 48–65. [Google Scholar] [CrossRef]
  19. Mearns, R. Sustaining livelihoods on Mongolia’s pastoral commons: Insights from a participatory poverty assessment. Dev. Chang. 2004, 35, 107–139. [Google Scholar] [CrossRef]
  20. Undargaa, S. Re-Imagining Collective Action Institutions: Pastoralism in Mongolia. Hum. Ecol. 2017, 45, 221–234. [Google Scholar] [CrossRef]
  21. Johnson, D.A.; Sheehy, D.P.; Miller, D.; Damiran, D. Mongolian rangelands in transition. Secheresse 2006, 17, 133–141. [Google Scholar]
  22. National Statistics Office of Mongolia. Monthly Bulletin of Statistics (June 2018); National Statistics Office of Mongolia: Ulaanbaatar, Mongolia, 2018.
  23. Batima, P.; Natsagdorj, L.; Gombluudev, P.; Erdenetsetseg, B. Observed climate change in Mongolia. AIACC Work. Pap. 2005, 12, 5–20. [Google Scholar]
  24. Jang, K.; Kang, S.; Kimball, J.S.; Hong, S.Y. Retrievals of all-weather daily air temperature using MODIS and AMSR-E data. Remote Sens. 2014, 6, 8387–8404. [Google Scholar] [CrossRef]
  25. Liu, Z. Effects of climate and fire on short-term vegetation recovery in the boreal larch forests of Northeastern China. Sci. Rep. 2016, 6, 37572. [Google Scholar] [CrossRef]
  26. Pasetto, D.; Arenas-Castro, S.; Bustamante, J.; Casagrandi, R.; Chrysoulakis, N.; Cord, A.F.; Dittrich, A.; Domingo-Marimon, C.; El Serafy, G.; Karnieli, A.; et al. Integration of satellite remote sensing data in ecosystem modelling at local scales: Practices and trends. Methods Ecol. Evol. 2018, 9, 1810–1821. [Google Scholar] [CrossRef]
  27. Narantsetseg, A.; Kang, S.; Lkhamsuren, B.; Ko, D.W. Determinants of Caragana microphylla density distribution in the Mongolian steppe. Ecol. Res. 2014, 29, 855–856. [Google Scholar] [CrossRef]
  28. Narantsetseg, A.; Kang, S.; Lkhamsuren, B.; Jang, K.; Ko, D.W. Assessment of biotic and abiotic factors controlling herbaceous biodiversity in Mongolian steppes. Ecol. Inform. 2015, 29, 221–229. [Google Scholar] [CrossRef]
  29. Numaguti, A. Origin and recycling processes of precipitation water over the Eurasian continent: Experiments using an atmospheric general circulation model. J. Geophys. Res. 1999, 104, 1957–1972. [Google Scholar] [CrossRef]
  30. Sato, T.; Tsujimura, M.; Yamanaka, T.; Iwasaki, H.; Sugimoto, A.; Sugita, M.; Kimura, F.; Davaa, G.; Oyunbaatar, D. Water sources in semiarid northeast Asia as revealed by field observations and isotope transport model. J. Geophys. Res. 2007, 112, D17112. [Google Scholar] [CrossRef]
  31. Li, J.; Ruan, C. The North Atlantic-Eurasian teleconnection in summer and its effects on Eurasian climates. Environ. Res. Lett. 2018, 13, 129501. [Google Scholar] [CrossRef]
  32. Tuvshintogtokh, I. The Steppe Vegetation of Mongolia; Bembi San: Ulaanbaatar, Mongolia, 2014; p. 610. [Google Scholar]
  33. ReliefWeb. Mongolia: Severe Winter-Dzud. (Jun 2010); U.N. Office for the Coordination of Humanitarian Affairs: Geneva, Switzerland, 2010. [Google Scholar]
  34. Murphy, D.J. Going on Otor: Disaster, Mobility, and the Political Ecology of Vulnerability in Uguumur, Mongolia. Ph.D. Thesis, University of Kentucky, Lexington, KY, USA, 2011. [Google Scholar]
  35. Huete, A.; Didan, K.; Miura, T.; Rodriguez, E.P.; Gao, X.; Ferreira, L.G. Overview of the radiometric and biophysical performance of the MODIS vegetation indices. Remote Sens. Environ. 2002, 83, 195–213. [Google Scholar] [CrossRef]
  36. Huffman, G.J.; Adler, R.F.; Bolvin, D.T.; Gu, G.; Nelkin, E.J.; Bowman, K.P.; Hong, Y.; Stocker, E.F.; Wolff, D.B. The TRMM multisatellite precipitation analysis (TMPA): Quasi-global, multiyear, combined-sensor precipitation estimates at fine scales. J. Hydrometeorol. 2007, 8, 38–55. [Google Scholar] [CrossRef]
  37. Jang, K.; Kang, S.; Kim, J.; Lee, C.; Kim, J.; Hirata, R.; Saigusa, N. Mapping evapotranspiration using MODIS and MM5 Four Dimensional Data Assimilation (FDDA). Remote Sens. Environ. 2010, 114, 657–673. [Google Scholar] [CrossRef]
  38. Jang, K.; Kang, S.; Lim, Y.J.; Jeong, S.; Kim, J.; Kimball, J.S.; Hong, S.Y. Monitoring daily evapotranspiration in Northeast Asia using MODIS and a regional Land Data Assimilation System. J. Geophys. Res. 2013, 118, 12927–12940. [Google Scholar] [CrossRef]
  39. Li, S.G.; Asanuma, J.; Kotani, A.; Eugster, W.; Davaa, G.; Oyunbaatar, D.; Sugita, M. Year-round measurements of net ecosystem CO2 flux over a montane larch forest in Mongolia. J. Geophys. Res. 2005, 110, D09303. [Google Scholar] [CrossRef]
  40. Bedunah, D.J.; Schmidt, S.M. Rangelands of Gobi Burvan Saikhan national conservation park, Mongolia. Rangel. Arch. 2000, 22, 18–24. [Google Scholar]
  41. Seemann, S.W.; Li, J.; Menzel, W.P.; Gumley, L.E. Operational retrieval of atmospheric temperature, moisture, and ozone from MODIS infrared radiances. J. Appl. Meteorol. 2003, 42, 1072–1091. [Google Scholar] [CrossRef]
  42. Jang, K. Development of a Framework to Estimate Evapotranspiration Using Satellite Remote Sensing Data under All Sky Conditions. Ph.D. Thesis, Kangwon National University, Chuncheon, Republic of Korea, 2013. [Google Scholar]
  43. Mu, Q.; Zhao, M.; Running, S.W. Improvements to a MODIS global terrestrial evapotranspiration algorithm. Remote Sens. Environ. 2011, 115, 1781–1800. [Google Scholar] [CrossRef]
  44. Prince, S.D.; Colstoun, E.B.; Kravitz, L.L. Evidence from rain-use efficiencies does not indicate extensive Sahelian desertification. Glob. Chang. Biol. 1998, 4, 359–374. [Google Scholar] [CrossRef]
  45. Neupert, R.F. Population, nomadic pastoralism and the environment in the Mongolian Plateau. Popul. Environ. 1996, 20, 413–441. [Google Scholar] [CrossRef]
  46. Whittingham, M.J.; Stephens, P.A.; Bradbury, R.B.; Freckleton, R.P. Why do we still use stepwise modelling in ecology and behaviour? J. Anim. Ecol. 2006, 75, 1182–1189. [Google Scholar] [CrossRef]
  47. Smith, G. Step away from stepwise. J. Big Data 2018, 5, 32. [Google Scholar] [CrossRef]
  48. Ye, T.; Liu, W.; Mu, Q.; Zong, S.; Li, Y.; Shi, P. Quantifying livestock vulnerability to snow disasters in the Tibetan Plateau: Comparing different modeling techniques for prediction. Int. J. Disaster Risk Reduct. 2020, 48, 101578. [Google Scholar] [CrossRef]
  49. Byer, S.; Jin, Y. Detecting drought-induced tree mortality in Sierra Nevada forests with time series of satellite data. Remote Sens. 2017, 14, 17. [Google Scholar] [CrossRef]
  50. Rodriguez-galiano, V.F.; Ghimire, B.; Rogan, J.; Chica-olmo, M.; Rigol-sanchez, J.P. An assessment of the effectiveness of a random forest classifier for land-cover classification. ISPRS J. Photogramm. Remote Sens. 2011, 67, 93–104. [Google Scholar] [CrossRef]
  51. Jaqchid, S.; Hyer, P. Mongolia’s Culture and Society; Westview Press Boulder: Boulder, CO, USA, 1979. [Google Scholar]
  52. Aber, J.D.; Federer, C.A. A generalized, lumped-parameter model of photosynthesis, evapotranspiration and net primary production in temperate and boreal forest ecosystems. Oecologia 1992, 92, 463–474. [Google Scholar] [CrossRef] [PubMed]
  53. Running, S.W.; Coughlan, J.C. A general model of forest ecosystem processes for regional applications I. Hydrologic balance, canopy gas exchange and primary production processes. Ecol. Model. 1988, 42, 125–154. [Google Scholar] [CrossRef]
  54. Enkhtuvshin, B. New challenges for nomadic civilization and pastoral nomadism in Mongolia. Nomadic Stud. 2004, 9, 69–81. [Google Scholar]
  55. Fujita, N.; Amartuvshin, N.; Ariunbold, E. Vegetation interactions for the better understanding of a Mongolian ecosystem network. In The Mongolian Ecosystem Network: Environmental Issues under Climate and Social Changes; Yamamura, N., Fujita, N., Maekawa, A., Eds.; Ecological Research Monograph; Springer: Tokyo, Japan, 2012; pp. 157–184. [Google Scholar]
  56. Kang, S.; Lee, S.H.; Cho, N.; Aggossou, C.; Chun, J. Dust and sandstorm: Ecosystem perspectives on dryland hazards in Northeast Asia: A review. J. Ecol. Environ. 2021, 45, 25. [Google Scholar] [CrossRef]
  57. Narantsetseg, A.; Kim, J.; Cho, N.; Seo, B.; Kang, S. Local and regional steppe vegetation palatability at grazing hotspot areas in Mongolia. J. Ecol. Environ. 2022, 48, 76–84. [Google Scholar]
Figure 2. A schematic nomadic landscape model describing the climate–vegetation–livestock interactions in Mongolian pasturelands. The subscripts of s and w means summer and winter variables, respectively; T, temperature; P, precipitation; ET, evapotranspiration; GPP, gross primary production; NPP, net primary production; Ra, autotrophic respiration; biomass, a summation [Σ] of growing season NPP; residue, dead standing biomass; sheep, livestock numbers in a sheep unit; loss, natural mortality (the winter loss is subject to Dzud); slaughter, meat production; otor, emergency long-distance migration. The bold arrows highlight the different biomass conversion processes in summer and winter pastures.
Land 13 00391 g002
Figure 3. A study flowchart from data collection to the production of satellite-driven summer and winter variables, validation, and factor analysis and modeling.
Land 13 00391 g003
Figure 4. Spatial patterns of the rate of change in livestock numbers and environmental variables: the first column: rate of change in livestock numbers (%) from 2003 to 2010; from second to fifth columns: scores of summer and winter environmental variables from 2003 to 2009, respectively. ‘03~04’ means ‘livestock change rate between 2003 and 2004’, while ‘03’ means ‘summer and winter environmental variable in 2003’. Red and blue areas correspond to negative and positive values, respectively.
Land 13 00391 g004
Figure 5. Scatter plots of primary and secondary principal components of the PCA. The same result is illustrated with different categories of (a) year and (b) rate of change in livestock numbers.
Land 13 00391 g005
Figure 6. Evaluation and statistics of stepwise multiple regression (SMR) analyses: (a,b) soum-level comparison of observed and predicted annual rate of change in livestock numbers (%) from the FR and SMR models for 2003–2010, respectively; (c,d) percent relative frequency of soum-level primary factors from the FR and SMR models, respectively, using data for 2003–2009 (blue circles, without 2009–2010 Dzud data) and 2003–2010 (dark yellow bars).
Land 13 00391 g006
Figure 7. Results of RF (a,c) and SMR (b,d) modeling for 2003–2010: (a) R2 of RF models; (b) R2 of SMR models; (c) primary factors of RF models; (d) primary factors of SMR models. The dashed areas are soums excluded from the modeling due to data gaps. The blank areas in (d) are soums where the SMR model was not created.
Land 13 00391 g007
Figure 8. The primary factors of the percent change of livestock numbers displayed in temperature–precipitation scatter plots: (a) RF model and (b) SMR model. MAP and MAT are the average values of annual precipitation and temperature from 2003 to 2010, respectively.
Land 13 00391 g008
Figure 9. Percentage (%) of each key variable by livestock change classes in 2010: >0, greater than zero; <0, from zero to −15%; <−15, from −15 to −30%; <−30, from −30 to −45%; <−45, below −45%.
Land 13 00391 g009
Table 1. Summary of data sources used in this study.
VariableDescriptionSpatial
Resolution
Temporal Resolution
(a) Satellite data
TemperatureDaily mean temperature (°C) measured by MODIS and AMSR-E5 kmDaily
PrecipitationTRMM precipitation (mm)25 kmMonthly
EvapotranspirationDaily evapotranspiration (mm d−1) measured by MODIS and AMSR-E1 kmDaily
NDVINormalized Differenced Vegetation Index from MODIS1 km16 days
(b) Ground data
Livestock numbersNational census data from 2003 to 2010SoumAnnual
Temperature and PrecipitationObserved at 67 national weather stations in Mongolia
from 2003 to 2010
Point,
countrywide
Monthly
EvapotranspirationGap-filled daily ET (mm d−1) observed at the SKT flux tower from 30 March 2003 to 29 December 2005PointDaily
Table 2. Comparisons of satellite-derived environmental variables with field observations. Mean and standard deviation in parentheses, Pearson correlation coefficient, mean bias (ME), and root mean square error (RMSE).
ObservationSatelliterMERMSE
Monthly T (°C)0.85 (14.7)−1.7 (12.3)0.98 *−2.50.06
Ts18.1 (3.2)12.5 (3.8)0.84 *−4.90.26
Tw−18.7 (5.0)−17.6 (3.9)0.86 *+0.20.18
Monthly P (mm)15.5 (23.5)17.5 (23.7)0.93 *+1.80.17
Ps41.4 (23.0)44.7 (23.8)0.90 *+2.90.90
Pw2.4 (1.8)3.4 (2.1)0.76 *+0.90.09
Daily ET (mm)0.73 (0.77)1.37 (1.28)0.74 *+0.580.04
* Pearson correlation coefficient, significant at p < 0.001.
Disclaimer/Publisher’s Note: The statements, opinions and data contained in all publications are solely those of the individual author(s) and contributor(s) and not of MDPI and/or the editor(s). MDPI and/or the editor(s) disclaim responsibility for any injury to people or property resulting from any ideas, methods, instructions or products referred to in the content.

