Article

Seminatural Grasslands: An Emblematic Challenge for Nature Conservation in Protected Areas

1
Department of Agricultural, Food and Environmental Sciences (DSA3), University of Perugia, Borgo XX Giugno, 74, 06121 Perugia, PG, Italy
2
Maiella National Park, Via Badia 28, 67039 Sulmona, AQ, Italy
*
Authors to whom correspondence should be addressed.
Land 2024, 13(3), 386; https://doi.org/10.3390/land13030386
Submission received: 5 February 2024 / Revised: 9 March 2024 / Accepted: 14 March 2024 / Published: 18 March 2024

Abstract

:
Seminatural grasslands are among the most threatened habitats in Europe and worldwide, mainly due to changes in/abandonment of their traditional extensive use by grazing animals. This study aimed to develop an innovative model that integrates plant biodiversity, animal husbandry, and geo-informatics to manage and preserve seminatural grasslands in protected areas. With this objective, an integrated study was conducted on the seminatural grasslands in the hilly, montane, and (to a minimum extent) subalpine belts of the Maiella National Park, one of Europe’s most biodiversity-rich protected sites. Plant biodiversity was investigated through 141 phytosociological relevés in homogeneous areas; the pastoral value was calculated, and grasslands’ productivity was measured together with the main nutritional parameters. Uni- and multivariate statistical analyses were performed to identify the main grassland vegetation types, their indicator species and ecological–environmental characteristics, and their pastoral and nutritional values’ variability and differences. A total of 17 grassland types, most of which correspond to habitat types listed in Annex I to the 92/43/EEC Directive, were identified and characterised in terms of their biodiversity and potential animal load. To allow for near-real-time analysis of grasslands, an NDVI-based web interface running on Google Earth Engine was implemented. This integrated approach can provide decision-making support for protected-area managers seeking to develop and implement sustainable grassland management practices that ensure the long-term maintenance of their biodiversity.

1. Introduction

“Seminatural” grasslands are secondary, disturbance-depending habitats, resulting from a combination of low-intensity human land use and ecological processes; this means that these herbaceous vegetation types are not totally natural but rather the result of long-term human activity, dating back to the beginning of agriculture [1], in places where the natural vegetation would not be a grassland. The interruption of their use for extensive livestock grazing or mowing brings about secondary succession processes, tending towards the climax vegetation of the site [2,3,4]. Extensively grazed and mowed/grazed grasslands are characterized by species-rich plant communities and are recognized among the richest habitats in Europe [5,6,7,8,9]. They hold high conservation value and provide multiple ecosystem services—or, even better, nature’s contributions to people (NCPs) [10]—above all offering habitats to innumerable other species, including crop wild relatives and pollinators [11,12,13,14,15,16,17]. Despite their remarkable naturalistic value, species-rich seminatural grasslands include some of the most threatened habitats in Italy and Europe [18,19] and worldwide [20]. According to the results of the fourth cycle of Annex I Habitats Monitoring and Reporting ex-Art. 17, in Europe, their conservation status ranges from “unfavourable–inadequate” to “unfavourable–bad”, with very few exceptions [21]. The main drivers of deterioration are changes in grassland management, including land use intensification (overgrazing, fertilization) and, above all, changes in/abandonment of the traditional extensive use by grazing animals, a phenomenon increasingly (and already for decades) affecting several European mountainous regions, such as the Balkans, the Massif Central, the Carpathians, and the Apennines [22,23,24,25,26,27,28,29,30,31,32,33,34]. To preserve the structure and functions of seminatural herbaceous ecosystems, it is necessary to prevent the establishment of successional dynamism caused by the settlement and growth of edge, shrubby, and arboreal vegetation, and the consequent lowering in species diversity [4,14,33,35,36,37,38]. In light of this, seminatural grasslands pose an emblematic challenge for nature conservation in that they require both a careful evaluation of their biodiversity and an estimation of their value as forage, directly affecting the potential animal load [39,40]. This is particularly true in protected areas, where local, national, and supra-national legislation impose responsibility for conservation actions [41,42,43,44]. Understanding the complex dynamics of grassland ecosystems across spatial and temporal dimensions is indeed crucial to assessing conservation efforts’ effectiveness and promoting sustainable practices [45]. Satellite remote sensing is invaluable in this context, offering a cost-efficient, timely, and replicable method for vegetation analysis [31,46].
A science-based approach is crucial to adequately address management and ensure the sustainable use of natural and seminatural areas [47,48,49]. For this reason, filling the gaps by continuously updating detailed knowledge about local aspects of biodiversity is a pivotal step. This study aimed to develop an innovative model that integrates plant biodiversity, animal husbandry, and geo-informatics to manage and preserve the seminatural grasslands in a protected area. The site was selected for its extensive plant diversity and management potential. By combining a botanical investigation of the pastures, an analysis of their pastoral value and biomass, and the development of a tool to optimise their time of use by livestock, the research aims to provide an effective protocol for implementing seminatural grasslands conservation and, at the same time, support both farmers and management bodies in their use.

2. Materials and Methods
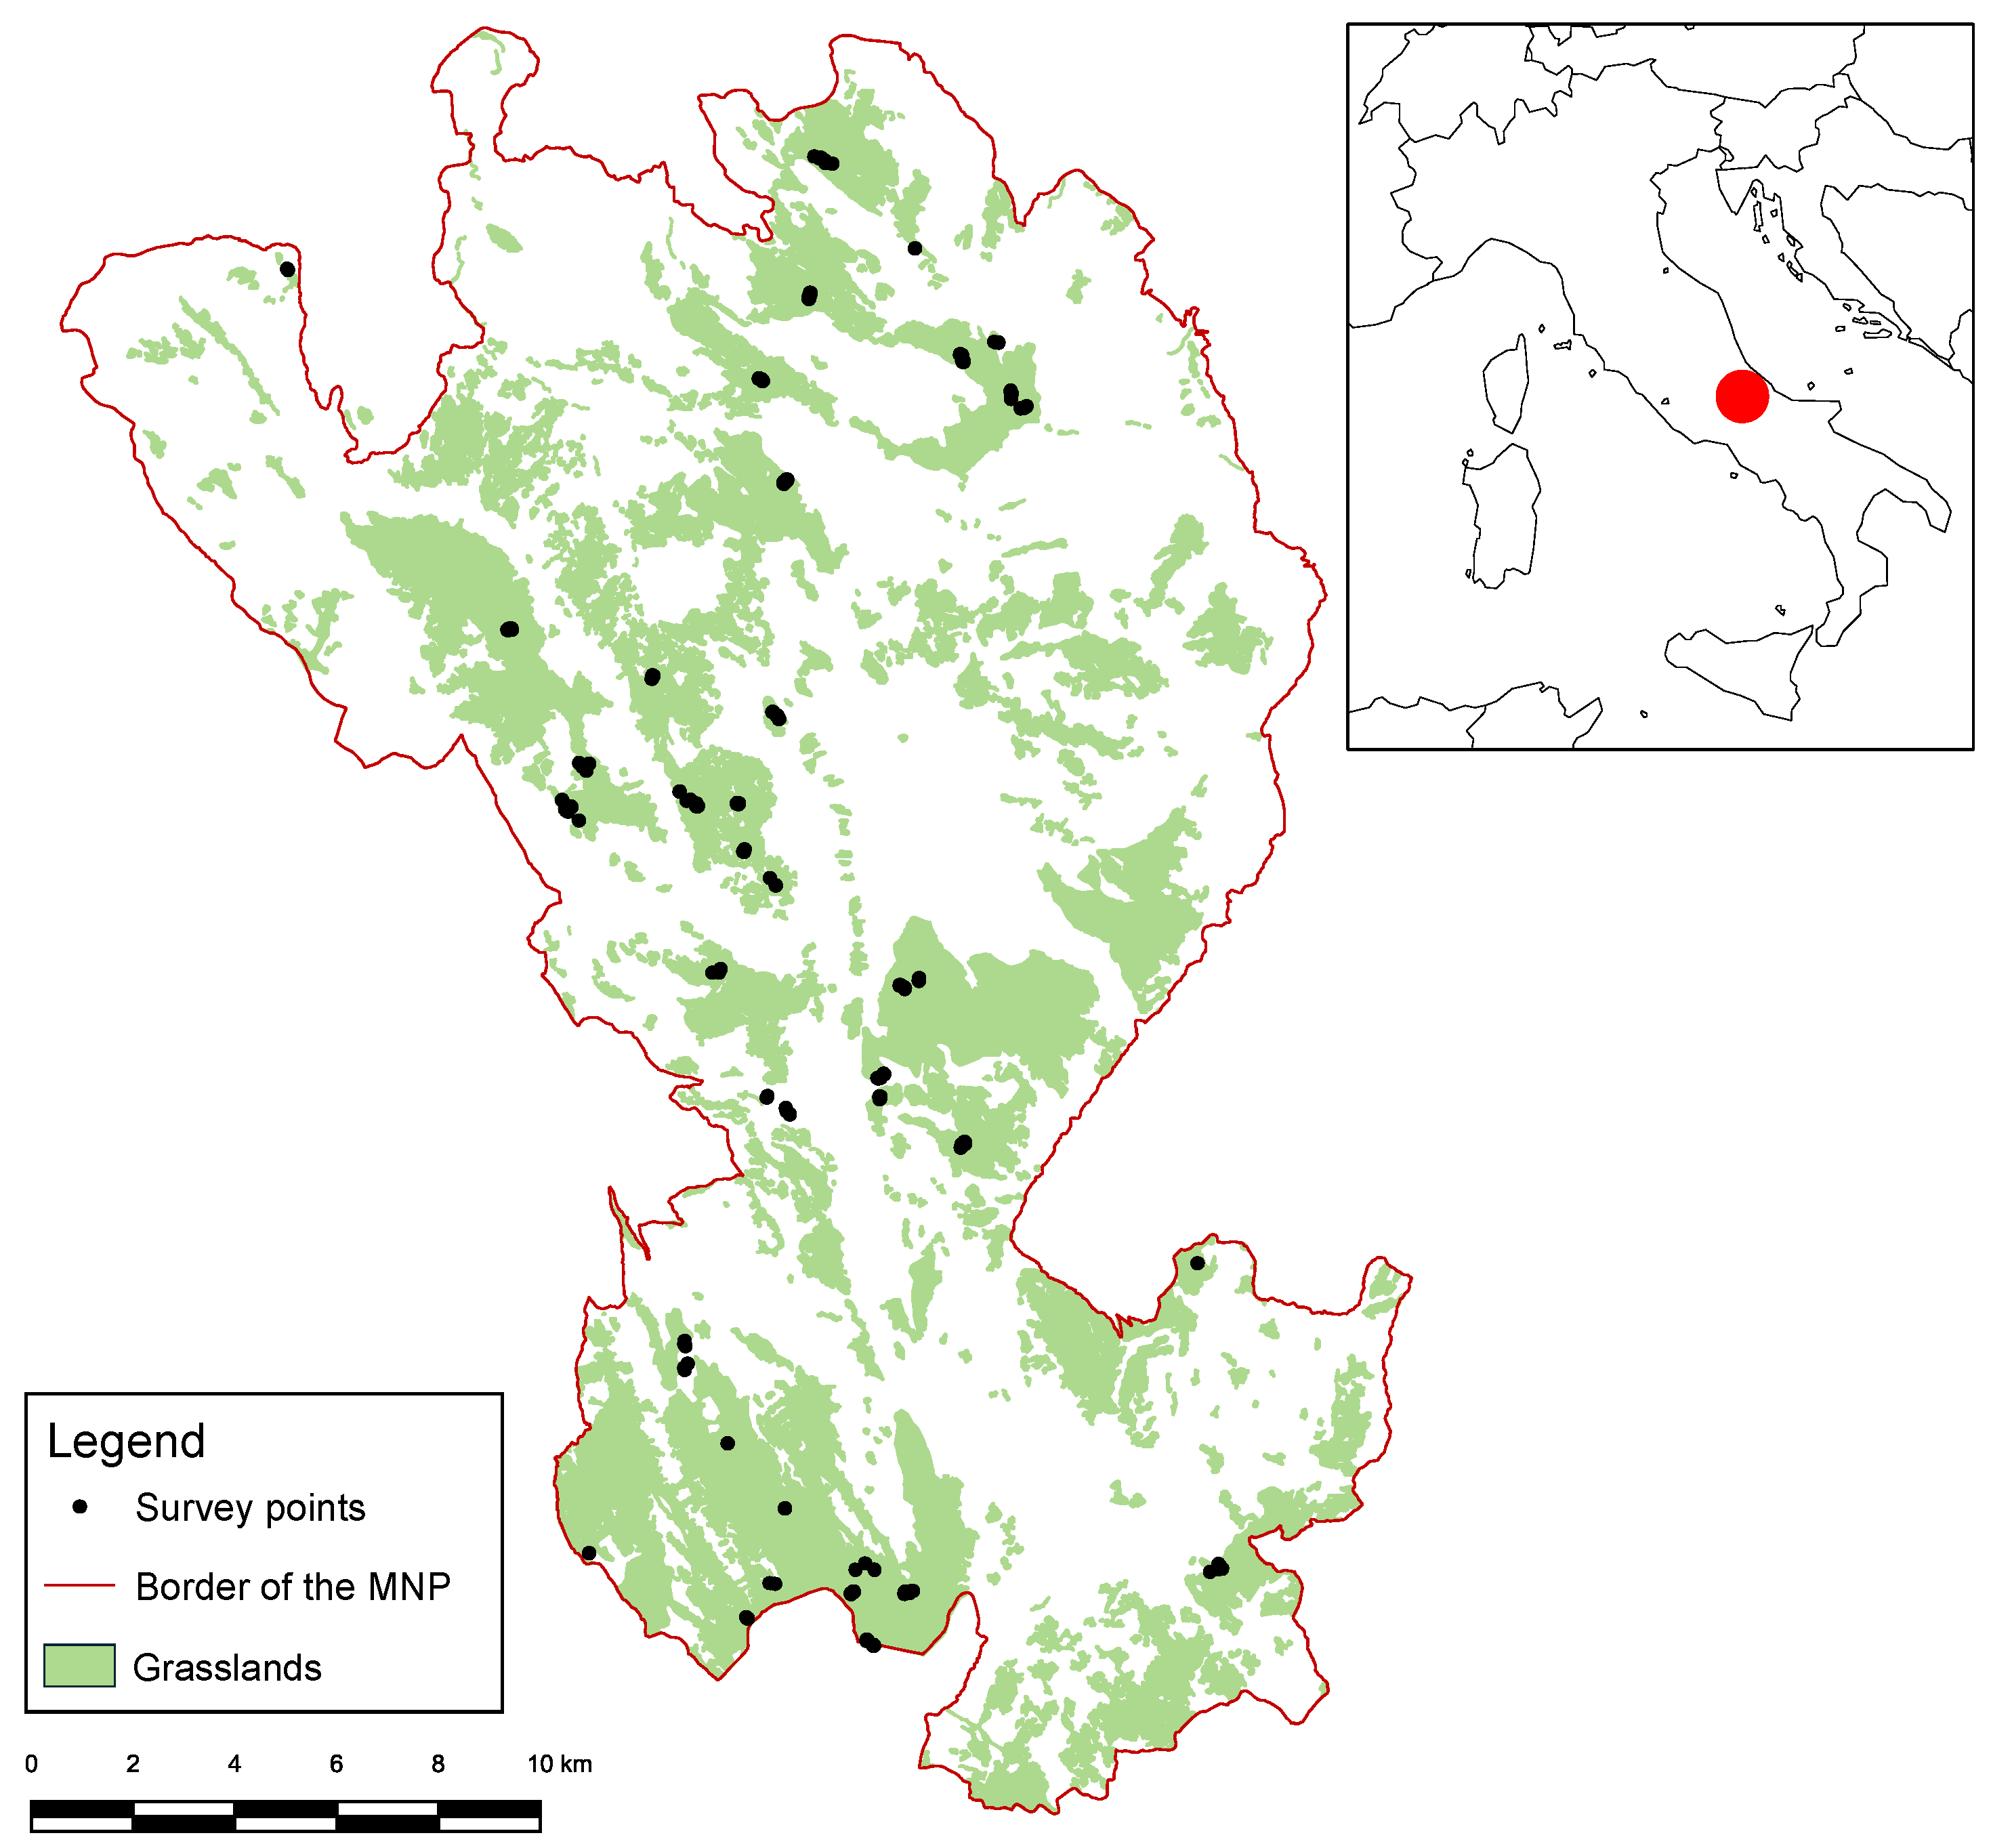
2.1. Study Area

The study took into account the grassland areas inside the Maiella National Park—Geopark Unesco (hereafter MNP) currently or formerly used as pastures or mowed/grazed meadows (i.e., grasslands mowed in spring and then grazed) within the hilly, montane, and, marginally, subalpine belts. The MNP is located in the eastern portion of the Central Apennines in Italy and covers about 740 km2. It is made up predominantly of carbonate reliefs, with evident and extensive traces of periglacial phenomena and frequent karst formations, and presents a great morphological and altitudinal variety (130–2793 m) [50,51]. The high altitudes and proximity to the sea (the Adriatic Sea is just 30 km away) guarantee a rigid but also variable climate that makes this a unique area, preserving the most rare and valuable part of Italian biodiversity [52]. The rainfall ranges from 700 to 1600 mm/year [53] (data for the years 1991–2020). The MNP is an important node of the Natura 2000 network, including a Special Protection Area (SPA) and 4 Special Areas of Conservation (SACs). The park’s flora stands out for its high numbers: 2286 species and subspecies [54], among which are 201 plants endemic to Italy and more than 200 that are included in the Italian Red Lists [55,56] and/or Annexes II-IV to the 92/43/EEC “Habitats” Directive [57]. The MNP hosts more than 30 natural and seminatural habitats listed in Annex I to the 92/43/EEC Directive [58]. The grassland areas, in particular, host several Annex II-IV plant species and Annex I habitat types, e.g., 6210, 6230*, 6510, and 6170 [58,59], which require conservation efforts [54,60,61].

2.2. Botanical Investigation

In order to determine the plant biodiversity of the target grasslands, field surveys were conducted by botanical expert staff in spring–summer 2019 and 2020, carrying out 141 phytosociological relevés, representative, as for number and location, of the diversity of the study areas and suitable to reflect the specific composition and abundance relationships between the species in the various types of grassland vegetation (Figure 1). The sampling design started from the preliminary identification of homogeneous areas, based on a set of environmental characteristics derived from a digital terrain model [62], geological attributes [63,64], climatic data [65], and vegetation series [66], to characterise the diversity of grassland habitats and be representative of the largest part of the territorial and ecological variability in the entire area covered by the research. The relevé locations were selected within an altitude mostly ranging between 1000 and 2000 m a.s.l. (min 614, max 2383, average 1436 ± 348.6 sd), over an area of about 20,000 ha, taking into consideration a wide variety of slopes and aspects. Areas with extremely discontinuous vegetation cover (total cover <40%) as well as high-altitude primary vegetation types were excluded, as were screes, rock sites with outcropping rock, and those with excessive slopes (>40°). The surveys were carried out before the grazing period on progressive dates for the different sites located at increasing altitudes, to sample each type of vegetation at its moment of maximum vegetative growth.
The vegetation surveys were conducted applying the phytosociological methodology [67,68] and later updates; see [69,70]. Each sampling plot was carried out within standard 4 × 4 m2 sample areas [71,72]. Plots were located inside environmentally/physiognomically homogeneous areas, based on a stratified random criterion. In each plot, the following were noted: (1) site characteristics (geographic coordinates, altitude, aspect, slope, total cover, rockiness/stoniness, bare soil); (2) a complete list of all vascular species present; (3) cover values for each plant species. Geographic coordinates and altitude were measured using a Garmin® GPS Etrex device. Aspect and slope, the latter in three replicates, were measured per plot using the free applications “Commander Compass Go” and “Angle Meter” installed on an Apple® iPAD. Total cover, rockiness, stoniness, and bare soil were assessed as percentages by visual estimation. Plant species were recognized in the field and, when needed, collected and identified in the laboratory, by way of the keys to Italian flora [73,74,75]. Taxa nomenclature was updated in compliance with the Portal to the Flora of Italy [76], taking into account the last floristic updates for the study area [54]. Plant species cover values were estimated as percentages of foliage projection on the ground compared to the total sampling surface. The grassland types were interpreted based on the relevant phytosociological literature, with particular attention to the sources from the study area or neighbouring territories, e.g., [66,77,78,79,80,81,82,83,84,85,86,87,88,89,90,91,92,93,94,95]. The syntaxonomic framework refers to the Prodrome of Italian Vegetation ([96] and subsequent updates) and, in some cases, to the European Vegetation Checklist [97]. The syntaxonomic nomenclature is in accordance with Theurillat et al. [98]. Grassland types were named after existing phytosociological associations. If not assignable to previously described syntaxa, they were named after the dominant plant species. Annex I habitat interpretation follows the official European [58] and national sources [59,99,100].

2.3. Pastoral Value and Biomass Analyses

In order to define the optimal load of grazing animals necessary for the maintenance of each type of seminatural grassland identified, the pastoral value (PV) was calculated. It is expressed by the formula: PV = 0.2 × ΣSPCi × SIi, where SPCi is the specific presence contribution of the i-th species (as a percentage), while SIi is the specific index, ranging from 0 to 5, of the same species [101,102,103,104,105,106,107]. For the SPC, we applied the method based on the “visual estimation” of the degree of coverage, proposed by several authors [108,109,110,111]; for this purpose, we used the cover values detected during the botanical survey. We also applied the classical “point quadrat” methodology [103,104] at a subset of 21 sites and checked whether the results obtained with the two different methods were congruent. To assign the specific index, whose validity is limited to the environmental and geographical context for which it is proposed [112], we analysed the available sources from the Mediterranean Basin [101,107,113] and selected the closest and most comparable sites from the Central Apennines [105,109,114,115,116]. For a precautionary approach, the lowest value was preferred if the same species had different scores.
In order to provide information about the nutritional characteristics of each type of seminatural grassland identified, we measured the grasslands’ productivity in 86 sites. Biomass samples were collected from 1 × 1 m2 plots nested inside the botanical 4 × 4 m2 plots. The net dry matter (DM) was calculated by measuring the dry weight of the mown grass subjected to a temperature of 60 °C until completely dry. After drying, the samples were ground for chemical analysis using a Cyclotec 1093 mill (PBI International, Milan, Italy) using a mesh size of 1 mm. AOAC 920.39, 9142.05 and 796.06 official methods [117] were used, respectively, for ether extract (EE), ash, and crude protein (CP) determination. Fibre fraction content (neutral detergent fibre, NDF; acid detergent fibre, ADF; acid detergent lignin, ADL) was determined according to Van Soest et al.’s method [118] using thermostable alpha-amylase and expressed including residual ashes. Hemicellulose (HEM) was calculated as the difference between NDF and ADF, while cellulose (CEL) was calculated as the difference between ADF and ADL. Non-fibre carbohydrates (NFCs) were calculated by the following equation: NFC (%DM) = 100 − (NDF + CP + Ash + EE). Data were then converted to g/m2, based on the dry matter, since the availability of nutritional parameters per surface unit is more appropriate for evaluating the potential load and carrying capacity in grazed grasslands.

2.4. The Development of a GEE App

With the aim of providing a tool to optimize the time of use of the grasslands by livestock, a GEE app was developed based on the comprehensive archive of Sentinel-2 data, freely available via Google Earth Engine (GEE). Initially, the data were filtered and corrected to ensure only the highest-quality information was used. The first step involved filtering the Sentinel-2 data based on the desired time range and a cloud coverage threshold, which excludes images with a coverage percentage of 20% or more. The Sentinel-2 Scene Classification Layer (SCL) band was also used to eliminate saturated or defective pixels and those representing cloud shadows, clouds, cirrus clouds, and snow. The resulting data were spatially filtered using the grassland category (“30”) from the ESA WorldCover 2021 [119].
The Sentinel-2 data from the preceding 15 days before accessing the app were used to construct an RGB composite image using bands 4, 5, and 6 and a composite near-infrared image using bands 5, 6, and 8. The vegetation growth analysis depended on using the NDVI calculated using the following formula [120]: NDVI = (NIR − Red)/(NIR + Red), where “NIR” represents the near-infrared band and “Red” represents the red band, specifically band 8 and band 4 of Sentinel-2, respectively.
The NDVI was used to build an NDVI median image layer of the last 15 days and an NDVI maximum value layer of the last year. The NDVI graph was constructed using a specific tool in the app interface, which uses the most recent 3 months of data to display the current growth curve. The data from the previous year, included in the 15-month time series data, were used to display the previous growth curve. To build the graph, the time series were smoothed using a Savitzky–Golay filter [121].

2.5. Statistical Analyses

The 141 phytosociological relevés allowed the construction of a matrix consisting of 141 relevés × 354 species, after the exclusion of the sporadic species occurring in fewer than three sample plots. Multivariate analysis was performed using “R”, v. 1.7.12 [122]. A hierarchical cluster analysis (agglomeration method Ward.2 in the “hclust” function) was applied to the normalized relevés × species’ distance matrix (Euclidean distance measure in the “vegdist” function, “vegan” package) in order to identify the main grassland’s vegetation types. The most statistically significant species for each type of grassland were identified using Indicator Species Analysis (ISA, ‘”multipatt” function in “indicspecies” package, association function: IndVal.g, minstat: 0.5, permutations: 9999) [123,124]. Using PAST software v.4.10 [125], we graphically represented the ecological–environmental variability in the identified grassland types with “box and whisker” graphs (parameters: slope, rockiness and stoniness, bare soil, total vegetation cover). The floristic variability, including the number of species per survey plot, Shannon and Simpson biodiversity indexes, and equitability [126], was represented with “violin” plots.
The reliability of the “visual estimation” survey for the PV was tested by applying a regression analysis using RMA (Reduced Major Axis Regression). The normality of both the sets of PV data obtained by the “visual estimation” and “point quadrat” methods (n = 21) was confirmed by a Shapiro–Wilk test [127]. Data were processed by applying a linear model of bivariate regression using RMA (Reduced Major Axis Regression; 95% bootstrapped confidence intervals, n = 1999) with PAST software [128]. The variability in the PV among the different grassland types is graphically represented with “box and jitter” charts and was analysed using PAST software to highlight the statistically significant differences by a Kruskal–Wallis one-way non-parametric ANOVA test, followed by a Mann–Whitney pairwise test. Since the normality of the data was not confirmed by the Shapiro–Wilk test [127], data were log-transformed.
The statistically significant differences between nutritional parameters from the different grassland types were highlighted using a Kruskal–Wallis one-way non-parametric ANOVA test, performed using PAST software. The effects of environmental (altitude, slope) and floristic/vegetation (total cover, number of species per plot) factors on grassland productivity and chemical composition (DM, EE, NDF, ADF, ADL, HEM, CEL, CP, NFC), considered both as percentage values and g/m2, were tested by a Generalized Linear Model (GLM), with data log-transformed using PAST software. Bivariate regression was used to search for correlations between the PV values of the identified grassland types and the measured chemical parameters, expressed as percentages (linear fit, 95% bootstrapped confidence intervals, n = 1999; data log-transformed), using PAST software.

3. Results

3.1. Vegetation Diversity of the Investigated Grasslands

From the 141 relevés carried out, a total of 534 plant species were detected and identified. The dendrogram resulting from the hierarchical classification (Figure S1) highlighted three main clusters, corresponding to macrogroups of grasslands: A—medium–high-altitude seminatural pastures; B—medium–low-altitude seminatural pastures; C—mowed/grazed seminatural meadows. The dissimilarity among the floristic compositions enabled the identification of 17 groups with a comparable level of diversity, corresponding to as many grassland types. From a syntaxonomic point of view, these were framed in four vegetation classes. The first is Festuco-Brometea (cluster A, groups 1 to 3 and 7 to 9, and cluster B), including dry grasslands and steppe vegetation mostly found in hilly and mountainous areas of Europe and Western Siberia, dominated by xerophilic and mesophilic hemicryptophytes and mostly found on calcareous substrates; the second is Nardetea strictae (cluster A, groups 4 to 6), which refers to dense grasslands found on acidic, decarbonated soils in the Atlantic, Central European, and Mediterranean regions; the third is Molinio-Arrhenatheretea (cluster C), including meadows ranging from hygrophilic to mesophilic, distributed from the Temperate to the Mediterranean macrobioclimates, and growing on soils that vary in the quantity of organic matter; and the fourth is Elyno-Seslerietea (cluster A, group 10), represented by the subalpine calcicolous tussock grasslands dominated by graminoids and dwarf chamaephytes, growing on cryoturbated soils, which are covered by snow for long periods [96]. The clusters referring to Nardetea strictae and Elyno-Seslerietea are both nested in the macrogroup A, with which they share a medium–high-altitude location and the occurrence of several plant species related to that altitudinal range. Table S1 lists the 17 detected grassland types, whose complete names mostly refer to existing phytosociological associations, except for types 12, 15, 16, and 17. The Annex I Habitats corresponding to the identified grassland types are also reported in Table S1, together with their altitudinal range and prevalent aspects. Most of the grasslands belong to Annex I Habitat types 6210*, 6230*, and, to a lesser extent, 6170, while mowed/grazed meadows do not correspond to habitats of EU interest. The complete syntaxonomic framework is provided in Table S2. Dominant (average cover > 10%) species for each grassland type are shown in Table S3. The large majority of the grassland types are dominated or co-dominated by Bromopsis erecta (1.Pot_Bra, 2.Poo_Fes, 3.Fes_mic, 7.Koe_Bro, 11.Asp_Bro, 12.Ant_Bra, 13.Pol_Bra, 14.Bri_Bro); two types are strongly dominated by Sesleria nitida (8.Ses_Bro, 9.Ast_Ses), two by Nardus stricta (4.Luz_Nar, 6.Poo_Nar), two by Cynosurus cristatus (15.Alo_pra, 16.Cyn_cri), and the remaining ones by Trifolium thalii (5.Tar_Tri), Sesleria juncifolia (10.Ses_ape), and Alopecurus rendlei (17.Alo_ren). There is never only a single dominant species, except for types 6.Poo_Nar and 9.Ast_Ses.
The Indicator Species Analysis allowed us to identify the species associated with each grassland type, reported in Table S3. The total resulting number of species associated with one group is 202. The number of indicator species per group varies as a consequence of the ecological and floristic peculiarity of each grassland. Some types are very well differentiated by large sets of almost exclusive taxa, such as the matgrass-dominated types (4.Luz_Nar, 6.Poo_Nar), one of the two dominated by Sesleria nitida (8.Ses_Bro), and the one dominated by Sesleria juncifolia (10.Ses_ape), while most of the pastures dominated by Bromopsis erecta show a large number of species with moderate association values (mostly between 0.5 and 0.7), due to the fact that many of those species are shared among this macrogroup of grasslands.
The detected high floristic and vegetation diversity corresponds to a wide variability in relevant environmental parameters, displayed in Figure 2. Slopes range between 0 (flat stands) and 40° with an average of 13° ± 9 sd (Figure 2a). Rockiness/stoniness (Figure 2b) is very scarce on average (6% ranging between 0 and 50%), with the highest values reached by Sesleria nitida stands (8.Ses_Bro). Bare soil (Figure 2c) is seldom present, ranging between 0 and 20%, with an average of 3%. The total vegetation cover (Figure 2d) ranges from 50% to 100% (90% ± 12). The mesophilic grazed/mowed grasslands (15.Alo_pra, 17.Alo_ren) reach the highest cover values, followed by the dwarf Trifolium thalii-dominated community (5.Tar_Tri), while the discontinuous xerophilic vegetation dominated by Sesleria nitida with Stipa dasyvaginata subsp. apenninicola (8.Ses_Bro) shows the lowest.
The number of species per plot (Figure 3a) varied between 11 and 54 (av. 37 ± 9 sd). The highest values were found among the Bromopsis erecta-dominated dry pastures, with Asperulo-Brometum (11.Asp_Bro) being the richest in species, followed by 7.Koe_Bro, 13.Pol_Bra, 14.Bri_Bro, and 2.Poo_Fes, together with the grasslands dominated by Brachypodium genuense (1.Pot_Bra) and Brachypodium rupestre (13_Pol_Bra). The Trifolium thalii-dominated dwarf vegetation (5.Tar_Tri) had the lowest number of species per plot.
Among the considered indexes of biodiversity, Shannon’s (Figure 3b) ranges from 2.181 to 3.915 (av. 3.456 ± 0.307 sd), Simpson’s (Figure 3c) from 0.866 to 0.978 (0.963 ± 0.016), and equitability (Figure 3d) from 0.885 to 0.984 (0.969 ± 0.012). As expected, the Trifolium thalii-dominated community (5.Tar_Tri) has the lowest values for both Shannon’s and Simpson’s indexes. Among the others, the lowest values of diversity were recorded for one of the two matgrass-dominated grassland types (4.Luz_Nar) and the mown/grazed grassland 17.Alo_ren. The strong dominance of Trifolium thalii is reflected by the lowest recorded score of equitability as well. Analogous, although less pronounced, results emerged for 4.Luz_Nar, where the strong dominance of Nardus stricta affects the relative proportion of species in this community. All other grassland types exhibit high or very high levels of biodiversity and a balanced proportion of species, as indicated by the high values of the equitability index.

3.2. Productivity and Nutritional Characteristics of the Grasslands

The values of PV range between 7 and 58 (av 24 ± 8.2 sd) overall. The grassland types with the highest scores are two of the mowed/grazed meadows (16.Cyn_cri and 15.Alo_pra), followed by the grassland types dominated by Festuca rubra subsp. microphylla (3.Fes_mic) and by Trifolium thalii (5.Tar_Tri). The lowest average values of PV are found in the dry grasslands with Sesleria apennina and S. juncifolia (8.Ses_Bro, 9.Ast_Ses, 10.Ses_ape), in the two matgrass-dominated grasslands (6.Poo_Nar and 4.Luz_Nar), and one of the mowed/grazed meadows (17.Alo_ren). The variability in the calculated PV for each identified grassland type is shown in Figure 4. In the charts, data from an additional relevé (“hay_mea”) from the same study area are included for comparison, referring to a hay meadow that is not grazed and is representative of a slightly fertilized lawn not used as a pasture. The results for the reliability of the “visual estimation” survey for calculating the PV are shown in Figure 5. The RMA regression shows a good level of correspondence.
The nutritional parameters are reported in Table 1 as average data (g/m2) ± standard deviation. We included data from the same hay meadow (“hay_mea”) as for the PV. The net dry matter (DM) hugely varies among the different grassland types (from 16.10 to 1113.90 g/m2, av 217.74 ± 207.06 sd). The additional meadow “hay_mea” shows the highest value ever (689.1 g/m2). Among the other types, the highest amount corresponds to the grazed/mowed meadow 15.Alo_pra, although it is largely variable (558.2 g/m2 ± 301.4) followed by 17.Alo_ren (528.0 ± 53.9). A rather high value of net dry matter is scored by 9.Ast_Ses (463.8). The Trifolium thalii-dominated dwarf vegetation (5.Tar_Tri) produces the least amount of dry biomass (26.4). The other groups show variable values, mostly ranging between 66 and 209 g/m2 on average.
Cellulose (CEL), i.e., the more slowly digestible fraction, varies from 4.40 to 431.19 g/m2, with an average of 78.18 (±80.80). It abounds in the mowed/grazed meadows (15.Alo_pra, 17.Alo_ren) and the hay meadow (“hay_mea”), while it is minimal in the 5.Tar_Tri community. A high value for CEL is also displayed by the 9.Ast_Ses grassland type (155.9). Hemicellulose (HEM), i.e., the faster-fermentable fraction, shows a comparable trend among the grassland types. Ether extract (EE), i.e., the total lipidic part, varies between 0.54 and 19.60 g/m2 (av. 5.01 ± 3.96 sd), with the highest values in two of the mowed/grazed meadows (15.Alo_pra with 11.6 ± 4.7 and 17.Alo_ren with 10.5 ± 1.3), in the hay meadow (12.8), and in the 9.Ast_Ses grassland type (12.5), and the lowest in the 5.Tar_Tri community (0.9). The acid detergent fibre (ADF, range 5.55–499.81, av 93.52 ± 93.23 sd), neutral detergent fibre (NDF, 9.27–721.58, 135.96 ± 138.12), and acid detergent lignin (ADL, 1.15–68.62, 15.04 ± 13.18) show comparable trends. Crude protein (CP) and non-fibre carbohydrates (NFCs), i.e., soluble sugars, vary between 1.80 and 90.89 (18.62 ± 16.08) and 3.72 and 196.71 (42.05 ± 39.57), respectively. Apart from the mowed/grazed meadows and the hay meadow, which show the highest scores, the dry grasslands 8.Ses_Bro, 9.Ast_Ses, and 3.Fes_mic are among the richest in CP (14.4 ± 4.9, 37.9, and 16.5 ± 10.7, respectively) and NFCs (41.8 ± 4.1, 97.9, and 43.6 ± 28.6, respectively). Figure 6 represents the nutritional parameters, expressed as a percentage of the net dry matter, in order to compare the intrinsic nutritional properties of the grassland types independently from the considered area.
Among the environmental factors, weak relations can be observed except for slope (°), which is negatively affecting several nutritional parameters, especially CP (g/m2). The percentage values of HEM and CP are positively affected by altitude, while CEL and ADF negatively reflect the elevation. Soluble sugars (NFCs), both as a percentage and g/m2, seem to be negatively affected by altitude. Among the floristic/vegetation factors, the number of species per plot positively affects the percentage values of EE. The total plant cover does not seem to be related to the chemical characteristics of the biomass (Table S4). Table 2 shows the existing correlations between PV and the measured chemical parameters (expressed as percentage values). It is worth noticing that the highest values of CP, NFCs, and EE were recorded in the dwarf grasslands dominated by Trifolium thalii (5.Tar_tri).

3.3. WebGIS-Based Tool for the Informed and Sustainable Use of Grasslands

The developed GEE application, currently in Italian, is publicly accessible via the URL https://mvizzari.users.earthengine.app/view/maiellandvi (accessed on 15 March 2024, Figure S2). The default view displays the RGB composite image from Sentinel 2 of the last 15 days. Any discontinuities or complete absence of images is due to the masking of cloud cover, which is much more frequent in winter. From the Layers menu, besides the grassland areas extracted from the ESA WorldCover, it is possible to display a true-colour and near-infrared composite image, a median NDVI layer of the same period, and a maximum NDVI layer of the previous year. The NDVI layer visualization is based on five classes defined using an equal-interval approach in the 0–0.8 range (NDVI = 0 typically indicates bare soil, while 0.8 can usually be associated with a very high vegetative vigour for grassland canopies). Using the drawing tools, an analysis of the trend in the NDVI index can be performed within the grassland areas by delineating a rectangle or a polygon or simply by selecting a point within the area of interest. The resulting graph shows the growth trend for the last three months in a green colour (Figure S2). In red, it refers to the current date, but in the previous year, while the expected trend in the same index is represented based on the previous three months and the following nine months.

4. Discussion

Based on an integrated outline of botanical knowledge and productive aspects, the present study aims to provide a comprehensive approach to seminatural grasslands management in a protected area, where the use of the resources should comply with a conservative approach. Our floristic–vegetation approach has analogies with the “pasture-type” procedure for the identification, description, and management of pasture types [105], based on the acknowledgement of homogeneous plant communities influenced by both environmental factors and agro-pastoral management, relying on ecologic conditions and plant species combinations to identify ecologic groups and facies [129,130]. We identified 17 distinct grassland types, each with its own intrinsic floristic richness and potential carrying capacity for grazing animals. The botanical survey provided a broad overview of the environmental heterogeneity underlying the complexity of this area. Such a richness of grassland vegetation corresponds to a notable floristic richness, demonstrated by the high number of plant species identified during the botanical surveys, accounting for 23.3% of the 2286 taxa reported for the entire MNP [54]. Considering that the MNP includes a huge range of habitat types, from wetlands to garrigues, scrubs, maquis, forests, edges, screes, and rocky vegetation [61], it appears that a relevant rate of floristic richness is hosted by the investigated seminatural grasslands. The diversity indexes show variable patterns in the identified grassland types. However, high biodiversity is not always directly—or simply—related to high species numbers [131,132,133]. This is the case, e.g., with the matgrass-dominated grasslands (4.Luz_Nar and 6.Poo_Nar), which are typically less rich in species than calcareous grassland but are, nevertheless, acknowledged as the priority habitat 6230* by the Annex I of the “Habitats” Directive [58,59,99]. It is the same case for Taraxaco-Trifolietum thalii (5.Tar_Tri), a very rare plant community localized exclusively on the bottoms of dolines and gullies where snow cover lasts for long periods, which holds very high conservation value [78,134].
The observed floristic and phytocoenotic richness is deeply linked to, and depends on, the disturbance regime provided by extensive grazing activity. Maintaining a sustainable grazing load allows the conservation of high levels of biodiversity and resource availability for the various trophic levels [33,135,136]. In this frame, the MNP stands as an emblematic example for both grassland diversity and the trend of reduction in livestock farming activities and extensive grazing—a destiny shared with other mountain areas of the Mediterranean Basin [34,137,138]. Pastoralism in the area dates back to the Neolithic but, through various events, is currently experiencing a profound decline [137,139,140,141]. For these reasons, the MNP is a challenging case study for the development of appropriate management measures that, while trying to address socio-economical instances, at the same time, contribute to the conservation of secondary grassland habitats. Species-rich grasslands are a valuable feed resource for grazing livestock systems. They contain important nutrients and secondary metabolites (such as phenolic compounds and terpenes), which can influence the rumen metabolism of livestock, reducing methane emissions and ammonia production. Additionally, they provide healing properties and contribute to the organoleptic and nutritional characteristics of meat and dairy products [102,142,143,144,145,146,147]. These resources are destined to disappear with the abandonment of traditional management practices, which leads to structural and functional changes in both environmental characteristics and attributes of grasslands, even in the first dynamic stages [4,33]. Several studies have shown that domestic grazing abandonment can cause a lowering in palatable species coverage and expansion of species of little pastoral value (e.g., Brachypodium genuense, B. rupestre), leading to poorer grasslands, suggested to be among the causes of wild herbivores’ decline [148]. B. genuense is a common spreading species in secondary dry grasslands of habitat 6210, as already monitored in the nearby “Gran Sasso e Monti della Laga” National Park [149]. Additionally, there are reasons other than biodiversity conservation to be interested in the floristic composition of grasslands. Species such as Taraxacum officinale, Poterium sanguisorba, and Lotus corniculatus, which are frequent in the investigated grassland types, have been proven to be excellent sources of forage feed [102,150], but for many other taxa, there is limited information available [102,151,152]. This should represent a push to deepen knowledge of the phytochemical, ecological, and distributional aspects of the numerous grassland plant species that are still little-known.
Our results support the reliability of PV in evaluating the most suitable livestock stocking rate. The good correspondence between the classical “point quadrat” methodology and “visual estimation” gives evidence of the usefulness and effectiveness of the phytosociological survey in plots with a standard area, as suggested by other authors [108,109]. PV is a complex expression of various parameters that interact with each other, including aspects unrelated to forage quality, such as animal preferences of plant essences [103,112,153,154]. Despite the differences in inherent characteristics between the measured chemical parameters and PV, some convergence could be detected in the analysed data. For instance, the dwarf vegetation dominated by Trifolium thalii (5.Tar_Tri), with low biomass per m2 but high PV, exhibited the highest values of proteins (CP) and sugars (NFCs). Its late phenology as a result of snow melting provides delayed resources for livestock and wildlife [78,134]. This suggests that scattered patches of nutrient-rich vegetation can provide relevant nutritional resources, while situations with large biomass production can sometimes have relatively poor nutritional value (e.g., some types of mowed/grazed meadows such as 17.Alo_ren; see Figure 6). The PV provides information on aspects that mere nutritional parameters cannot provide and should, therefore, always be used in a complementary way with chemical analyses for correct planning of the use of the grasslands, always considering that they change during the grazing season, according to the phenological stage of the forage plants.
The chemical attributes of pastures and mowed/grazed meadows have rarely been analysed in combination with both PV and floristic–vegetation traits, mainly in the alpine context [155,156]. More often, forage yield and quality have been evaluated through proxies [157,158,159]. A point of novelty of our research is that it combines floristic and phytosociological characterisation with chemical attributes, pastoral value, and remote sensing, proposing an integrated approach for the conservative management of seminatural grasslands. This is necessary for understanding the potential and sustainable use of the biodiversity of grasslands: the various aspects should not be considered separately because they are mutually dependent.
A balanced animal load is the fundament of the conservative management of grasslands’ biodiversity; both intensification and abandonment drive towards structural and floristic changes and, ultimately, result in biodiversity loss [29,39,135,160,161,162], although geomorphological heterogeneity may preserve a certain level of diversity [163], especially in the most remote, economically unattractive sites [162], which are, however, more frequently abandoned [2,164,165],
The characterization of grasslands is the starting point for providing farmers with management information suitable for the conservative use of seminatural grasslands [105]. The next step would be a spatialization of the information by way of vegetation maps at a scale fine enough (1:10,000) to depict grassland-type variability; however, this would be not only a static view but also an arduous task to accomplish in huge areas, as also pointed out by Primi et al. (2016) [157]. In this frame, the here-developed Google Earth Engine (GEE) application shows particular usefulness in providing near-real-time data to address conservative grassland management and demonstrates the general trend towards highly technological agriculture and robotic environmental monitoring [166,167,168,169,170,171,172,173,174,175,176]. Satellite remote sensing is invaluable in this context, offering a cost-efficient, timely, and replicable method for vegetation analysis [31,177]. The Sentinel-2 constellation from the European Space Agency (ESA) has significantly improved precision techniques used in farming practices [178,179]. This improvement is credited to the satellites’ frequent revisit times, superior spatial and spectral resolution, and the open policy implemented for data access. Sentinel-2 data are beneficial for vegetation monitoring [180] due to their spatial resolution, which varies from 10 to 60 m based on the bands, and their temporal resolution, which is approximately 2–3 days in Europe when both Sentinel-2 satellites are combined.
The Normalized Difference Vegetation Index (NDVI) was selected for its ease of interpretation and its established use in grassland monitoring and management [31,180]. It has been consistently used in empirical correlations with biomass measurements in pastures and meadows, forming the basis for estimating grass productivity [31,181,182,183,184,185,186,187]. The NDVI time series data offer insights into the vegetative growth pattern observed over the previous 15 months, allowing for predicting potential vegetation growth and the timing of peak growth in grassland areas for the current year. While the NDVI is a non-specific index, it correlates closely with the photosynthetic activity of vegetation [188]. Thus, it provides valuable insights into grassland canopies’ health and vegetative status [189]. The recent advancements in information technology and the emergence of cloud-based platforms provide potential solutions to the challenges of data storage, processing, and accessibility [190]. Google Earth Engine (GEE) has emerged as a leader in processing large-scale remote sensing data [191,192]. GEE is a cloud-based platform designed by Google that facilitates the analysis and visualization of extensive geospatial datasets. It also allows the creation of customizable applications that can be accessed directly from a browser [180,190,193], enabling users to generate dynamic, web-based applications for spatial analyses [191]. These applications enhance effective communication and collaboration among users by facilitating the sharing of spatial data [194].
The GEE app is freely accessible to all, requiring no technical expertise or prior experience in using applications or handling geospatial data. It features an intuitive interface that ensures seamless navigation, enabling users to effortlessly visualize the current and previous years’ graphs showing the conditions of grassland areas. It should be noted that due to the real-time processing of NDVI data, the application may sometimes experience slower performance. Moreover, the results showcased in our application were derived from historical data, meaning our projections reflect past, albeit recent, vegetation trends. It would be relevant to incorporate more advanced vegetation productivity models that permit the real-time adjustment of identified vegetation trends based on the prevailing season’s weather conditions, specifically temperature and precipitation. However, the updated level of climate and meteorological data available in GEE is still limited.
The cartographic representations of the NDVI and the graphs generated by the GEE application, which are constantly updated thanks to the cloud platform, can support an effective interpretation of vegetative status and vigour spatially and temporally. When available, the NDVI of the last 15 days can help in investigating the current status of grassland vegetation, while the NDVI maximum of the last year can help in understanding the productivity potential of various areas. The graph tool’s ability to investigate specific portions of the park allows for an analysis of the current vegetative state and a comparison with the expected state based on the previous year’s trends. When combined with an adequate understanding of local pedoclimatic and vegetation factors, these data can be crucial for the more rational and sustainable use of the grazing areas of the MNP, e.g., allowing a limitation of the potential dynamics of over- and undergrazing, which can be problematic for the health of grassland habitats and their related ecosystem services. Indeed, at present, daily grazing circuits characterize sheep and goat shepherding in the studied area, while continuous grazing (with cattle free to roam) is the main strategy in cow–calf and dairy cow systems, with consequent non-optimal pasture utilization showing over- or (to a greater extent) undergrazed areas. An increase in continuous grazing systems has been pointed out in the Italian Alps [195] as a source of negative effects on grassland conservation.
Besides showing relevant layers regarding the vegetative status, the developed app allows comparing the current period’s vegetative growth curve with the corresponding period’s curve one year prior. This information, in combination with appropriate local knowledge, should help farmers assess the status of grassland vegetation, the expected vegetation growth, and the possible forage availability in the various grassland areas in the MNP. Our GEE application may assist in pointing out the highest forage quantitative and qualitative peak from each grassland type, accounting for intra-annual productivity patterns that may show important variability [156,196]. It may prove precious in the expected scenarios of climate change, where modifications in the precipitation regimes and increasing summer drought will affect primary production and interannual variability for seminatural grasslands [196,197].

5. Final Remarks

This study delineates a biodiversity-based approach in support of the conservative use of seminatural grasslands. Integrated knowledge including botanical and productive characterisation, driven by remote sensing technology, may provide decision-making support for protected-area managers in developing and implementing sustainable grassland management, ensuring the long-term maintenance of their biodiversity. The integration between the different scales and fields of analysis is pivotal since the use of remote sensing for assessing and monitoring pastoral resources can achieve reliable results only when supported by supervised classifications and field surveys [46,157,198,199]. Only through such a multidimensional view can the protected areas fulfil their role as natural heritage custodians in such a complex challenge as seminatural habitats, where ecological processes should be combined with human exploitation and economic interests.
The topic of species-rich grasslands and their management has gained increasing attention in recent decades; however, most approaches tend to focus on either productive or conservation issues only. A systematic review of studies focusing on Palaearctic steppes and grasslands concluded that research on these highly biodiverse and vulnerable habitats is quantitatively inadequate [200]. The results of our research highlight the importance of local studies of pastures and mowed/grazed meadows, whose flora is so rich that indicator species generally have only local value [5,71,201].
Investigating and monitoring grassland biodiversity are increasingly needed tasks to understand their dynamics in space and time and define sustainable management practices, especially in a time of climate change [202]. Their seminatural origin and intrinsic dependence on grazing, as well as their huge variety of types and notable floristic richness, show two sides of the same coin and embody the result of a long-lasting, synergic tension between use and preservation [1,34]. This is particularly true in the Apennines: a crossroads of historical, anthropological, biogeographical, environmental, and climatic drivers, which shaped the landscape and its territorial identity through the centuries [137].
Our approach intends to bring attention to the ecological role of extensive livestock farming and its products for seminatural grassland conservation. We hope to stimulate an increase in this type of study, searching for the optimal way to address the appropriate conservative management of such treasures of biodiversity.

Supplementary Materials

The following supporting information can be downloaded at: https://www.mdpi.com/article/10.3390/land13030386/s1. Table S1: List of the grassland types identified in the surveyed pastures and mowed/grazed meadows in the study area; Annex I Habitat types refer to the 92/43/EEC “Habitats” Directive, and their interpretation follows the official European [58] and national sources [59,99]; altitude and aspect were recorded in the field. Table S2: Syntaxonomic scheme used to categorize the grassland types found in the surveyed pastures and mowed/grazed meadows in the study area. The classes are interpreted according to the Prodrome of Italian Vegetation [96] and subsequent updates, symbolized by *], and the European Vegetation Checklist [97], symbolized by °). The types of grassland are listed in bold, with their corresponding ID codes in the right column. Table S3: Dominant species (average cover > 10%; in bold are species with average cover > 15%; average cover ± standard deviation are reported) and Indicator Species Analysis results (association values > 0.5; in bold are species with association values > 0.7; “indicspecies” package for “R”, version 1.7.12, Association function: IndVal.g, minimum statistic value (minstat): 0.5, permutations: 9999) for the 17 identified grassland types. Table S4: Effects of environmental (altitude, slope) and floristic/vegetation (total cover, number of species per plot) factors on the grassland chemical parameters (top: as g/m2; bottom: as percentage) of the identified grassland types, tested by a Generalized Linear Model (GLM). Data are log-transformed. Symbols represent statistical significance: ***, p < 0.001; **, p < 0.01; *, p < 0.05; n.s., not significant (p ≥ 0.05). Legend: net dry matter (DM), cellulose (CEL), hemicellulose (HEM), ethereal extract (EE), acid detergent fibre (ADF), neutral detergent fibre (NDF), acid detergent lignin (ADL), crude protein (CP), non-fibre carbohydrates (NFCs). Figure S1: Dendrogram resulting from the hierarchical cluster analysis. Figure S2: The interface of the “Maiella Park GEE app” developed in this study.

Author Contributions

Conceptualization, D.G., M.P., M.V. and L.D.M.; data curation, F.B., L.M., M.P., A.T., M.V. and L.D.M.; formal analysis, D.G., F.B., M.P., A.T., M.V. and L.D.M.; funding acquisition, D.G. and L.D.M.; investigation, D.G., S.A., F.C., V.D.C., L.M., M.P. and L.D.M.; methodology, D.G., F.B., L.M., M.P., A.T., M.V. and L.D.M.; project administration, D.G. and L.D.M.; resources, D.G.; supervision, D.G., M.P. and L.D.M.; validation, D.G., M.P., M.V. and L.D.M.; writing—original draft, D.G., M.V. and L.D.M.; writing—review and editing, D.G., S.A., F.B., V.D.C., D.D., L.M., M.P., B.V., M.V. and L.D.M. All authors have read and agreed to the published version of the manuscript.

Funding

This research was funded by the “Ente Parco Nazionale della Maiella” in the framework of the Agreement “Studio del valore pabulare dei pascoli e linee guida per la gestione e la conservazione degli habitat 6170-6210-6230-6510 dell’Allegato I della Direttiva 43/92/CEE nel Parco Nazionale della Majella” (CUP F84I19000750001). The research is part of the activities carried out in the framework of the Project “Dalla BIOdiversità al PROdotto e ritorno: modelli di filiere “one health” in Appennino (BIO-PRO-BIO)” at the University of Perugia.

Data Availability Statement

The original contributions presented in the study are included in the article/Supplementary Materials, further inquiries can be directed to the corresponding authors.

Conflicts of Interest

The authors declare no conflicts of interest.

References

  1. Hejcman, M.; Hejcmanová, P.; Pavlů, V.; Beneš, J. Origin and History of Grasslands in Central Europe—A Review. Grass Forage Sci. 2013, 68, 345–363. [Google Scholar] [CrossRef]
  2. Tasser, E.; Tappeiner, U. Impact of Land Use Changes on Mountain Vegetation. Appl. Veg. Sci. 2002, 5, 173–184. [Google Scholar] [CrossRef]
  3. Navarro, L.M.; Proença, V.; Kaplan, J.O.; Pereira, H.M. Maintaining Disturbance-Dependent Habitats. In Rewilding European Landscapes; Pereira, H.M., Navarro, L.M., Eds.; Springer International Publishing: Cham, Switzerland, 2015; pp. 143–167. [Google Scholar] [CrossRef]
  4. Valkó, O.; Venn, S.; Żmihorski, M.; Biurrun, I.; Labadessa, R.; Loos, J. The Challenge of Abandonment for the Sustainable Management of Palaearctic Natural and Semi-Natural Grasslands. Hacquetia 2018, 17, 5–16. [Google Scholar] [CrossRef]
  5. Karlík, P.; Poschlod, P. History or Abiotic Filter: Which Is More Important in Determining the Species Composition of Calcareous Grasslands? Preslia 2009, 81, 321–340. [Google Scholar]
  6. Klimeš, L.; Dančak, M.; Hájek, M.; Jongepierová, I.; Kučera, T. Scale-dependent Biases in Species Counts in a Grassland. J. Veg. Sci. 2001, 12, 699–704. [Google Scholar] [CrossRef]
  7. Wilson, J.B.; Peet, R.K.; Dengler, J.; Pärtel, M. Plant Species Richness: The World Records. J. Veg. Sci. 2012, 23, 796–802. [Google Scholar] [CrossRef]
  8. Habel, J.C.; Dengler, J.; Janišová, M.; Török, P.; Wellstein, C.; Wiezik, M. European Grassland Ecosystems: Threatened Hotspots of Biodiversity. Biodivers. Conserv. 2013, 22, 2131–2138. [Google Scholar] [CrossRef]
  9. Dengler, J.; Biurrun, I.; Boch, S.; Dembicz, I.; Török, P. Grasslands of the Palaearctic Biogeographic Realm: Introduction and Synthesis. In Encyclopedia of the World’s Biomes; Elsevier: Amsterdam, The Netherlands, 2020; pp. 617–637. [Google Scholar] [CrossRef]
  10. Díaz, S.; Pascual, U.; Stenseke, M.; Martín-López, B.; Watson, R.T.; Molnár, Z.; Hill, R.; Chan, K.M.A.; Baste, I.A.; Brauman, K.A.; et al. Assessing Nature’s Contributions to People. Science 2018, 359, 270–272. [Google Scholar] [CrossRef] [PubMed]
  11. Landucci, F.; Panella, L.; Lucarini, D.; Gigante, D.; Donnini, D.; Kell, S.; Maxted, N.; Venanzoni, R.; Negri, V. A Prioritized Inventory of Crop Wild Relatives and Wild Harvested Plants of Italy. Crop Sci. 2014, 54, 1628–1644. [Google Scholar] [CrossRef]
  12. Tscharntke, T.; Klein, A.M.; Kruess, A.; Steffan-Dewenter, I.; Thies, C. Landscape Perspectives on Agricultural Intensification and Biodiversity—Ecosystem Service Management. Ecol. Lett. 2005, 8, 857–874. [Google Scholar] [CrossRef]
  13. Zulka, K.P.; Abensperg-Traun, M.; Milasowszky, N.; Bieringer, G.; Gereben-Krenn, B.-A.; Holzinger, W.; Hölzler, G.; Rabitsch, W.; Reischütz, A.; Querner, P.; et al. Species Richness in Dry Grassland Patches of Eastern Austria: A Multi-Taxon Study on the Role of Local, Landscape and Habitat Quality Variables. Agric. Ecosyst. Environ. 2014, 182, 25–36. [Google Scholar] [CrossRef]
  14. Carboni, M.; Dengler, J.; Mantilla-Contreras, J.; Venn, S.; Török, P. Conservation Value, Management and Restoration of Europe’S Semi-Natural Open Landscapes. Hacquetia 2015, 14, 5–17. [Google Scholar] [CrossRef]
  15. Bengtsson, J.; Bullock, J.M.; Egoh, B.; Everson, C.; Everson, T.; O’Connor, T.; O’Farrell, P.J.; Smith, H.G.; Lindborg, R. Grasslands—More Important for Ecosystem Services than You Might Think. Ecosphere 2019, 10, e02582. [Google Scholar] [CrossRef]
  16. Sollenberger, L.E.; Kohmann, M.M.; Dubeux, J.C.B.; Silveira, M.L. Grassland Management Affects Delivery of Regulating and Supporting Ecosystem Services. Crop Sci. 2019, 59, 441–459. [Google Scholar] [CrossRef]
  17. Isbell, F.; Calcagno, V.; Hector, A.; Connolly, J.; Harpole, W.S.; Reich, P.B.; Scherer-Lorenzen, M.; Schmid, B.; Tilman, D.; van Ruijven, J.; et al. High Plant Diversity Is Needed to Maintain Ecosystem Services. Nature 2011, 477, 199–202. [Google Scholar] [CrossRef] [PubMed]
  18. Janssen, J.A.M.; Rodwell, J.S.; García Criado, M.; Gubbay, S.; Haynes, T.; Nieto, A.; Sanders, N.; Landucci, F.; Loidi, J.; Ssymank, A.; et al. European Red List of Habitats. Part 2. Terrestrial and Freshwater Habitats; Publications Office of the European Union: Luxembourg, 2016. [Google Scholar]
  19. Gigante, D.; Acosta, A.T.R.; Agrillo, E.; Armiraglio, S.; Assini, S.; Attorre, F.; Bagella, S.; Buffa, G.; Casella, L.; Giancola, C.; et al. Habitat Conservation in Italy: The State of the Art in the Light of the First European Red List of Terrestrial and Freshwater Habitats. Rend. Fis. Acc. Lincei 2018, 29, 251–265. [Google Scholar] [CrossRef]
  20. Török, P.; Ambarlı, D.; Kamp, J.; Wesche, K.; Dengler, J. Step(Pe) up! Raising the Profile of the Palaearctic Natural Grasslands. Biodivers. Conserv. 2016, 25, 2187–2195. [Google Scholar] [CrossRef]
  21. EIONET Portal. Habitat Assessments at EU Biogeographical Level, Grasslands, Overall Assessment, 2013–2018. 2019. Available online: https://nature-art17.eionet.europa.eu/article17/habitat/progress/?period=5&group=Grasslands&conclusion=overall+assessment (accessed on 20 December 2023).
  22. Baur, B.; Cremene, C.; Groza, G.; Rakosy, L.; Schileyko, A.A.; Baur, A.; Stoll, P.; Erhardt, A. Effects of Abandonment of Subalpine Hay Meadows on Plant and Invertebrate Diversity in Transylvania, Romania. Biol. Conserv. 2006, 132, 261–273. [Google Scholar] [CrossRef]
  23. Díaz, S.; Lavorel, S.; McIntyre, S.; Falczuk, V.; Casanoves, F.; Milchunas, D.G.; Skarpe, C.; Rusch, G.; Sternberg, M.; Noy-Meir, I.; et al. Plant Trait Responses to Grazing—A Global Synthesis. Glob. Chang. Biol. 2007, 13, 313–341. [Google Scholar] [CrossRef]
  24. Cramer, V.; Hobbs, R.; Standish, R. What’s New about Old Fields? Land Abandonment and Ecosystem Assembly. Trends Ecol. Evol. 2008, 23, 104–112. [Google Scholar] [CrossRef]
  25. Halada, L.; Ružičková, H.; David, S.; Halabuk, A. Semi-Natural Grasslands under Impact of Changing Land Use during Last 30 Years: Trollio-Cirsietum Community in the Liptov Region (N Slovakia). Community Ecol. 2008, 9 (Suppl. 1), 115–123. [Google Scholar] [CrossRef]
  26. Vitasović Kosić, I.; Tardella, F.M.; Ruščić, M.; Catorci, A. Assessment of Floristic Diversity, Functional Composition and Management Strategy of North Adriatic Pastoral Landscape (Croatia). Pol. J. Ecol. 2011, 59, 765–776. [Google Scholar]
  27. Plieninger, T.; Hui, C.; Gaertner, M.; Huntsinger, L. The Impact of Land Abandonment on Species Richness and Abundance in the Mediterranean Basin: A Meta-Analysis. PLoS ONE 2014, 9, e98355. [Google Scholar] [CrossRef]
  28. Viciani, D.; Dell’Olmo, L.; Gabellini, A.; Gigante, D.; Lastrucci, L. Landscape Dynamics of Mediterranean Montane Grasslands over 60 Years and Implications for Habitats Conservation. A Case Study in the Northern Apennines (Italy). Landsc. Res. 2018, 43, 952–964. [Google Scholar] [CrossRef]
  29. Olmeda, C.; Šefferová, V.; Underwood, E.; Millan, L.; Gil, T.; Naumann, S. EU Action Plan to Maintain and Restore to Favourable Conservation Status the Habitat Type 6210 Semi-Natural Dry Grasslands and Scrubland Facies on Calcareous Substrates (Festuco-Brometalia) (*important Orchid Sites). 2019. Available online: https://www.ecologic.eu/17536 (accessed on 25 January 2024).
  30. van den Pol-van Dasselaar, A.; Bastiaansen-Aantjes, L.; Bogue, F.; O’Donovan, M.; Huyghe, C. Grassland Use in Europe: A Syllabus for Young Farmers; Éditions Quae: Versailles, France, 2019. [Google Scholar]
  31. Reinermann, S.; Asam, S.; Kuenzer, C. Remote Sensing of Grassland Production and Management—A Review. Remote Sens. 2020, 12, 1949. [Google Scholar] [CrossRef]
  32. Zarzycki, J.; Korzeniak, J.; Perzanowska, J. Impact of Land Use Changes on the Diversity and Conservation Status of the Vegetation of Mountain Grasslands (Polish Carpathians). Land 2022, 11, 252. [Google Scholar] [CrossRef]
  33. Fantinato, E.; Lorenzato, L.; Buffa, G. Patterns of Floral Resources and Pollination Interactions along Dry Grassland Succession. Plant Sociol. 2023, 60, 93–103. [Google Scholar] [CrossRef]
  34. Ceauşu, S.; Carver, S.; Verburg, P.H.; Kuechly, H.U.; Hölker, F.; Brotons, L.; Pereira, H.M. European Wilderness in a Time of Farmland Abandonment. In Rewilding European Landscapes; Pereira, H.M., Navarro, L.M., Eds.; Springer International Publishing: Cham, Switzerland, 2015; pp. 25–46. [Google Scholar] [CrossRef]
  35. Poschlod, P.; WallisDeVries, M.F. The Historical and Socioeconomic Perspective of Calcareous Grasslands—Lessons from the Distant and Recent Past. Biol. Conserv. 2002, 104, 361–376. [Google Scholar] [CrossRef]
  36. Pykälä, J.; Luoto, M.; Heikkinen, R.K.; Kontula, T. Plant Species Richness and Persistence of Rare Plants in Abandoned Semi-Natural Grasslands in Northern Europe. Basic Appl. Ecol. 2005, 6, 25–33. [Google Scholar] [CrossRef]
  37. Klimek, S.; Gen, R.; Kemmermann, A.; Hofmann, M.; Isselstein, J. Plant Species Richness and Composition in Managed Grasslands: The Relative Importance of Field Management and Environmental Factors. Biol. Conserv. 2007, 134, 559–570. [Google Scholar] [CrossRef]
  38. Schrautzer, J.; Jansen, D.; Breuer, M.; Nelle, O. Succession and Management of Calcareous Dry Grasslands in the Northern Franconian Jura, Germany. Tüxenia 2009, 29, 339–351. [Google Scholar]
  39. Tardella, F.M.; Catorci, A. Context-Dependent Effects of Abandonment vs. Grazing on Functional Composition and Diversity of Sub-Mediterranean Grasslands. Community Ecol. 2015, 16, 254–266. [Google Scholar] [CrossRef]
  40. Vitasović Kosić, I.; Tardella, F.M.; Grbeša, D.; Škvorc, Ž.; Catorci, A. Effects of Abandonment on the Functional Composition and Forage Nutritive Value of a North Adriatic Dry Grassland Community (Ćićarija, Croatia). Appl. Ecol. Environ. Res. 2014, 12, 285–299. [Google Scholar] [CrossRef]
  41. Brooks, T.M.; Mittermeier, R.A.; Da Fonseca, G.A.B.; Gerlach, J.; Hoffmann, M.; Lamoreux, J.F.; Mittermeier, C.G.; Pilgrim, J.D.; Rodrigues, A.S.L. Global Biodiversity Conservation Priorities. Science 2006, 313, 58–61. [Google Scholar] [CrossRef]
  42. Schmeller, D.S.; Gruber, B.; Budrys, E.; Framsted, E.; Lengyel, S.; Henle, K. National Responsibilities in European Species Conservation: A Methodological Review. Conserv. Biol. 2008, 22, 593–601. [Google Scholar] [CrossRef] [PubMed]
  43. Schmeller, D.; Maier, A.; Evans, D.; Henle, K. National Responsibilities for Conserving Habitats—A Freely Scalable Method. NC 2012, 3, 21–44. [Google Scholar] [CrossRef]
  44. Schmeller, D.S.; Evans, D.; Lin, Y.-P.; Henle, K. The National Responsibility Approach to Setting Conservation Priorities—Recommendations for Its Use. J. Nat. Conserv. 2014, 22, 349–357. [Google Scholar] [CrossRef]
  45. Orsenigo, S.; Montagnani, C.; Fenu, G.; Gargano, D.; Peruzzi, L.; Abeli, T.; Alessandrini, A.; Bacchetta, G.; Bartolucci, F.; Bovio, M.; et al. Red Listing Plants under Full National Responsibility: Extinction Risk and Threats in the Vascular Flora Endemic to Italy. Biol. Conserv. 2018, 224, 213–222. [Google Scholar] [CrossRef]
  46. Martinasso, B.; Lombardi, G. Remote Sensing in NW Italian Alps for Pastoral Inventory and Improvement of Grassland Management. In Land Use Systems in Grassland Dominated Regions; Luscher, A., Jeangros, B., Kessler, W., Huguenin, O., Lobsiger, M., Millar, N., Suter, D., Eds.; Grassland Science in Europe; ETH Zentrum: Luzern, Switzerland, 2004; Volume 9, pp. 317–319. [Google Scholar]
  47. Pino-Del-Carpio, A.; Ariño, A.H.; Villarroya, A.; Puig, J.; Miranda, R. The Biodiversity Data Knowledge Gap: Assessing Information Loss in the Management of Biosphere Reserves. Biol. Conserv. 2014, 173, 74–79. [Google Scholar] [CrossRef]
  48. Urbano, F.; Viterbi, R.; Pedrotti, L.; Vettorazzo, E.; Movalli, C.; Corlatti, L. Enhancing Biodiversity Conservation and Monitoring in Protected Areas through Efficient Data Management. Environ. Monit. Assess. 2024, 196, 12. [Google Scholar] [CrossRef] [PubMed]
  49. Conde, D.A.; Staerk, J.; Colchero, F.; Da Silva, R.; Schöley, J.; Baden, H.M.; Jouvet, L.; Fa, J.E.; Syed, H.; Jongejans, E.; et al. Data Gaps and Opportunities for Comparative and Conservation Biology. Proc. Natl. Acad. Sci. USA 2019, 116, 9658–9664. [Google Scholar] [CrossRef] [PubMed]
  50. Demangeot, J. La Montagne de La Majella [The Mountains of Majella]. In Geomorphologie des Abruzzes Adriatiques; Centre National de la Recherche Scientifique (CNRS): Paris, France, 1965; pp. 165–192. [Google Scholar]
  51. Liberatoscioli, E.; Boscaino, G.; Agostini, S.; Garzarella, A.; Patacca Scandone, E. The Majella National Park: An Aspiring UNESCO Geopark. Geosciences 2018, 8, 256. [Google Scholar] [CrossRef]
  52. Di Martino, L.; Del Vecchio, S.; Di Cecco, V.; Di Santo, M.; Stanisci, A.; Frattaroli, A.R. The Role of GA3 in the Germination Process of High-Mountain Endemic and Threatened Species: Leontopodium nivalePinguicula Fiorii and Soldanella Minima Subsp. Samnitica (Central Apennines, Italy). Plant Biosyst.—Int. J. Deal. All Asp. Plant Biol. 2014, 148, 1231–1238. [Google Scholar] [CrossRef]
  53. ISPRA. Meteo 1991–2020. 2023. Available online: https://www.isprambiente.gov.it/it/banche-dati/banche-dati-folder/clima-e-meteo/meteo (accessed on 15 December 2023).
  54. Conti, F.; Ciaschetti, G.; Di Martino, L.; Bartolucci, F. An Annotated Checklist of the Vascular Flora of Majella National Park (Central Italy). Phytotaxa 2019, 412, 1–90. [Google Scholar] [CrossRef]
  55. Rossi, G.; Montagnani, C.; Gargano, D.; Peruzzi, L.; Abeli, T.; Ravera, S.; Cogoni, A.; Fenu, G.; Magrini, S.; Gennai, M.; et al. Lista Rossa Della Flora Italiana. 1. Policy Species e Altre Specie Minacciate. 2013. Available online: https://www.iucn.it/pdf/Comitato_IUCN_Lista_Rossa_della_flora_italiana_policy_species.pdf (accessed on 3 January 2024).
  56. Rossi, G.; Orsenigo, S.; Gargano, D.; Montagnani, C.; Peruzzi, L.; Fenu, G.; Abeli, T.; Alessandrini, A.; Astuti, G.; Bacchetta, G.; et al. Lista Rossa Della Flora Italiana. 2 Endemiti e Altre Specie Minacciate. 2020. Available online: https://www.iucn.it/pdf/LISTAROSSAvol-2-FLORAITALIANA.pdf (accessed on 20 December 2023).
  57. European Commission. Council Directive 92/43/EEC of 21 May 1992 on the Conservation of Natural Habitats and of Wild Fauna and Flora. 1992. Available online: https://eur-lex.europa.eu/legal-content/EN/TXT/?uri=CELEX%3A01992L0043-20130701 (accessed on 13 March 2024).
  58. European Commission. Interpretation Manual of European Union Habitats. EUR 28. 2013. Available online: https://circabc.europa.eu/ui/group/3f466d71-92a7-49eb-9c63-6cb0fadf29dc/library/37d9e6d9-b7de-42ce-b789-622e9741b68f/details (accessed on 15 December 2023).
  59. Biondi, E.; Blasi, C.; Burrascano, S.; Casavecchia, S.; Copiz, R.; Del Vico, E.; Galdenzi, D.; Gigante, D.; Lasen, C.; Spampinato, G.; et al. Manuale Italiano Di Interpretazione Degli Habitat Della Direttiva 92/43/CEE. 2009. Available online: http://vnr.unipg.it/habitat/ (accessed on 10 December 2023).
  60. Frattaroli, A.-R.; Di Martino, L.; Di Cecco, V.; Catoni, R.; Varoni, L.; Di Santo, M.; Gratani, L. Seed Germination Capability of Four Endemic Species in the Central Apennines (Italy): Relationships with Seed Size. LAZA 2013, 34, 43–53. [Google Scholar] [CrossRef]
  61. Di Cecco, V.; Di Santo, M.; Di Musciano, M.; Manzi, A.; Di Cecco, M.; Ciaschetti, G.; Marcantonio, G.; Di Martino, L. The Majella National Park: A Case Study for the Conservation of Plant Biodiversity in the Italian Apennines. IB 2020, 10, 1–24. [Google Scholar] [CrossRef]
  62. Regione Abruzzo. Modello Digitale Del Terreno—Risoluzione 10x10 Metri. 2015. Available online: http://opendata.regione.abruzzo.it/opendata/Modello_digitale_del_terreno_risoluzione_10x10_metri (accessed on 28 December 2023).
  63. Società Geologica Italiana. Abruzzo. Guida Geologica; BeMa Editrice: Milano, Italy, 2003. [Google Scholar]
  64. Patacca, E.; Scandone, P. Geological Map of the Majella Mountain, 1:25,000. 2021. Available online: https://www.isprambiente.gov.it/it/attivita/suolo-e-territorio/cartografia/carta-geologica-della-majella/majella_small.jpg/@@images/b984c8c7-89cb-43a2-8640-3ebebfaf37a5.jpeg (accessed on 15 December 2023).
  65. Pesaresi, S.; Biondi, E.; Casavecchia, S. Bioclimates of Italy. J. Maps 2017, 13, 955–960. [Google Scholar] [CrossRef]
  66. Pirone, G.; Frattaroli, A.R.; Ciaschetti, G. Le Serie Di Vegetazione Della Regione Abruzzo. In La Vegetazione d’Italia; Blasi, C., Ed.; Palombi & Partner S.r.l.: Roma, Italy; pp. 311–336.
  67. Braun-Blanquet, J. Plant Sociology. The Study of Plant Communities. Translated, Revised and Edited by George D. Fuller and Herry S. Conard. Authorized English Translations of ‘Pflanzensoziologie’, 1st ed.; McGraw-Hill Book: New York, NY, USA; London, UK, 1932. [Google Scholar]
  68. Braun-Blanquet, J. Fitosociologia; Blume: Madrid, Spain, 1964. [Google Scholar]
  69. Dengler, J.; Chytrý, M.; Ewald, J. Phytosociology. In Encyclopedia of Ecology; Jørgensen, S.E., Fath, B.D., Eds.; General Ecology; Elsevier: Oxford, UK, 2008; Volume 4, pp. 2767–2779. [Google Scholar]
  70. Biondi, E. Phytosociology Today: Methodological and Conceptual Evolution. Plant Biosyst.—Int. J. Deal. All Asp. Plant Biol. 2011, 145 (Suppl. 1), 19–29. [Google Scholar] [CrossRef]
  71. Gigante, D.; Attorre, F.; Venanzoni, R.; Acosta, A.T.R.; Agrillo, E.; Aleffi, M.; Alessi, N.; Allegrezza, M.; Angelini, P.; Angiolini, C.; et al. A Methodological Protocol for Annex I Habitats Monitoring: The Contribution of Vegetation Science. Plant Sociol. 2016, 53, 77–87. [Google Scholar] [CrossRef]
  72. Chytrý, M.; Otýpková, Z. Plot Sizes Used for Phytosociological Sampling of European Vegetation. J. Veg. Sci. 2003, 14, 563–570. [Google Scholar] [CrossRef]
  73. Pignatti, S. Flora d’Italia. Volume 1; Seconda edizione in 4 volumi; Edagricole: Milano, Italy, 2017. [Google Scholar]
  74. Pignatti, S. Flora d’Italia. Volume 2; Seconda edizione in 4 volumi; Edagricole: Milano, Italy, 2017. [Google Scholar]
  75. Pignatti, S. Flora d’Italia. Volume 3; Seconda edizione in 4 volumi; Edagricole: Milano, Italy, 2018. [Google Scholar]
  76. AA.VV. Portal to the Flora of Italy. 2024. Available online: http://dryades.units.it/floritaly (accessed on 10 January 2024).
  77. Biondi, E.; Guitian, J.; Allegrezza, M.; Ballelli, S. Su Alcuni Pascoli a Sesleria Apennina Ujhelyi Nell’Appennino Centrale. Doc. Phytosoc. N.S. 1988, 11, 417–422. [Google Scholar]
  78. Biondi, E.; Allegrezza, M.; Frattaroli, A.R. Inquadramento Fitosociologico Di Alcune Formazioni Pascolive Dell’ Appennino Abruzzese-Molisano. Doc. Phytosoc. N.S. 1992, 14, 195–210. [Google Scholar]
  79. Biondi, E.; Allegrezza, M.; Ballelli, S.; Calandra, R.; Crescente, M.F.; Frattaroli, A.R.; Gratani, L.; Rossi, A.; Taffetani, F. Indagini per Una Cartografia Fitoecologica Dell’altipiano Di Campo Imperatore (Gran Sasso d’Italia). Boll. A.I.C. 1992, 86, 85–98. [Google Scholar]
  80. Biondi, E.; Ballelli, S. Le Praterie Del Monte Coscerno e Monte Di Civitella (Appennino Umbro- Marchigiano—Italia Centrale). Fitosociologia 1995, 30, 91–121. [Google Scholar]
  81. Biondi, E.; Ballelli, S.; Allegrezza, M.; Taffetani, F.; Frattaroli, A.R.; Guitian, J.; Zuccarello, V. La Vegetazione Di Campo Imperatore (Gran Sasso d’Italia). Braun-Blanquetia 1999, 16, 53–115. [Google Scholar]
  82. Manzi, A. La Gestione Dei Pascoli Montani in Abruzzo e La Società Delle Erbe Seconde Di Pescasseroli Ed Opi. Arch. Bot. Ital. 1990, 66, 129–142. [Google Scholar]
  83. Lucchese, F.; Persia, G.; Pignatti, S. I Pascoli a Bromus Erectus Hudson Dell’ Appennino Laziale. Fitosociologia 1995, 30, 145–180. [Google Scholar]
  84. Petriccione, B.; Persia, G. Prodromo Delle Praterie Di Altitudine Degli Appennini Su Calcare (Classe Festuco-Seslerietea). Atti dei Convegni Lincei. “La vegetazione italiana” 1995, 115, 361–389. [Google Scholar]
  85. Pirone, G. Il Paesaggio Vegetale Di Rivisondoli. Aspetti Della Flora e Della Vegetazione. In Azienda Autonoma Soggiorno e Turismo Rivisondoli; Edigrafital S.p.a.: Teramo, Italy, 1997. [Google Scholar]
  86. Stanisci, A.; Pelino, G.; Blasi, C. Gli Arbusteti Altomontani Dell’Appennino Centrale e Meridionale. Fitosociologia 1997, 34, 3–46. [Google Scholar]
  87. Ubaldi, D.; Filz, W.; De Santo, G.; Di Cecco, M. Osservazioni Sulla Vegetazione Della Riserva Majella Orientale. Micol. Vegetaz. Medit. 1998, 13, 177–192. [Google Scholar]
  88. Allegrezza, M. Vegetazione e Paesaggio Vegetale Della Dorsale Del Monte San Vicino (Appennino Centrale). Fitosociologia 2003, 40, 3–118. [Google Scholar]
  89. Stanisci, A.; Pelino, G.; Blasi, C. Vascular Plant Diversity and Climate Change in the Alpine Belt of the Central Apennines (Italy). Biodivers. Conserv. 2005, 14, 1301–1318. [Google Scholar] [CrossRef]
  90. Ciaschetti, G.; Pirone, A.R.; Frattaroli, A.R.; Corbetta, F. La Vegetazione Del Piano Di Pezza (Parco Naturale Regionale “Sirente-Velino”—Italia Centrale). Fitosociologia 2006, 43, 67–84. [Google Scholar]
  91. Blasi, C.; Burrascano, S.; Del Vico, E.; Di Pietro, R.; Iocchi, M.; Rosati, L. Cynosurion Cristati Grasslands in the Central Apennines (Tyrrhenian Sector): A Phytosociological Survey in the Lepini and Prenestini Mountains. Plant Biosyst.—Int. J. Deal. All Asp. Plant Biol. 2009, 143 (Suppl. 1), S69–S77. [Google Scholar] [CrossRef]
  92. Catorci, A.; Cesaretti, S.; Gatti, R.; Ottaviani, G. Abiotic and Biotic Changes Due to Spread of Brachypodium Genuense (DC.) Roem. & Schult, in Sub-Mediterranean Meadows. Community Ecol. 2011, 12, 117–125. [Google Scholar]
  93. Di Pietro, R.; Conte, A.L.; Iamonico, D. La Vegetazione Di San Martino D’Agri (Monografia e Carta Della Vegetazione); Grafica Mente, Sant’Arcangelo (PZ): Comune di S. Martino D’Agri, Italy, 2014. [Google Scholar]
  94. Di Pietro, R.; Theurillat, J.-P.; Capelo, J.; Fernández-González, F.; Terzi, M.; Čarni, A.; Mucina, L. Nomenclature and Syntaxonomic Notes on Some High-Rank Syntaxa of the European Grassland Vegetation. Lazaroa 2015, 36, 79–106. [Google Scholar] [CrossRef]
  95. Filibeck, G.; Sperandii, M.G.; Bazzichetto, M.; Mancini, L.D.; Rossini, F.; Cancellieri, L. Exploring the Drivers of Vascular Plant Richness at Very Fine Spatial Scale in Sub-Mediterranean Limestone Grasslands (Central Apennines, Italy). Biodivers. Conserv. 2019, 28, 2701–2725. [Google Scholar] [CrossRef]
  96. Biondi, E.; Blasi, C. Prodromo Della Vegetazione Italiana. 2015. Available online: http://www.prodromo-vegetazione-italia.org (accessed on 28 December 2023).
  97. Mucina, L.; Bültmann, H.; Dierßen, K.; Theurillat, J.-P.; Raus, T.; Čarni, A.; Šumberová, K.; Willner, W.; Dengler, J.; García, R.G.; et al. Vegetation of Europe: Hierarchical Floristic Classification System of Vascular Plant, Bryophyte, Lichen, and Algal Communities. Appl. Veg. Sci. 2016, 19 (S1), 3–264. [Google Scholar] [CrossRef]
  98. Theurillat, J.; Willner, W.; Fernández-González, F.; Bültmann, H.; Čarni, A.; Gigante, D.; Mucina, L.; Weber, H. International Code of Phytosociological Nomenclature. 4th Edition. Appl. Veg. Sci. 2021, 24, e12491. [Google Scholar] [CrossRef]
  99. Biondi, E.; Burrascano, S.; Casavecchia, S.; Copiz, R.; Del Vico, E.; Gigante, D.; Lasen, C.; Spampinato, G.; Venanzoni, R.; Zivkovic, L.; et al. Diagnosis and Syntaxonomic Interpretation of Annex I Habitats (Dir. 92/43/EEC) in Italy at the Alliance Level. Plant Sociol. 2012, 49, 5–37. [Google Scholar] [CrossRef]
  100. Angelini, P. Manuali per il Monitoraggio di Specie e Habitat di Interesse Comunitario (Direttiva 92/43/CEE) in Italia: Habitat; ISPRA: Roma, Italy, 2016. [Google Scholar]
  101. Roggero, P.P.; Bagella, S.; Farina, R. Un Archivio Dati Di Indici Specifici per La Valutazione Integrata Del Valore Pastorale. Riv. Agron. 2002, 36, 149–156. [Google Scholar]
  102. Reiné, R.; Ascaso, J.; Barrantes, O. Nutritional Quality of Plant Species in Pyrenean Hay Meadows of High Diversity. Agronomy 2020, 10, 883. [Google Scholar] [CrossRef]
  103. Daget, P.; Poissonet, T. Analyse Phytologique Des Praisies; Centre National de la Recherche Scientifique, Centre d’Études Phytosociologiques et Écologiques: Montpellier, France, 1969. [Google Scholar]
  104. Daget, P.; Poissonet, T. Un Procédé d’estimation de La Valeur Pastorale Des Pâturages. Fourrages 1972, 49, 31–39. [Google Scholar]
  105. Argenti, G.; Lombardi, G. The Pasture-Type Approach for Mountain Pasture Description and Management. Ital. J. Agron. 2012, 7, e39. [Google Scholar] [CrossRef]
  106. Argenti, G.; Bianchetto, E.; Ferretti, F. Proposal of a Simplified Method for Pastoral Value Assessment inside Forest Planning. Ann. Silvic. Res. 2017, 41, 67–73. [Google Scholar] [CrossRef]
  107. Pittarello, M.; Lonati, M.; Gorlier, A.; Perotti, E.; Probo, M.; Lombardi, G. Plant Diversity and Pastoral Value in Alpine Pastures Are Maximized at Different Nutrient Indicator Values. Ecol. Indic. 2018, 85, 518–524. [Google Scholar] [CrossRef]
  108. Bagella, S. Valore Pastorale Delle Associazioni Vegetali: Un Esempio Di Applicazione neIl’Appennino Umbro-Marchigiano (Italia). Fitosociologia 2001, 38, 153–165. [Google Scholar]
  109. Bagella, S.; Roggero, P.P. Integrating Phytosociological and Agronomic Analysis to Support the Sustainable Management of Mediterranean Grasslands. Fitosociologia 2004, 41 (Suppl. 1), 101–107. [Google Scholar]
  110. Bencivenga, M.; Panitti, M.; Taddei, E. Indagine Fitosociologica Nei Prato-Pascoli Del Monte Fausola (Rieti) Sottoposti a Concimazioni Diverse. Nota II—Frequenza e Peso Unitario Delle Specie Più Diffuse. Riv. Agron. 1992, 26, 389–399. [Google Scholar]
  111. Scotton, M.; Rodaro, P.; Ziliotto, U. Analisi Fitosociologica e Valutazione Agronomica Di Pascoli Subalpini. Stud. Geobotanica. Int. J. 1996, 15, 51–72. [Google Scholar]
  112. Delpech, R. Criteres de Jugement de La Valeur Agronomique Des Praires. Fourrages 1960, 4, 83–98. [Google Scholar]
  113. Cavallero, A.; Talamucci, P.; Grignani, C.; Reyneri, A.; Ziliotto, U.; Scotton, M.; Bianchi, A.A.; Santilocchi, R.; Basso, E.; Postiglione, L.; et al. Caratterizzazione Della Dinamica Produttiva Di Pascoli Naturali Italiani. Riv. Agron. 1992, 26, 325–343. [Google Scholar]
  114. Pacioni, G.; Veri, L. L’ambiente Naturale Dei Monti Simbruini: Contributi Alla Conoscenza. Atti Del Convegno: Per Un’operazione Integrata Di Sviluppo, Il Caso Simbruini. Altipiani Di Arcinazzo, 7 December 1985. [Google Scholar]
  115. Scoppola, A.; Pelosi, M. I Pascoli Della Riserva Naturale Del Monte Rufeno (Viterbo, Italia Centrale). Fitosociologia 1995, 30, 123–143. [Google Scholar]
  116. D’Ottavio, P.; Scotton, M.; Ziliotto, U. Pastoral Value of Mountain Pastures of Monti Sibillini (Central Apennines, Italy) Grazed by Sheep. Options Méditerranéennes 2005, 67, 93–98. [Google Scholar]
  117. AOAC. Official Methods of Analysis of AOAC; Association of Official Analytical Chemists (AOAC) International: Washington, DC, USA, 1995. [Google Scholar]
  118. Van Soest, P.J.; Robertson, J.B.; Lewis, B.A. Methods for Dietary Fiber, Neutral Detergent Fiber, and Nonstarch Polysaccharides in Relation to Animal Nutrition. J. Dairy Sci. 1991, 74, 3583–3597. [Google Scholar] [CrossRef]
  119. Zanaga, D.; Van De Kerchove, R.; Daems, D.; De Keersmaecker, W.; Brockmann, C.; Kirches, G.; Wevers, J.; Cartus, O.; Santoro, M.; Fritz, S.; et al. ESA WorldCover 10 m 2021 V200. 2022. Available online: https://doi.org/10.5281/ZENODO.7254221 (accessed on 13 March 2024).
  120. Tucker, C.J. Red and Photographic Infrared Linear Combinations for Monitoring Vegetation. Remote Sens. Environ. 1979, 8, 127–150. [Google Scholar] [CrossRef]
  121. Chen, J.; Jönsson, P.; Tamura, M.; Gu, Z.; Matsushita, B.; Eklundh, L. A Simple Method for Reconstructing a High-Quality NDVI Time-Series Data Set Based on the Savitzky–Golay Filter. Remote Sens. Environ. 2004, 91, 332–344. [Google Scholar] [CrossRef]
  122. R Core Team. R: A Language and Environment for Statistical Computing. 2021. Available online: https://www.R-project.org/ (accessed on 13 March 2024).
  123. De Cáceres, M.; Legendre, P. Associations between Species and Groups of Sites: Indices and Statistical Inference. Ecology 2009, 90, 3566–3574. [Google Scholar] [CrossRef] [PubMed]
  124. De Cáceres, M.; Sol, D.; Lapiedra, O.; Legendre, P. A Framework for Estimating Niche Metrics Using the Resemblance between Qualitative Resources. Oikos 2011, 120, 1341–1350. [Google Scholar] [CrossRef]
  125. Hammer, O.; Harper, D.A.T.; Ryan, P.D. PAST: Paleontological Statistics Software Package for Education and Data Analysis. Palaeontol. Electron. 2001, 4, 1–9. [Google Scholar]
  126. Magurran, A.E. Ecological Diversity and Its Measurement; Springer: Dordrecht, The Netherlands, 1988. [Google Scholar] [CrossRef]
  127. Shapiro, S.S.; Wilk, M.B. An Analysis of Variance Test for Normality (Complete Samples). Biometrika 1965, 52, 591. [Google Scholar] [CrossRef]
  128. Harper, W.V. Reduced Major Axis Regression. In Wiley StatsRef: Statistics Reference Online; Kenett, R.S., Longford, N.T., Piegorsch, W.W., Ruggeri, F., Eds.; Wiley: Hoboken, NJ, USA, 2016; pp. 1–6. [Google Scholar] [CrossRef]
  129. Cavallero, A.; Aceto, P.; Gorlier, A.; Lombardi, G.; Lonati, M.; Martinasso, B.; Tagliatori, C. I Tipi Pastorali Delle Alpi Piemontesi; Gruppo Perdisa Editore: Bologna, Italy, 2007. [Google Scholar]
  130. Targetti, S.; Staglianò, N.; Messeri, A.; Argenti, G. A State-and-Transition Approach to Alpine Grasslands under Abandonment. iForest 2010, 3, 44–51. [Google Scholar] [CrossRef]
  131. Purvis, A.; Hector, A. Getting the Measure of Biodiversity. Nature 2000, 405, 212–219. [Google Scholar] [CrossRef] [PubMed]
  132. Llopis-Belenguer, C.; Blasco-Costa, I.; Balbuena, J.A. Biodiversidad En elSiglo XXI: Más Allá Del Conteo Deespecies. Mètode 2019, 9, 11186. [Google Scholar] [CrossRef]
  133. Hillebrand, H.; Blasius, B.; Borer, E.T.; Chase, J.M.; Downing, J.A.; Eriksson, B.K.; Filstrup, C.T.; Harpole, W.S.; Hodapp, D.; Larsen, S.; et al. Biodiversity Change Is Uncoupled from Species Richness Trends: Consequences for Conservation and Monitoring. J. Appl. Ecol. 2018, 55, 169–184. [Google Scholar] [CrossRef]
  134. Blasi, C.; Di Pietro, R.; Pelino, G. The Vegetation of Alpine Belt Karst-Tectonic Basins in the Central Apennines (Italy). Plant Biosyst.—Int. J. Deal. All Asp. Plant Biol. 2005, 139, 357–385. [Google Scholar] [CrossRef]
  135. Kruess, A.; Tscharntke, T. Grazing Intensity and the Diversity of Grasshoppers, Butterflies, and Trap-Nesting Bees and Wasps. Conserv. Biol. 2002, 16, 1570–1580. [Google Scholar] [CrossRef]
  136. Fantinato, E.; Sonkoly, J.; Török, P.; Buffa, G. Patterns of Pollination Interactions at the Community Level Are Related to the Type and Quantity of Floral Resources. Funct. Ecol. 2021, 35, 2461–2471. [Google Scholar] [CrossRef]
  137. Manzi, A. Storia Dell’ambiente Nell’Appennino Centrale: La Trasformazione Della Natura in Abruzzo Dall’ultima Glaciazione Ai Nostri Giorni; Ed. Meta (Treglio): Chieti, Italy, 2012. [Google Scholar]
  138. Laiolo, P.; Tella, J.L. Fate of Unproductive and Unattractive Habitats: Recent Changes in Iberian Steppes and Their Effects on Endangered Avifauna. Environ. Conserv. 2006, 33, 223–232. [Google Scholar] [CrossRef]
  139. Manzi, A.; Manzi, G. Pastori, Lanaioli e Contadini. La Pastorizia e La Lavorazione Della Lana Nel Versante Orientale Della Maiella; Ed. Meta (Treglio): Chieti, Italy, 2007. [Google Scholar]
  140. Colecchia, A. Paesaggi Storici Agro-Silvo-Pastorali Nell’Abruzzo Interno: Dall’analisi Multidisciplinare al Recupero Delle Identità Culturali Locali. Il Capitale Cult.—Stud. Value Cult. Herit. 2015, 12, 743–771. [Google Scholar]
  141. Micati, E.; Manzi, A.; Di Martino, L.; Monaco, M. Il Paesaggio Agro-Pastorale Del Parco Nazionale Della Majella; Edizioni Parco Nazionale della Majella: Sulmona, Italy, 2019. [Google Scholar]
  142. Ramírez-Restrepo, C.A.; Barry, T.N. Alternative Temperate Forages Containing Secondary Compounds for Improving Sustainable Productivity in Grazing Ruminants. Anim. Feed Sci. Technol. 2005, 120, 179–201. [Google Scholar] [CrossRef]
  143. Macheboeuf, D.; Coudert, L.; Bergeault, R.; Lalière, G.; Niderkorn, V. Screening of Plants from Diversified Natural Grasslands for Their Potential to Combine High Digestibility, and Low Methane and Ammonia Production. Animal 2014, 8, 1797–1806. [Google Scholar] [CrossRef] [PubMed]
  144. Pirhofer-Walzl, K.; Søegaard, K.; Høgh-Jensen, H.; Eriksen, J.; Sanderson, M.A.; Rasmussen, J.; Rasmussen, J. Forage Herbs Improve Mineral Composition of Grassland Herbage. Grass Forage Sci. 2011, 66, 415–423. [Google Scholar] [CrossRef]
  145. Hammond, K.J.; Humphries, D.J.; Westbury, D.B.; Thompson, A.; Crompton, L.A.; Kirton, P.; Green, C.; Reynolds, C.K. The Inclusion of Forage Mixtures in the Diet of Growing Dairy Heifers: Impacts on Digestion, Energy Utilisation, and Methane Emissions. Agric. Ecosyst. Environ. 2014, 197, 88–95. [Google Scholar] [CrossRef]
  146. Farruggia, A.; Martin, B.; Baumont, R.; Prache, S.; Doreau, M.; Hoste, H.; Durand, D. Quels Intérêts de La Diversité Floristique Des Prairies Permanentes Pour Les Ruminants et Les Produits Animaux? INRA Prod. Anim. 2008, 21, 181–200. [Google Scholar] [CrossRef]
  147. Van Vliet, S.; Provenza, F.D.; Kronberg, S.L. Health-Promoting Phytonutrients Are Higher in Grass-Fed Meat and Milk. Front. Sustain. Food Syst. 2021, 4, 555426. [Google Scholar] [CrossRef]
  148. Corazza, M.; Tardella, F.M.; Ferrari, C.; Catorci, A. Tall Grass Invasion After Grassland Abandonment Influences the Availability of Palatable Plants for Wild Herbivores: Insight into the Conservation of the Apennine Chamois Rupicapra Pyrenaica Ornata. Environ. Manag. 2016, 57, 1247–1261. [Google Scholar] [CrossRef]
  149. De Simone, W.; Allegrezza, M.; Frattaroli, A.R.; Montecchiari, S.; Tesei, G.; Zuccarello, V.; Di Musciano, M. From Remote Sensing to Species Distribution Modelling: An Integrated Workflow to Monitor Spreading Species in Key Grassland Habitats. Remote Sens. 2021, 13, 1904. [Google Scholar] [CrossRef]
  150. Lukac, B.; Kramberger, B.; Meclic, V.; Verbic, J. Importance of Non-Leguminous Forbs in Animal Nutrition and Their Ensiling Properties: A Review. Žemdirbyst Agric. 2012, 99, 3–8. [Google Scholar]
  151. Andueza, D.; Rodrigues, A.M.; Picard, F.; Rossignol, N.; Baumont, R.; Cecato, U.; Farruggia, A. Relationships between Botanical Composition, Yield and Forage Quality of Permanent Grasslands over the First Growth Cycle. Grass Forage Sci. 2016, 71, 366–378. [Google Scholar] [CrossRef]
  152. Baumont, R.; Aufrère, J.; Niderkorn, V.; Andueza, D.; Surault, F.; Peccatte, J.R.; Delaby, L.; Pelletier, P. La Diversité Spécifique Dans Le Fourrage: Conséquences Sur La Valeur Alimentaire. Fourrages 2008, 194, 189–206. [Google Scholar]
  153. Loiseau, P. Signification et Limite de l’indice de Valeur Pastorale Pour Le Diagnostic de La Valeur Agricole Des Paturages En Moyenne Montagne Humide. ColI. Phytosoc. 1988, 16, 411–428. [Google Scholar]
  154. Daget, P.; Godron, M. Pastoralisme: Tropeaux, Espaces et Sociétés; Hatier: Paris, France, 1995. [Google Scholar]
  155. Pornaro, C.; Basso, E.; Macolino, S. Pasture Botanical Composition and Forage Quality at Farm Scale: A Case Study. Ital. J. Agron. 2019, 14, 214–221. [Google Scholar] [CrossRef]
  156. Mainetti, A.; Ravetto Enri, S.; Pittarello, M.; Lombardi, G.; Lonati, M. Main Ecological and Environmental Factors Affecting Forage Yield and Quality in Alpine Summer Pastures (NW-Italy, Gran Paradiso National Park). Grass Forage Sci. 2023, 78, 254–267. [Google Scholar] [CrossRef]
  157. Primi, R.; Filibeck, G.; Amici, A.; Bückle, C.; Cancellieri, L.; Di Filippo, A.; Gentile, C.; Guglielmino, A.; Latini, R.; Mancini, L.D.; et al. From Landsat to Leafhoppers: A Multidisciplinary Approach for Sustainable Stocking Assessment and Ecological Monitoring in Mountain Grasslands. Agric. Ecosyst. Environ. 2016, 234, 118–133. [Google Scholar] [CrossRef]
  158. Pittarello, M.; Lonati, M.; Ravetto Enri, S.; Lombardi, G. Environmental Factors and Management Intensity Affect in Different Ways Plant Diversity and Pastoral Value of Alpine Pastures. Ecol. Indic. 2020, 115, 106429. [Google Scholar] [CrossRef]
  159. Napoleone, F.; Probo, M.; Mariotte, P.; Ravetto Enri, S.; Lonati, M.; Argenti, G.; Burrascano, S. Agri-Environmental Payments Drive the Conservation and Forage Value of Semi-Natural Grasslands by Modifying Fine-Scale Grazing Intensity. Biol. Conserv. 2022, 269, 109531. [Google Scholar] [CrossRef]
  160. Fischer, M.; Stöcklin, J. Local Extinctions of Plants in Remnants of Extensively Used Calcareous Grasslands 1950–1985. Conserv. Biol. 1997, 11, 727–737. [Google Scholar] [CrossRef]
  161. Luoto, M.; Pykälä, J.; Kuussaari, M. Decline of Landscape-Scale Habitat and Species Diversity after the End of Cattle Grazing. J. Nat. Conserv. 2003, 11, 171–178. [Google Scholar] [CrossRef]
  162. Kleijn, D.; Rundlöf, M.; Scheper, J.; Smith, H.G.; Tscharntke, T. Does Conservation on Farmland Contribute to Halting the Biodiversity Decline? Trends Ecol. Evol. 2011, 26, 474–481. [Google Scholar] [CrossRef]
  163. Bricca, A.; Tardella, F.M.; Ferrara, A.; Xinfang, X.; Tolu, F.; Catorci, A. Environmental Heterogeneity Compensates the Potential Homogenising Effect of Abandonment of Grazing in a Sub-Mediterranean Mountain Landscape. Plant Ecol. Divers. 2021, 14, 223–243. [Google Scholar] [CrossRef]
  164. MacDonald, D.; Crabtree, J.R.; Wiesinger, G.; Dax, T.; Stamou, N.; Fleury, P.; Gutierrez Lazpita, J.; Gibon, A. Agricultural Abandonment in Mountain Areas of Europe: Environmental Consequences and Policy Response. J. Environ. Manag. 2000, 59, 47–69. [Google Scholar] [CrossRef]
  165. Mottet, A.; Ladet, S.; Coqué, N.; Gibon, A. Agricultural Land-Use Change and Its Drivers in Mountain Landscapes: A Case Study in the Pyrenees. Agric. Ecosyst. Environ. 2006, 114, 296–310. [Google Scholar] [CrossRef]
  166. Zlinszky, A.; Schroiff, A.; Kania, A.; Deák, B.; Mücke, W.; Vári, Á.; Székely, B.; Pfeifer, N. Categorizing Grassland Vegetation with Full-Waveform Airborne Laser Scanning: A Feasibility Study for Detecting Natura 2000 Habitat Types. Remote Sens. 2014, 6, 8056–8087. [Google Scholar] [CrossRef]
  167. King, A. Technology: The Future of Agriculture. Nature 2017, 544, S21–S23. [Google Scholar] [CrossRef]
  168. Tassi, A.; Gigante, D.; Modica, G.; Di Martino, L.; Vizzari, M. Pixel- vs. Object-Based Landsat 8 Data Classification in Google Earth Engine Using Random Forest: The Case Study of Maiella National Park. Remote Sens. 2021, 13, 2299. [Google Scholar] [CrossRef]
  169. Angelini, F.; Angelini, P.; Angiolini, C.; Bagella, S.; Bonomo, F.; Caccianiga, M.; Santina, C.D.; Gigante, D.; Hutter, M.; Nanayakkara, T.; et al. Robotic Monitoring of Habitats: The Natural Intelligence Approach. IEEE Access 2023, 11, 72575–72591. [Google Scholar] [CrossRef]
  170. Angelini, F.; Pollayil, M.J.; Bonini, F.; Gigante, D.; Garabini, M. Robotic Monitoring of Grasslands: A Dataset from the EU Natura2000 Habitat 6210* in the Central Apennines (Italy). Sci. Data 2023, 10, 418. [Google Scholar] [CrossRef]
  171. Kaur, P.; Gigante, D.; Caccianiga, M.; Bagella, S.; Angiolini, C.; Garabini, M.; Angelini, F.; Remagnino, P. Segmentation and Identification of Mediterranean Plant Species. In Advances in Visual Computing; Bebis, G., Ghiasi, G., Fang, Y., Sharf, A., Dong, Y., Weaver, C., Leo, Z., LaViola, J.J., Kohli, L., Eds.; Lecture Notes in Computer Science; Springer Nature: Cham, Switzerland, 2023; Volume 14362, pp. 431–442. [Google Scholar] [CrossRef]
  172. Pereira, F.C.; Charters, S.; Smith, C.M.S.; Maxwell, T.M.R.; Gregorini, P. A Geospatial Modelling Approach to Assess the Capability of High-Country Stations in Delivering Ecosystem Services. Land 2023, 12, 1243. [Google Scholar] [CrossRef]
  173. Vizzari, M.; Parracciani, C.; Gigante, D. Enhanced Map Composition and Diachronic Land Cover Classification of Landsat Data in Google Earth Engine. In Computational Science and Its Applications—ICCSA 2023 Workshops; Gervasi, O., Murgante, B., Rocha, A.M.A.C., Garau, C., Scorza, F., Karaca, Y., Torre, C.M., Eds.; Lecture Notes in Computer Science; Springer Nature: Cham, Switzerland, 2023; Volume 14107, pp. 289–299. [Google Scholar] [CrossRef]
  174. Anderson, N.V.; Petersen, S.L.; Johnson, R.L.; Terry, T.J.; Anderson, V.J. Detecting Floral Resource Availability Using Small Unmanned Aircraft Systems. Land 2024, 13, 99. [Google Scholar] [CrossRef]
  175. Parracciani, C.; Gigante, D.; Mutanga, O.; Bonafoni, S.; Vizzari, M. Land Cover Changes in Grassland Landscapes: Combining Enhanced Landsat Data Composition, LandTrendr, and Machine Learning Classification in Google Earth Engine with MLP-ANN Scenario Forecasting. GISci. Remote Sens. 2024, 61, 2302221. [Google Scholar] [CrossRef]
  176. Parracciani, C.; Gigante, D.; Bonini, F.; Grassi, A.; Morbidini, L.; Pauselli, M.; Valenti, B.; Lilli, E.; Antonielli, F.; Vizzari, M. Leveraging Google Earth Engine for a More Effective Grassland Management: A Decision Support Application Perspective. Sensors 2024, 24, 834. [Google Scholar] [CrossRef]
  177. Michez, A.; Lejeune, P.; Bauwens, S.; Herinaina, A.A.; Blaise, Y.; Castro Muñoz, E.; Lebeau, F.; Bindelle, J. Mapping and Monitoring of Biomass and Grazing in Pasture with an Unmanned Aerial System. Remote Sens. 2019, 11, 473. [Google Scholar] [CrossRef]
  178. Segarra, J.; Buchaillot, M.L.; Araus, J.L.; Kefauver, S.C. Remote Sensing for Precision Agriculture: Sentinel-2 Improved Features and Applications. Agronomy 2020, 10, 641. [Google Scholar] [CrossRef]
  179. Santaga, F.S.; Benincasa, P.; Toscano, P.; Antognelli, S.; Ranieri, E.; Vizzari, M. Simplified and Advanced Sentinel-2-Based Precision Nitrogen Management of Wheat. Agronomy 2021, 11, 1156. [Google Scholar] [CrossRef]
  180. Jiménez-Jiménez, S.I.; Marcial-Pablo, M.D.J.; Ojeda-Bustamante, W.; Sifuentes-Ibarra, E.; Inzunza-Ibarra, M.A.; Sánchez-Cohen, I. VICAL: Global Calculator to Estimate Vegetation Indices for Agricultural Areas with Landsat and Sentinel-2 Data. Agronomy 2022, 12, 1518. [Google Scholar] [CrossRef]
  181. Amies, A.C.; Dymond, J.R.; Shepherd, J.D.; Pairman, D.; Hoogendoorn, C.; Sabetizade, M.; Belliss, S.E. National Mapping of New Zealand Pasture Productivity Using Temporal Sentinel-2 Data. Remote Sens. 2021, 13, 1481. [Google Scholar] [CrossRef]
  182. Schino, G.; Borfecchia, F.; De Cecco, L.; Dibari, C.; Iannetta, M.; Martini, S.; Pedrotti, F. Satellite estimate of grass biomass in a mountainous range in central Italy. Agrofor. Syst. 2003, 59, 157–162. [Google Scholar] [CrossRef]
  183. Edirisinghe, A.; Clark, D.; Waugh, D. Spatio-Temporal Modelling of Biomass of Intensively Grazed Perennial Dairy Pastures Using Multispectral Remote Sensing. Int. J. Appl. Earth Obs. Geoinf. 2012, 16, 5–16. [Google Scholar] [CrossRef]
  184. Hill, M.J.; Donald, G.E.; Hyder, M.W.; Smith, R.C.G. Estimation of Pasture Growth Rate in the South West of Western Australia from AVHRR NDVI and Climate Data. Remote Sens. Environ. 2004, 93, 528–545. [Google Scholar] [CrossRef]
  185. Porter, T.F.; Chen, C.; Long, J.A.; Lawrence, R.L.; Sowell, B.F. Estimating Biomass on CRP Pastureland: A Comparison of Remote Sensing Techniques. Biomass Bioenergy 2014, 66, 268–274. [Google Scholar] [CrossRef]
  186. Barrachina, M.; Cristóbal, J.; Tulla, A.F. Estimating Above-Ground Biomass on Mountain Meadows and Pastures through Remote Sensing. Int. J. Appl. Earth Obs. Geoinf. 2015, 38, 184–192. [Google Scholar] [CrossRef]
  187. Filippa, G.; Cremonese, E.; Galvagno, M.; Bayle, A.; Choler, P.; Bassignana, M.; Piccot, A.; Poggio, L.; Oddi, L.; Gascoin, S.; et al. On the Distribution and Productivity of Mountain Grasslands in the Gran Paradiso National Park, NW Italy: A Remote Sensing Approach. Int. J. Appl. Earth Obs. Geoinf. 2022, 108, 102718. [Google Scholar] [CrossRef]
  188. Cabrera-Bosquet, L.; Molero, G.; Stellacci, A.; Bort, J.; Nogués, S.; Araus, J. NDVI as a Potential Tool for Predicting Biomass, Plant Nitrogen Content and Growth in Wheat Genotypes Subjected to Different Water and Nitrogen Conditions. Cereal Res. Commun. 2011, 39, 147–159. [Google Scholar] [CrossRef]
  189. Li, Z.; Huffman, T.; McConkey, B.; Townley-Smith, L. Monitoring and Modeling Spatial and Temporal Patterns of Grassland Dynamics Using Time-Series MODIS NDVI with Climate and Stocking Data. Remote Sens. Environ. 2013, 138, 232–244. [Google Scholar] [CrossRef]
  190. Shelestov, A.; Lavreniuk, M.; Kussul, N.; Novikov, A.; Skakun, S. Exploring Google Earth Engine Platform for Big Data Processing: Classification of Multi-Temporal Satellite Imagery for Crop Mapping. Front. Earth Sci. 2017, 5, 232994. [Google Scholar] [CrossRef]
  191. Tamiminia, H.; Salehi, B.; Mahdianpari, M.; Quackenbush, L.; Adeli, S.; Brisco, B. Google Earth Engine for Geo-Big Data Applications: A Meta-Analysis and Systematic Review. ISPRS J. Photogramm. Remote Sens. 2020, 164, 152–170. [Google Scholar] [CrossRef]
  192. Gorelick, N.; Hancher, M.; Dixon, M.; Ilyushchenko, S.; Thau, D.; Moore, R. Google Earth Engine: Planetary-Scale Geospatial Analysis for Everyone. Remote Sens. Environ. 2017, 202, 18–27. [Google Scholar] [CrossRef]
  193. Kumar, L.; Mutanga, O. Google Earth Engine Applications Since Inception: Usage, Trends, and Potential. Remote Sens. 2018, 10, 1509. [Google Scholar] [CrossRef]
  194. Rowland, A.; Folmer, E.; Beek, W. Towards Self-Service GIS—Combining the Best of the Semantic Web and Web GIS. IJGI 2020, 9, 753. [Google Scholar] [CrossRef]
  195. Pittarello, M.; Probo, M.; Perotti, E.; Lonati, M.; Lombardi, G.; Ravetto Enri, S. Grazing Management Plans Improve Pasture Selection by Cattle and Forage Quality in Sub-Alpine and Alpine Grasslands. J. Mt. Sci. 2019, 16, 2126–2135. [Google Scholar] [CrossRef]
  196. Catorci, A.; Lulli, R.; Malatesta, L.; Tavoloni, M.; Tardella, F.M. How the Interplay between Management and Interannual Climatic Variability Influences the NDVI Variation in a Sub-Mediterranean Pastoral System: Insight into Sustainable Grassland Use under Climate Change. Agric. Ecosyst. Environ. 2021, 314, 107372. [Google Scholar] [CrossRef]
  197. Scocco, P.; Piermarteri, K.; Malfatti, A.; Tardella, F.M.; Catorci, A. Increase of Drought Stress Negatively Affects the Sustainability of Extensive Sheep Farming in Sub-Mediterranean Climate. J. Arid Environ. 2016, 128, 50–58. [Google Scholar] [CrossRef]
  198. Boschetti, M.; Bocchi, S.; Brivio, P.A. Assessment of Pasture Production in the Italian Alps Using Spectrometric and Remote Sensing Information. Agric. Ecosyst. Environ. 2007, 118, 267–272. [Google Scholar] [CrossRef]
  199. Argenti, G.; Bottai, L.; Chiesi, M.; Maselli, F.; Staglianò, N.; Targetti, S. Analisi e Valutazione Di Pascoli Montani Attraverso l’integrazionedi Dati Multispettrali e Ausiliari. Ital. J. Remote Sens./Riv. Ital.Telerilevam. 2011, 43, 45–57. [Google Scholar] [CrossRef]
  200. Valkó, O.; Zmihorski, M.; Biurrun, I.; Loos, J.; Labadessa, R.; Venn, S. Ecology and Conservation of Steppes and Semi-Natural Grasslands. Hacquetia 2016, 15, 5–14. [Google Scholar] [CrossRef]
  201. Karlík, P.; Poschlod, P. Identifying Plant and Environmental Indicators of Ancient and Recent Calcareous Grasslands. Ecol. Indic. 2019, 104, 405–421. [Google Scholar] [CrossRef]
  202. Ribeiro, P.F.; Santos, J.L. Exploring the Effects of Climate Change on Farming System Choice: A Farm-Level Space-for-Time Approach. Land 2023, 12, 2113. [Google Scholar] [CrossRef]
Figure 1. Map of the study area and location of the MNP borders and sampling plots; in the top right insert: location of the MNP (red point) in Italy and Europe. Administrative boundaries: Eurostat, EuroGeographics (available at https://ec.europa.eu/eurostat/web/gisco/geodata/reference-data/administrative-units-statistical-units, accessed on 3 February 2024).
Land 13 00386 g001
Figure 2. Variability in relevant environmental parameters for the 17 identified grassland types, along with the total plant cover: (a) slope, expressed as degrees (°), (b) rockiness and stoniness, expressed as percentage (%), (c) bare soil, expressed as percentage (%), (d) total vegetation cover, expressed as percentage (%). The full names of the grassland types are reported in Table S1.
Land 13 00386 g002
Figure 3. Variability in biodiversity parameters for the 17 identified grassland types: (a) number of species per standard survey unit (sampling plot: 4 × 4 m2), (b) Shannon index, (c) Simpson index, (d) equitability index. The full names of the grassland types are reported in Table S1.
Land 13 00386 g003
Figure 4. Variability in the calculated pastoral value (PV) based on the “visual estimation” method for each identified grassland type (a); statistically significant differences (b) were tested by Kruskal–Wallis one-way non-parametric ANOVA test (H χ2 = 96.65, p < 0.001) and Mann–Whitney pairwise (*** p < 0.001, ** p < 0.001, * p < 0.05, ns: not significant) tests. The full names of the grassland types are reported in Table S1. Data from an additional relevé (“hay_mea”) from the study area are included in the chart for comparison, referring to a hay meadow that is not grazed and is representative of a slightly fertilized lawn not used as pasture.
Land 13 00386 g004
Figure 5. Reduced Major Axis Regression between the PVs calculated by the “visual estimation” (PV-ve) and the “point quadrat” (PV-pq) methods (95% bootstrapped confidence intervals, n = 1999, r = 0.8, r2 = 0.6, p < 0.001) calculated on log-transformed data.
Land 13 00386 g005
Figure 6. Nutritional parameters expressed as % (average ± standard deviation) measured on the collected biomass for every grassland type; in brackets is the number of samples per grassland type. Data from an additional relevé (“hay_mea”) from the study area are included in the chart for comparison, referring to a hay meadow that is not grazed and is representative of a slightly fertilized lawn not used as pasture. Legend: ethereal extract (EE), crude protein (CP), non-fibre carbohydrates (NFCs), hemicellulose (HEM), cellulose (CEL), acid detergent fibre (ADF), neutral detergent fibre (NDF). The full names of the grassland types are reported in Table S1.
Land 13 00386 g006
Table 1. Nutritional parameters expressed as g/m2 (average ± standard deviation) measured on the collected biomass for every grassland type; in brackets is the number of samples per grassland type. Data from an additional hay meadow that is not grazed and is representative of a slightly fertilized lawn not used as pasture are also included (“hay_mea”). Legend: net dry matter (DM), cellulose (CEL), hemicellulose (HEM), ethereal extract (EE), acid detergent fibre (ADF), neutral detergent fibre (NDF), acid detergent lignin (ADL), crude protein (CP), non-fibre carbohydrates (NFCs). Results of the Kruskal–Wallis one-way non-parametric ANOVA test are reported. The full names of the grassland types are reported in Table S1.
DMCELHEMEEADFNDFADLCPNFC
H χ2 = 59.20
p < 0.001
H χ2 = 44.45
p < 0.001
H χ2 = 44.45
p < 0.001
H χ2 = 54.21
p < 0.001
H χ2 = 60.18
p < 0.001
H χ2 = 56.14
p < 0.001
H χ2 = 62.68
p < 0.001
H χ2 = 49.96
p < 0.001
H χ2 = 62.75
p < 0.001
1.Pot_Bra (2)98.5 ± 42.435.2 ± 14.928.0 ± 10.42.2 ± 0.740.9 ± 17.068.8 ± 27.35.6 ± 2.18.6 ± 3.513.4 ± 8.5
2.Poo_Fes (9)80.2 ± 39.725.4 ± 12.821.6 ± 10.72.3 ± 1.330.2 ± 14.951.8 ± 25.64.8 ± 2.28.5 ± 4.314.2 ± 8.0
3.Fes_mic (4)172.4 ± 95.354.6 ± 27.331.0 ± 12.65.2 ± 3.566.1 ± 34.897.0 ± 46.711.5 ± 7.616.5 ± 10.743.6 ± 28.6
4.Luz_Nar (3)100.8 ± 23.233.5 ± 7.529.2 ± 5.02.1 ± 0.738.8 ± 8.468.0 ± 13.35.3 ± 0.910.8 ± 2.315.1 ± 5.6
5.Tar_Tri (1)26.45.44.10.97.311.31.94.96.9
6.Poo_Nar (5)66.3 ± 17.522.9 ± 6.419.3 ± 6.01.6 ± 0.526.9 ± 7.346.2 ± 13.14.0 ± 0.97.7 ± 2.47.8 ± 1.4
7.Koe_Bro (5)110.4 ± 32.835.0 ± 5.628.8 ± 13.23.0 ± 0.843.2 ± 6.972.0 ± 19.18.3 ± 1.49.6 ± 4.420.4 ± 7.7
8.Ses_Bro (2)209.4 ± 84.678.8 ± 39.939.4 ± 25.75.5 ± 3.297.2 ± 41.9136.6 ± 67.618.3 ± 2.014.4 ± 4.941.8 ± 4.1
9.Ast_Ses (1)463.8155.988.712.5190.8279.534.937.997.9
10.Ses_ape (6)140.0 ± 19.250.7 ± 7.829.3 ± 4.13.3 ± 0.563.1 ± 9.092.4 ± 12.912.4 ± 1.711.1 ± 1.926.9 ± 5.0
11.Asp_Bro (6)125.8 ± 76.744.6 ± 29.723.6 ± 14.83.5 ± 2.354.7 ± 36.278.2 ± 50.910.0 ± 6.69.8 ± 6.126.7 ± 14.6
12.Ant_Bra (12)183.5 ± 55.163.6 ± 18.938.1 ± 10.64.4 ± 1.378.5 ± 25.2116.6 ± 34.914.9 ± 6.713.8 ± 5.438.1 ± 15.1
13.Pol_Bra (6)126.9 ± 62.745.5 ± 25.622.4 ± 17.63.1 ± 1.755.9 ± 29.578.3 ± 47.010.5 ± 4.210.4 ± 4.125.8 ± 7.5
14.Bri_Bro (4)134.3 ± 34.549.8 ± 13.223.3 ± 9.53.7 ± 0.960.8 ± 15.984.0 ± 22.911.0 ± 3.312.8 ± 3.722.2 ± 6.9
15.Alo_pra (10)558.2 ± 301.4207.1 ± 126.2104.4 ± 70.911.6 ± 4.7242.9 ± 143.1347.3 ± 213.735.8 ± 17.445.9 ± 19.0115.4 ± 48.0
16.Cyn_cri (3)162.9 ± 50.651.3 ± 19.928.2 ± 12.13.8 ± 1.060.3 ± 21.988.6 ± 34.09.0 ± 2.122.0 ± 7.333.4 ± 12.4
17.Alo_ren (6)528.0 ± 53.9197.0 ± 15.9122.7 ± 35.910.5 ± 1.3227.7 ± 20.5350.5 ± 47.330.7 ± 7.945.7 ± 3.785.6 ± 26.5
hay_mea (1)689.1283.1119.712.8336.6456.353.547121.4
Table 2. Bivariate regression between PV and the grassland chemical parameters (DM, EE, NDF, ADF, ADL, HEM, CEL, CP, NFC, as percentages) of the identified grassland types (linear fit, 95% bootstrapped confidence intervals, n = 1999). Data are log-transformed. Symbols represent statistical significance: ***, p < 0.001; *, p < 0.05; n.s., not significant (p ≥ 0.05). Legend: net dry matter (DM), cellulose (CEL), hemicellulose (HEM), ethereal extract (EE), acid detergent fibre (ADF), neutral detergent fibre (NDF), acid detergent lignin (ADL), crude protein (CP), non-fibre carbohydrates (NFCs).
ParametersSloperr2p
DM (%)0.060.150.02n.s.
EE (%)0.320.160.03n.s.
NDF (%)−1.84−0.520.27***
ADF (%)−0.78−0.220.05*
ADL (%)−0.09−0.050.00n.s.
HEM (%)−0.61−0.430.02***
CEL (%)−0.68−0.210.05*
CP (%)0.150.100.01n.s.
NFC (%)0.620.460.21***
Disclaimer/Publisher’s Note: The statements, opinions and data contained in all publications are solely those of the individual author(s) and contributor(s) and not of MDPI and/or the editor(s). MDPI and/or the editor(s) disclaim responsibility for any injury to people or property resulting from any ideas, methods, instructions or products referred to in the content.

