
Evaluation and Driving Forces of Ecosystem Service Change in Maqu Alpine Wetland: An Emergy Approach
by
 and
and
Ziyi Han
1,2,
Ruifeng Zhao
1,2,*,
Lihua Zhang
1,2,
Xidong Chen
1,2,
Jingfa Wang
1,2,
Haitian Lu
1,2 and
Fushou Liu
1,2 1
College of Geography and Environmental Science, Northwest Normal University, Lanzhou 730070, China
2
Key Laboratory of Resource Environment and Sustainable Development of Oasis, Lanzhou 730070, China
*
Author to whom correspondence should be addressed.
Land 2024, 13(3), 366; https://doi.org/10.3390/land13030366
Submission received: 9 January 2024
/
Revised: 29 February 2024
/
Accepted: 11 March 2024
/
Published: 14 March 2024
Abstract
:Wetlands are among the most productive ecosystems on Earth, providing various key ecosystem services to humans and other organisms. However, an insufficient understanding of the economic value and importance of wetland resources has seriously weakened the ecosystem service value of wetlands. Thus, a more comprehensive understanding of wetland ecosystem services must be revealed in order to propose appropriate conservation policies. Therefore, to achieve the abovementioned goals, we used the emergy value accounting method to account for the ecosystem service value of the Maqu alpine wetlands, and the Logarithmic Mean Divisia Index was used to analyze the driving forces affecting changes in ecosystem services. The results indicate that the ecosystem service value of the Maqu alpine wetlands showed a trend of decline and then rebound during 1990–2020; its unit area emergy value decreased from 3.85 × 10¹⁰ sej/m2/y to 3.04 × 10¹⁰ sej/m2/y during 1990–2000, and after 2010, it began to gradually rebound. Moreover, the monetary ecosystem service value of the Maqu alpine wetlands continued to rise during the study period, reaching 41.45 USD/m2/y in 2020, thus reflecting the great potential value of wetland ecosystems. Based on our analysis, the key drivers affecting the changes in ecosystem services include economic scale and emergy benefit. Rapid and intensive human activities have boosted local economic development, but these developments have come at the cost of environmental degradation. Finally, some suggestions are proposed. This study suggests that the alpine wetlands in Maqu occupy an important ecological position within the whole Yellow River basin. Therefore, it is worthwhile to invest a significant amount of funding in their restoration and protection.
1. Introduction
With the increasing impact of human activities on natural ecosystems, the relationship between natural ecosystems and human well-being is inevitably becoming stronger [1]. Wetlands are among the most diverse and productive ecosystems in the world, formed by the interaction of the process characteristics of aquatic and terrestrial ecosystems, and provide a wide range of services and benefits to humans, including climate regulation, water purification, flood hazard reduction, recreational and cultural services, and wildlife habitats [2,3,4]. In addition, wetlands are capable of hydrological and chemical cycling and are known as the “kidney of the landscape”. The ecosystem service value (ESV) provided by wetland ecosystems makes them the most valuable ecosystem per unit area [5,6], and Davidson et al. estimate that the global annual monetary value of wetland ecosystem services is approximately USD 47.4 trillion dollars [7], representing 43.5% of the value of all natural resources. Although humans have gradually realized the value and importance of wetland ecosystems [8,9], pristine wetland ecosystems have been destroyed in order to gain land for more productive agricultural practices and access to more productive resources and development space. Since 1990, the world has lost about 50% of its wetlands due to various natural and anthropogenic factors, such as global warming, extreme weather, continued population growth, and accelerated urbanization [10,11,12,13]. Globally, wetland loss is most severe in Asia [14,15]. In China alone, the amount of wetland area decreased by approximately 33% between 1978 and 2008 [16], and the degradation of wetlands, as well as the loss of wetland ESV, have significant negative impacts on overall ecosystems, human livelihoods, and biodiversity.
In general, ESV consists of two components: economic value and ecological value [17]. The most widely applied ESV research methods in previous studies have been the market approach [18], the nonmarket approach [19], and the InVEST model [20]. Only a portion of the benefits provided by wetland ecosystems can be directly traded in the market, and economic valuation methods are a powerful tool for valuing such ecosystem services (ESs) that can be directly assigned a monetary value [21,22]. However, in fact, not all ESs are subject to market transactions; for example, wetlands provide sources of human well-being that also include social and ecological capital [8]. When estimating their value using market-based economic methods, the true value of these environmentally affected ESs may not be revealed [23], i.e., the actual value of ESs may be largely underestimated. Therefore, estimating the value of the overall benefits of ESs is a key challenge for economic valuation methods [8,24]. This also means that in the face of ESs that cannot be incorporated into market transactions, economic valuation methods will no longer be applicable. The emergy accounting method is a precise way to estimate the ESV from a donor’s perspective. It provides a method to value ESs by means of unifying different types of ESVs into solar equivalent joules (sej) [25,26,27], and it has also been widely used in the valuation of ESs of various wetlands [26,28,29,30]. For example, Yang et al. used the emergy method to calculate the distribution of aquatic ESV in several provinces in China [31]. Sun et al. have also used it to quantify various inputs and ESVs in wetland restoration, in addition to assessing the sustainability of wetlands [32,33]. Generally, the emergy accounting method is an appropriate way to evaluate ESs, as it can reflect the internal relevance and properties of ESs but avoid the limitations of economic valuation methods. For this reason, the emergy accounting method is chosen to assess the overall benefits of ESs, with the aim of objectively revealing the ESV of Maqu alpine wetlands.
As the most representative alpine inland wetlands, the bogs of the Maqu alpine wetlands are densely distributed and are important ecological reservoirs on the Qinghai–Tibet Plateau. They have an irreplaceable role in water conservation, flood regulation, climate regulation, and water purification. However, the degradation of alpine wetlands has damaged the structure of wetlands and weakened their ecological service functions [34,35], which seriously threatens the ecological security and high-quality development of the upper Yellow River. Due to the sensitivity and vulnerability of alpine wetlands, many scholars have studied their ESVs [32,36]. Wu et al. [37] used land use data to estimate the ESV of ecosystem services on the Tibetan Plateau and revealed the spatial and temporal distribution characteristics of the average ESV. Liu et al. [38] used the InVEST model to determine the spatio–temporal pattern of ESV in Yushu and the central region of the Tibetan Plateau over the past 20 years and discussed its relationship with land use change and human well-being. Li et al. [39] studied the spatio–temporal dynamics and natural driving mechanisms of different typical ecosystem services in the northeast of the Qinghai–Tibet Plateau and explored the trade-offs and synergies between ESs. Previous methods for assessing the value of alpine wetland ecosystems are highly limited, and a comprehensive evaluation of the degradation, restoration, and economic benefits of alpine wetland ESs remains incomplete. It is not only necessary to evaluate the ESV situation of Maqu alpine wetlands by employing appropriate methods but also to reveal the driving factors affecting the changes in ESV. Hence, we utilize the Logarithmic Mean Divisia Index (LMDI) method to explore the driving factors of ESV changes [40,41]. When evaluating the contribution of each driving factor, the LMDI method is one of the most commonly used indicator decomposition methods [42]. Compared with other analysis methods, it has a good theoretical basis, adaptability, and easily interpretable results. It is also easy to use and widely used in the decomposition of driving factors [42]. Sun et al. [43] used the LMDI method to analyze the sustainable development level of Shenyang and determined the driving force of energy utilization. Isik et al. [42] used the LMDI method to analyze the driving forces of CO2 emissions from the transport sector in Turkey. In addition, compared with other decomposition analysis methods, the LMDI method also demonstrates the advantage of no residual terms [40]. Thus, this is the preferred method to solve the problem of further analyzing the contribution of key drivers. Therefore, the specific objectives of this study are to (1) assess the ESV of alpine wetlands in Maqu County, Gannan Prefecture, and analyze the changes in their ESV in conjunction with the changes in wetland areas between 1990 and 2020 and (2) utilize the LMDI method to determine the contribution degree of different key drivers.
2. Materials and Methods
2.1. Study Area
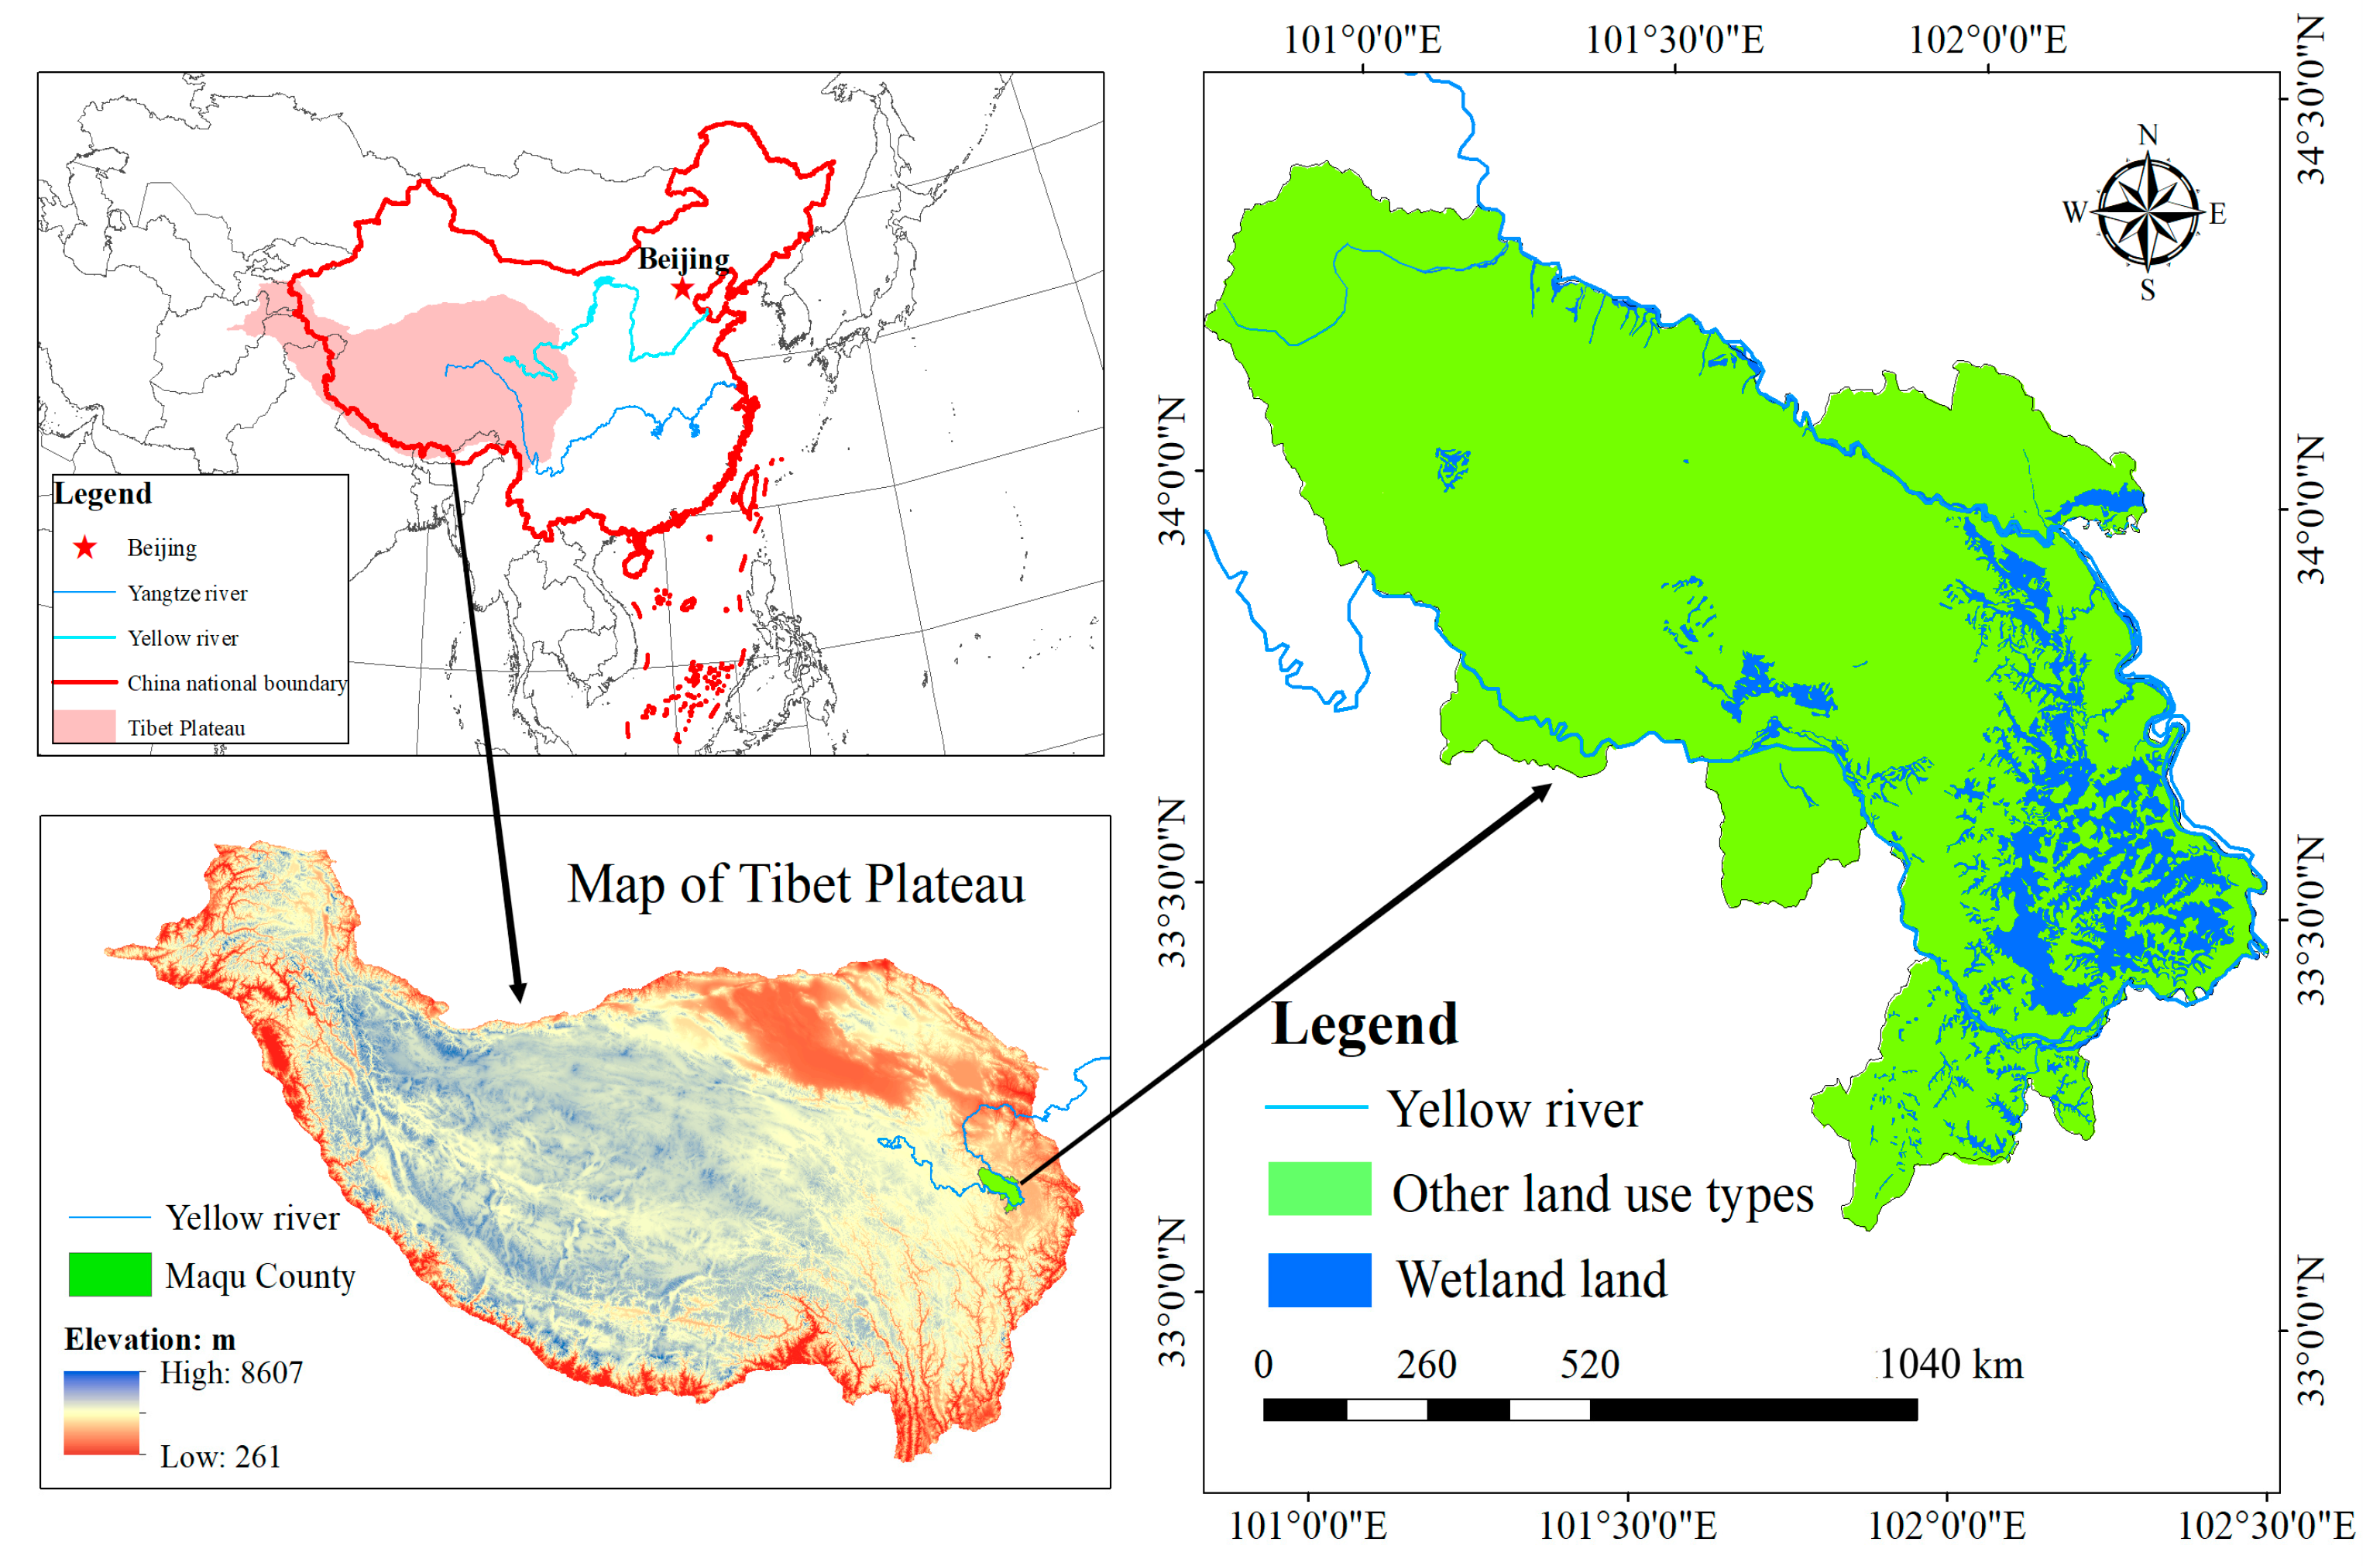
Maqu County is in the upper reaches of the Yellow River. It is situated in the southwest of Gannan Tibetan Autonomous Prefecture, a combination of Gansu, Qinghai, and Sichuan provinces (located at 101°15′–102°29′ east longitude, 33°00′–34°30′ north latitude). The territory is 3300–4806 m above sea level, with a high terrain in the west and low terrain in the east. The climate is characterized as cold and humid alpine, with an average annual precipitation of 615.5 mm, an average sunshine duration of 2419.1 h, an average annual temperature of 3.0 °C, and an annual relative frost-free period of about 19 days. Maqu County covers an area of 10,191 km2. The Yellow River accounts for up to 45% of the outflow from Maqu and has the prestigious name of “The first bend of the Yellow River”. It is one of the most representative alpine marsh wetlands in China, as well as one of the areas with the highest density of marsh distribution (Figure 1).
2.2. Data Source
The included data sources comprise three types: remote sensing image data of land use types, physical quantity data related to the accounting of the emergy value of each wetland ecosystem service function, and transformity data for converting emergy into emergy value. In particular, the remote sensing images of land use types in Maqu County from 1990 to 2020 were collected through the Geospatial Data Cloud (https://www.gscloud.cn/ (accessed on 19 August 2021)). The original data on materials were mainly derived from the Statistical Yearbook of Gannan Prefecture (1990, 2000, 2010, and 2020), Maqu County Annals (1990 and 2000), Gansu Yearbook (2000 and 2005), and Gansu Water Resources Bulletin (2000 and 2010). The unit emergy values (UEVs) came from the authors’ previous research. Detailed data sources are listed in Table S1.
2.3. Methodology
2.3.1. Wetland Ecosystem Service Function Classification System
Based on comprehensiveness, we selected the ES classification framework based on the Millennium Ecosystem Assessment and Fisher [1,44,45]. The ESs of wetlands in Maqu County were described using three categories: provisioning services, regulating services, and cultural services. In addition to the 9 functions mentioned in Table 1, wetlands also have the function of alleviating floods and rainstorms. However, due to the difficulty in obtaining data, we have not quantified them, but the importance of this function cannot be ignored. We screened the final services that fit the alpine wetland ecosystem of Maqu under this ecosystem classification system. Table 1 shows these ESs in detail.
2.3.2. Emergy Value Accounting Methods for Wetland Ecosystem Service Values
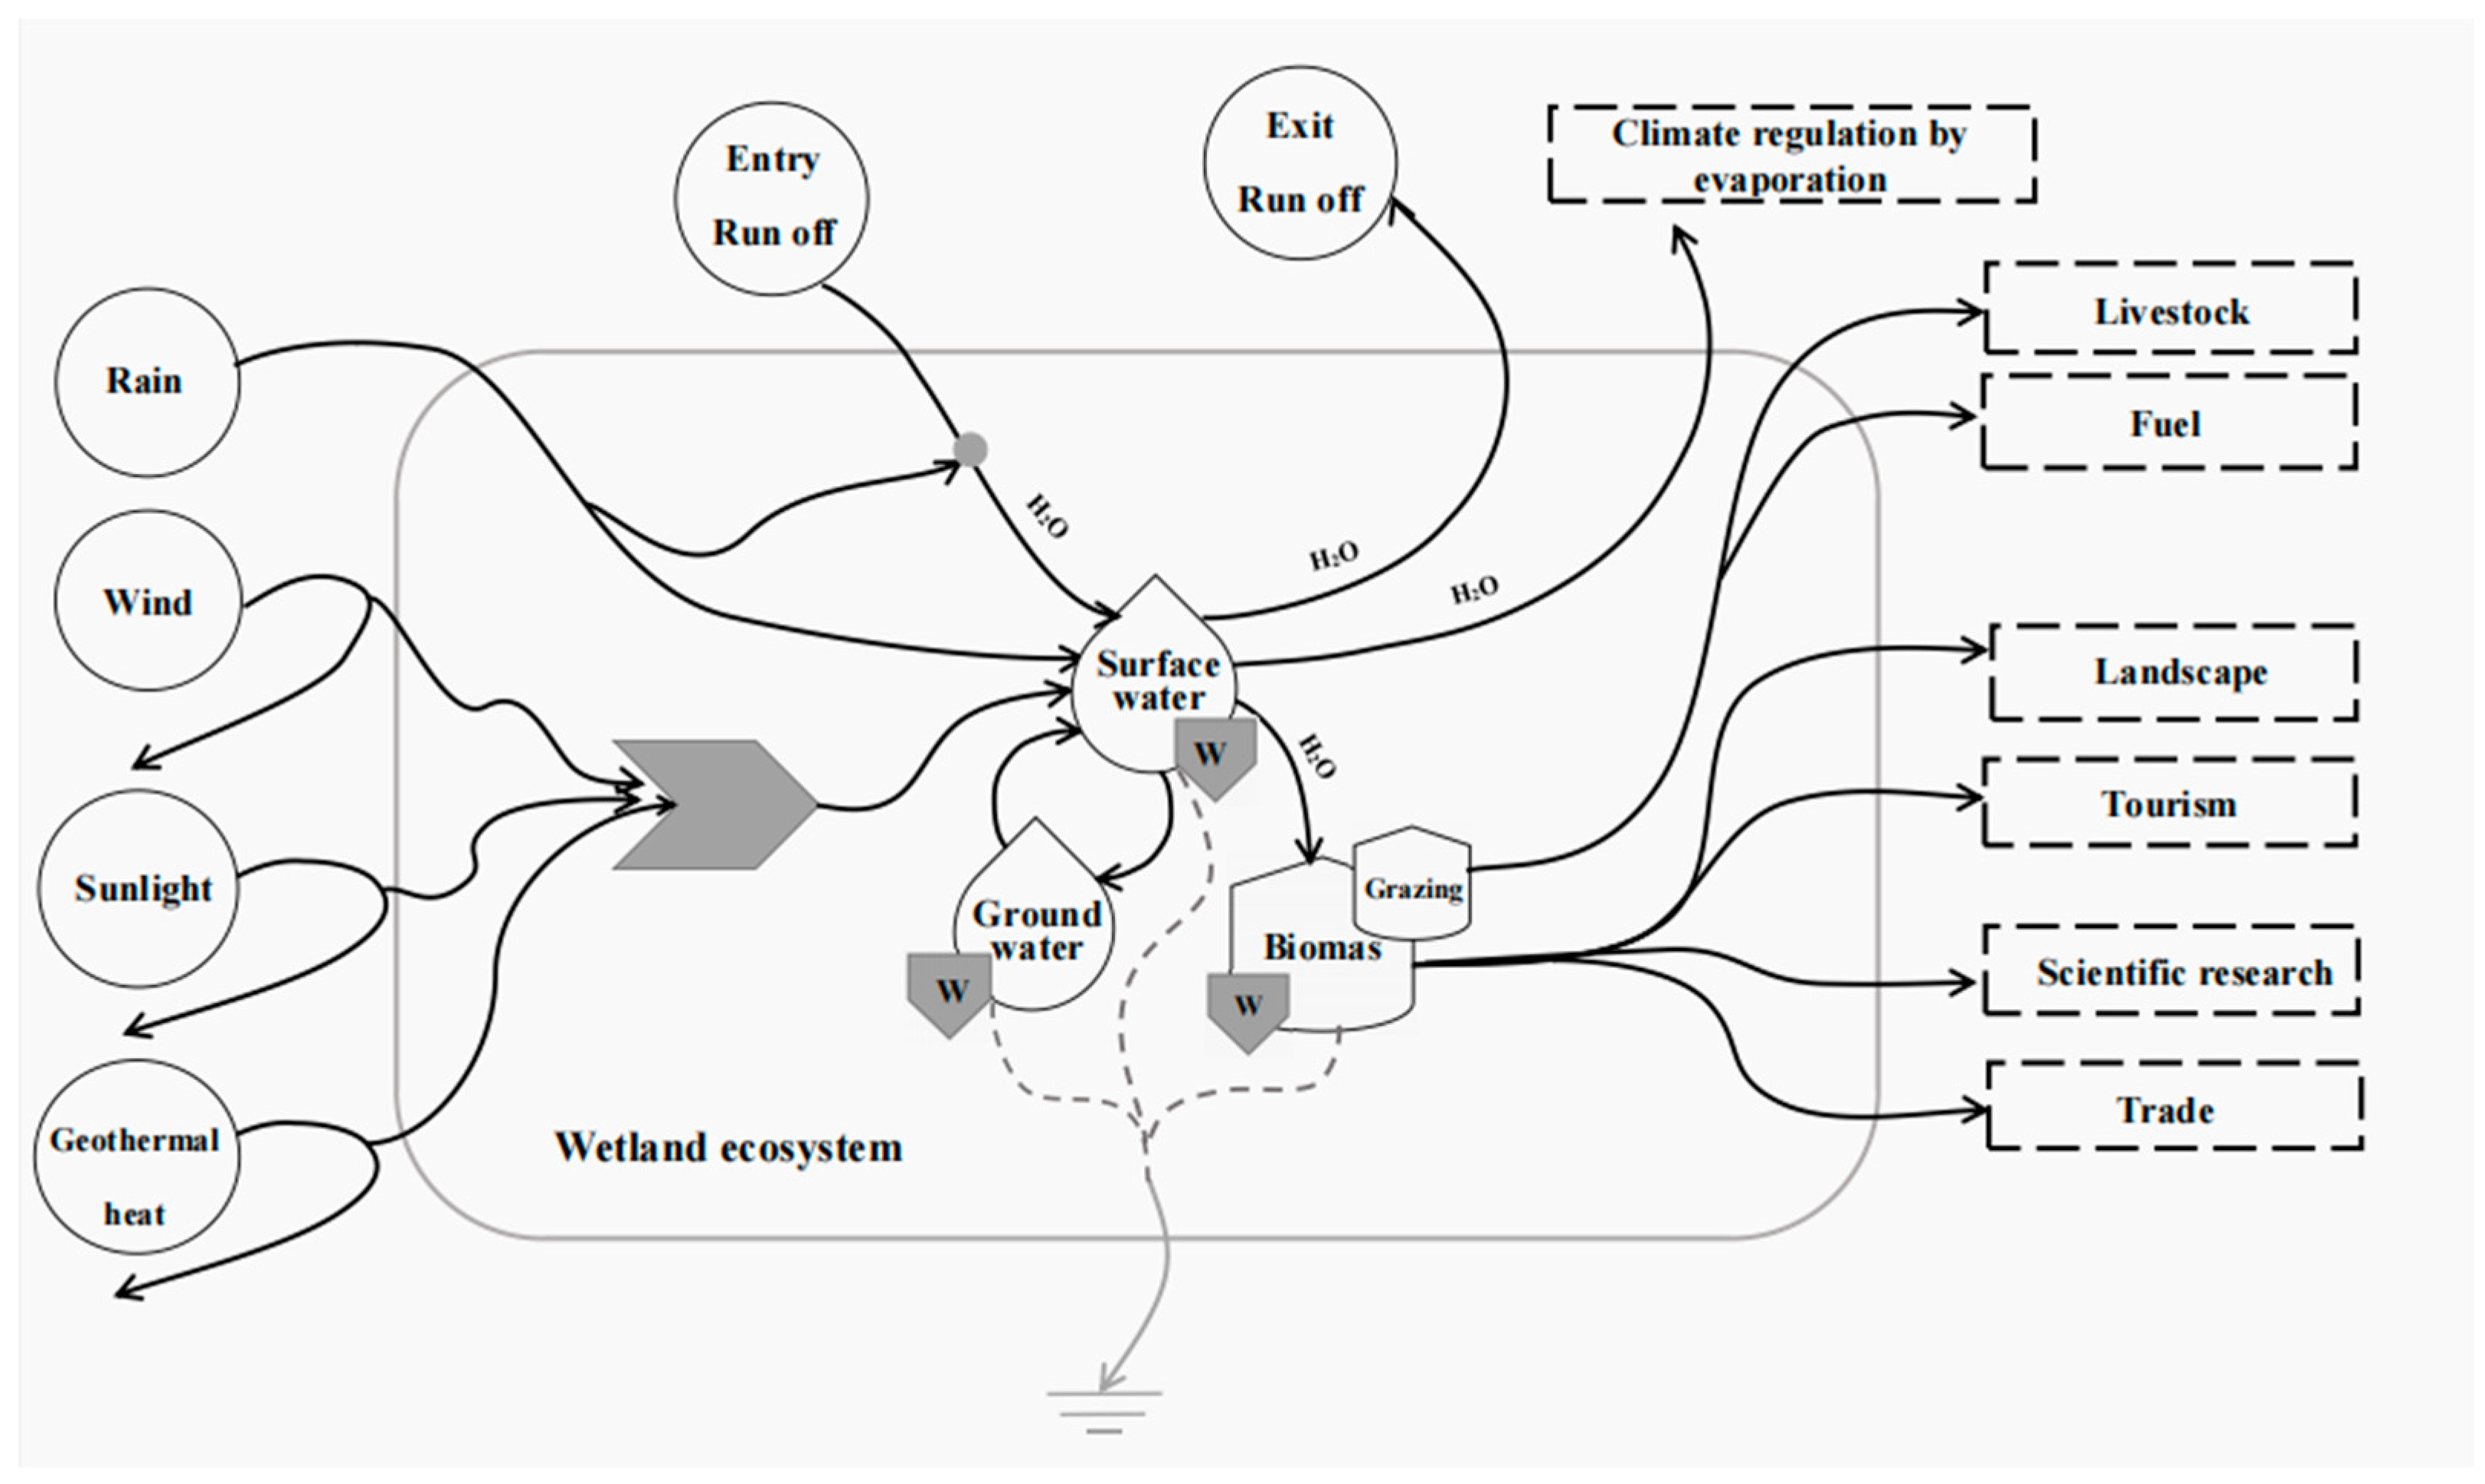
An emergy map of the wetland ecosystem is shown in Figure 2, illustrating the flow of various emergy consumed in the conversion process. The baseline emergy value used in this study refers to the emergy value assessment value of global renewable resources by Brown and Ulgiati [46]: 12.0 × 1024. The basic equation of the emergy value analysis method is as follows:
where E denotes the total solar emergy value; fi denotes the i-th material or emergy input stream; and UEVi is the per unit energy of the i-th element. The formula for calculating the emergy of each ecosystem service is shown in Supplementary Materials.
2.4. Logarithmic Mean Divisia Index
The Maqu wetlands provide services that benefit the residents of the entire basin. However, human activities and climate change have degraded ecosystems, creating serious ecological challenges. It is necessary to identify the key drivers that affect the changes in ESs in order to devise an appropriate long-term development strategy. Such goals require the establishment of a decomposition formula. Before applying the LMDI method, emergy benefit (EB), economic scale (ES), grassland resource endowment (GR), grazing intensity (GI), livestock farming scale (LS), water consumption (WC), and water resource endowment (WE) were analyzed as the key driving forces (Table 2). Unit area ESs (Ep) can be used to reflect the impact of Maqu wetlands on the whole of Maqu County; the equation for describing the relationships among different factors contributing to Ep is expressed below (Equation (2)):
where Ep, U, and A represent ESs per unit area within Maqu County (sej/m2), the emergy value of total ESs (sej), and the area of Maqu County (m2), respectively. GDP, POP, GA, LP, WQ, and WI represent the gross regional product of Maqu County (RMB), population of Maqu County (person), grassland area of Maqu County (m3), number of livestock (kg), water consumption by local people (m3), and total water inflow (m3), respectively. EB (=U/GDP) denotes the emergy value of ES per unit GDP; ES (=GDP/POP) denotes economic output per capita; GR (=POP/GA) denotes grassland resources provided per capita by wetland in Maqu County; GI (=GA/LP) denotes grassland area supporting the survival of each livestock; LS (=LP/WQ) represents the number of livestock supported per unit of water consumption; WC (=WQ/WI) represents the proportion of human-used water in the total surface water inflow into Maqu County; WE (=WI/A) denotes water inflow per unit area.
In this section, we decompose the changes in the aggregated indicator (ΔEp) caused by various driving factors from the baseline year (Ep0) to the final year (Epn). There are two forms for applying the LMDI method, namely, additive or multiplicative form [41]. In this study, we use the additive form, the main decomposition formula of which is as follows (Equations (3)–(11)):
3. Results
3.1. Emergy Value of Maqu County ESs
Using the emergy value accounting method for the 1990–2020 wetland ES value in Maqu County, the accounting process for 2020 is illustrated herein as an example, as detailed in Table 3. Data for other years are detailed in Tables S2–S4.
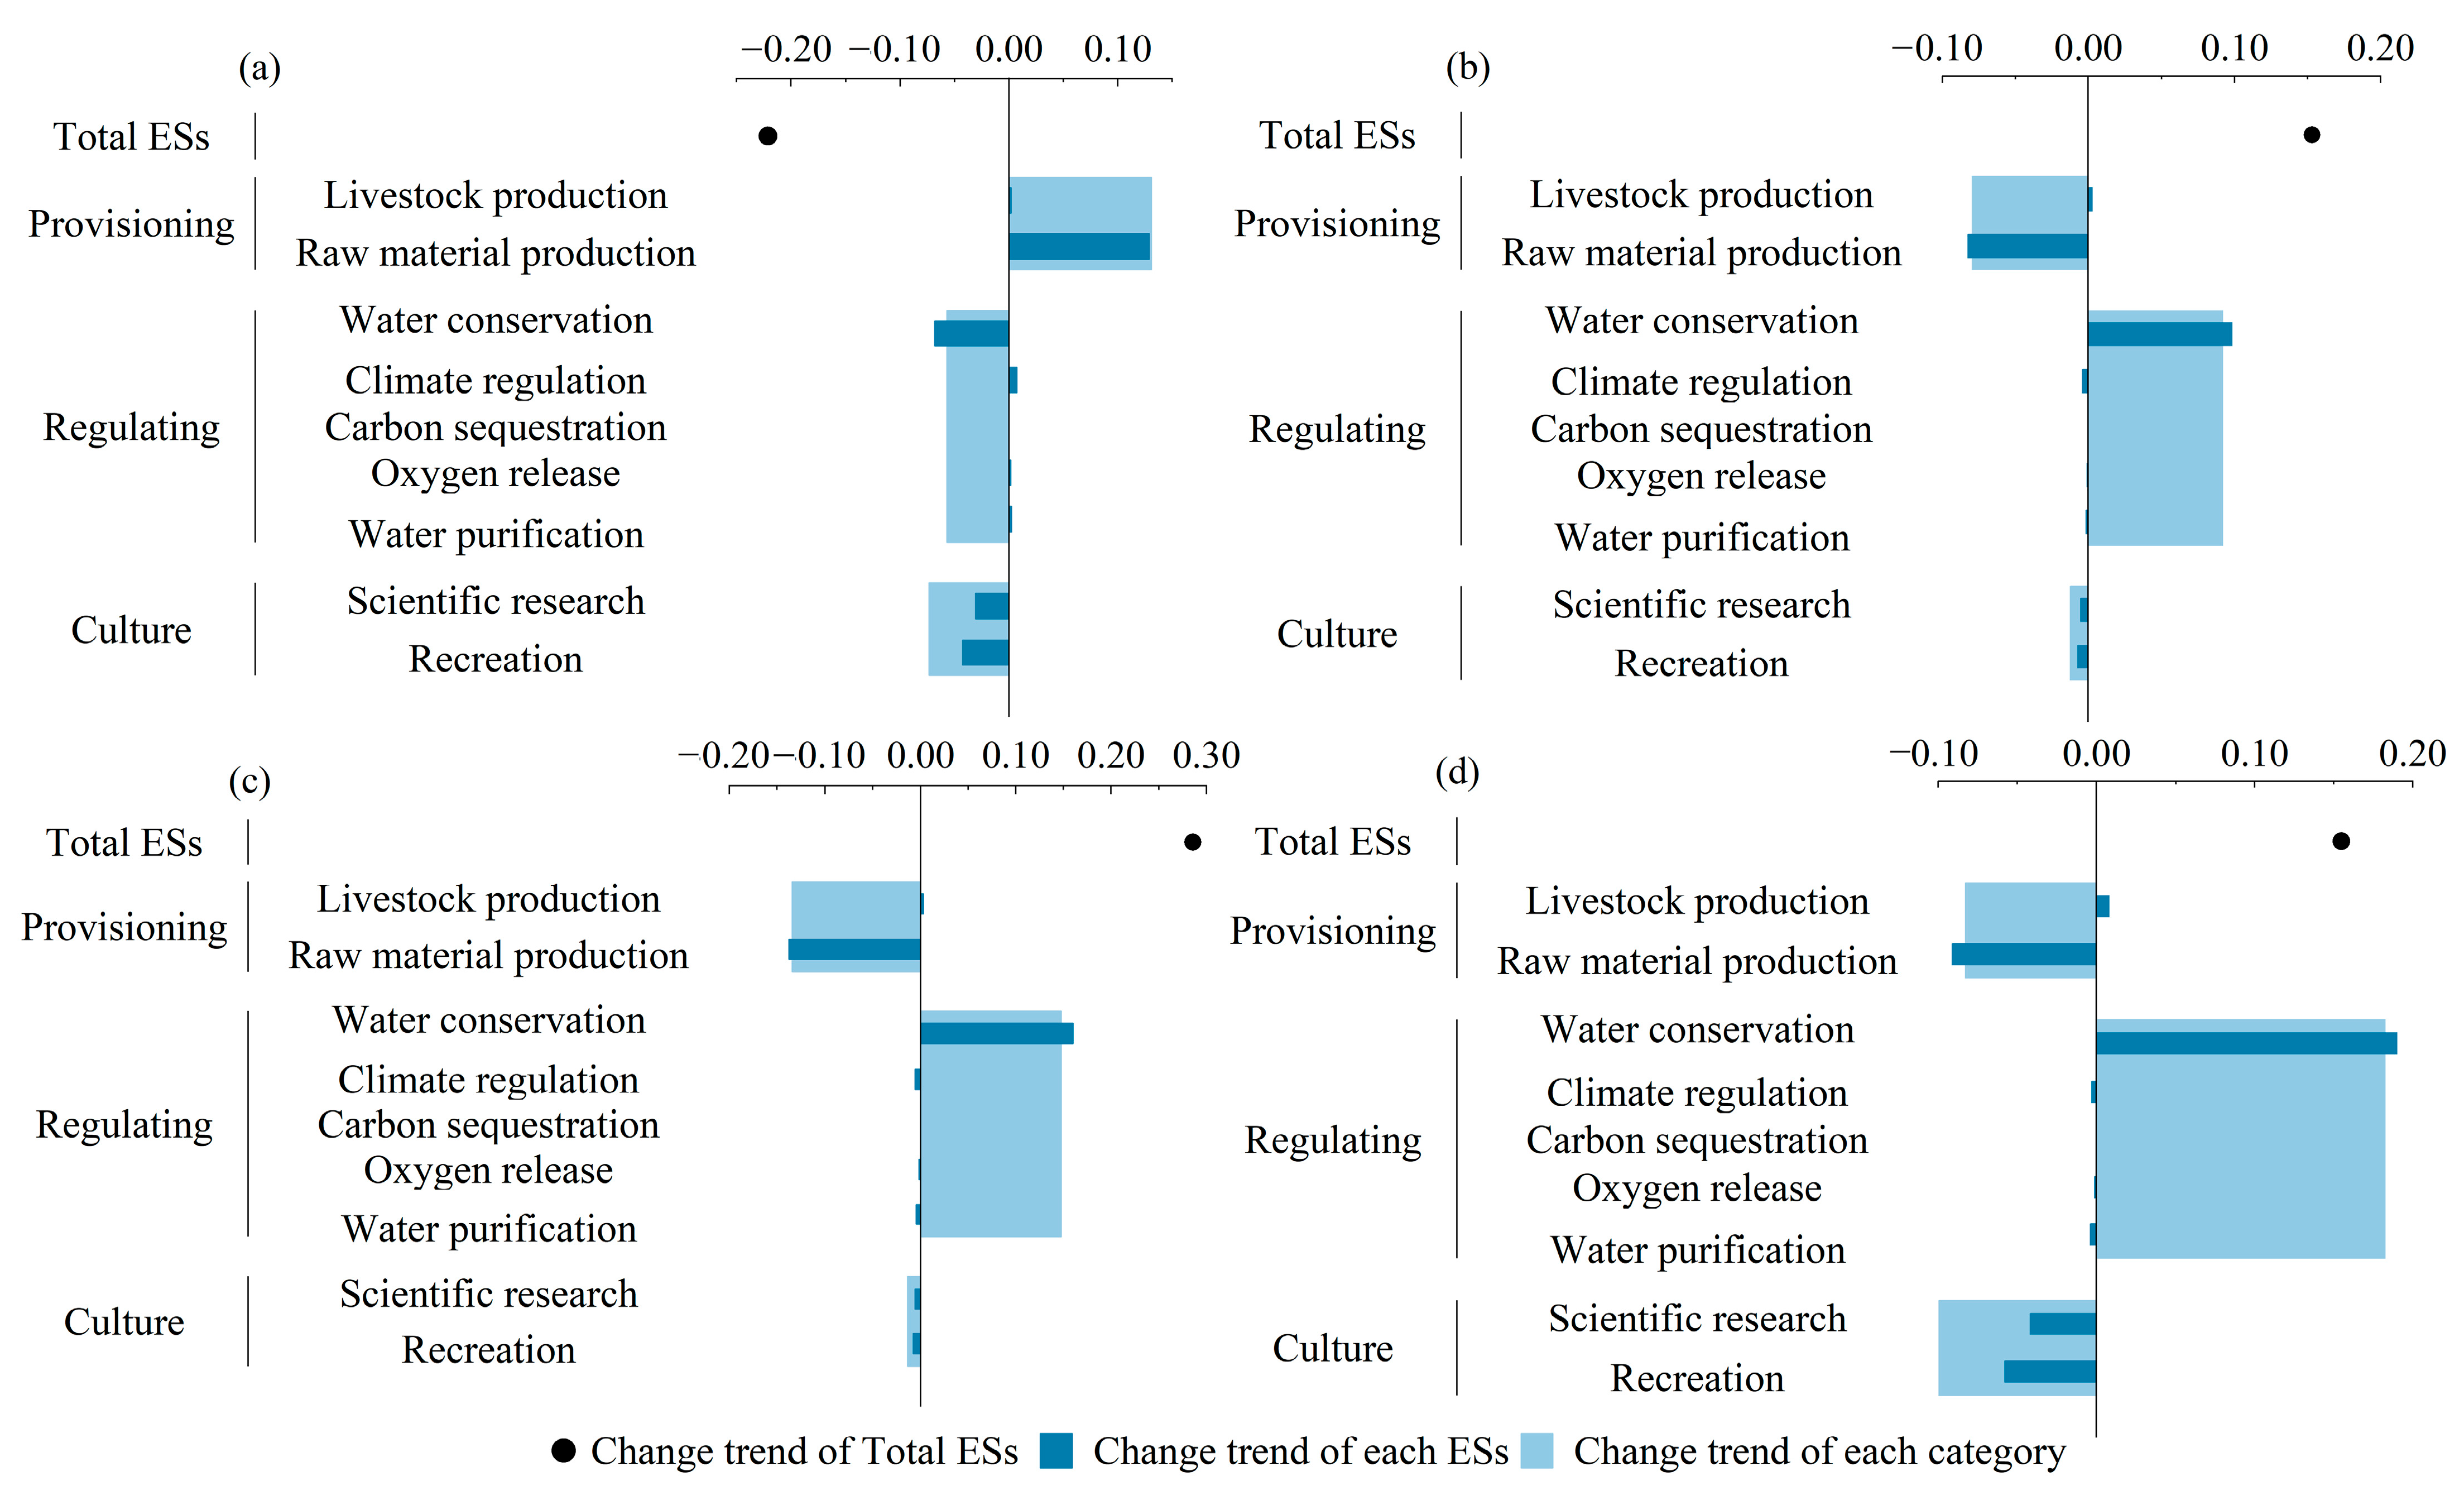
Table 4 and Figure 3 show the ESV and its change trends for each ES provided by the alpine wetlands in Maqu during 1990–2020. To further analyze the change trends, we divided the study periods into four categories: 1990–2000, 2000–2010, 2010–2020, and 1990–2020. The results show that the emergy values in the above four periods were 3.85 × 10¹⁰ sej/m2/y, 3.04 × 10¹⁰ sej/m2/y, 3.55 × 10¹⁰ sej/m2/y, and 4.64 × 10¹⁰ sej/m2/y. The total emergy value decreased during 1990–2000 and showed a gradual recovery trend in the remaining three periods.
The emergy value of provisioning services maintained an upward trend during 1990–2020. In particular, the emergy value of livestock production reached 5.50 × 10⁸ sej/m2/y in 2020. This is because, after 2005, the livestock production scale in Maqu County expanded rapidly, and the number of livestock and livestock products also significantly increased to almost four times the value in 1990. The trend of the raw material emergy value decreased, decreasing from 1.87 × 10¹⁰ sej/m2/y in 1990 to 1.79 × 10¹⁰ sej/m2/y at its lowest, with its proportion also decreasing from 48.7% to 39.5%. This is due to the continuous reduction in wetland areas in Maqu County during 1990–2020.
The emergy value of regulating services decreased between 1990 and 2000, and then continued increasing. Firstly, the ESV of regulating services decreased by 5.75% between 1990 and 2000, and the growth rates for 2000–2010 and 2010–2020 were 9.23% and 14.81%, respectively. The value of water conservation was the largest among the regulating services, and its ESV decreased by 6.84% between 1990 and 2000, which is related to the decrease in precipitation and runoff in Maqu County. In particular, in 2000, the difference in entry and exit runoff in Maqu County was only 14.22 m3, which directly affected the function of water conservation. The trends for water purification emergy values and carbon sequestration and oxygen release services are consistent with the total emergy values. All three services provided by the wetland ecosystem depend on the role of wetland vegetation, which is closely related to the changes in wetland environments.
In terms of cultural services, the proportion decreased from 10.93% to 0.96%, and the emergy values of scientific research and recreation both showed a decreasing trend. Due to the decreasing wetland area year after year, along with the degradation of wetlands, resources related to human well-being, such as landscape aesthetics, ecotourism, and wetland ecosystem cultural studies, have also been greatly reduced.
As shown in Figure 3, during 1990–2020, the dominant ESs in Maqu County were provisioning services and regulating services, which means that the ESs of the Maqu wetlands are centered on the hydrological and ecological landscape characteristics of the wetland ecosystem. The predominant ESs shifted from provisioning services to regulating services, meaning that ESs, which are associated with natural properties, have become more important to local residents. Cultural services account for a relatively small proportion of the ESs in Maqu County. On the one hand, Maqu County’s scientific research and tourism started late, and tourism has begun to develop since 2005. On the other hand, animal husbandry has been the main industry of Maqu County for a long time, which also conforms to its actual economic structure.
Table 5 shows the monetary value of wetland ESs for the period 1990–2020, and its interannual variation trend clearly increases. From 1990 to 2020, the gross county product of Maqu County increased by nearly 44 times, while the monetary value of wetland ESs in Maqu County increased from 3.93 USD/m2/y to 41.45 USD/m2/y, an increase in nearly 10 times. This means that human demand for wetland ESs increases with rapid economic development; the services and well-being provided by wetlands are the embodiment of their resource value.
3.2. Driving Forces
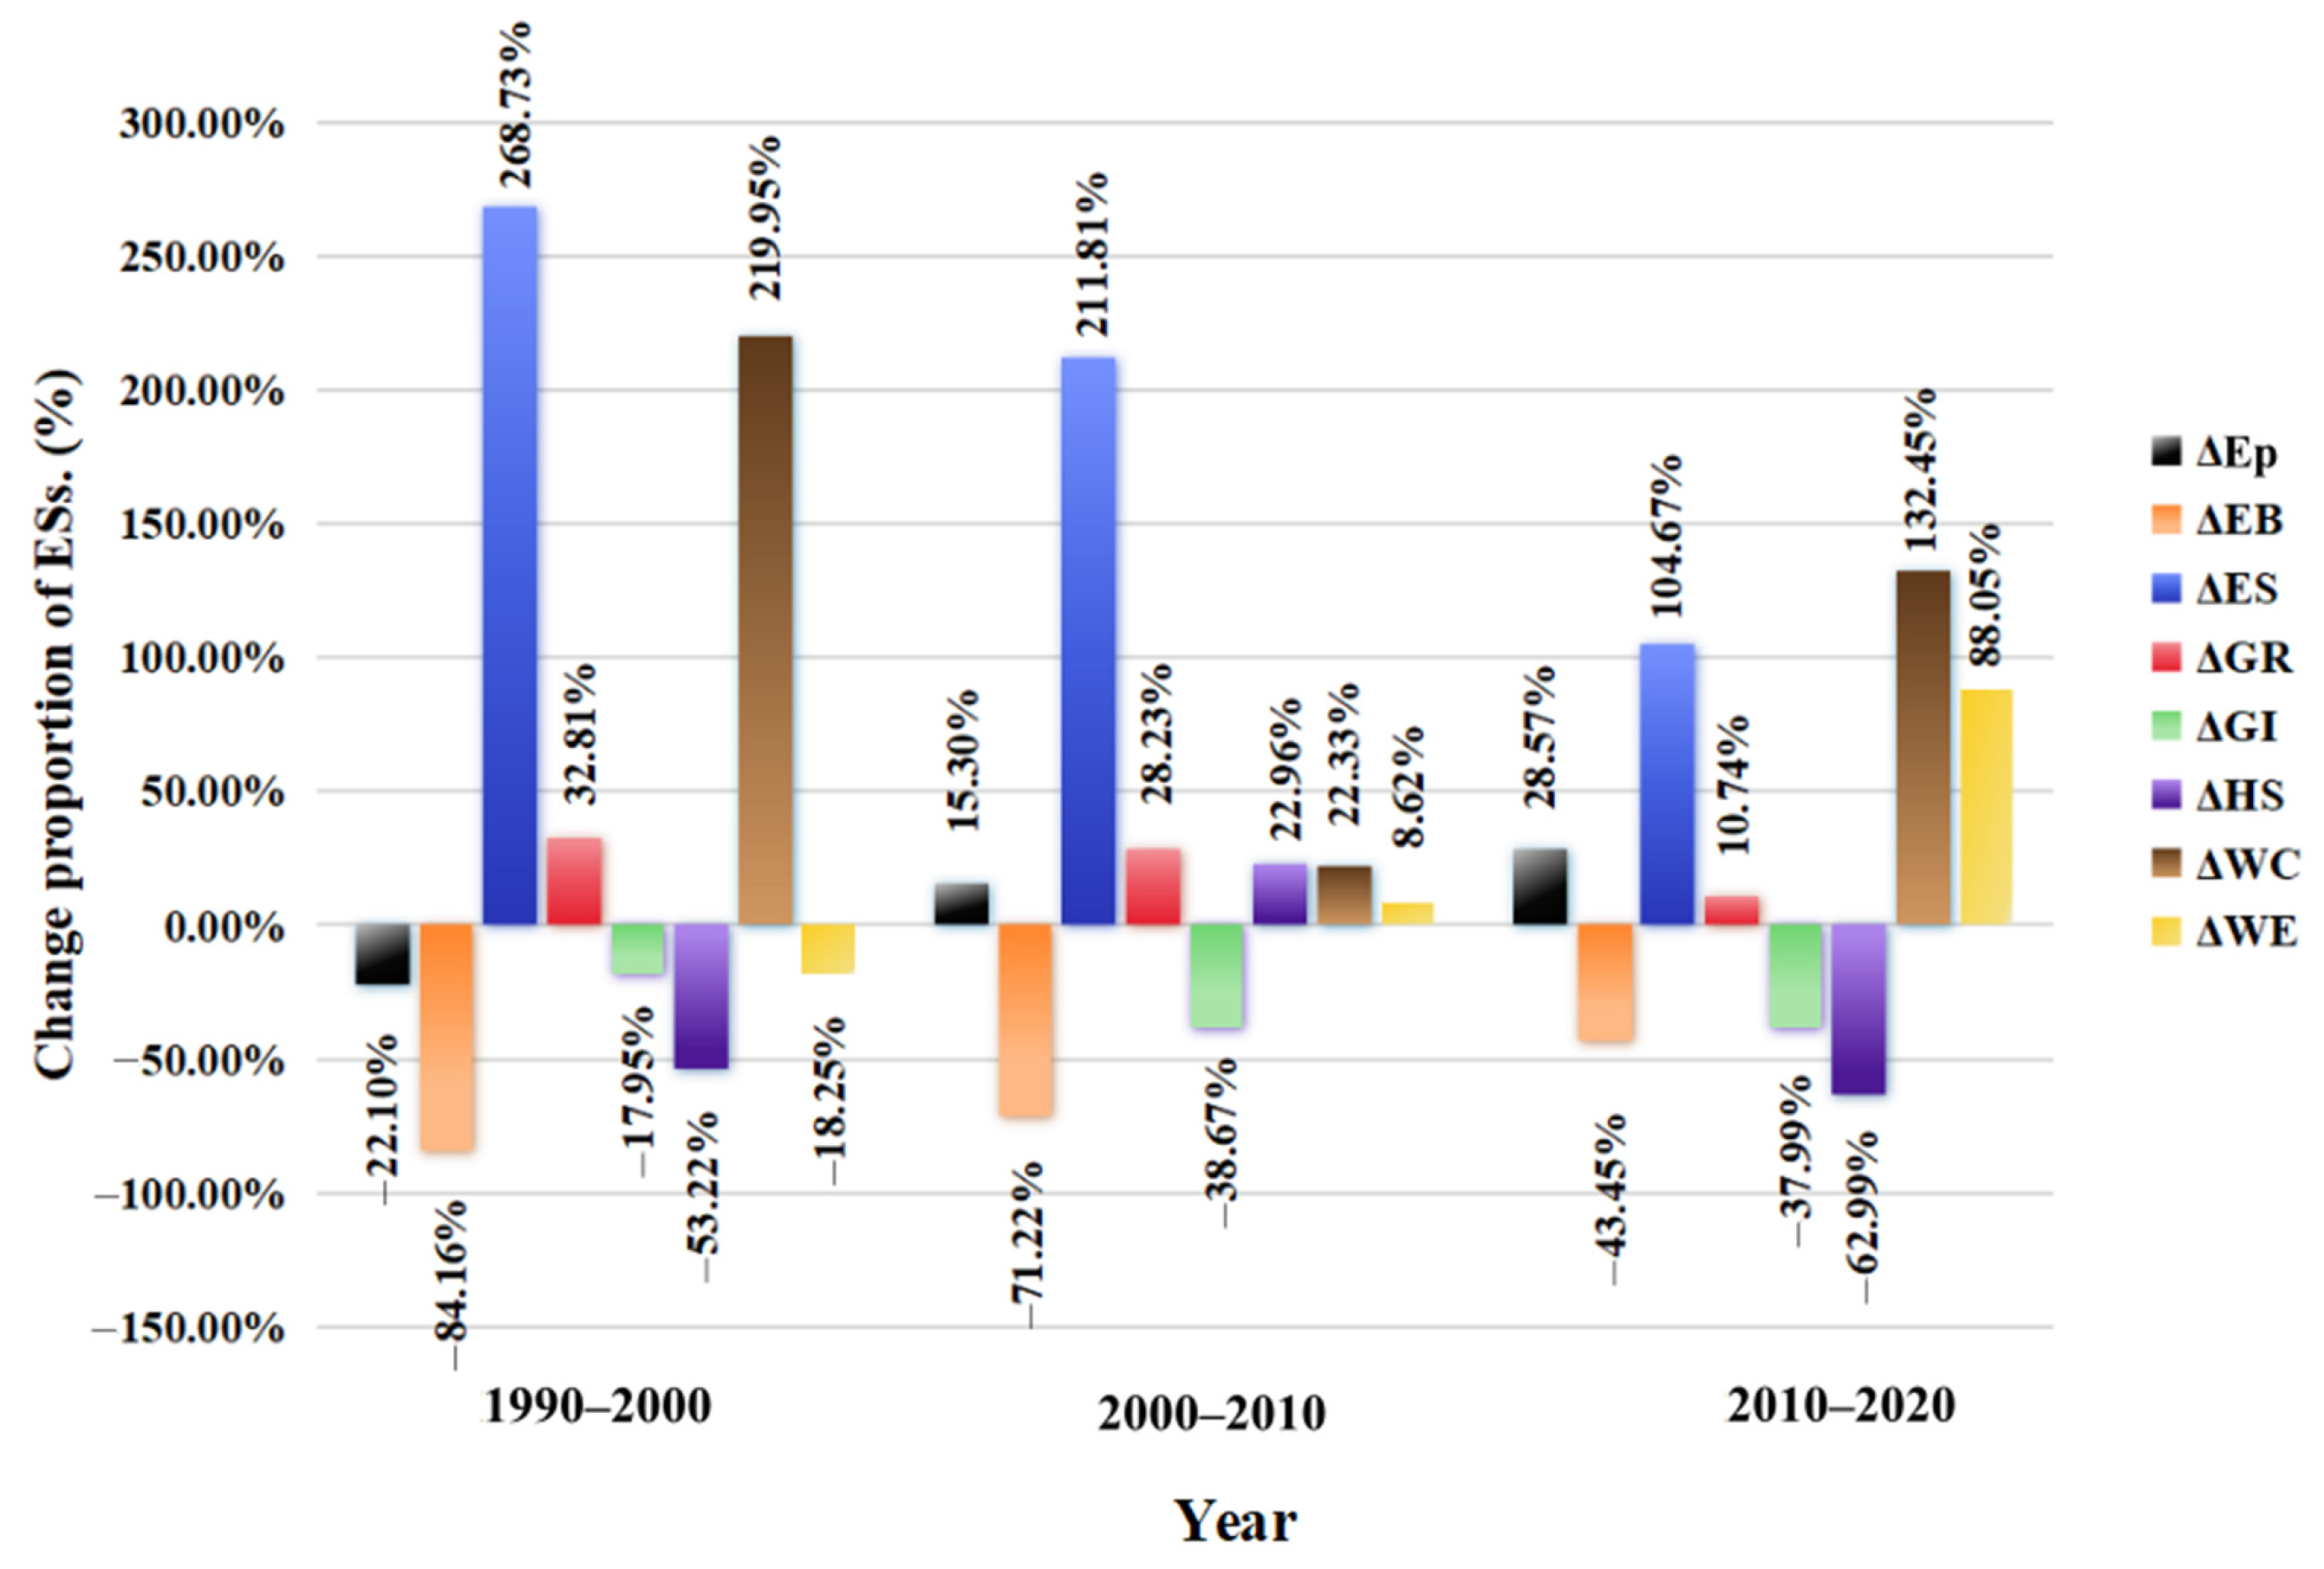
In order to identify the key driving forces leading to the drastic changes in the ESs of Maqu wetlands, we selected seven driving factors for analysis. Figure 4 shows the contribution degree of the seven driving forces to the changes in total ESV (∆Ep) during 1990–2020. The results show that Ep significantly decreased in the first stage (1990–2000) and increased in the other two stages, especially the third stage. Overall, Ep increased by 15.47% during the whole study period. The main reason for this is the positive impact of economic scale (∆ES), grassland resource endowment (∆GR), water consumption (∆WC), and water endowment (∆WE), as shown in Figure 4. The largest positive factor was the economic scale (∆ES), which induced Ep growth of 115.47% in the first period, 122.21% in the second period, and 81.43% in the third period. The second positive factors were water consumption (∆WC) and grassland resource endowment (∆GR). ∆WC-induced Ep increased by 102.91% in the first stage, 21.65% in the second stage, and 95.89% in the third stage. ∆GR increased by 25.11%, 26.73%, and 11.59% in the first, second, and third stages, respectively. The positive effect weakened in the third stage, which was due to the gradual reduction in grazing grassland area and the gradual scarcity of grassland resources due to population growth in Maqu County. The other is the water resource endowment (∆WE). In the first period, Ep decreased by 17.82%, while in the second and the third period, Ep increased by 8.89% and 71.80%, respectively. In the third period, the increase was larger, which not only offsets the decrease in the first period but also plays a role in making the water resource endowment a positive factor. These changes reflect the important effects of precipitation and temperature on wetland ecosystems in Maqu County.
As for the negative driving factors, the emergy benefit (∆EB) decreased the most. Ep decreased by 163.03% in the first stage, 133.87% in the second stage, and 64.82% in the third stage. These results indicate that the ecological environment and ecosystem services provided by Maqu wetlands cannot meet the requirements of local development. In other words, the emergy benefit of the ESs has been greatly reduced, which means that ESs are becoming scarce and increasingly valuable to the local people. Another negative factor is grazing intensity (∆GI), which decreased Ep by 17.51%, 52.54%, and 54.33% in the three periods. This means that grazing intensity in Maqu County gradually increased, thereby increasing the burden on wetlands. The last negative factor is the livestock farming scale (∆LS), which led to a 113% decrease in Ep in the third stage. This indicates that for counties purely involved in animal husbandry, such as Maqu County, the scale of animal husbandry has a huge impact on natural and wetland environments.
4. Discussion
4.1. Comparison with ESV Studies Based on Market Calculation Methods
Ecosystem-based management (EBM) would be the ideal outcome for changing the way we live and increasing the habitability of the planet [51]. Therefore, the use of appropriate methods to calculate the true value of ecosystem services can make these results a powerful reference for policymakers to make decisions. Compared with the nonmarket approach and other methods, emergy methods have several advantages: (1) The emergy value accounting approach considers the formation of ecosystem services as an eco-thermodynamic process and enables detailed analysis of material flows and emergy transfers, quantifying the contribution of each flow and stock to the environment [33,52]. (2) Emergy value accounting methods can provide a comprehensive description of the intrinsic natural properties of ecosystem services that are not limited by the problems of market prices and human preference-based valuation methods [53,54]. (3) Such methods connect ecosystems by considering natural resource inputs and investments with human society. This approach connects ecosystems and human societies by considering natural resource inputs and investments with human society, and can objectively reveal the value of ecosystem services from an ecocentric rather than anthropocentric perspective [55,56]. Table 6 shows the comparison between the ESV results obtained by other scholars using market-based calculation methods and the results of this paper, which can reflect the advantages of the emergy method. Our results are approximately 12 times higher than the ESV results of several scholars, including Niu et al. [57], Wang et al. [58], and Chen et al. [59] in Maqu County. This confirms the view of Costanza et al. [60] that economic calculation methods are too narrow to comprehensively measure all the ways people benefit from ecosystem services, which may lead to a serious underestimation of ESV. Meanwhile, compared with the ESV results obtained by Xie et al. [61] on the Qinghai Tibet Plateau, the results of our research are about nine times higher than theirs. This means that the Maqu alpine wetland is a high-value area for ecosystem services in the entire Qinghai Tibet Plateau, and its important ecological status cannot be ignored.
4.2. Driving Forces Affecting Changes in ESV in Maqu Wetlands
In order to further explore the influence of each driving factor on ES changes, we classify the seven driving forces into three categories: socioeconomic development factors (∆EB, ∆ES, and ∆WC), human activity factors (∆GI and ∆LS), and natural influence factors (∆GR and ∆WE). Socioeconomic development factors had the greatest influence on ES changes, followed by human activity factors and, lastly, natural influence factors.
The results of the LMDI analysis showed that the development of social and economic levels will improve people’s quality of life and may change people’s consumption patterns and regional industrial structures [62]. As the quality of life improves, diets tend to change, and people may opt for richer dietary types, such as fish and meat, over single grains [63], potentially leading to the development of local livestock and fisheries and, thus, changing the natural use of wetlands. When people’s living standards improve, they are more inclined to pursue spiritual abundance [64]. This is reflected in the rise of the tourism industry in Maqu County, and people’s demand for wetland ESs tends toward landscape, culture, and religion [65,66]. With the aim of improving the awareness of wetland protection in order to protect the scientific research value and cultural value of the wetland, Maqu wetlands have joined the Ramsar Convention. Measures to protect wetlands have been introduced around the world, such as the NWCP in China and the wetland restoration measures and restrictions implemented in Europe [67].
Human beings have always influenced and altered nature to varying degrees [68]. Human intervention has had both positive and negative effects on ESV changes in Maqu wetlands. On the one hand, as people have realized the value of wetlands, the protection of natural wetland resources has become an important task, including preventing the loss of natural wetlands and restoring wetland resources. Human intervention has a significant effect on the protection and restoration of wetlands, and the ESV of protected wetlands is significantly higher than that of unprotected wetlands [69]. Increased investment in wetland conservation can significantly improve wetland ESV [70]. Government decision making is crucial in this regard. On the other hand, human activities have negative impacts on ESV. In terms of economies, human beings should focus on economic development to eliminate poverty. In order to develop economies, investment in development converts natural wetlands into other land types, such as cultivated land, construction land, etc. [71], which is occurring globally. However, this has also introduced heavy environmental pressure, resulting in the disappearance of natural wetlands and a decline in ESV [72]. Human beings may not be able to afford the consequences of ecological poverty brought about by economic development [73].
The last is the influence of natural factors on changes in ESV. Different from coastal wetlands, Maqu wetlands are typical inland alpine wetlands, and the impact of social and economic development and human activity factors on ESV changes is usually greater than that of natural factors [74,75]. This is consistent with the results of this study. ∆GR and ∆WE have relatively small effects on ESV, but natural factors still cannot be ignored.
4.3. Recommendations for Improving ESV
The health of wetlands is important because they support the survival and development of people and organisms [76]. In order to develop economies, society will choose to sacrifice natural wetlands and convert them to land types with higher economic benefits [77]. As the most valuable ecosystem, the loss of wetlands will limit the ability of ecosystems to provide more sustainable ecosystem services, resulting in a long-term decline in environmental quality [78]. In this context, finding more innovative development methods to enhance ESV is critical for local decision makers.
According to the driving force analysis results of this study, socioeconomic development and human activity environmental protection factors have a promoting effect on the improvement in changes in ESV. However, while appropriate socioeconomic development is indeed beneficial for ES development, it is not advisable to pursue economic development too blindly. More important is how to use wetland resources scientifically to achieve a dynamic balance and coordination between wetland ecosystems and the development goals of society. The local government should pay attention to the proper adjustment of economic structure. Converting the single industrial structure of Maqu County to wetland tourism is also one of the important means of the rational utilization of wetlands, which has been implemented in many areas [79]. However, implementing such a policy in Maqu County is difficult, according to the field survey. Due to the limitations of the environment and education levels, local residents are very dependent on animal husbandry, and many herdsmen are unwilling to give up grazing or transfer their income focus to other work. At this time, local governments should consider both incentive and mandatory policies, especially in terms of financial subsidies, to solve such problems. In addition, another advantage of developing the tourism and service industries is that the service industry provides a higher income with fewer emissions and can provide more jobs for local herdsmen, such that the pressure on grasslands and wetlands is reduced.
Finally, an important aspect leading to the decline in wetland ES value is that local governments do not recognize the real contribution of wetland ecosystems; thus, they formulate unreasonable development policies [70]. Through field interviews with 153 local herders, we found that local people do not have a clear understanding of the true contribution and importance of wetland ecosystems. Therefore, in order to enhance the environmental awareness of local residents, the government can advertise on TV, produce and distribute leaflets, offer offline speeches, and promote Internet publicity [73], thus allowing herders to fully understand wetland ecosystems and their contribution. Moreover, local herdsmen can be trained in other aspects of work so as to achieve the goal of economic restructuring. These efforts could help to enhance mutual understanding among all stakeholders, thereby avoiding potential conflicts and solving common problems.
4.4. Present Limitations
The research in this paper is conducted in a small area. Although the data are different, the principle of calculation is generally the same. There are bottom–up methods for evaluating large-scale ecosystem services at local and regional scales [31], and decision making often takes place at the local or regional level [60]; this is beneficial for the results of this article to serve as a reference for other larger regions. However, some limitations should be addressed in future work. Firstly, when the LMDI method is used to analyze the driving factors of ES changes, the driving factors selected mostly involve human activities and social factors, and the influence of natural factors on ES changes is rarely discussed. Secondly, in terms of data, the UEV used in this study is based on research results published in different international journals and books, which may cause some uncertainty in the results. However, this uncertainty has little impact on the results of the overall trend analysis, and it can still provide valuable information for decision makers to understand the status of wetlands [70]. In future research, we will combine the influence of social and natural factors on changes in ES to assess wetland ecosystem service values more completely, accurately, scientifically, and reasonably, thus better supporting the management and development of wetlands.
5. Conclusions
It is important to consider the interconnection between wetland ecosystem services and economic development to provide sustainable development suggestions for decision makers. According to the method of emergy and LMDI analysis, we came to the following primary conclusions:
- (1)
- The total emergy value decreased during 1990–2000 and showed a gradual recovery trend in 2000–2020. The ESV of provisioning services maintained an upward trend from 1990 to 2020 due to the rapid expansion of the livestock production scale and rapid economic development in Maqu County over the past 30 years. Regulating services decreased between 1990 and 2000 and then continued increasing. Cultural services continued to decline from 1990 to 2020, and due to the degradation of wetlands, the recreational resources they provided also diminished.
- (2)
- Between 1990 and 2020, the dominant ES among ecosystem services shifted from providing services to regulating services. This means that people have become aware of the importance of ESs in terms of natural properties, and the demand for them continues to increase.
- (3)
- The continuous positive contribution of economic scale (∆ES) and grass resource endowment (∆GR) has become the main driving factor for the development of ESs. Local governments should pay attention to the proper adjustment of the economic structure and increase the proportion of the tourism and service industries. Emergy benefit (∆EB) and grazing intensity (∆GI) contributed the most to the negative factors impacting Maqu wetlands.
- (4)
- Socioeconomic development and human activity environmental protection factors have a promoting effect on the improvement in ESV. With the intensification of human activities, rapid economic development has come at the cost of wetland degradation. The lower the benefit of ESs, the less ESs provided by Maqu Wetland can meet the local development needs. The local government should pay attention to the proper adjustment of economic structure. Through timely knowledge popularization, local residents should have a comprehensive understanding of the value of wetlands, and some incentive and mandatory policies, especially in the aspect of financial subsidies, should be promoted to protect wetlands.
Supplementary Materials
The following supporting information can be downloaded at: https://www.mdpi.com/article/10.3390/land13030366/s1, Table S1: The data sources of this article; Table S2: The emergy analysis table of valuation on wetland ecosystem services in 1990 in Maqu County; Table S3: The emergy analysis table of valuation on wetland ecosystem services in 2000 in Maqu County; Table S4: The emergy analysis table of valuation on wetland ecosystem services in 2010 in Maqu County. References [80,81,82,83] are cited in Supplementary Materials.
Author Contributions
Conceptualization, R.Z. and L.Z.; methodology, X.C.; software, J.W.; formal analysis, Z.H. and H.L.; resources, Z.H.; data curation, L.Z.; writing—original draft preparation, Z.H; writing—review and editing, Z.H.; visualization, R.Z. and F.L.; funding acquisition, R.Z. All authors have read and agreed to the published version of the manuscript.
Funding
This research was funded by the Science and Technology Plan of Gansu Province (20YF3FA042); the National Natural Science Foundation of China (41261047; 41761043); and the Youth Teacher Scientific Capability Promoting Project of Northwest Normal University (NWNU-LKQN-17-7).
Data Availability Statement
The original contributions presented in the study are included in the article/Supplementary Materials, further inquiries can be directed to the corresponding author.
Conflicts of Interest
The authors declare that they have no known competing financial interests or personal relationships that could have appeared to influence the work reported in this paper.
References
- Millennium Ecosystem Assessment. Ecosystems and Human Well-Being: Synthesis; Island Press: Washington, DC, USA, 2005. [Google Scholar]
- Mengist, W.; Soromessa, T.; Feyisa, G.L. A global view of regulatory ecosystem services: Existed knowledge, trends, and research gaps. Ecol. Process. 2020, 9, 461. [Google Scholar] [CrossRef]
- Hong, Z.D.; Ding, S.Y.; Zhao, Q.H.; Qiu, P.W.; Chang, J.L.; Peng, L.; Wang, S.Q.; Hong, Y.Y.; Liu, G.J. Plant trait-environment trends and their conservation implications for riparian wetlands in the Yellow River. Sci. Total Environ. 2021, 767, 144867. [Google Scholar] [CrossRef] [PubMed]
- La Notte, A.; D’Amato, S.; Mäkinen, H.; Paracchini, M.L.; Liquete, C.; Egoh, B.; Geneletti, D.; Crossman, N.D. Ecosystem Services Classification: A Systems Ecology Perspective of the Cascade Framework. Ecol. Indic. 2017, 74, 392–402. [Google Scholar] [CrossRef]
- Wang, B.H.; Zheng, X.F.; Zhang, H.J.; Xiao, F.S.; Gu, H.; Zhang, K.K.; He, Z.L.; Liu, X.; Yan, Q.Y. Bacterial community responses to tourism development in the Xixi National Wetland Park, China. Sci. Total Environ. 2020, 720, 137570. [Google Scholar] [CrossRef] [PubMed]
- Costanza, R.; De Groot, R.; Sutton, P.; Van der Ploeg, S.; Anderson, S.J.; Kubiszewski, I.; Farber, S.; Turner, R.K. Changes in the global value of ecosystem services. Glob. Environ. Change: Hum. Human. Policy Dimens. 2014, 26, 152. [Google Scholar] [CrossRef]
- Davidson, N.C.; Dam, A.V.; Finlayson, C.M.; Mcinnes, R.J. Worth of wetlands: Revised global monetary values of coastal and inland wetland ecosystem services. Mar. Freshw. Res. 2019, 70, 1189. [Google Scholar] [CrossRef]
- Barbier, E.B. Marine ecosystem services. Curr. Biol. 2017, 27, 507–510. [Google Scholar] [CrossRef]
- Kingsford, R.T.; Basset, A.; Jackson, L. Wetlands: Conservation’s poor cousins. Aquat. Conserv. Mar. Freshw. Ecosyst. 2016, 26, 892. [Google Scholar] [CrossRef]
- Larigauderie, A.; Mooney, H.A. The Intergovernmental Science-Policy Platform on Biodiversity and Ecosystem Services: Moving a Step Closer to an IPCC-Like Mechanism for Biodiversity. Curr. Opin. Environ. Sustain. 2010, 2, 9–14. [Google Scholar] [CrossRef]
- Bongaarts, J. Summary for policymakers of the global assessment report on biodiversity and ecosystem services of the Intergovernmental Science-Policy Platform on Biodiversity and Ecosystem Services. Popul. Dev. Rev. 2019, 45, 680–681. [Google Scholar] [CrossRef]
- Salimi, S.; Almuktar, S.A.A.A.N.; Scholz, M. Impact of climate change on wetland ecosystems: A critical review of experimental wetlands. J. Environ. Manag. 2021, 286, 112160. [Google Scholar] [CrossRef] [PubMed]
- Chaplin-kramer, R.; Sharp, R.P.; Weil, C.; Bennett, E.M.; Pascual, U.; Arkema, K.K.; Brauman, K.A.; Bryant, B.P.; Guerry, A.D.; Haddad, N.M.; et al. Global modeling of nature’s contributions to people. Science 2019, 336, 255. [Google Scholar] [CrossRef] [PubMed]
- Li, J.; Lai, X.; Liu, H.M.; Yang, D.L.; Zhang, G.L. Emergy evaluation of three Rice wetland farming systems in the Taihu Lake catchment of China. Wetlands 2018, 38, 1121. [Google Scholar] [CrossRef]
- Hu, S.J.; Niu, Z.G.; Chen, Y.F.; Li, L.F.; Zhang, H.Y. Global wetlands: Potential distribution, wetland loss, and status. Sci. Total Environ. 2017, 586, 319. [Google Scholar] [CrossRef] [PubMed]
- Niu, Z.G.; Zhang, H.Y.; Wang, X.W.; Yao, W.B.; Zhou, D.M.; Zhao, K.Y.; Zhao, H.; Li, N.N.; Huang, H.B.; Li, C.C.; et al. Mapping wetland changes in China between 1978 and 2008. Chin. Sci. Bull. 2012, 57, 1400. [Google Scholar] [CrossRef]
- Zhan, J.Y.; Zhang, F.; Chu, X.; Liu, W.; Zhang, Y. Ecosystem services assessment based on emergy accounting in Chongming Island, Eastern China. Ecol. Indic. 2019, 105, 464. [Google Scholar] [CrossRef]
- Pirard, R.; Lapeyre, R. Classifying market-based instruments for ecosystem services: A guide to the literature jungle. Ecosyst. Serv. 2014, 9, 106–114. [Google Scholar] [CrossRef]
- Oleson, K.L.L.; Grafeld, S.; Beukering, P.V.; Brander, L.; James, P.A.S.; Wolfs, E. Charting progress towards system-scale ecosystem service valuation in islands. Environ. Conserv. 2018, 45, 212–226. [Google Scholar] [CrossRef]
- Liu, Z.X.; Wang, Y.Y.; Geng, Y.; Li, R.D.; Dong, H.J.; Xue, B.; Yang, T.H.; Wang, S.S. Toward sustainable crop production in China: An emergy-based evaluation. J. Clean. Prod. 2019, 206, 11–26. [Google Scholar] [CrossRef]
- Ana, C.V.N.; Ricardo, D.A.K.; Ednildo, A.T. Emergy as a Tool to Evaluate Ecosystem Services: A Systematic Review of the Literature. Sustainability 2021, 13, 7102. [Google Scholar] [CrossRef]
- Luo, Q.L.; Zhou, J.F.; Li, Z.G.; Yu, B.L. Spatial differences of ecosystem services and their driving factors: A comparation analysis among three urban agglomerations in China’s Yangtze River Economic Belt. Sci. Total Environ. 2020, 725, 138452. [Google Scholar] [CrossRef] [PubMed]
- Pulselli, F.M.; Coscieme, L.; Bastianoni, S. Ecosystem services as a counterpart of emergy flows to ecosystems. Ecol. Model. 2011, 222, 2924–2928. [Google Scholar] [CrossRef]
- Pan, H.Y.; Geng, Y.; Tian, X.; Wilson, J.; Chen, W.; Zhong, S.Z.; Song, X.Q. Emergy-based environmental accounting of one mining system. Environ. Sci. Pollut. Res. 2019, 26, 14598. [Google Scholar] [CrossRef] [PubMed]
- Fonseca, C.R.; Diaz-delgado, C.; Esteller, M.V.; Garcia-pulido, D. Geoinformatics tool with an emergy accounting approach for evaluating the sustainability of water systems: Case study of the Lerma river, Mexico. Ecol. Eng. 2017, 99, 436. [Google Scholar] [CrossRef]
- Song, F.; Su, F.L.; Zhu, D.; Li, L.F.; Li, H.F.; Sun, D. Evaluation and driving factors of sustainable development of the wetland ecosystem in Northeast China: An emergy approach. J. Clean. Prod. 2020, 248, 119236. [Google Scholar] [CrossRef]
- Franzese, P.P.; Buonocore, E.; Donnarumma, L.; Russo, G.F. Natural capital accounting in marine protected areas: The case of the Islands of Ventotene and S. Stefano (Central Italy). Ecol. Model. 2017, 360, 290. [Google Scholar] [CrossRef]
- Langan, C.; Farmer, J.; Rivington, M.; Smith, J.U. Tropical wetland ecosystem service assessments in East Africa; a review of approaches and challenges. Environ. Model. Softw. 2018, 102, 260–273. [Google Scholar] [CrossRef]
- Lu, H.F.; Zhang, H.S.; Qin, P.; Li, X.Z.; Campbell, D.E. Integrated emergy and economic evaluation of an ecological engineering system for the utilization of Spartina alterniflora. J. Clean. Prod. 2020, 247, 119592. [Google Scholar] [CrossRef]
- Shah, S.M.B.; Liu, G.Y.; Yang, Q.; Wang, X.Q.; Casazza, M.; Agostinho, F.; Lombardi, G.V.; Giannetti, B.F. Emergy-based valuation of agriculture ecosystem services and dis-services. J. Clean. Prod. 2019, 239, 118019. [Google Scholar] [CrossRef]
- Yang, Q.; Liu, G.Y.; Casazza, M.; Hao, Y.; Giannetti, B.F. Emergy-based accounting method for aquatic ecosystem services valuation: A case of China. J. Clean. Prod. 2019, 230, 55. [Google Scholar] [CrossRef]
- Sun, J.F.; Yuan, X.Z.; Liu, G.D.; Tian, K. Emergy and eco-exergy evaluation of wetland restoration based on the construction of a wetland landscape in the northwest Yunnan Plateau, China. J. Environ. Manag. 2019, 252, 109499. [Google Scholar] [CrossRef] [PubMed]
- Sun, J.F.; Yuan, X.Z.; Liu, H.; Liu, G.D. Emergy and eco-exergy evaluation of wetland reconstruction based on ecological engineering approaches in the three Gorges Reservoir, China. Ecol. Indic. 2021, 122, 107278. [Google Scholar] [CrossRef]
- Shen, G.; Yang, X.C.; Jin, Y.X.; Xu, B.; Zhou, Q.B. Remote sensing and evaluation of the wetland ecological degradation process of the Zoige Plateau Wetland in China. Ecol. Indic. 2019, 104, 48. [Google Scholar] [CrossRef]
- Xue, P.F.; Li, L.W.; Zhu, G.F.; Zhou, H.K.; Liu, C.L.; Yan, H.P. Changes in the pattern of an alpine wetland landscape in Maqu County in the first meander of the Yellow River. Chin. J. Plant Ecol. 2021, 45, 467. [Google Scholar] [CrossRef]
- Long, X.R.; Lin, H.; An, X.X.; Chen, S.D.; Qi, S.Y. Evaluation and analysis of ecosystem service value based on land use/cover change in Dongting Lake wetland. Ecol. Indic. 2022, 136, 108619. [Google Scholar] [CrossRef]
- Wu, J.H.; Wang, G.Z.; Chen, W.X.; Pan, S.P.; Zeng, J. Terrain gradient variations in the ecosystem services value of the Qinghai-Tibet Plateau, China. Glob. Ecol. Conserv. 2022, 34, e02008. [Google Scholar] [CrossRef]
- Liu, M.X.; Gao, Y.; Wei, H.J.; Dong, X.B.; Zhao, B.Y.; Wang, X.C.; Zhang, P.; Liu, R.R.; Zou, X.Y. Profoundly entwined ecosystem services, land-use change and human well-being into sustainability management in Yushu, Qinghai-Tibet Plateau. J. Geogr. Sci. 2022, 32, 1745–1765. [Google Scholar] [CrossRef]
- Li, G.Y.; Jiang, C.H.; Gao, Y.; Du, J. Natural driving mechanism and trade-off and synergy analysis of the spatiotemporal dynamics of multiple typical ecosystem services in Northeast Qinghai-Tibet Plateau. J. Clean. Prod. 2022, 374, 134075. [Google Scholar] [CrossRef]
- Ang, B.W. Decomposition analysis for policymaking in energy: Which is the preferred method? Energy Policy 2004, 32, 1131–1139. [Google Scholar] [CrossRef]
- Ang, B.W. The LMDI approach to decomposition analysis: A practical guide. Energy Policy 2005, 33, 867–871. [Google Scholar] [CrossRef]
- Isik, M.; Sarica, K.; Ari, I. Driving forces of Turkey’s transportation sector CO2 emissions: An LMDI approach. Transp. Policy 2020, 97, 210–219. [Google Scholar] [CrossRef]
- Sun, L.; Dong, H.J.; Geng, Y.; Li, Z.L.; Liu, Z.; Fujita, T.; Ohnishi, S.; Fujii, M. Uncovering driving forces on urban metabolism A case of Shenyang. J. Clean. Prod. 2016, 114, 171–179. [Google Scholar] [CrossRef]
- Fisher, B.; Turner, R.K. Ecosystem services: Classification for valuation. Biol. Conserv. 2008, 141, 1167. [Google Scholar] [CrossRef]
- Fisher, B.; Turner, R.K.; Morling, P. Defining and classifying ecosystem services for decision making. Ecol. Econ. 2009, 68, 643. [Google Scholar] [CrossRef]
- Brown, M.T.; Ulgiati, S. Emergy assessment of global renewable sources. Ecol. Model. 2016, 339, 148. [Google Scholar] [CrossRef]
- Zhu, Y.L. Study on Agro-Ecosystem’s Sustainable Development of Hunan Based on the Emergy Theory; Central South University of Forestry and Technology: Changsha, China, 2010. [Google Scholar]
- Dong, Y.; Yang, L.Z.; Zhang, Y.F.; Dong, X.B. Analysis and Evaluation of Cropping-grazing System of Inner Mongolia Based on Emergy. Ecol. Ind. Watch. 2008, 197, 171. [Google Scholar]
- Odum, H.T. Environmental accounting: Emergy and environmental decision making. For. Sci. 1997, 43, 305. [Google Scholar] [CrossRef]
- Brown, M.T.; Ulgiati, S. Environmental Accounting: Coupling Human and Natural Systems; Springer: New York, NY, USA, 2018. [Google Scholar]
- Cormier, R.; Kelble, C.R.; Anderson, M.R.; Allen, J.I.; Grehan, A.; Gregersen, O. Moving from ecosystem-based policy objectives to operational implementation of ecosystem-based management measures. ICES J. Mar. Sci. 2017, 74, 406–413. [Google Scholar] [CrossRef]
- Rafael, K.D.O.; Antonio, R.H.; Luciana, D.S.; Ivan, C.S.; Maria, D.P.M.G. Emergy-based sustainability assessment of a loblolly pine (Pinus taeda) production system in southern Brazil. Ecol. Indic. 2018, 93, 481–489. [Google Scholar] [CrossRef]
- Zhong, S.Z.; Geng, Y.; Kong, H.N.; Liu, B.; Tian, X.; Chen, W.; Qian, Y.Y.; Ulgiati, S. Emergy-based sustainability evaluation of Erhai Lake Basin in China. J. Clean. Prod. 2018, 178, 142–153. [Google Scholar] [CrossRef]
- Zhang, Q.B.; Yue, D.P.; Fang, M.Z.; Yu, Q.; Huang, Y.; Su, K.; Ma, H.; Wang, Y.H. Study on sustainability of land resources in Dengkou County based on emergy analysis. J. Clean. Prod. 2018, 171, 580–591. [Google Scholar] [CrossRef]
- Tian, X.; Geng, Y.; Ulgiati, S. An emergy and decomposition assessment of China-Japan trade: Driving forces and environmental imbalance. J. Clean. Prod. 2017, 141, 359–369. [Google Scholar] [CrossRef]
- Sandra, A.S.; Fabio, T.E.L.C.; Claudio, F.; Luiz, O.F.D.O.; Geraldo, D.S.E.S.; Eliane, G.G.; Enrique, O. An Emergy-Based Approach to Assess and Valuate Ecosystem Services of Tropical Wetland Pastures in Brazil. Open J. Ecol. 2020, 10, 303. [Google Scholar] [CrossRef]
- Niu, S.W.; Zeng, M.M.; Liu, Z.G.; Wu, W.H. The Valuation of Ecosystem Services and the Design of Policies on Ecological Management in Maqu County in the Upper Reaches of Yellow River. China Popul. Resour. Environ. 2006, 16, 79. [Google Scholar]
- Wang, J.; Ma, W.J.; Chen, W.Y. Evaluation of service function value of Maqu alpine wetland ecosystem in the First Meander of the Yellow River. Pratacultural Sci. 2010, 27, 25. [Google Scholar]
- Chen, M.; Cao, J.J.; Wu, G.L. Primary estimation of service values of Maqu wetland grassland ecosystems in the upriver area of yellow river conservation district. Pratacultural Sci. 2010, 27, 10. [Google Scholar]
- Costanza, R.; de Groot, R.; Braat, L.; Kubiszewski, I.; Fioramonti, L.; Sutton, P.; Farber, S.; Grasso, M. Twenty years of ecosystem services: How far have we come and how far do we still need to go? Ecosyst. Serv. 2017, 28, 1–16. [Google Scholar] [CrossRef]
- Xie, G.D.; Lu, C.X.; Leng, Y.F.; Zheng, D.; Li, S.C. Ecological assets valuation of the Tibetan Plateau. J. Nat. Resour. 2003, 18, 189. [Google Scholar]
- Alexander, P.; Rounsevell, M.D.A.; Dislich, C.; Dodson, J.R.; Engström, K.; Moran, D. Drivers for global agricultural land use change: The nexus of diet, population, yield and bioenergy. Glob. Environ. Change 2015, 35, 138–147. [Google Scholar] [CrossRef]
- Worku, I.H.; Dereje, M.; Minten, B.; Hirvonen, K. Diet transformation in Africa: The case of Ethiopia. Agric. Econ. 2017, 48, 73–86. [Google Scholar] [CrossRef]
- Maslow, A.H. Motivation and Personality; Harper & Row: New York, NY, USA, 1970. [Google Scholar]
- Roebeling, P.; Abrantes, N.; Ribeiro, S.; Almeida, P. Estimating cultural benefits from surface water status improvements in freshwater wetland ecosystems. Sci. Total Environ. 2016, 545–546, 219–226. [Google Scholar] [CrossRef] [PubMed]
- Pedersen, E.; Weisner, S.E.B.; Johansson, M. Wetland areas’ direct contributions to residents’ well-being entitle them to high cultural ecosystem values. Sci. Total Environ. 2019, 646, 1315–1326. [Google Scholar] [CrossRef]
- Verhoeven, J.T.A. Wetlands in Europe: Perspectives for restoration of a lost paradise. Ecol. Eng. 2014, 66, 6–9. [Google Scholar] [CrossRef]
- Becken, S.; Stantic, B.; Chen, J.; Alaei, A.R.; Connolly, R.M. Monitoring the environment and human sentiment on the great barrier reef: Assessing the potential of collective sensing. J. Environ. Manag. 2017, 203 Pt 1, 87–97. [Google Scholar] [CrossRef] [PubMed]
- Kusi, K.K.; Khattabi, A.; Mhammdi, N.; Lahssini, S. Prospective evaluation of the impact of land use change on ecosystem services in the Ourika watershed, Morocco. Land. Use Policy 2020, 97, 104796. [Google Scholar] [CrossRef]
- Song, F.; Su, F.L.; Mi, C.X.; Sun, D. Analysis of driving forces on wetland ecosystem services value change: A case in Northeast China. Sci. Total Environ. 2021, 751, 141778. [Google Scholar] [CrossRef] [PubMed]
- Davidson, N.C. How much wetland has the world lost? Long-term and recent trends in global wetland area. Mar. Freshw. Res. 2014, 65, 934. [Google Scholar] [CrossRef]
- Mendoza-González, G.; Martínez, M.L.; Lithgow, D.; Pérez-Maqueo, O.; Simonin, P. Land use change and its effects on the value of ecosystem services along the coast of the Gulf of Mexico. Ecol. Econ. 2012, 82, 23–32. [Google Scholar] [CrossRef]
- Zhang, F.; Yushanjiang, A.; Jing, Y.Q. Assessing and predicting changes of the ecosystem service values based on land use/cover change in Ebinur Lake Wetland National Nature Reserve, Xinjiang, China. Sci. Total Environ. 2019, 656, 1133–1144. [Google Scholar] [CrossRef]
- Mehvar, S.; Filatova, T.; Sarker, M.H.; Dastgheib, A.; Ranasinghe, R. Climate changedriven losses in ecosystem services of coastal wetlands: A case study in the west coast of Bangladesh. Ocean. Coast. Manag. 2019, 169, 273–283. [Google Scholar] [CrossRef]
- Ayeni, A.O.; Ogunsesan, A.A.; Adekola, O.A. Provisioning ecosystem services provided by the Hadejia Nguru wetlands, Nigeria-current status and future priorities. Sci. Afr. 2019, 5, e00124. [Google Scholar] [CrossRef]
- Junk, W.J.; An, S.; Finlayson, C.M.; Gopal, B.; Kvet, J.; Mitchell, S.A.; Mitsch, W.J.; Robarts, R.D. Current state of knowledge regarding the world’s wetlands and their future under global climate change: A synthesis. Aquat. Sci. 2013, 75, 151–167. [Google Scholar] [CrossRef]
- Guerry, A.D.; Polasky, S.; Lubchenco, J.; Chaplin-Kramer, R.; Daily, G.C.; Griffin, R.; Ruckelshaus, M.; Bateman, I.J.; Duraiappah, A.; Elmqvist, T.; et al. Natural capital and ecosystem services informing decisions: From promise to practice. Proc. Natl. Acad. Sci. USA 2015, 112, 7348–7355. [Google Scholar] [CrossRef]
- Portela, R.; Rademacher, I. A dynamic model of patterns of deforestation and their effect on the ability of the Brazilian Amazonia to provide ecosystem services. Ecol. Model. 2001, 143, 115–146. [Google Scholar] [CrossRef]
- Aazami, M.; Shanazi, K. Tourism wetlands and rural sustainable livelihood: The case from Iran. J. Outdoor Recreat. Tour. 2020, 30, 100284. [Google Scholar] [CrossRef]
- Lan, S.F.; Qin, P.; Lu, H.F. Emergy Synthesis of Ecological-Economic Systems; Chemical Press: Beijing, China, 2002. [Google Scholar]
- Li, J. Research on the Obsorption of Heavy by Aquatic Plants in Different Nutritions; Central South University of Forestry and Technology: Changsha, China, 2008. [Google Scholar]
- Zhao, Y.H.; Jing, J.W.; Wang, X.T.; Yue, H.M.; Niu, X.Y.; Fang, J.P. Study on Heavy Metals Bioaccumulation Characteristics and Tolerance of Pioneer Plants from Central Tibet Mining Area. Acta Agrestia Sin. 2016, 24, 598–603. [Google Scholar] [CrossRef]
- Piao, S.L.; Fang, J.Y.; Ciais, P.; Peylin, P.; Huang, Y.; Sitch, S.; Wang, T. The carbon balance of terrestrial ecosystems in China. Nature 2010, 458, 1009–1013. [Google Scholar] [CrossRef]
Figure 1.
Map of the study site.

Figure 2.
Emergy diagram of Maqu wetland ecosystem (in the figure, renewable resources such as solar emergy will be lost due to reflection during input, and the lowest dotted line indicates the final dissipation of emergy).
Figure 2.
Emergy diagram of Maqu wetland ecosystem (in the figure, renewable resources such as solar emergy will be lost due to reflection during input, and the lowest dotted line indicates the final dissipation of emergy).

Figure 3.
The change trends of ESs provided by Maqu wetlands during 1990–2000 (a), 2000–2010 (b), 2010–2020 (c), and the whole study period (d). Names of three categories and nine ESs are noted on the left side.
Figure 3.
The change trends of ESs provided by Maqu wetlands during 1990–2000 (a), 2000–2010 (b), 2010–2020 (c), and the whole study period (d). Names of three categories and nine ESs are noted on the left side.

Figure 4.
The contribution of different factors to changes in ESs from 1990 to 2020. (∆Ep: total changes in ESV; ∆EB: emergy benefit; ∆ES: economic scale; ∆GR: grassland resource endowment; ∆GI: grazing intensity; ∆LS: livestock farming scale; ∆WC: water consumption; ∆WE: water resource endowment).
Figure 4.
The contribution of different factors to changes in ESs from 1990 to 2020. (∆Ep: total changes in ESV; ∆EB: emergy benefit; ∆ES: economic scale; ∆GR: grassland resource endowment; ∆GI: grazing intensity; ∆LS: livestock farming scale; ∆WC: water consumption; ∆WE: water resource endowment).


Table 1.
Wetland ecosystem service value classification system in Maqu County.
| Wetland Ecosystem Service Types | Evaluation Index | |
|---|---|---|
| Provisioning Services | Livestock production | yak and goat slaughter; milk and wool output |
| Raw material production | herbage yield | |
| Regulating Services | Water conservation | Surface water supply; groundwater recharge |
| Climate regulation | Local temperature and humidity regulation | |
| Carbon sequestration | Carbon sequestration by wetland vegetation | |
| Oxygen release | Oxygen release by wetland vegetation | |
| Water purification | Heavy metal removal of aquatic plants | |
| Culture Services | Recreation | Wetland tourism revenue per unit area |
| Scientific research | Scientific research value per unit area | |
Table 2.
The description of seven driving forces.
| Driving Force | Description |
|---|---|
| Emergy benefit (∆EB) | It reflects the emergy benefit of Maqu County economic development, namely the scarcity of Maqu wetland ESs. |
| Economic scale (∆ES) | It reflects the level of local economic development. |
| Grass resource endowment (∆GR) | It reflects the local grass resource endowment. |
| Grazing intensity (∆GI) | It reflects the grazing intensity of the local grassland. |
| Livestock farming scale (∆LS) | It reflects the water consumption of local livestock husbandry, namely the scale of farming. |
| Water consumption (∆WC) | It reflects the extent of local water utilization. |
| Water resource endowment (∆WE) | It reflects the local water resources endowment. |
Table 3.
The emergy analysis table of valuation on wetland ecosystem services in 2020 in Maqu County.
Table 3.
The emergy analysis table of valuation on wetland ecosystem services in 2020 in Maqu County.
| Items | Raw Data | Unit | UEV (sej/unit) 1 | Sources | Total Emergy (sej/y) |
|---|---|---|---|---|---|
| Renewable Resource | |||||
| Sunlight | 7.77 × 10¹⁸ | J | 1 | Brown and Ulgiati [46] | 7.77 × 10¹⁸ |
| Deep heat | 1.06 × 10¹⁵ | J | 4.90 × 10³ | Brown and Ulgiati [46] | 5.18 × 10¹⁸ |
| Wind | 6.93 × 10¹⁰ | J | 8.00 × 10² | Brown and Ulgiati [46] | 5.55 × 10¹³ |
| Rain (geo potential) | 2.97 × 10¹⁶ | J | 1.05 × 10⁴ | Brown and Ulgiati [46] | 3.12 × 10²⁰ |
| Rain (chemical) | 4.28 × 10¹⁵ | J | 7.00 × 10³ | Brown and Ulgiati [46] | 3.00 × 10¹⁹ |
| Runoff (geo potential) | 9.29 × 10¹⁶ | J | 1.28 × 10⁴ | Brown and Ulgiati [46] | 1.19 × 10²¹ |
| Runoff (chemical) | 1.97 × 10¹⁵ | J | 2.13 × 10⁴ | Brown and Ulgiati [46] | 4.19 × 10¹⁹ |
| Provisioning Services | |||||
| Livestock production | 1.73 × 10¹¹ | g | Calculated by Eq | Zhu [47] | 5.81 × 10¹⁴ |
| Raw material production | 7.18 × 10¹¹ | g | 2.70 × 10⁴ | Dong et al. [48] | 1.94 × 10¹⁶ |
| Regulating Services | |||||
| Water conservation 2 | 3.92 × 10¹⁵ | g | Calculated by Eq | Zhu [47] | 2.75 × 10¹⁹ |
| Water purification 3 | 3.60 × 10⁷ | g | Calculated by Eq | Odum [49] | 2.38 × 10¹⁷ |
| Climate regulation | 1.27 × 10¹² | g | 5.15 × 10⁵ | Odum [49] | 6.56 × 10¹⁷ |
| Carbon sequestration | 2.96 × 10⁹ | g | 4.58 × 10³ | Brown and Ulgiati [50] | 1.35 × 10¹³ |
| Oxygen release | 5.46 × 10¹³ | g | 4.58 × 10³ | Brown and Ulgiati [50] | 2.50 × 10¹⁷ |
| Culture Services | |||||
| Recreation | Calculated by Eq | Calculated by Eq | This article | 2.73 × 10¹⁷ | |
| Scientific research | Calculated by Eq | USD | Calculated by Eq | This article | 1.98 × 10¹⁷ |
1 The value of livestock production services consists of four components: yak, sheep, milk, and wool, and the transformity is 4.00 × 10⁶ , 2.00 × 10⁶ , 2.00 × 10⁶ and 4.40 × 10⁶ , respectively. 2 The service value of water conservation is composed of groundwater recharge and surface water recharge of wetland ecosystem, and the transformity is 2.23 × 10³ and 7.01 × 10³ , respectively. 3 The value of wetland water purification is calculated by formula. Considering the availability of data, only the absorption data of three common heavy metal pollutants, Cu, Zn, and Pb, were selected to account for the value of water purification, but there is also efficient nutrient removal, especially nitrogen compounds, such as nitrates, which are all important effects of water quality purification. The transformity of Cu, Zn, and Pb were 6.80 × 10⁹ , 1.25 × 10¹⁰ and 1.25 × 10¹⁰ .
Table 4.
The emergy value of wetland ecosystem services per unit area in Maqu County in 1990–2020 (sej/m2/y).
Table 4.
The emergy value of wetland ecosystem services per unit area in Maqu County in 1990–2020 (sej/m2/y).
| Year | Provisioning Services | Regulating Services | Culture Services | |||||||
|---|---|---|---|---|---|---|---|---|---|---|
| Livestock production | Raw material production | Water conservation | Climate regulation | Water purification | Carbon sequestration 1 | Oxygen release 1 | Scientific research | Recreation | Total 2 | |
| 1990 | 1.41 × 10⁸ | 1.87 × 10¹⁰ | 1.42 × 10¹⁰ | 6.21 × 10⁸ | 2.90 × 10⁸ | 1.28 × 10⁴ | 2.32 × 10⁸ | 1.77 × 10⁹ | 2.44 × 10⁹ | 3.85 × 10¹⁰ |
| 2000 | 1.75 × 10⁸ | 1.87 × 10¹⁰ | 9.17 × 10⁹ | 7.08 × 10⁸ | 2.92 × 10⁸ | 1.28 × 10⁴ | 2.32 × 10⁸ | 4.53 × 10⁸ | 6.26 × 10⁸ | 3.04 × 10¹⁰ |
| 2010 | 3.04 × 10⁸ | 1.89 × 10¹⁰ | 1.42 × 10¹⁰ | 6.88 × 10⁸ | 2.96 × 10⁸ | 1.28 × 10⁴ | 2.44 × 10⁸ | 3.47 × 10⁸ | 4.80 × 10⁸ | 3.55 × 10¹⁰ |
| 2020 | 5.50 × 10⁸ | 1.84 × 10¹⁰ | 2.60 × 10¹⁰ | 6.21 × 10⁸ | 1.92 × 10⁸ | 1.28 × 10⁴ | 2.37 × 10⁸ | 1.87 × 10⁸ | 2.58 × 10⁸ | 4.64 × 10¹⁰ |
1 The service emergy values of carbon sequestration and oxygen release show no interannual variation in the table due to the small interannual fluctuation, but the actual variation is consistent with the variation in their total service emergy values when they are converted to service emergy per unit area due to the numerical expression. 2 The total emergy value per unit area here refers only to the total emergy value of the nine ecosystem services listed in the table, excluding renewable resources, to facilitate subsequent calculations and analysis.
Table 5.
Emergy value and monetary value of wetland ecosystem services in Maqu County in 1990–2020.
| Year | Emergy Value (sej/y) | Emergy Value Currency Ratio (sej/USD) 1 | Monetary Value (USD/m2/y) |
|---|---|---|---|
| 1990 | 4.24 × 10¹⁹ | 1.04 × 10¹⁰ | 3.93 |
| 2000 | 3.31 × 10¹⁹ | 1.59 × 10⁹ | 6.16 |
| 2010 | 3.81 × 10¹⁹ | 1.45 × 10⁹ | 13.05 |
| 2020 | 4.90 × 10¹⁹ | 7.63 × 10⁸ | 41.45 |
Table 6.
Comparison with ESV results based on market calculation methods.
| Monetary Value (USD/m2) | Data Source |
|---|---|
| 1.42 | Niu et al. [57] |
| 1.41 | Xie et al. [61] |
| 0.82 | Wang et al. [58] |
| 0.98 | Chen et al. [59] |
| 13.05 1 | This article |
1 Considering the timeliness of the literature, we chose to compare the results of 2010 with other studies.
Disclaimer/Publisher’s Note: The statements, opinions and data contained in all publications are solely those of the individual author(s) and contributor(s) and not of MDPI and/or the editor(s). MDPI and/or the editor(s) disclaim responsibility for any injury to people or property resulting from any ideas, methods, instructions or products referred to in the content. |
© 2024 by the authors. Licensee MDPI, Basel, Switzerland. This article is an open access article distributed under the terms and conditions of the Creative Commons Attribution (CC BY) license (https://creativecommons.org/licenses/by/4.0/).
Share and Cite
MDPI and ACS Style
Han, Z.; Zhao, R.; Zhang, L.; Chen, X.; Wang, J.; Lu, H.; Liu, F. Evaluation and Driving Forces of Ecosystem Service Change in Maqu Alpine Wetland: An Emergy Approach. Land 2024, 13, 366. https://doi.org/10.3390/land13030366
AMA Style
Han Z, Zhao R, Zhang L, Chen X, Wang J, Lu H, Liu F. Evaluation and Driving Forces of Ecosystem Service Change in Maqu Alpine Wetland: An Emergy Approach. Land. 2024; 13(3):366. https://doi.org/10.3390/land13030366
Chicago/Turabian StyleHan, Ziyi, Ruifeng Zhao, Lihua Zhang, Xidong Chen, Jingfa Wang, Haitian Lu, and Fushou Liu. 2024. "Evaluation and Driving Forces of Ecosystem Service Change in Maqu Alpine Wetland: An Emergy Approach" Land 13, no. 3: 366. https://doi.org/10.3390/land13030366
Note that from the first issue of 2016, this journal uses article numbers instead of page numbers. See further details here.