

Assessment of Coastal Cultural Ecosystem Services and Well-Being for Integrating Stakeholder Values into Coastal Planning

1
Baltic Environmental Forum—Latvia, LV-1050 Riga, Latvia
2
Faculty of Geography and Earth Sciences, University of Latvia, LV-1589 Riga, Latvia
*
Author to whom correspondence should be addressed.
Land 2024, 13(3), 362; https://doi.org/10.3390/land13030362
Submission received: 31 January 2024
/
Revised: 4 March 2024
/
Accepted: 8 March 2024
/
Published: 13 March 2024
(This article belongs to the Special Issue Ecological and Cultural Ecosystem Services in Coastal Areas)
Abstract
:Coastal areas provide ecosystem services (ES), including a wide range of cultural ecosystem services (CES). This study aims to operationalize the ES approach for integrated assessment and mapping of coastal CES through the case of the eastern Baltic Sea coast in Latvia. It explores an interdisciplinary approach to enhance coastal planning, leveraging the strengths of plural disciplines to ensure a more holistic representation of coastal CES. A set of methods and techniques from landscape ecology (e.g., landscape characterization, quality assessment, biophysical mapping) and social sciences (participatory GIS, stakeholder engagement events, nationwide survey) are developed and tested, particularly demonstrating links and correlations between landscape character and CES values and well-being dimensions. The results illuminate the main perceived well-being benefits that people gain from the coastal areas, highlighting the different perspectives of stakeholders. Finally, the integrated assessment results helped to construct proposals for sustainable tourism development in the area. The outcomes of the study are intended to assist planners and decision-makers in evaluating the potential for development and trade-offs in coastal regions. This research contributes to the advancement of coastal spatial planning methodologies, emphasizing the importance of stakeholder engagement and ES assessment for informed decision-making.
1. Introduction
Coastal regions represent a spatial realm where terrestrial and marine environments interact, giving rise to distinctive ecosystems on land and at sea. Within the European context, coastal areas have historically and contemporarily played a pivotal role in the socio-economic and cultural development of communities [1]. Due to the multidimensional nature of coastal areas, the ecosystems therein exhibit diverse and specific features and qualities, contributing to the provision of various ecosystem services (ES). However, the coast has experienced escalating pressures from human activities over the last decades, accompanied by an expanding demand for space [2,3]. The growing human influence poses a significant threat to the uninterrupted supply of ES unless a more sustainable approach to the management of coastal natural capital is promptly implemented [4,5,6]. This is particularly evident in the context of coastal recreational and tourism development. European coastal tourism grew until the onset of COVID-19, then subsequently experienced a dramatic decline, and is now gradually recovering, with an increasing number of people, both within the European Union and internationally, allocating larger portions of their income to travel and leisure [7].
The concept of ES has gained recognition for its application in addressing challenges and controversial issues during the planning of nature conservation and the sustainable use of ecosystems [5,8]. Maritime spatial planning, integrated coastal zone planning, and marine strategy represent key governance tools employed to progressively incorporate the outcomes of ES assessments [9,10,11]. The ES concept encompasses ecological, economic, and social systems, thereby establishing a nexus between the environmental dimension and political decision-making processes [12,13]. The advancement of indicators, encompassing both biophysical and socio-cultural dimensions, is encouraged to elucidate the intricate relationships between humans and nature in a quantified format [14,15].
Cultural ecosystem services (CES) provide opportunities for social interactions and intangible benefits through active or passive engagement with nature. They involve the reception of artistic and scenic appreciation, contribute to educational development, and foster spiritual fulfillment. They are based on cultural diversity and identity, thus linking cultural landscapes and heritage values [16]. CES can be combined with cultural landscape research [17,18,19]; in particular, studies related to aesthetics or cultural heritage could provide valuable input for a comprehensive assessment of CES [20] and implications for management [21]. Choosing a landscape perspective could serve as a practical approach, as numerous researchers either have not tried to establish connections between CES and ecosystems or have encountered challenges in doing so [22].
When assessing CES, assigning intangible values to marine and coastal cultural ecosystem services has been challenging [23,24]. It has become essential to establish an appropriate assessment unit by considering ecosystem types (e.g., beach or forest), as well as habitats (e.g., coastal lagoons or wooded dunes), and other distinctive features of each individual coastal and marine region. Another challenge is the interface between land and sea, the characteristics of direct shoreline and adjacent land, and the identification of the proper biophysical and socio-cultural assessment criteria and indicators [25,26,27].
Coastal spatial planning processes necessitate the incorporation of robust participatory procedures to ensure the recognition of the multiple interests of stakeholders and plural values, as well as support to mitigate conflicts and manage trade-offs [28]. Different societal groups perceive ecosystems, including marine and coastal systems, through the prism of their unique economic, cultural, and societal perspectives. The review conducted by Kosanic and Petzold [29] emphasizes the presence of knowledge gaps in how different categories of CES affect various societal groups and different types of well-being. A pertinent strategy for assessing CES involves engaging stakeholders and other beneficiaries, especially in recognizing and using values in a spatially explicit manner [30,31].
Participatory GIS (PGIS) has emerged as a valuable tool for mapping CES by pinpointing specific locations or delineating areas of significance to local stakeholders [32]. This process involves identifying preferred areas for deriving benefits from ecosystems and landscapes, as well as assessing attitudes towards land and space usage [33]. While conventional methods such as paper maps were once prevalent, modern digital or online GIS tools facilitate surveys conducted during events or remotely [34,35]. However, the mere incorporation of spatial technology into a singular participatory exercise does not guarantee influence on decisions regarding land and marine use [33]. To achieve a substantial impact, multiple interactions with stakeholders are indispensable to ensure that social values are integrated throughout the planning process [33]. This inclusive approach helps to overcome barriers to meaningful public engagement in sustainable planning.
Integration of biophysical expert-based CES mapping with participatory approaches is increasingly considered best practice for eliciting meaningful values for planning and decision making [36]. Narrowing the assessment scope to exclusively encompass natural science or biophysical measurements will significantly diminish the efficacy of ES indicators in providing valuable and pertinent information for decision-makers regarding a specific policy objective [15]. Integration of multiple sources of data and assessment results can be achieved by using established decision-support frameworks such as multi-criteria analysis [37]. This approach has been tested in the CES assessment of the Latvian coastline as an input to maritime spatial planning by prioritizing the suitability of the coastal areas for recreation [38].
The integrated assessment approach represents different combinations of methods and underlines the necessity for collaboration among scientists from different disciplines [24]. Joint efforts between economists and ecologists have been firmly established in the development of valuation studies of CES, while the contributions of social sciences and humanities have been relatively neglected [24]. Understanding the human dimensions of the sea, including its impact on health, inspiration, childhood experiences, cultural connection, and place identity, is crucial to ensuring a sustainable future for the coastal areas and the well-being of coastal communities. Addressing this complexity could be facilitated by integrating social science methods into assessments and valuations of marine cultural ecosystem services [39]. A lack of understanding of interlinks between coastal ecosystem structures and CES has been identified by recent marine and coastal studies [40].
The aim of the study is to enhance the integrated assessment of CES to support sustainable coastal development planning, particularly in terms of incorporating expert-based and stakeholder engagement approaches. By operationalizing biophysical mapping and stakeholder engagement, the study addresses key questions regarding coastal CES assessment, stakeholder involvement, and sustainable tourism development. Key research questions are as follows:
- How does the landscape characterization approach, and landscape quality assessment, contribute to biophysical mapping and assessment of coastal CES?
- How can social methods such as participatory GIS contribute to interpretation of expert based biophysical mapping and assessment of CES?
- What are the public’s perceived benefits and links to CES? What values are assigned to CES by different stakeholders?
- In which way can CES assessment be taken up to plan level sustainably?
The application of this approach is demonstrated through a study conducted in a coastal area within Europe—the southwestern coast of Latvia, the eastern part of the Baltic Sea.
2. Materials and Methods
2.1. Study Area
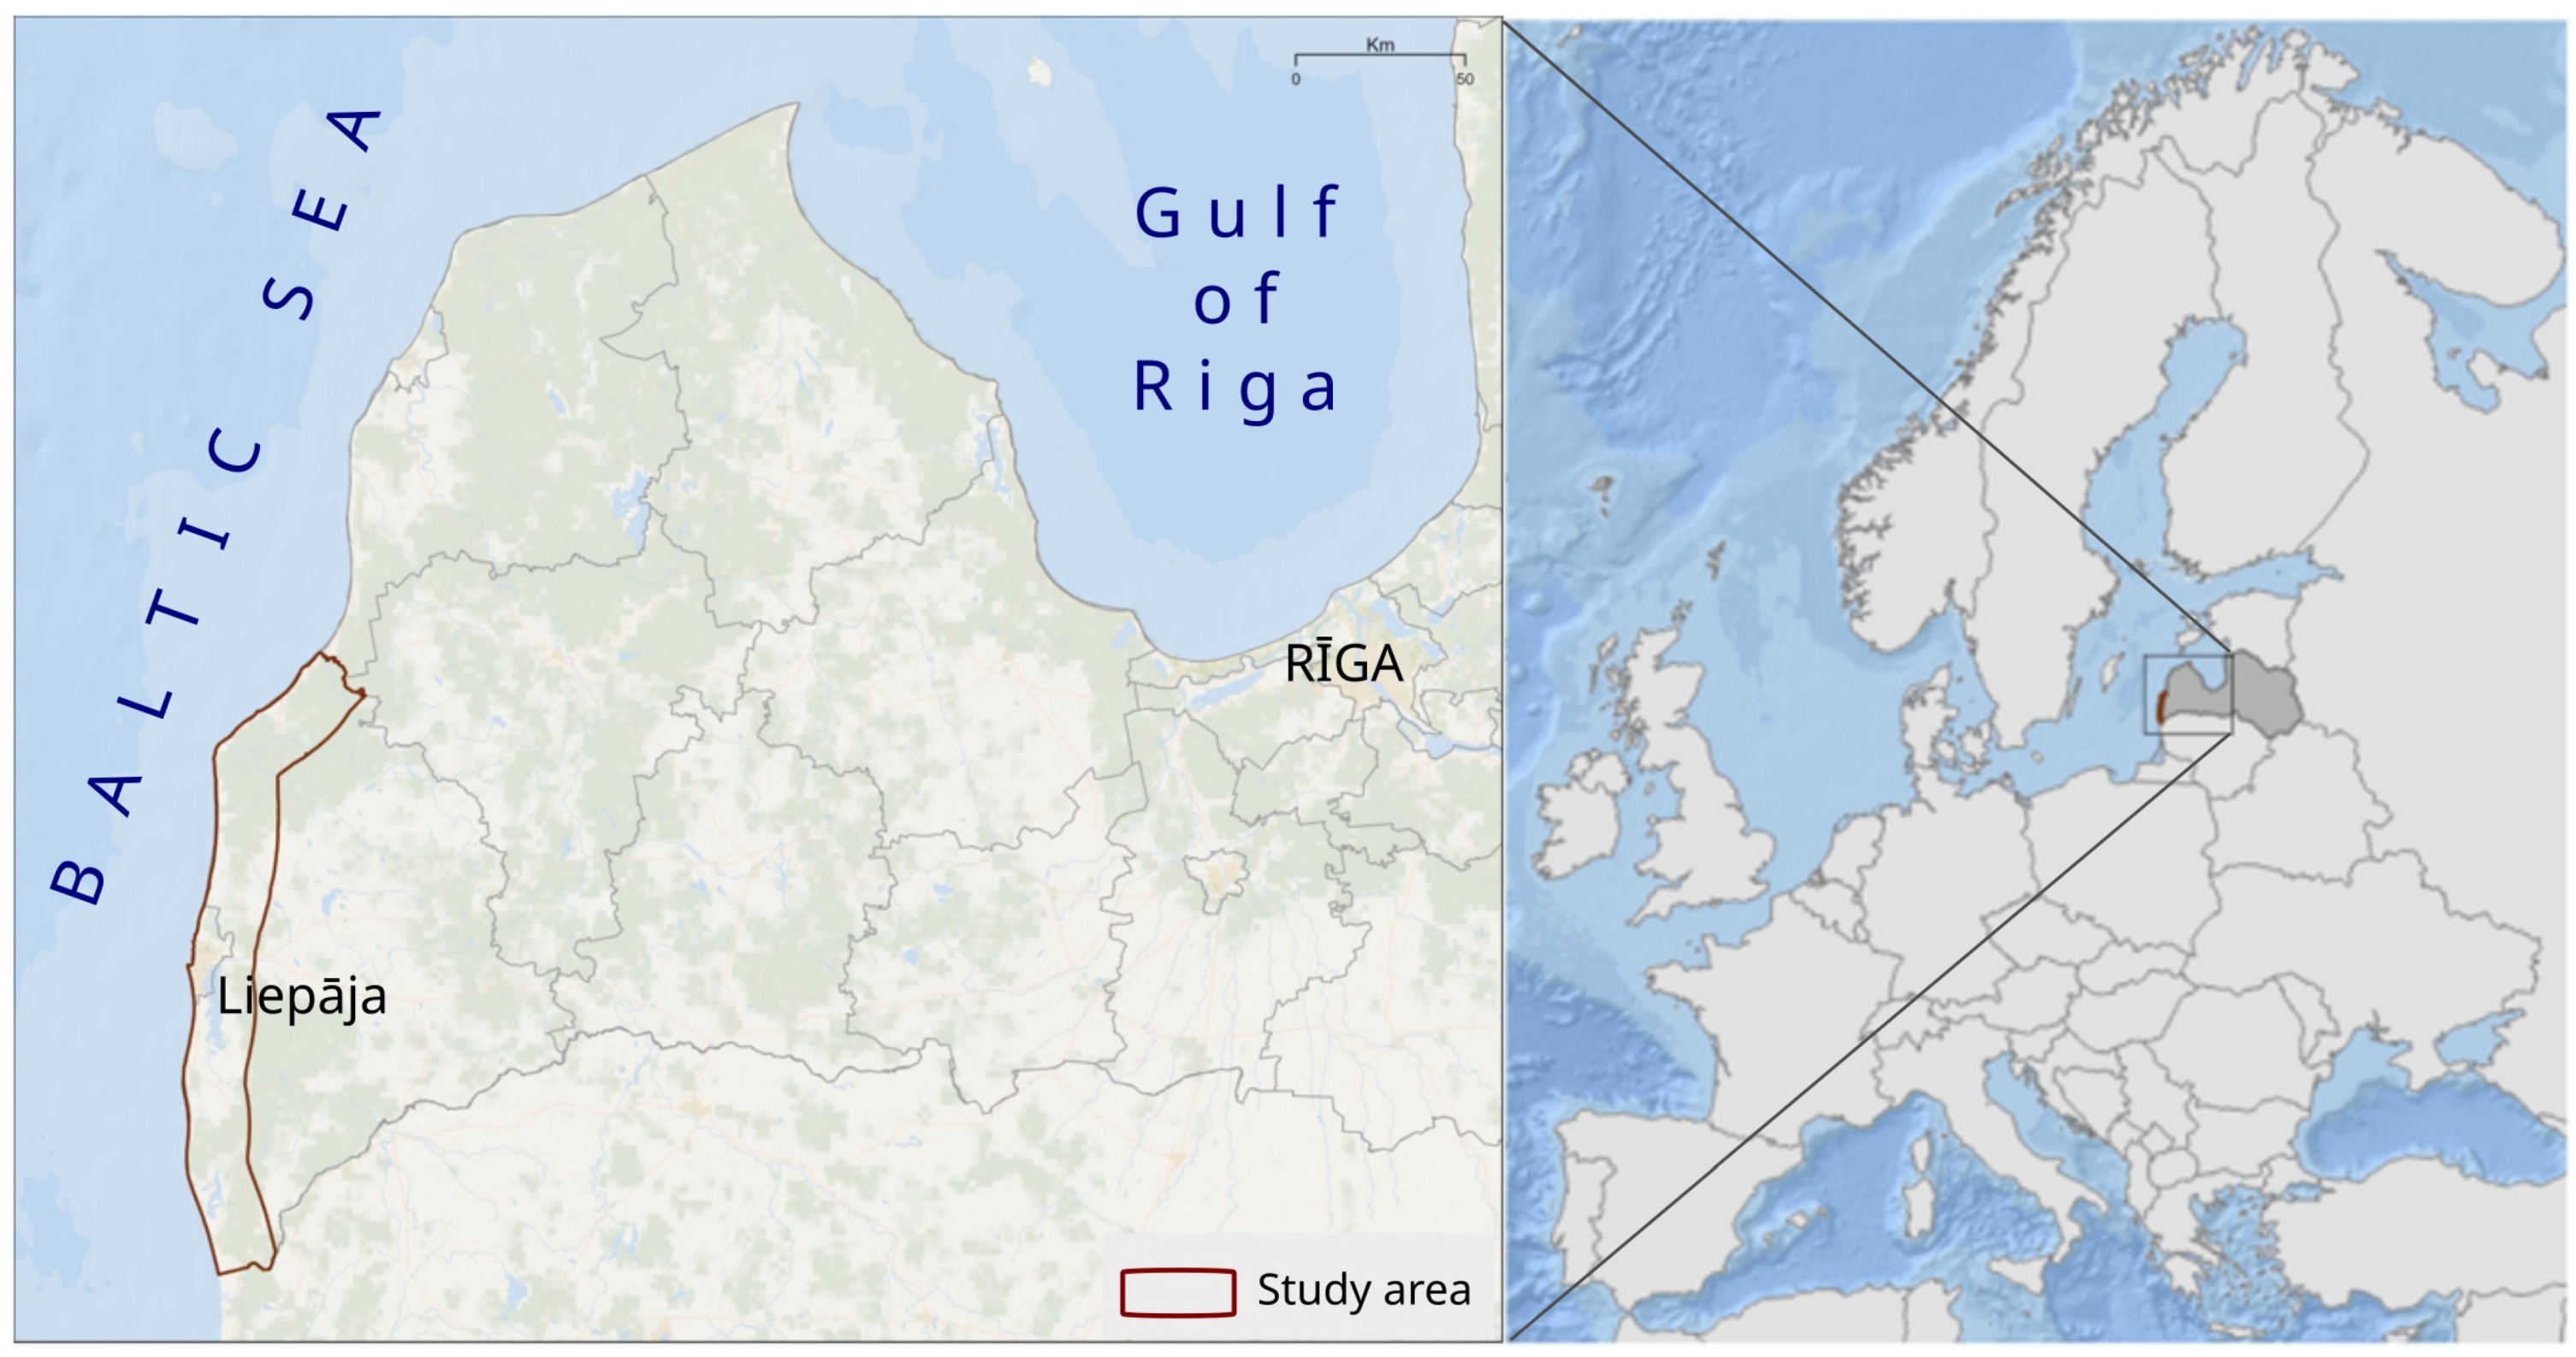
The study area—the Southwestern Kurzeme coastal area—is located in the Kurzeme Region in the southwestern part of Latvia (Figure 1). It stretches for about 120 km along the coast from the Latvian-Lithuanian border until the border of Ventspils municipality. The total size of the study area is around 1200 km2. The study area covers the terrestrial part up to 10 km inland from the shoreline.
Administratively, it includes Liepaja city and the coastal part of Dienvidkurzeme municipality. According to the National Statistical System of Latvia [41], the largest settlements in the area are Liepaja City (around 67,000 inhabitants) and Pavilosta town (around 820 registered inhabitants; however, the population of Pavilosta increases dramatically during the summer months). The habitation comprises also 17 coastal and inland villages, as well as smaller settlements. The rural part of the study area is characterized by a low population density—9.18 individuals/km2 [41].
The study area consists of a highly diverse land-use mosaic [42]. It encompasses coastal ecosystems (sandy beaches, dune habitats), vast coniferous forest areas, wetlands, lakes and rivers, grasslands, and agricultural lands, including polders. The study area also plays an important role in nature conservation—some parts of it are included in nature protection areas (e.g., Pape Nature Park and Bernati Nature Park) (MoEPRD, 2016). The adjacent coastal waters are important for fish spawning and nursery, as well as migrating birds and wintering waterfowl [43].
Key maritime economic activities in the study area include coastal tourism, fishing, and shipping [41]. A multimodal harbor operates in Liepaja, while Pavilosta serves for fisheries and expanding maritime tourism, particularly in the realm of yachting. The inland part of the study area is used for agriculture, forestry, and, more recently, wind energy production. Currently, wind turbines are operational in the onshore part, but there is an emerging interest among developers in building offshore wind farms in the adjacent territorial waters and Exclusive Economic Zone [26].
The main stakeholder groups directly engaged in the study are representatives of local authorities, national and regional environmental and nature conservation authorities, and other governmental institutions, as well as representatives of niche tourism and renewable energy production sectors. The anticipated offshore wind energy development is raising concerns among local stakeholders regarding the potential impact on landscape qualities and coastal tourism. At the same time, stakeholders are worried about expansive, uncontrolled tourism development and insufficient tourism infrastructure, resulting in damage to the fragile coastal ecosystems and landscape.
2.2. Methods
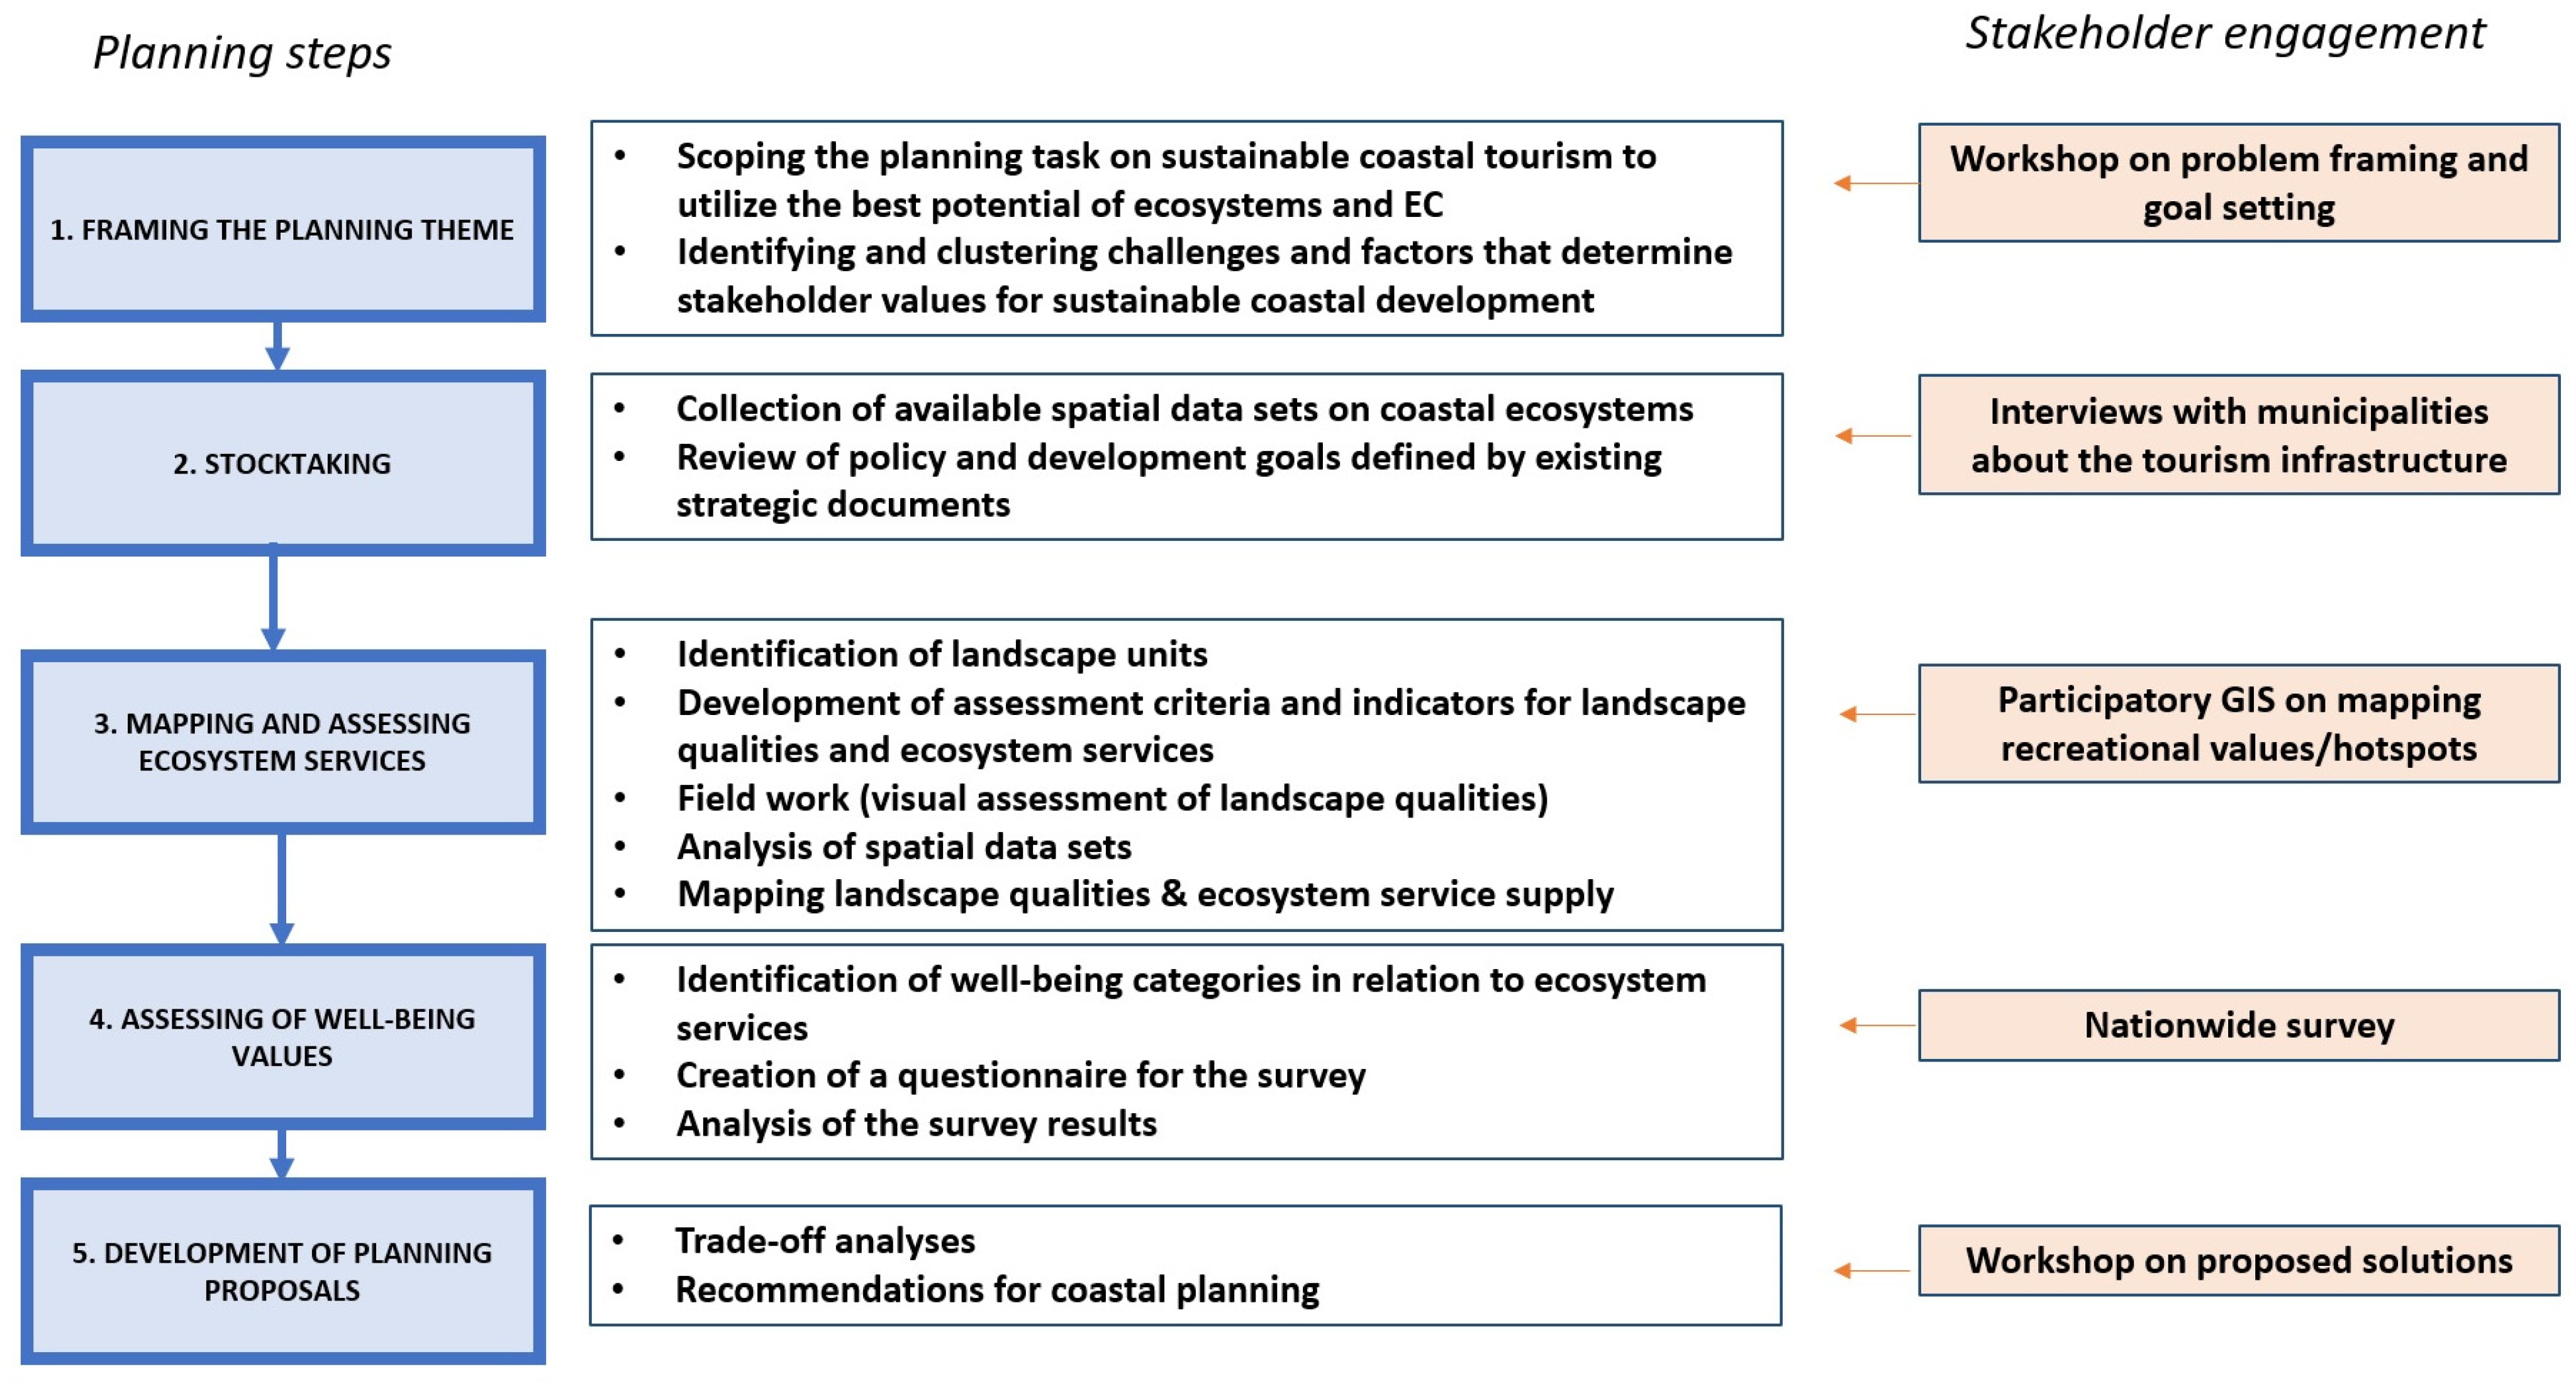
The study’s framework (Figure 2) aligns with the recommended key planning steps for coastal zone and ecosystem-based maritime spatial planning. The process commences with framing the policy theme, followed by stocktaking, assessment, analysis, and the development of proposals for decision-making [41,42]. The innovative methodological aspect of this approach lies within the robust integration of mapping and assessment of ecosystem services, coupled with the evaluation of perceived well-being benefits, providing additional perspectives for this type of planning. Furthermore, the study incorporates both expert-based (biophysical methods) and stakeholder engagement (social methods) approaches. This comprehensive and transdisciplinary approach offers additional perspectives for this type of planning.
The subsequent thematic task bundles are designed to develop and showcase a methodology aimed at ensuring sustainable coastal development planning:
- Biophysical mapping and assessing coastal CESs involve applying a landscape characterization approach to identify and delineate landscape areas as fundamental units for CES. This process also includes the development of criteria and indicators for both quantitative and qualitative assessment, along with the comprehensive mapping and assessment of CES.
- Stakeholder engagement in assessing coastal development potential and priorities is facilitated through workshops, operationalizing the PGIS method for mapping recreational hotspots and incorporating local perspectives, as well as implementing a nationwide survey to evaluate the contribution of coastal ecosystems to human well-being. This combination of methods aims to contribute to the analysis of trade-offs by gathering insights from a diverse range of participants.
- Development of planning proposals for sustainable tourism development grounded in landscape qualities and CES, with a specific focus on addressing the trade-off between “naturalness vs. amenities”.
2.2.1. Biophysical Mapping and Assessment of CES
The study involves biophysical mapping [37] of CES, adapting a landscape characterization approach developed in England and Scotland [44,45]. This approach includes two main tasks: (i) landscape characterization—conducting a desk study of available spatial data to identify key biophysical and socio-cultural features that determine landscape character, represented types, and landscape areas as an assessment unit; followed by performing a field survey to assess aesthetic and perceptual aspects of the landscape; and classifying, mapping and delineating the landscape character types and areas; (ii) landscape assessment—selecting assessment criteria and indicators; quantifying the assessment scale for defined indicators; scoring the landscape quality value for each indicator in each landscape area by analysis of the spatial data sets or expert judgment.
We used the landscape area as the spatial unit for assessing CES (i.e., service-providing area). The landscape area, defined as a discrete geographical area that is structurally and functionally relatively homogeneous, exhibiting similar land-use patterns and development history [44,46], is recognized as a suitable unit for defining landscape quality objectives [47], communicating planning solutions [48], and mapping ES [46]. We developed two typologies for delineating coastal landscape areas—one for inland and another for shoreline—due to the distinctive ecosystem structures present in these two landscape domains. The boundaries of landscape areas were delineated using spatial data on dominant land cover/land use and relief (topography maps in scale 1:50,000 and 1: 10,000, orthophoto images, Corine Land Cover maps, a digital relief model and maps of shoreline character and sediments). Additional boundaries were verified during a field survey in the summer of 2019, when each landscape area was visited to get an in-situ impression of its characteristics through photo documentation, filling a fact sheet, and expert-based assessment (with a pre-defined scoring scale) for features that cannot be calculated from spatial datasets.
Each landscape area was assessed in relation to six landscape quality criteria: aesthetic quality, uniqueness, landscape diversity, naturalness, cultural heritage, and recreational potential (Table 1). For the assessment of landscape qualities, we adapted a set of indicators developed by Zariņa et al. [49], adjusting the indicators and their quantification scale (1–5) to suit the context of the coastal landscape. The set of indicators allows the combination of the assessment of the biophysical and socio-cultural characteristics of landscape as well as objectively measurable and perceptual features. The indicators are related to the relevant CES categories according to the CICES v.5.1: “Characteristics of living systems that enable activities promoting health, recuperation or enjoyment through active or immersive interactions” (3.1.1.1); “Characteristics of living systems that enable activities promoting health, recuperation or enjoyment through passive or observational interactions” (3.1.1.2); “Characteristics of living systems that are resonant in terms of culture or heritage” (3.1.2.3); and “Characteristics of living systems that enable aesthetic experiences” (3.1.2.4).
In this assessment scheme, a score of 1 refers to the lowest value, while a score of 5 represents the highest value of the landscape characteristics along the entire Latvian coastline. The score was calculated either based on landscape metrics (e.g., the share of land cover types), number of specific features (e.g., cultural history monuments, accommodation possibilities, tourism attractions, visitors), or using expert judgment derived from field surveys’ observations. Finally, we aggregated the indicator scores of each landscape area at the level of landscape quality criteria and normalized them on a scale of 0–1 (with 1 representing the highest rating). The indicators, assessment scale, and data sources used for each indicator are available in Appendix A (Table A1—for inland landscape assessment indicators and Table A2—for shoreline landscape assessment indicators).
The maps of landscape quality value at the criteria level were created using ArcGIS Arcgis Desktop 10.8 software. These maps were then published in an online platform Land-Sea-Act Map Explorer1 to communicate the CES assessment results with stakeholders and facilitate their involvement in the development of planning solutions. The online platform was developed using ArGIS Online tools which involved combining the feature layers into “Web maps” and creating the platform with “Experience Builder”.
Statistical analyses of correlations between landscape quality indicators were performed using the R programming language (version 4.3.2). The ‘stats’ and ‘corrr’ packages were employed to compute correlation coefficients and construct the correlation matrix. The Pearson correlation coefficient, along with a significance level, was computed to assess linear relationships between continuous variables (landscape quality indicators) both for shoreline and inland landscapes. Correlation coefficients were calculated using metric values for the 17 shoreline landscape area units and 55 inland landscape area units. The correlation matrices were then visually inspected to identify any strong positive or negative correlations, which were color-marked in the final table.
2.2.2. Stakeholder Engagement Methods
We employed a variety of social methods to gather insights into stakeholder concerns, values, and perceptions while implementing the planning steps presented in the framework (Figure 2). Face-to-face interaction remains crucial, especially in the initial stages of coastal or marine spatial planning [10,51]. Therefore, we organized a facilitated stakeholder workshop on problem framing and goal setting. Thematic clusters focusing on the challenges, benefits, and losses associated with different uses of coastal space and the development of coastal tourism emerged from the workshop, providing valuable input for further stakeholder engagement activities. Additionally, interviews were conducted with representatives from local municipalities responsible for spatial and development planning. Another facilitated workshop was organized in the final step of the study to discuss the development proposals for coastal tourism. The interactions between the research team and stakeholders served as a valuable forum for sharing experiences and debating the relevance of the coastal ecosystems and landscapes to their lives.
A methodological advancement was dedicated to the following two tasks: (i) operationalizing Participatory GIS to collect local knowledge on the spatial distribution and significance of CES and (ii) implementing a nationwide survey to evaluate the contribution of coastal ecosystems to human well-being.
- Participatory GIS (PGIS)
The PGIS method supports planners and researchers in engaging with people in the generation of spatially explicit information for a variety of planning and decision-making purposes [33]. In this study, it was applied to (i) collect local knowledge to articulate the CES values, (ii) to verify the biophysical mapping results on recreational potential, and (iii) to support the development of proposals for coastal tourism development.
The online PGIS survey was created using the ArcGIS Online Tool “Survey123” and launched in the autumn of 2020. Respondents of the survey were asked to pinpoint locations they deemed critical for recreation and tourism and then to complete a brief questionnaire detailing the functionality or suitability for concrete activities of the identified site. The respondents were allowed to allocate several functions to one site. The PGIS survey utilized in the study is available in Appendix C.
The primary target audience for the survey was stakeholders of the local communities in the study area. The survey was disseminated through workshops, local municipality websites, and social media channels. During the surveying process, data on 82 sites were collected. The data on site functionality was used to associate the sites with CES during the formulation of tourism and recreation proposals linked to the method described in Section 2.2.3.
- National scale social survey
A nationwide scale Computer-Assisted Web Interviewing (CAWI) social survey (n = 1000) was conducted in May 2021. The main aim of the survey was to obtain data on the perceived well-being benefits provided by the ecosystems of Southwestern Kurzeme coastal area both to local residents and visitors.
The survey content was developed by the authors of the study. The survey was distributed by an outsourced sociology company, which ensured a representative sample of respondents from the general national population (aged 18–74) by gender, age, region, type of settlement, and nationality. Survey respondents were selected using random stratified sampling.
Out of the total 1000 survey respondents, 90 were local inhabitants of the study area. 224 respondents stated that they have never visited the Southwestern Kurzeme coastal area and therefore were excluded from the analysis of perceived well-being benefits provided by the area. Thus, the responses represent the views of 686 visitors and 90 local inhabitants.
The survey consisted of four distinct sets of questions:
- Respondent’s connection to the Southwestern Kurzeme coastal area: in this section, respondents indicated their connection to the area (local resident/visitor), primary objectives of their visits, and other relevant visitation details.
- Perceived well-being benefits associated with the Southwestern Kurzeme coastal area: this section was exclusively presented to respondents who previously indicated that they had visited the area. The study encompassed seven well-being dimensions derived from a literature analysis [14,49,50] and then tailored to the study context. The seven well-being dimensions included in this study were: (i) safety and sense of security, (ii) financial/material security, (iii) leisure, (iv) health and life satisfaction, (v) social relations, (vi) education, and (vii) ecological contentment. Respondents were asked to rate statements (Appendix B, Q5) related to the various well-being dimensions on a scale from 1 to 4 where 1—completely disagree, 2—partially disagree, 3—partially agree, and 4—completely agree. To accommodate situations where participants may not have a well-formed opinion on the statement, an additional response option, “I don’t know” was included in the potential response list. These responses were not included in the final analysis of perceived well-being benefits. As a result, some of the statements have varying numbers of responses.
- Preferences for coastal recreation: This section focused on identifying factors that influence the selection of a location for coastal recreation, both ecosystem and amenity-related. Respondents were asked to rate the importance of various features (Appendix B, Q10) on a scale from 1 to 4 where 1—completely unimportant, 2—minor importance, 3—important but not decisive, and 4—very important. To accommodate situations where participants may not have a well-formed opinion on a feature, an additional response option, “I don’t know” was included in the potential response list. These responses were not included in the final analysis of the preferences.
- Demographics: The final section was dedicated to the collection of demographic data from the respondents.
The questionnaire is available in Appendix B.
The statistical analysis of the survey results was performed in JASP 0.18.3 software [52]. The Mann-Whitney U-test—a non-parametric statistical test that is often utilized to evaluate if statistically significant differences between two independent groups exist—was employed to test for potential differences in perceived well-being benefits between local inhabitants of the Southwestern Kurzeme coastal area and visitors to this area.
2.2.3. Development of Planning Proposals
The development of planning proposals for coastal tourism development served as the final planning step within the framework and workflow outlined in the study. Based on landscape character assessment, landscape areas were segmented into clusters based on high values in certain landscape quality criteria. The aim of the clustering is to highlight the existing high values (above average in the given landscape criteria group) of the landscape areas and to use them as the main driver for tourism development. A single landscape area may correspond to several clusters in terms of its characteristics, e.g., it may have both high natural and aesthetic values. In such case, tourism development should consider all values present in the landscape area, ranking them in order of importance (from highest priority): (1) naturalness values, (2) cultural and historical values, and (3) aesthetic values. The gradation of importance is based on the normative weight of the given values. The protection of nature values is linked to EU-level legislation (e.g., Habitats Directive). Cultural heritage is protected under national or local regulations (e.g., National Law on Protection of Cultural Monuments). In addition, landscape areas were assessed in relation to the use of their recreational potential–an area with high scores for indicators representing tourism interest (“Density of tourism attractions/objects” and “Presence of nature parks, national parks, and nature monuments”), but low scores for indicators of tourism infrastructure and accessibility were indicated as “areas with underused recreational potential”. The results of the PGIS complemented the clustering outcomes during the development of solutions.
For each cluster, recommendations for tourism development were proposed. General recommendations relevant to planning tourism development in all landscape areas were summarised separately. The protection regime of aesthetic values could potentially be included in municipal spatial or development planning documents. Identified landscape area clusters and recommendations for tailoring tourism development to site-specific values/landscape qualities were elaborated and discussed with stakeholders during a dedicated workshop.
3. Results
3.1. Biophysical Mapping and Assessment of Cultural Ecosystem Service
3.1.1. Identification of Landscape Areas
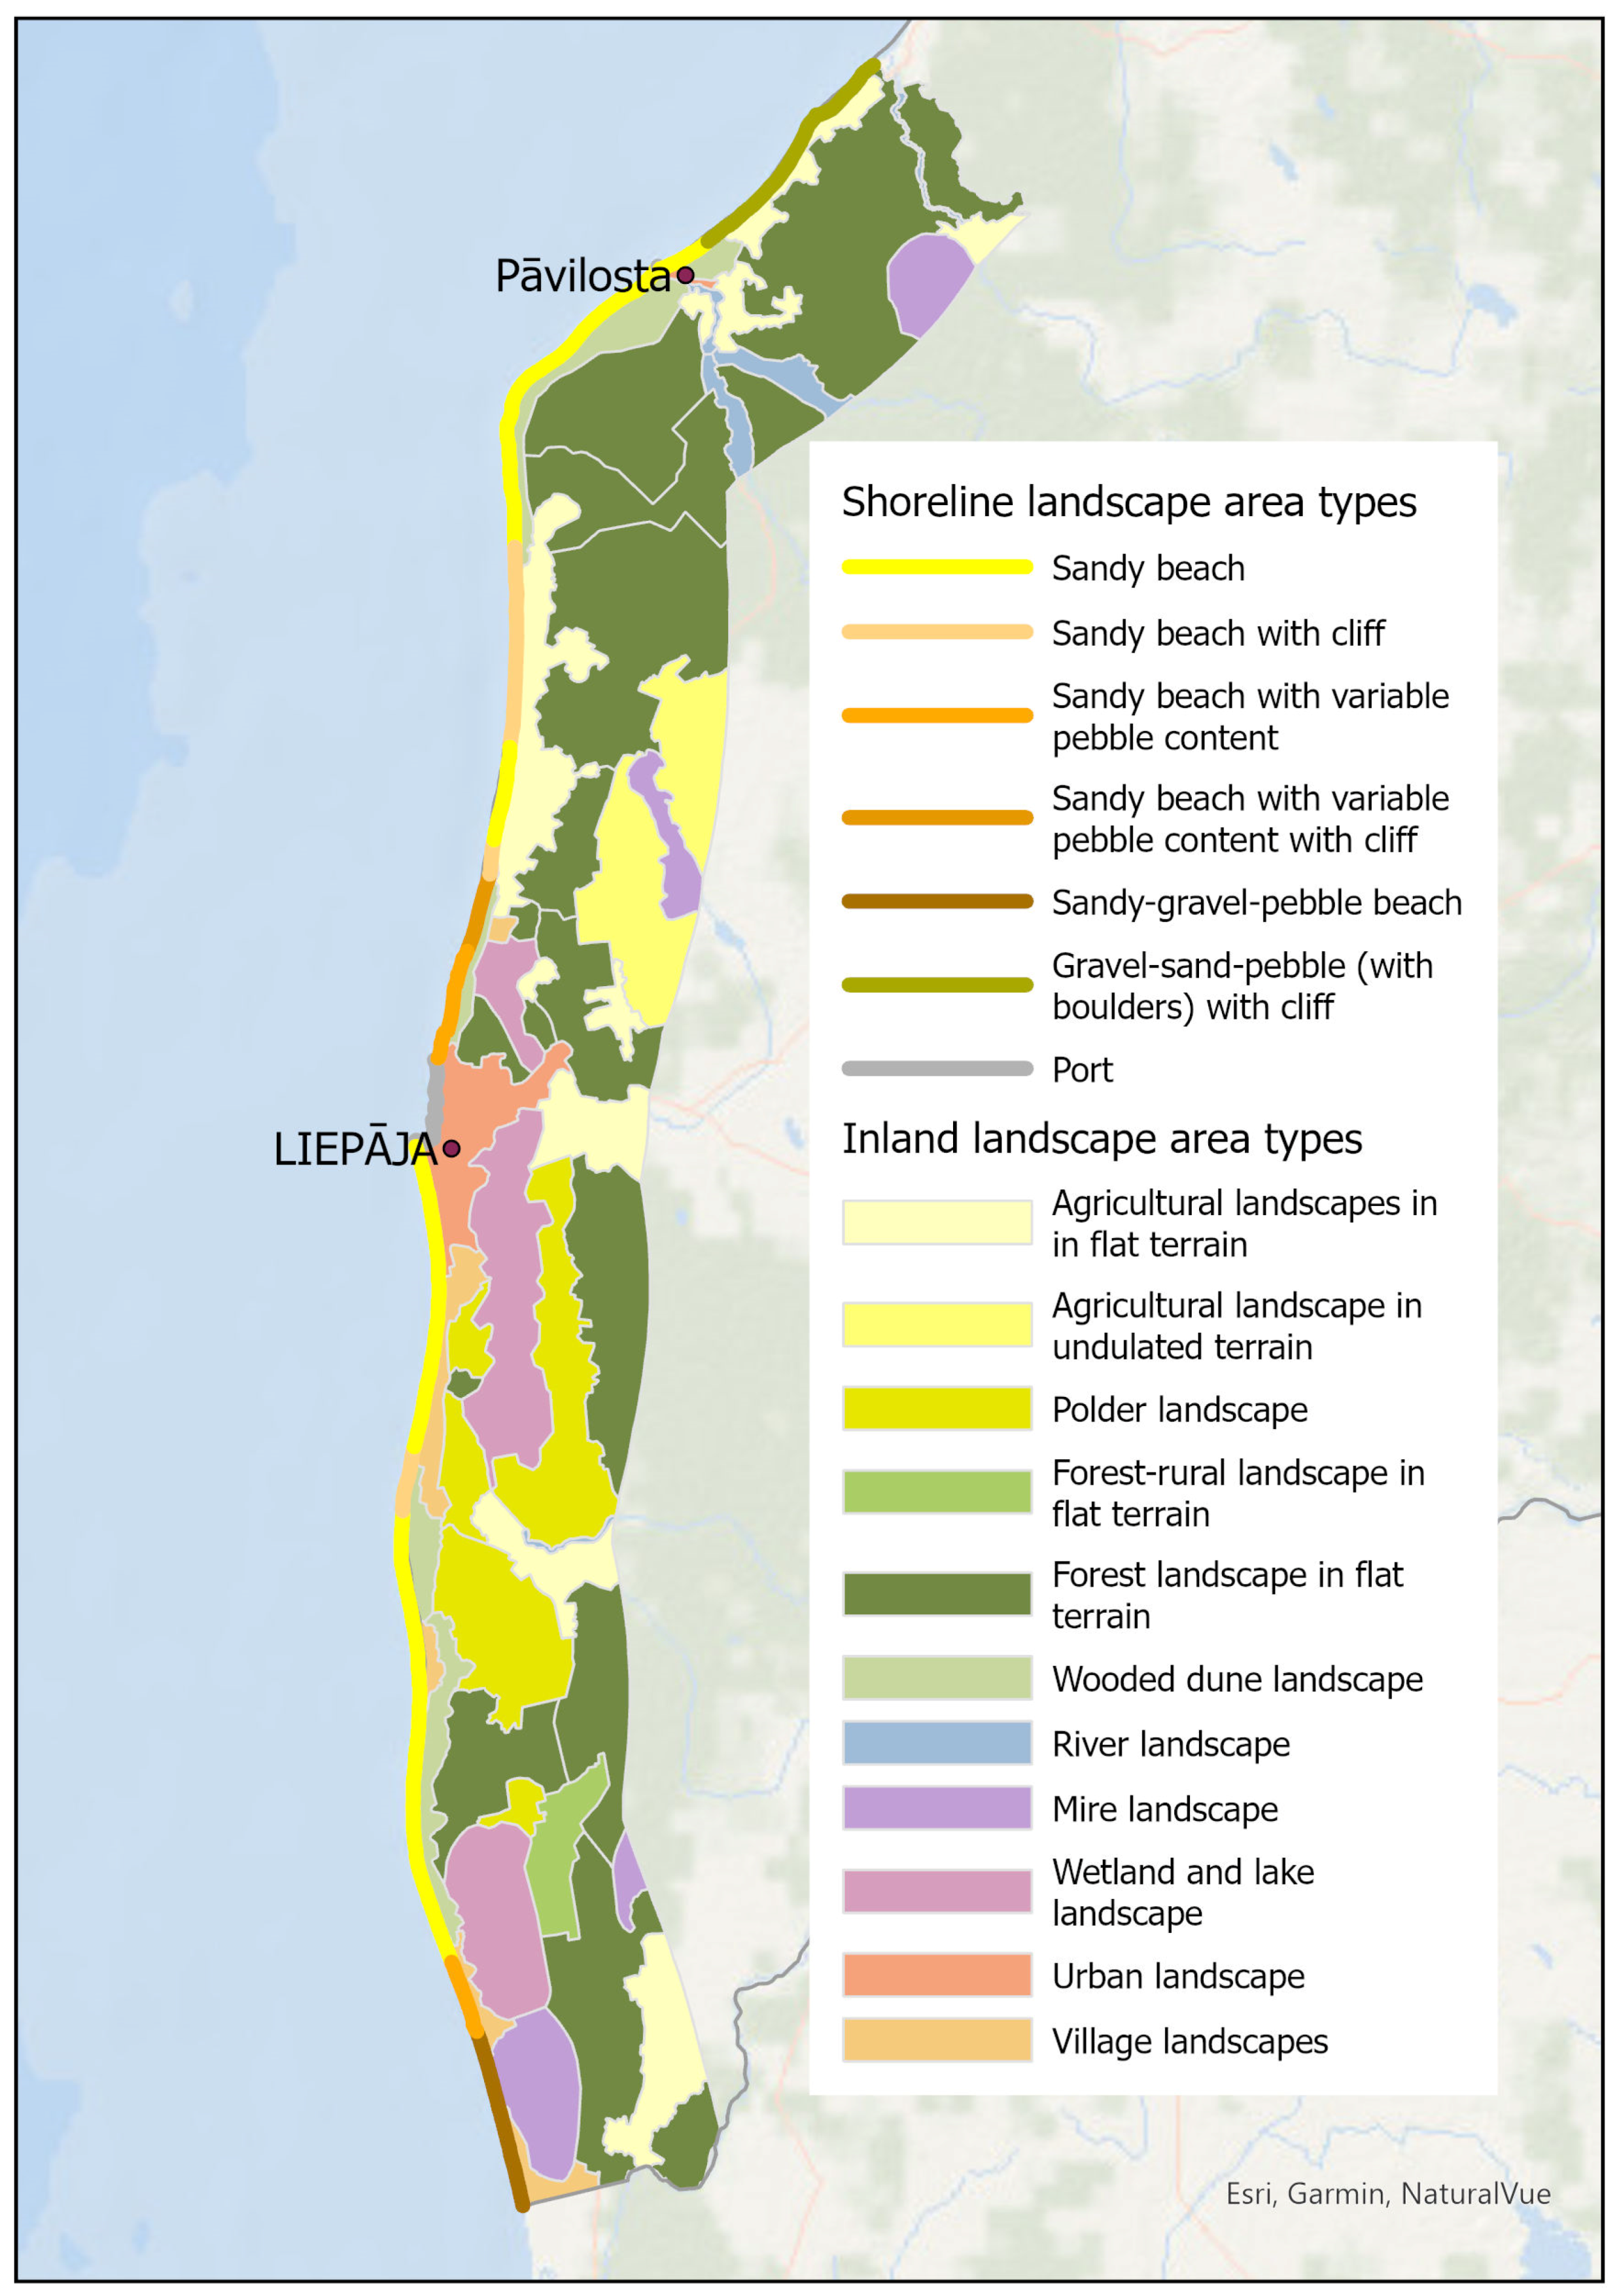
For landscape characterization, we have delineated 17 relatively homogeneous seashore landscape areas and 55 inland landscape areas in the study area. The landscape areas were classified into seven shoreline landscape types (based on seashore width; material texture—sand, gravel, pebbles; and morphology) and 11 inland landscape types (based on land-cover type, land-use and function patterns, historical development, and visual features) (Figure 3). The dominant landscape type on shore is sandy beach (covering 62% of the shoreline in the study area), followed by gravel-sand-pebble beach (with boulders) with cliff (10%), sand-gravel-pebble beach (7%) and sandy beach with cliff (6%). Other types—sandy beaches with variable pebble content with (and without) cliff as well as anthropogenic type—ports covered 5% of the shoreline each. The inland area is dominated by forest landscapes in a flat terrain (covering 44%), followed by agricultural landscapes in a flat terrain (12%), polder landscape (10%), wetland and lake landscapes (9%), and agricultural landscape in an undulated terrain (6%). Other inland landscape types are formed by wooded dunes, mires, rivers, villages and urban landscapes, as well as mixed forest-rural landscapes in flat terrain, each covering 2–5%.
3.1.2. Assessment of Landscape Qualities
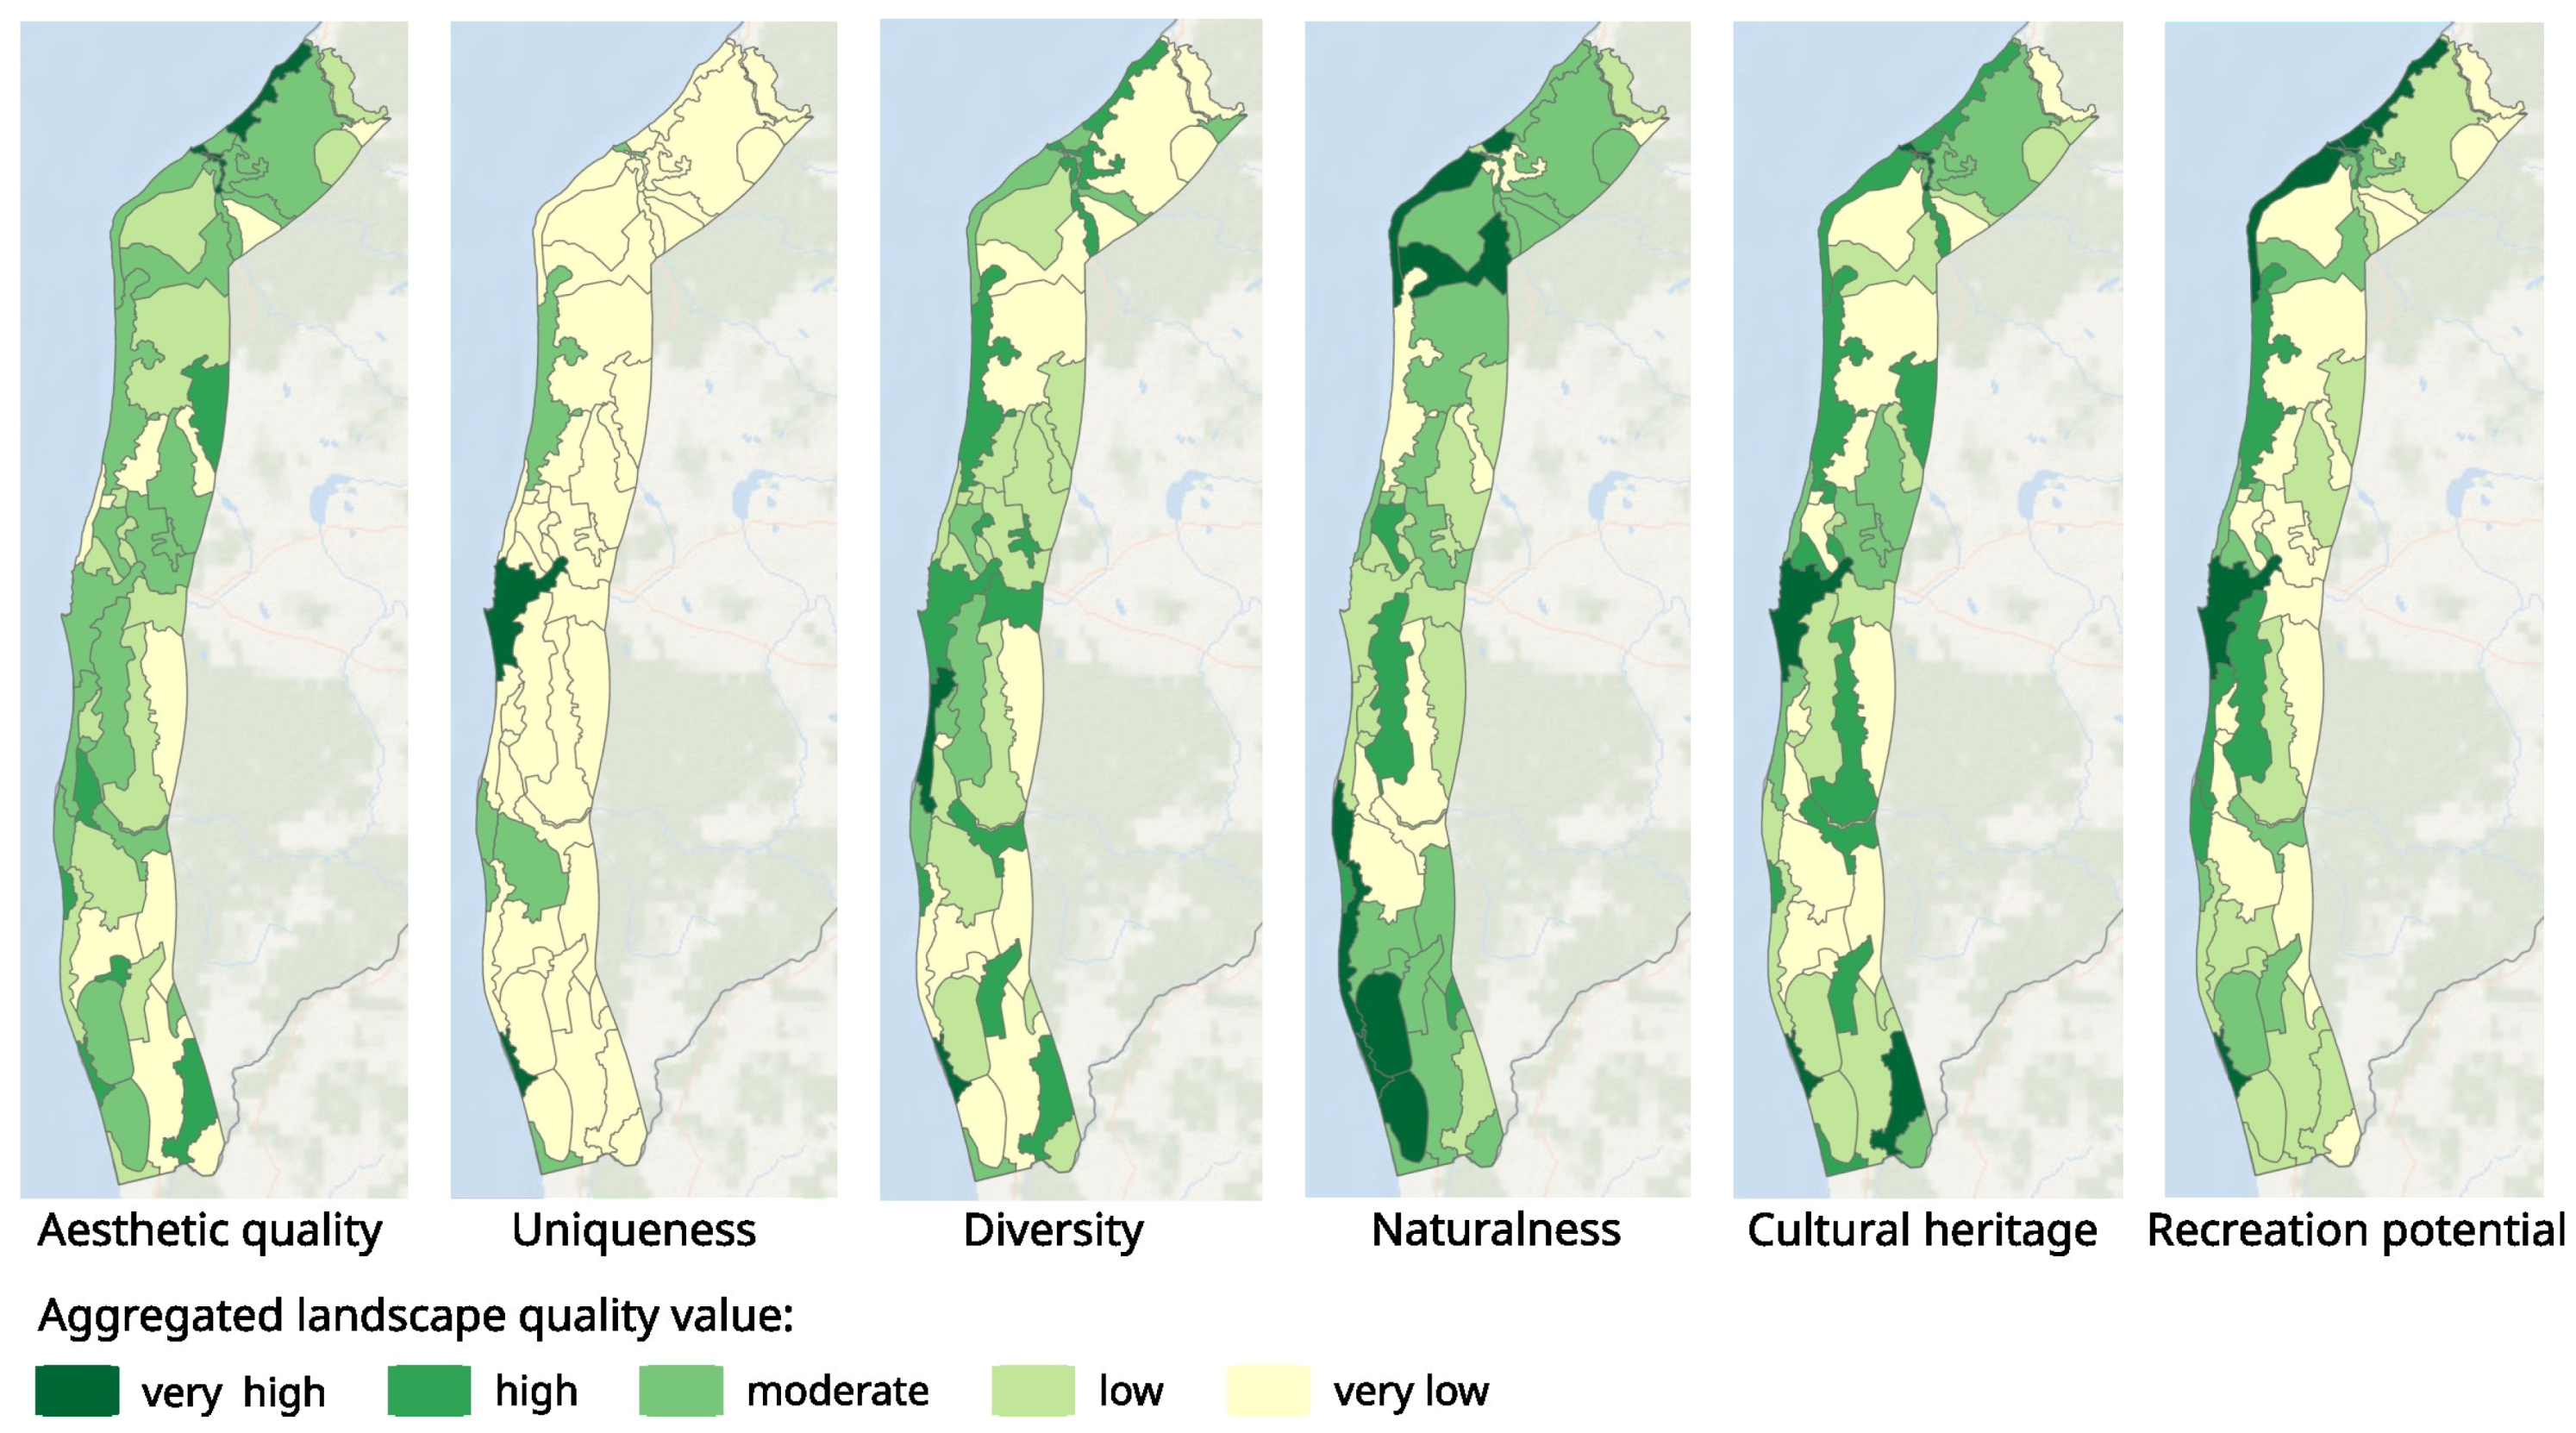
Inland landscape qualities were assessed by aggregating and normalizing the indicator value of each landscape area on the level six quality criteria (Figure 4). Landscape aesthetic quality indicators include “Openness of landscape”, “Scenic views”, “Attractive landscape elements”, “Share of scenically attractive roads” as well as “Visual pollution and degrading elements” (the last one was assessed using the reverse scale).
Thus, the highest scores mostly received open landscape types dominated by agricultural land and coastal settlements, wooded dunes, wetlands, and lakes. Uniqueness was represented only by one indicator—“Unique landscapes on a national/regional scale”, derived from the national scale survey of “Landscape treasures”2, highlighting an urban landscape—Liepaja city, one village landscape, as well as a few areas representing outstanding agricultural landscape features. Landscape diversity scores were calculated based on the diversity of land use types, small-scale landscape elements, and settlement structure. Accordingly, the highest value again was received by agricultural lands and coastal settlements, mixed forest-rural landscapes, and river valleys. The landscape naturalness was assessed by the “Presence of natural microrelief”, “Naturalness of water streams and rivers”, “Share of semi-natural habitats” and “Protected areas”, as well as the “Presence of industrial objects” (the last one was assessed using the reverse scale). Accordingly, the highest values were received by wooded dunes, wetlands and lakes, and few forest landscape areas. The cultural heritage value was assessed by the number and diversity of “cultural history monuments”, “Presence of historical spatial structures” (like traditional landscapes and historic roads) and “Visually outstanding cultural history objects”. The highest values were received by landscape areas with coastal villages and Liepaja City, as well as a few agricultural landscape areas. The recreational potential was assessed by “Density of tourism attractions”, “Accommodation possibilities”, “Presence of nature parks, national parks and nature monuments”, “Diversity of tourism infrastructure”, “Cycling Routes” as well as “Accessibility”. The highest scores were received by the majority of the landscape areas next to the shoreline, as well as the ones including water bodies with recreational facilities.
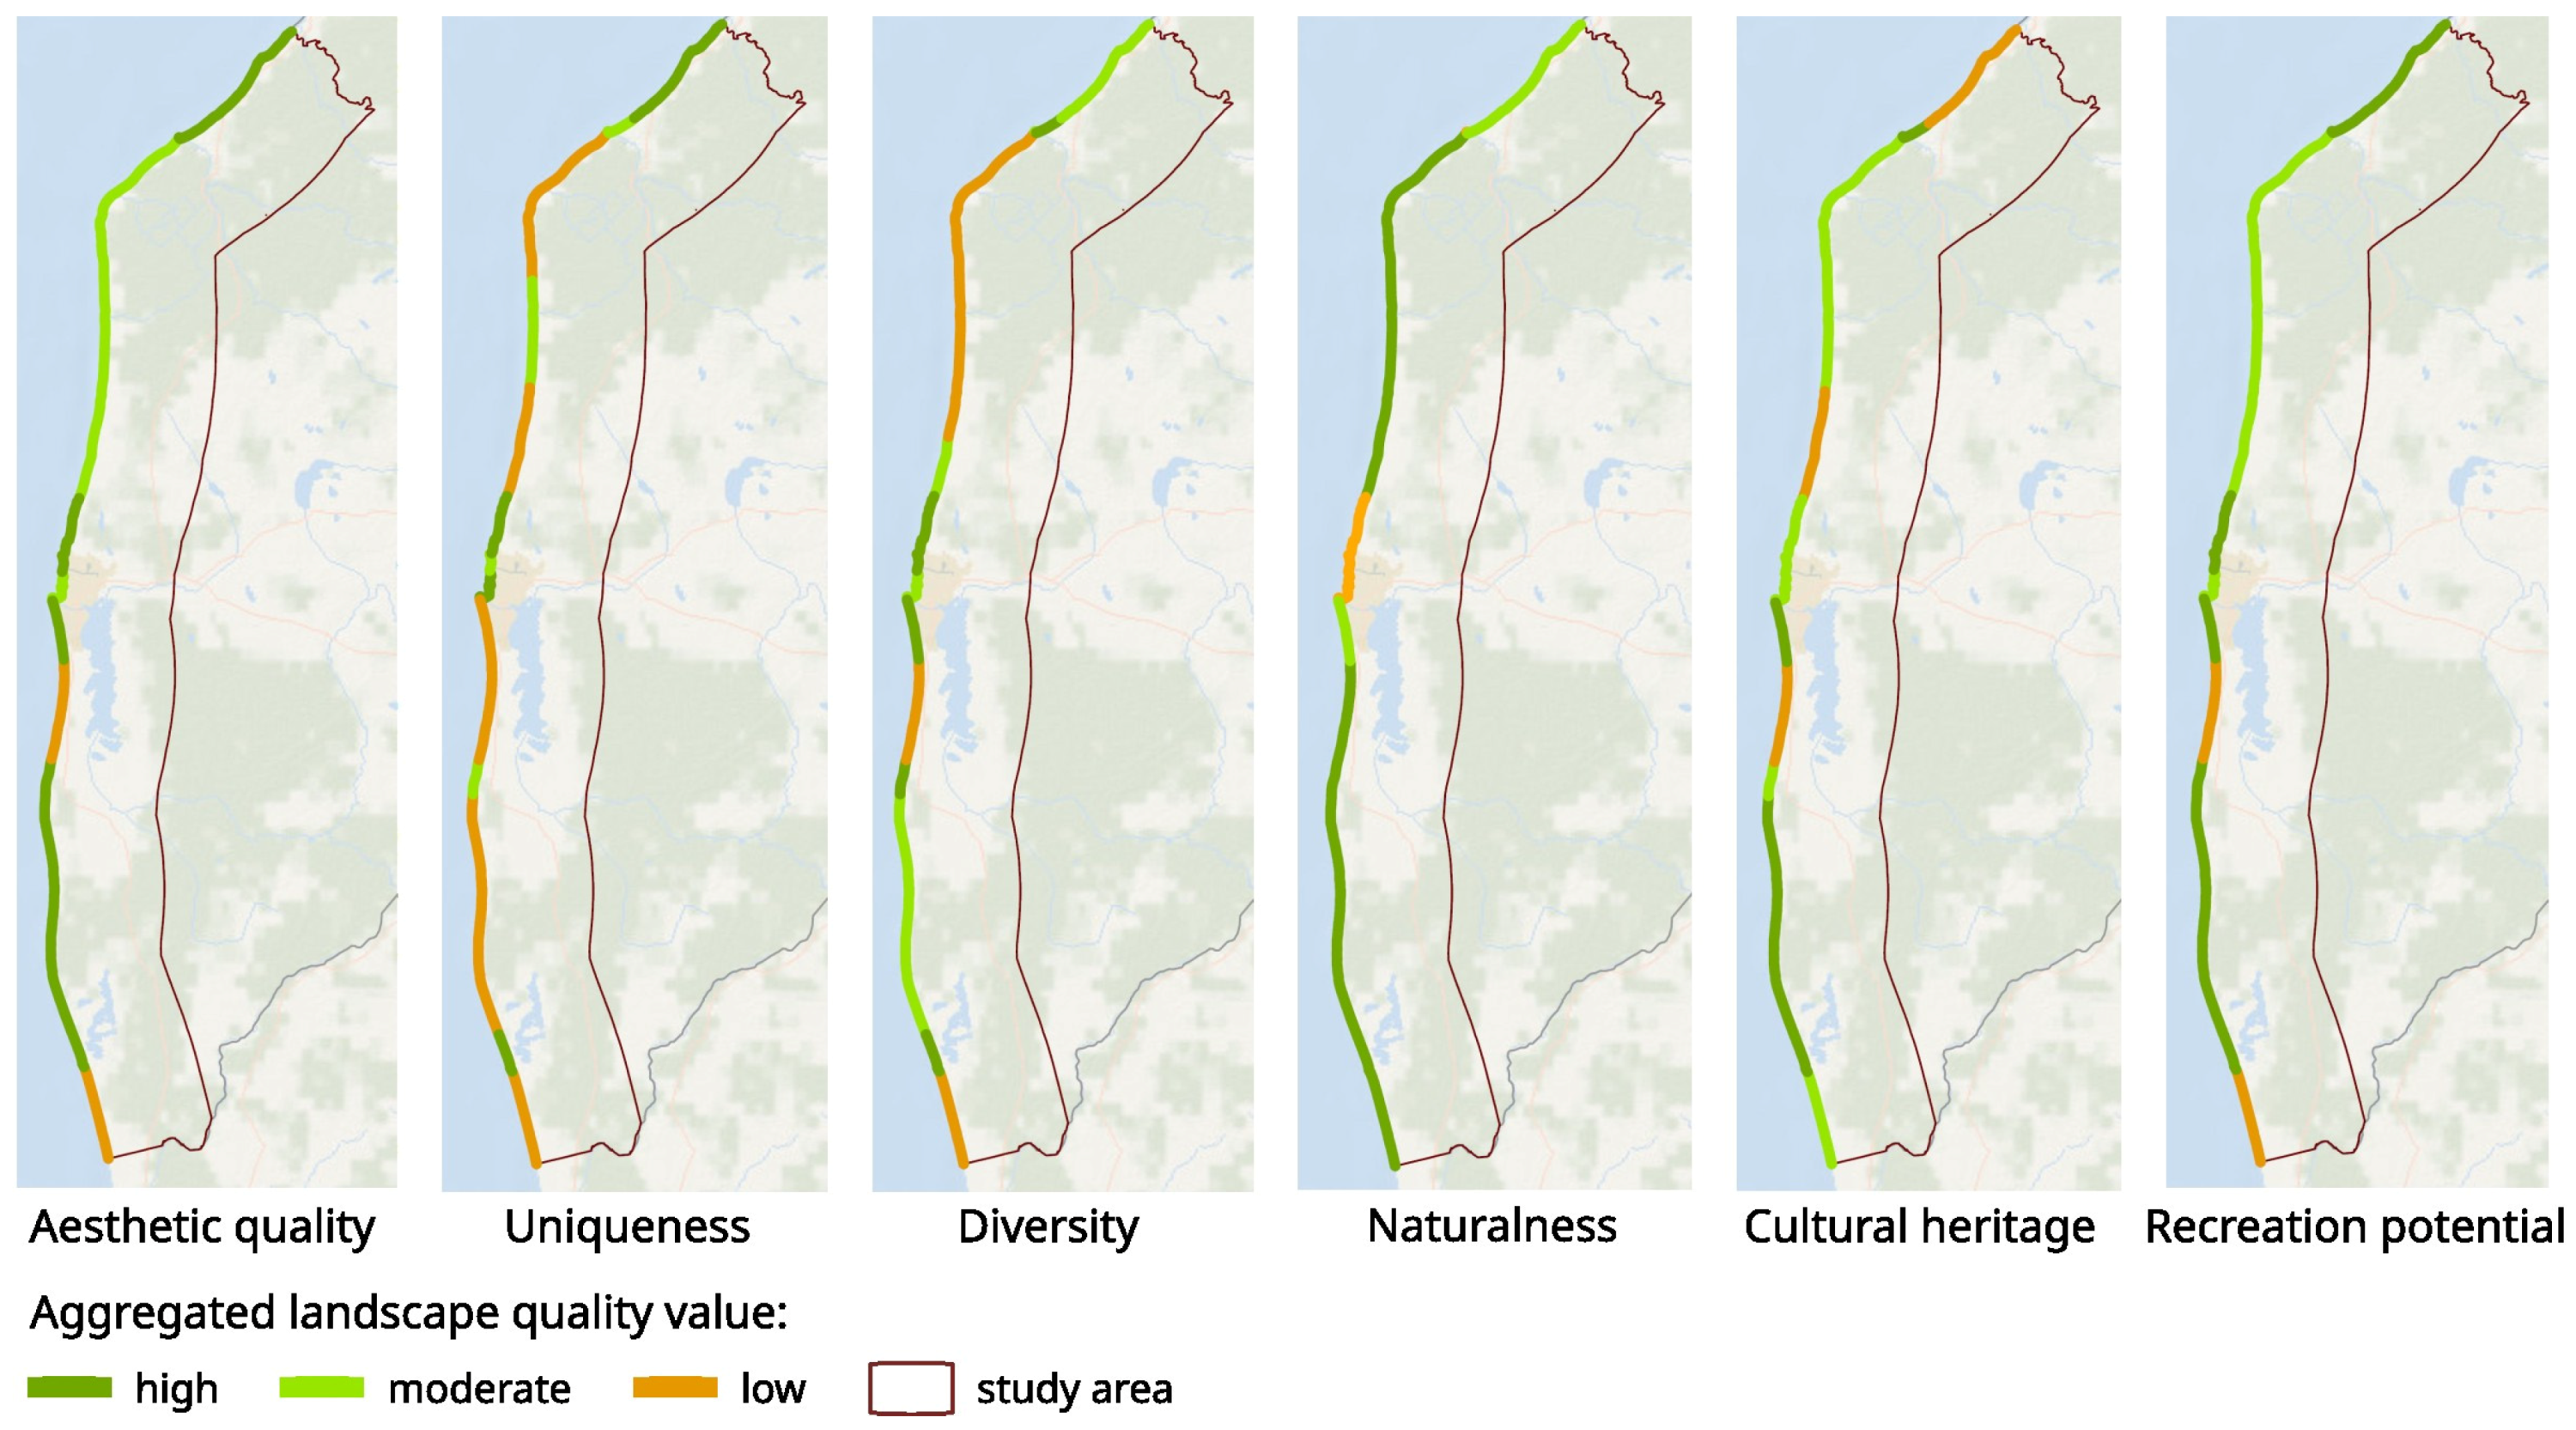
Shoreline landscape qualities (Figure 5) were assessed using the same criteria, while the indicators were partly adjusted to shoreline specifics. For aesthetic quality assessment on shore, we used only “Scenic views”, “Attractive landscape elements” and “Visual pollution and degrading elements”.
Over half of the shoreline was assessed to have high aesthetic value, capturing coastal stretches with cliffs and the stretches next to populated areas. The uniqueness value was highest in the shoreline stretches with cliffs near Liepaja city and a traditional fishermen village near Pape. The shoreline diversity was assessed using its character (bays, capes, etc.) and exposure, as well as small-scale landscape elements (e.g., lighthouses, piers, ships, boats, rocks, fallen/washed-out trees, etc.), also resulting in the highest scores in stretches next to populated areas. Naturalness included two indicators—“Share of natural shoreline stretches” and “Share of protected areas”, revealing that most of the shoreline can be considered natural. Cultural heritage was assessed by indicators “Number of cultural history monuments”, “Presence of traditional land/sea use practices” (e.g., fishing) and “Visually outstanding cultural history objects”, again revealing higher values next to populated areas. Recreation potential (assessed by “Density of tourism attractions/objects”, “Diversity of tourism infrastructure”, “Accessibility” and “Number of visitors”) was also higher in populated areas but more related to the distribution of aesthetic qualities.
3.1.3. Statistical Analysis of Landscape Quality Trade-Offs
The relationships between shoreline landscape quality indicators were explored through the construction of a correlation matrix (Table 2), providing insights into the strength and direction of the associations among certain landscape quality indicators. Strong positive correlations (r > 0.5) were observed between variables “Uniqueness of landscape” (UN_unique) and “Attractive landscape elements” (LAQ_Attr.el) (r = 0.63, p < 0.01), between “Attractive landscape elements” and “Shoreline diversity” (LD_shorline) (r = 0.76, p < 0.001), presence of “Small landscape elements“ (LD_small.el) (r = 0.89, p < 0.001), and “Visually outstanding cultural history objects” (CH_outst.ob.) (r = 0.58, p < 0.05), between “Small landscape elements” and “Visually outstanding cultural history objects” (r = 0.62, p < 0.01), between “Shoreline naturalness” (LN_shoreline) and “Share of protected areas” (LN_prot.area) (r = 0.57, p < 0.05), between presence of “Number of cultural history monuments” (CH_No.mon.) and “Presence of traditional land/sea use practices” (CH_trad.use) (r = 0.58, p < 0.05). Also, positive correlations were observed among all tourism-related landscape quality indicators. Strong negative correlations (r < −0.5) were observed among “Shoreline naturalness” and the presence of “Attractive landscape elements” (r = −0.70, p < 0.005), “Shoreline diversity” (r = −0.57, p < 0.05) and “Visually outstanding cultural history objects” (r = 0.75, p < 0.001). Possible multicollinearity (r value as close to 1) could be observed among such variables as “Diversity of tourism infrastructure” and “Density of tourism attractions/objects” and between “Attractive landscape elements” and “Small landscape elements”.
Through the creation of a correlation matrix, the relationships between inland landscape quality indicators were investigated, offering insights into the direction and intensity of linkages among certain landscape quality indices. Strong positive correlations (r > 0.5) were observed between more than 40 pairs of variables (Table 3). Variable “Small landscape elements“ (LD_small.el) composed seven pairs of strong correlation with variables mostly from recreational landscape qualities (i.e., “RP_accom” (r = 0.79, p < 0.001) and “Accessibility” (RP_access) (r = 0.65, p < 0.001), as well as landscape qualities associated with cultural heritage (i.e., “Presence of historical spatial structures” (CH_sp.str) (r = 0.71, p < 0.001)). Variables associated with recreational landscape qualities displayed a strong correlation among themselves (i.e., “Accessibility” (RP_access) and “Diversity of tourism objects” (RP_div.tour.ob) (r = 0.86, p < 0.001)) and among landscape qualities associated with cultural heritage, for instance variable “Visually outstanding cultural history objects” (CH_outst.ob.) showed strong correlation with variables “Accommodation” (r = 0.58, p < 0.001), “Diversity of tourism object” (r = 0.64, p < 0.001), “Cycling routes” (RP_cycling) (r = 63, p < 0.001) and “Accessibility” (r = 0.62, p < 0.001). Variable “Scenic views” had strong positive relations with indicators from all landscape quality groups—“Attractive landscape elements” (r = 0.75, p < 0.001), “Small landscape elements“ (r = 0.54, p < 0.001), “Scenic views” and “Presence of natural microrelief” (LN_mikro.rel) (r = 0.58, p < 0.001), “Presence of historical spatial structures” (r = 0.65, p < 0.05) and “Diversity of tourism objects” (r = 0.57, p < 0.001). There was revealed only one strong negative correlation between “Visual pollution and degrading elements” (LAQ_vis.pol) and “Presence of historical spatial structures” (r = −0.63, p < 0.001). Possible multicollinearity was observed between “Diversity of tourism objects” and “Accessibility”.
3.2. Assessment of the Perceived Well-Being Benefits Provided by Southwestern Kurzeme COASTAL Area
We focused our analysis of the nationwide survey responses on two key aspects: (i) the main perceived well-being benefits provided by the Southwestern Kurzeme coastal area in general and (ii) the distinction between regional and national perspectives (locals vs. visitors) on the values of well-being benefits.
Well-being benefits were divided into seven broad dimensions: safety and sense of security; financial/material security; leisure; health and life satisfaction; social relations; education; and ecological contentment.
3.2.1. Perceived Well-Being Benefits from Coastal Ecosystems
In the survey, respondents were asked to rate several statements (Table 4, column “Statement included in the survey”) related to perceived well-being benefits provided by the Southwestern Kurzeme coastal area on a scale from 1 to 4 where: 1—completely disagree, 2—partially disagree, 3—partially agree, 4—completely agree. To accommodate situations where participants may not have a well-formed opinion on the statement, an additional response option, “I don’t know” was included in the potential response list. However, these responses were not included in the analysis of perceived well-being benefits. As a result, some of the statements have varying numbers of responses.
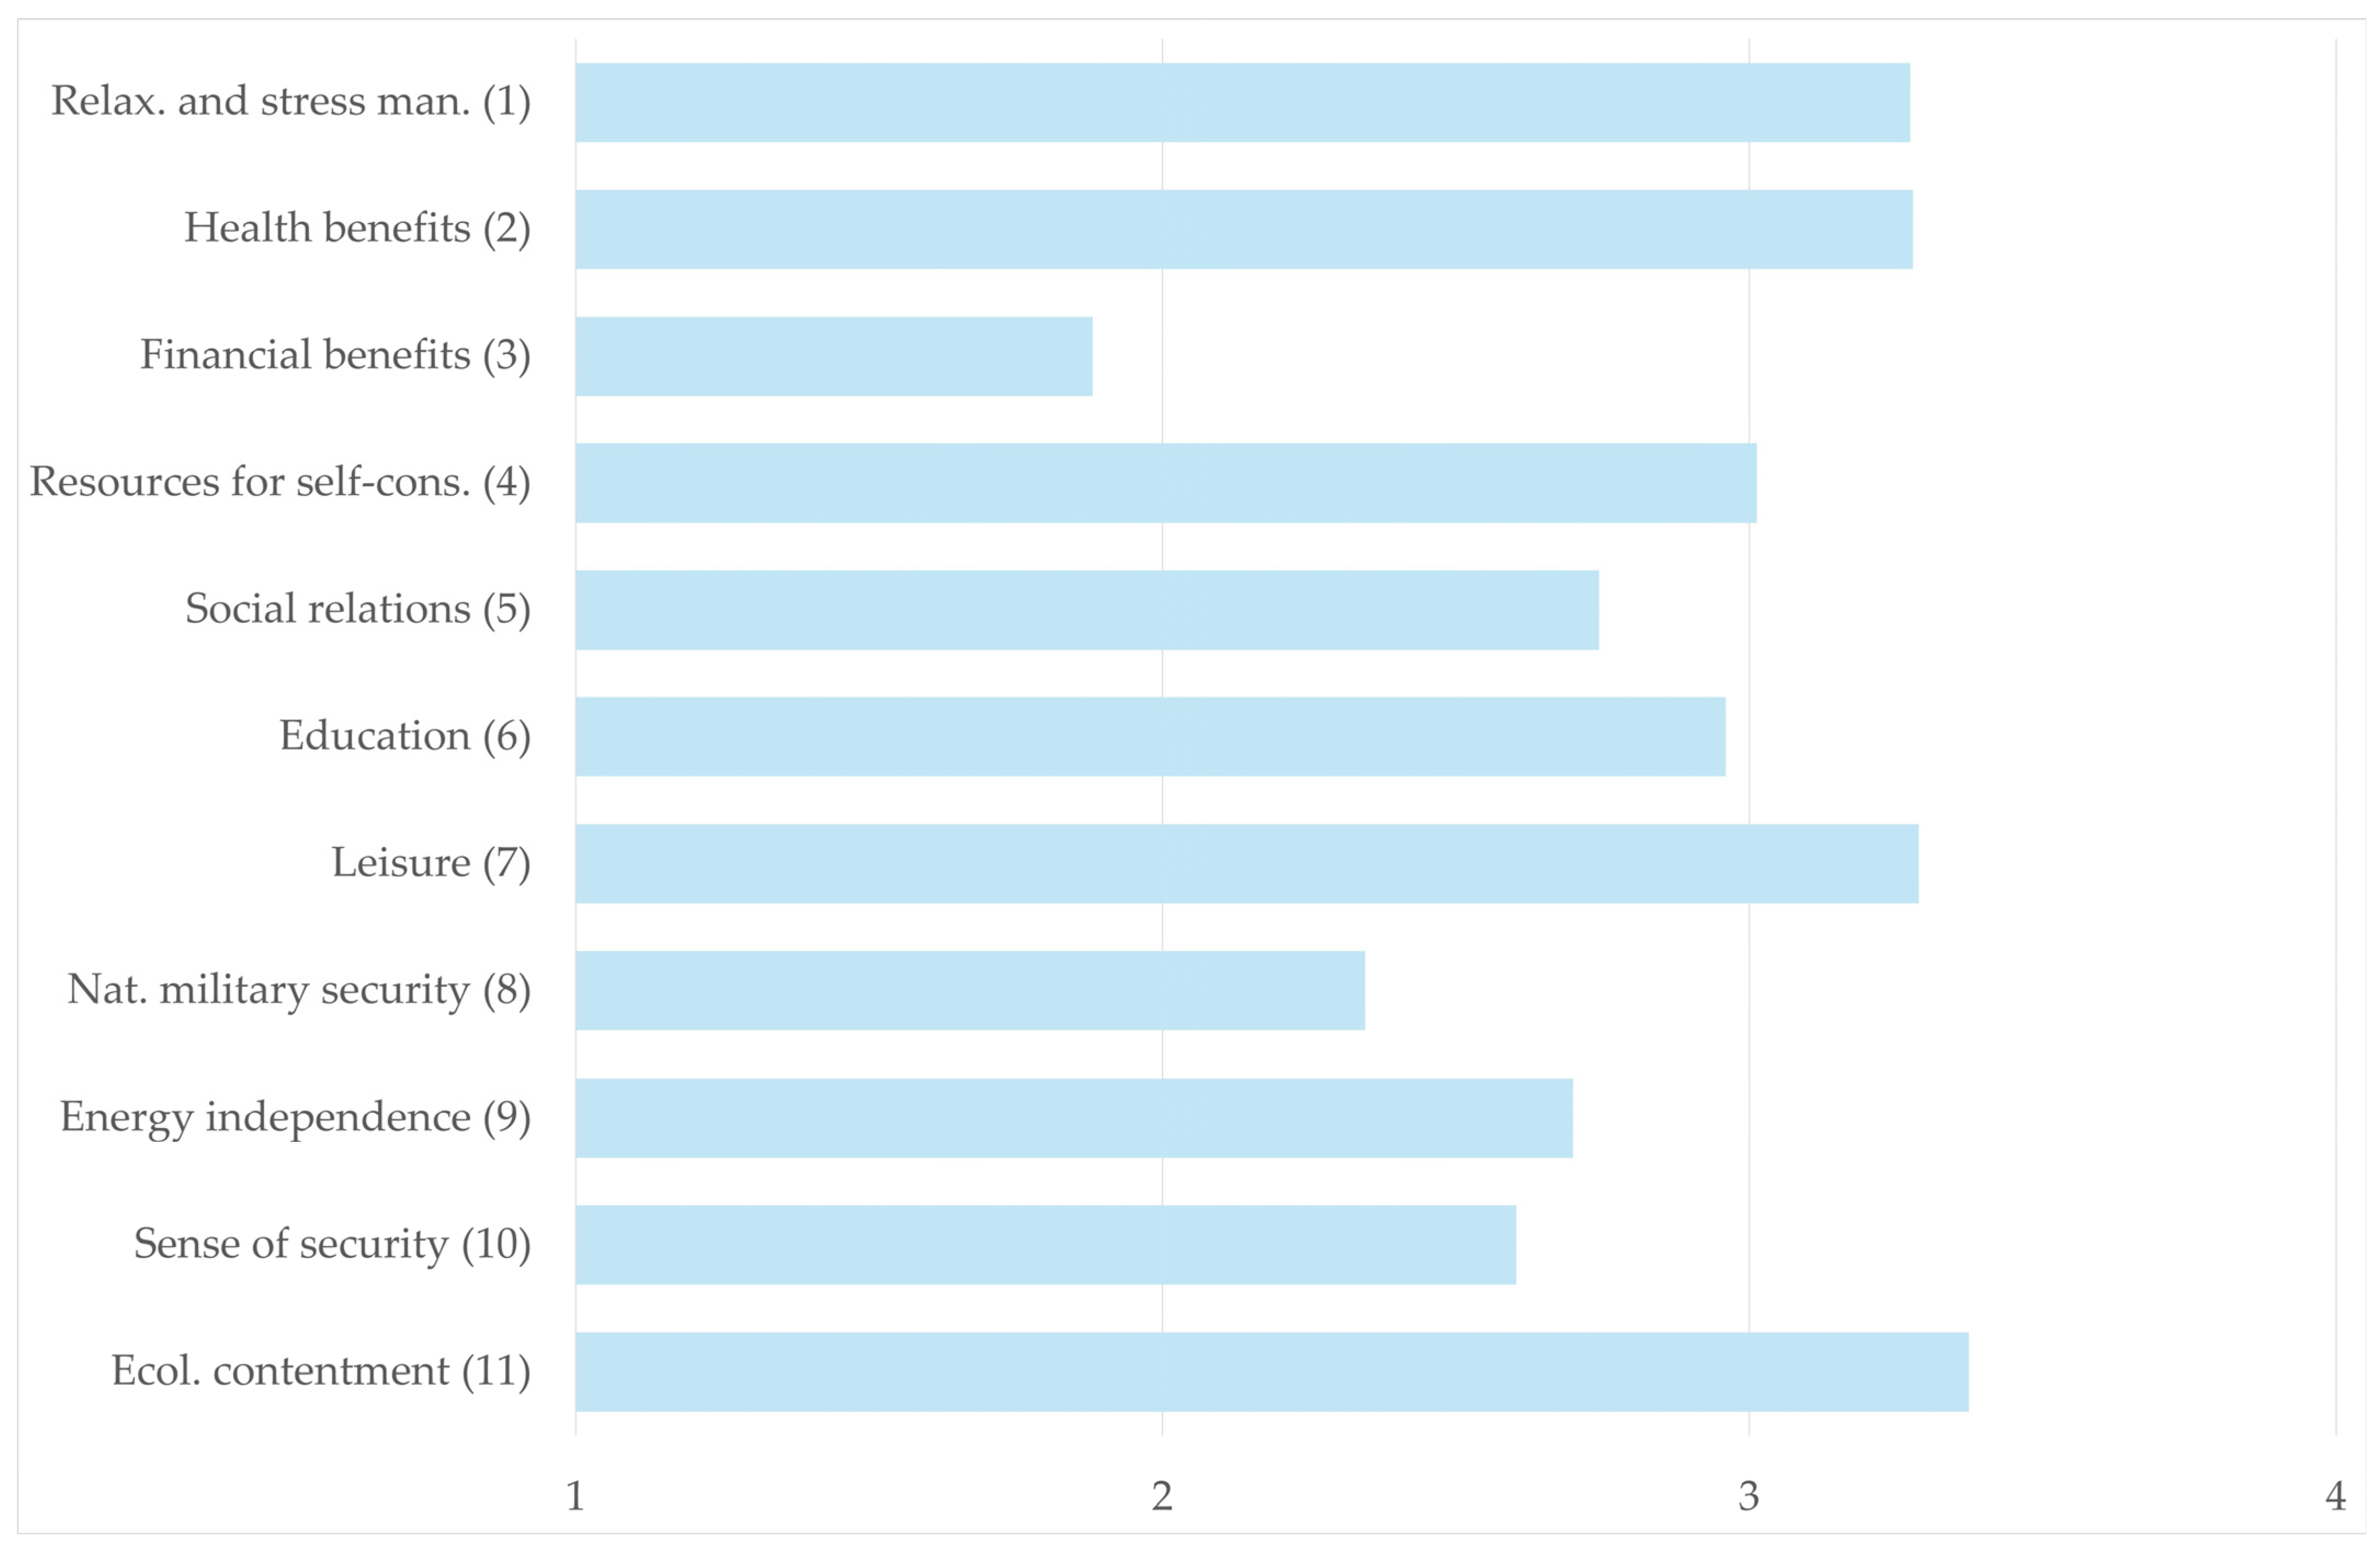
According to the survey results, in general people in Latvia value ecological contentment the highest, which refers to the joy derived from the awareness of the diverse ecosystems on the Southwestern Kurzeme coastal area and their protection, followed by perceived leisure and health benefits (Figure 6). The lowest rates were allocated to perceived financial benefits and safety and security.
3.2.2. Perceptions of Inhabitants versus Visitors (Regional versus National Benefits)
The survey results elucidated significant differences between the valuation of perceived well-being benefits between respondents who indicated they live in the study area (locals) and the respondents who only visit the area. The locals value all perceived well-being benefits provided by the Southwestern Kurzeme coastal area more than visitors. The statistical analysis (Table 4) indicates that the differences are statistically significant (p < 0.005) for all well-being dimensions included in the survey, except energy independence and national military security (however, both are still rated slightly higher by the locals).
Leading preferences in both groups were similar. Both allocated the highest rates to nature diversity and protection, which is linked to the well-being dimension of ecological contentment. It was closely followed by perceived health and recreational benefits. The highest differences between groups were linked to resources for self-consumption and social relations that were valued significantly higher by local inhabitants.
3.2.3. Necessity for Amenities for Coastal Recreation
Another objective of the survey was to illuminate the preferences of Latvian residents concerning coastal recreation sites, with a particular focus on pinpointing the factors that influence the choice of coastal recreation sites and determining preferences for beach types, distinguishing between natural beaches and those equipped with amenities. In the context of this study, the term “natural beach” refers to shoreline stretches that are largely unaltered by human interventions and are characterized by more natural settings—minimal to no human-built structures, natural landscapes, relatively natural and undisturbed ecosystems. The term “beaches with amenities” is used for such stretches where natural beaches have been significantly modified by human-made elements to cater to the needs and comfort of visitors—e.g., cafes, changing rooms, children’s playgrounds, benches, recreational equipment rentals.
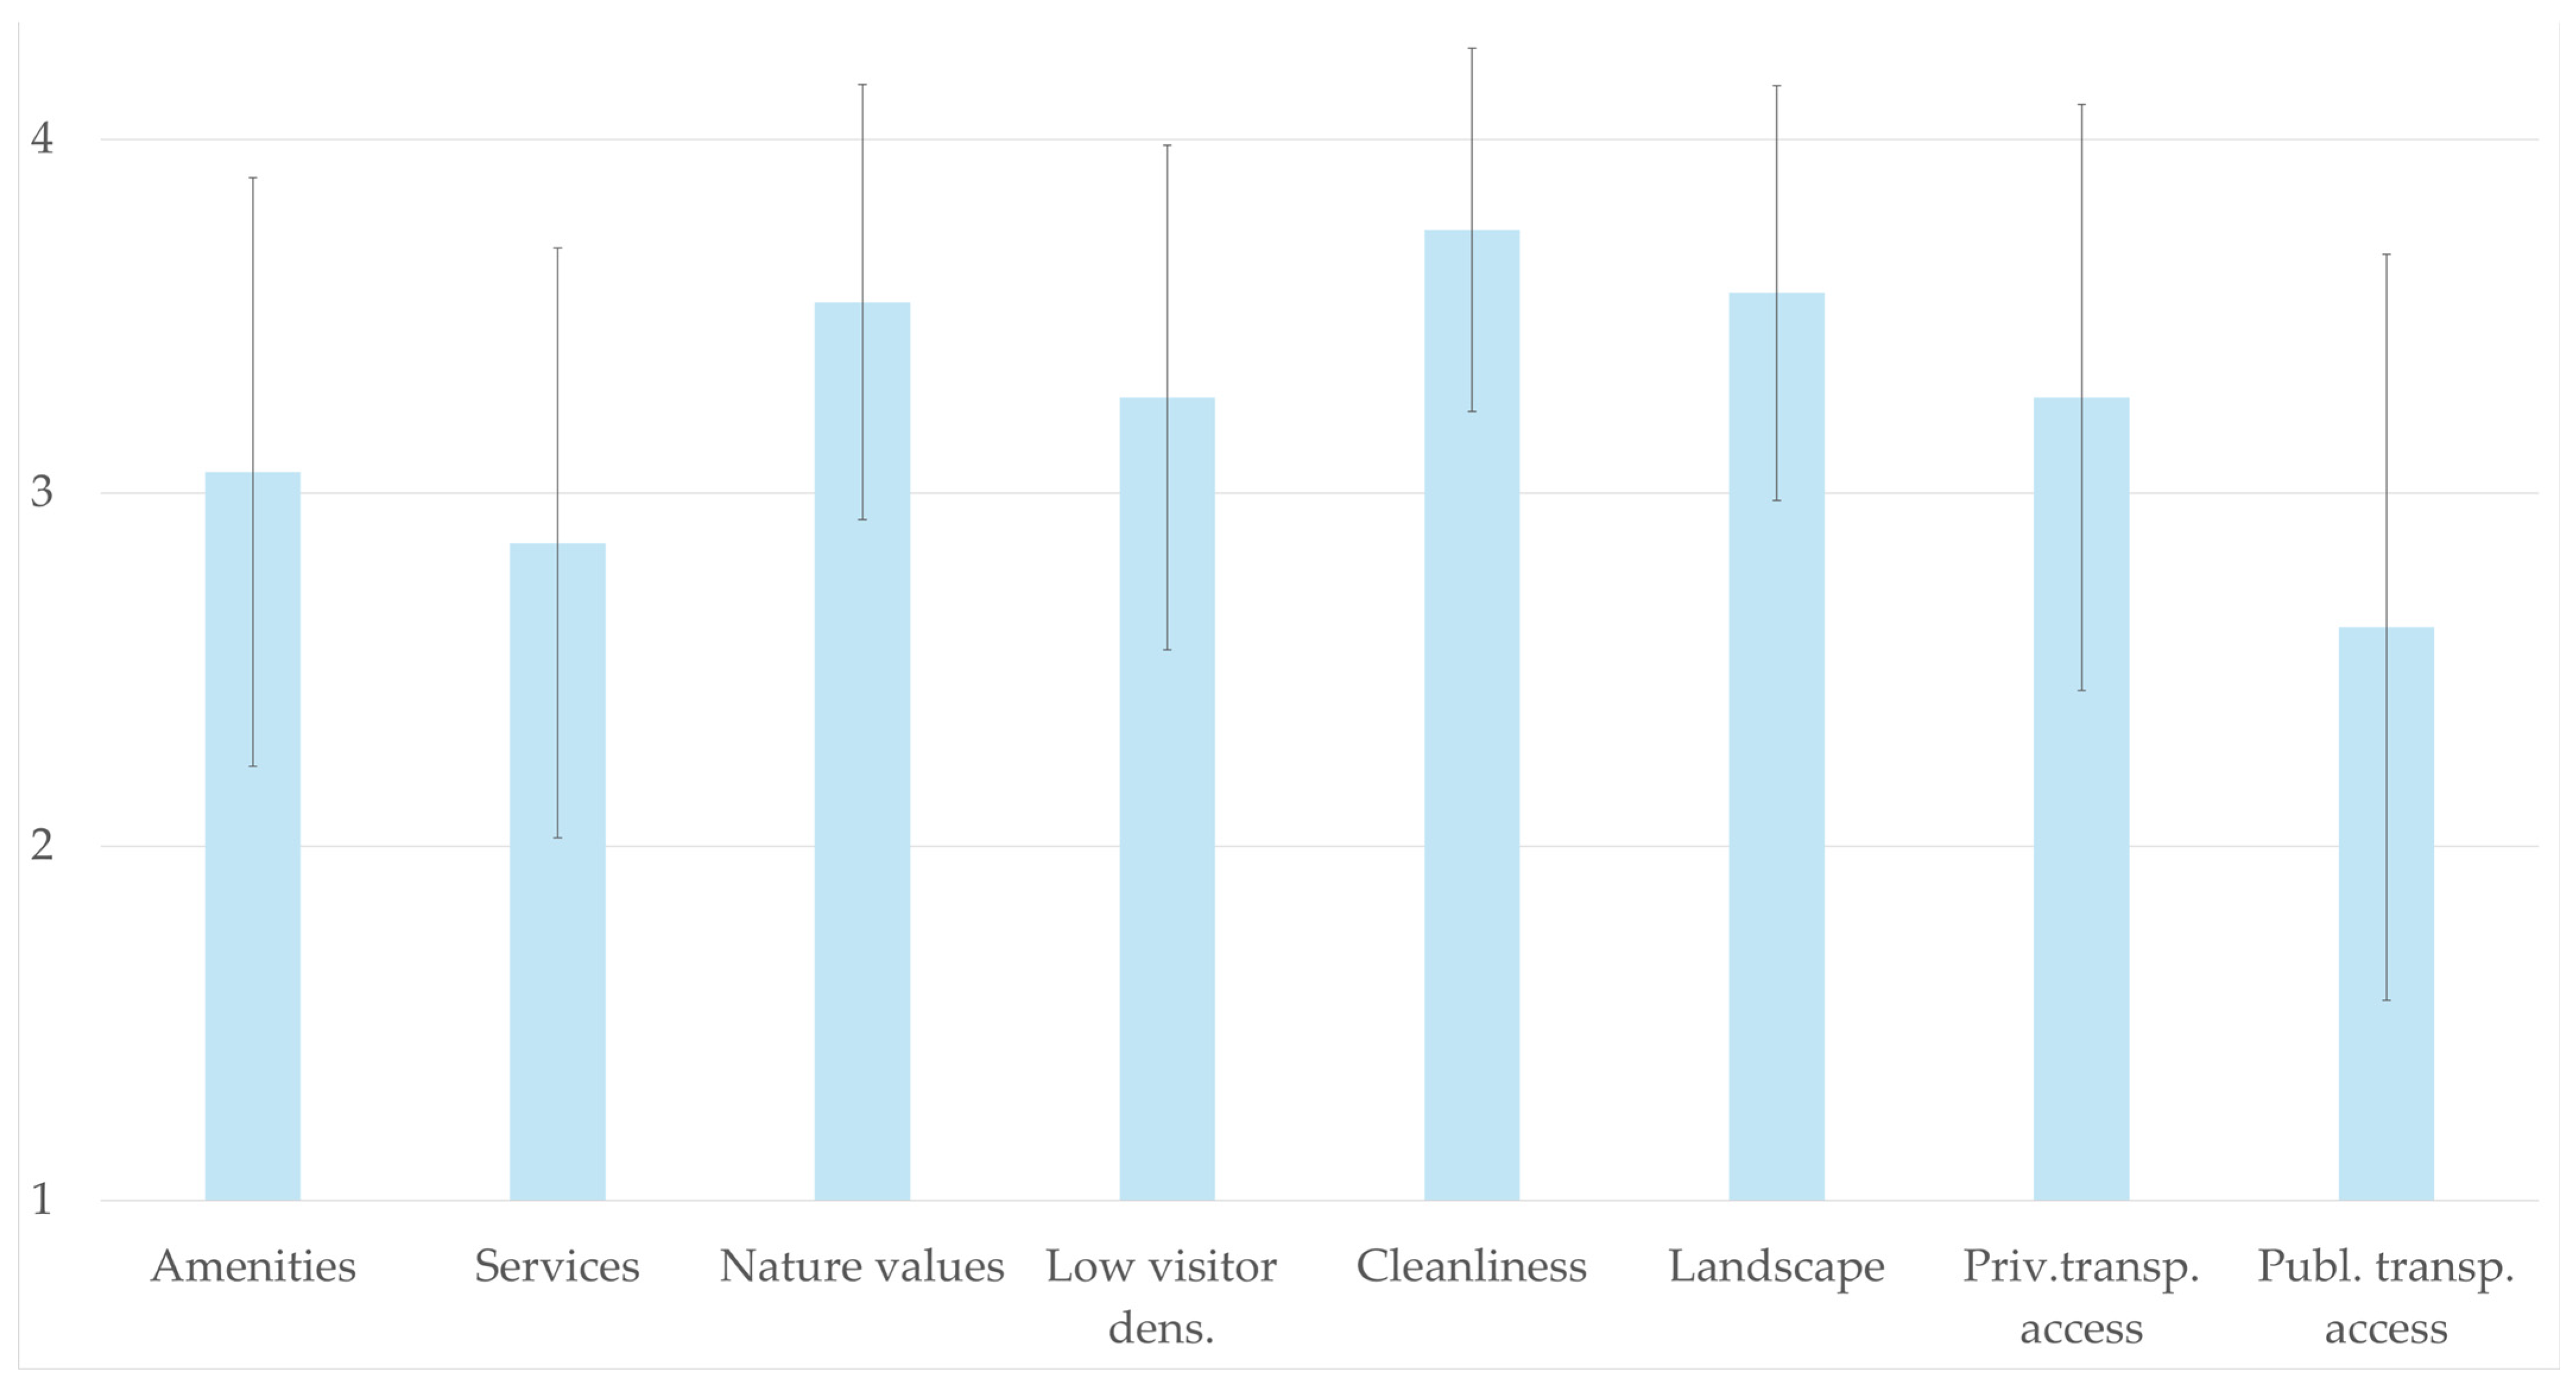
Based on the results of the survey, approximately 64% express a preference for beaches characterized by more natural features, while 36% favor beaches equipped with amenities for recreational purposes. The assumption that Latvian residents prefer the natural coast is further substantiated by the importance ratings assigned to factors influencing the selection of coastal recreation sites in the survey results (Figure 7). The highest importance was associated with the cleanliness of the site, followed by the attractiveness of the landscapes and natural diversity. The availability of amenities and services and public transport received the lowest rates.
3.3. Proposals for Coastal Tourism Development
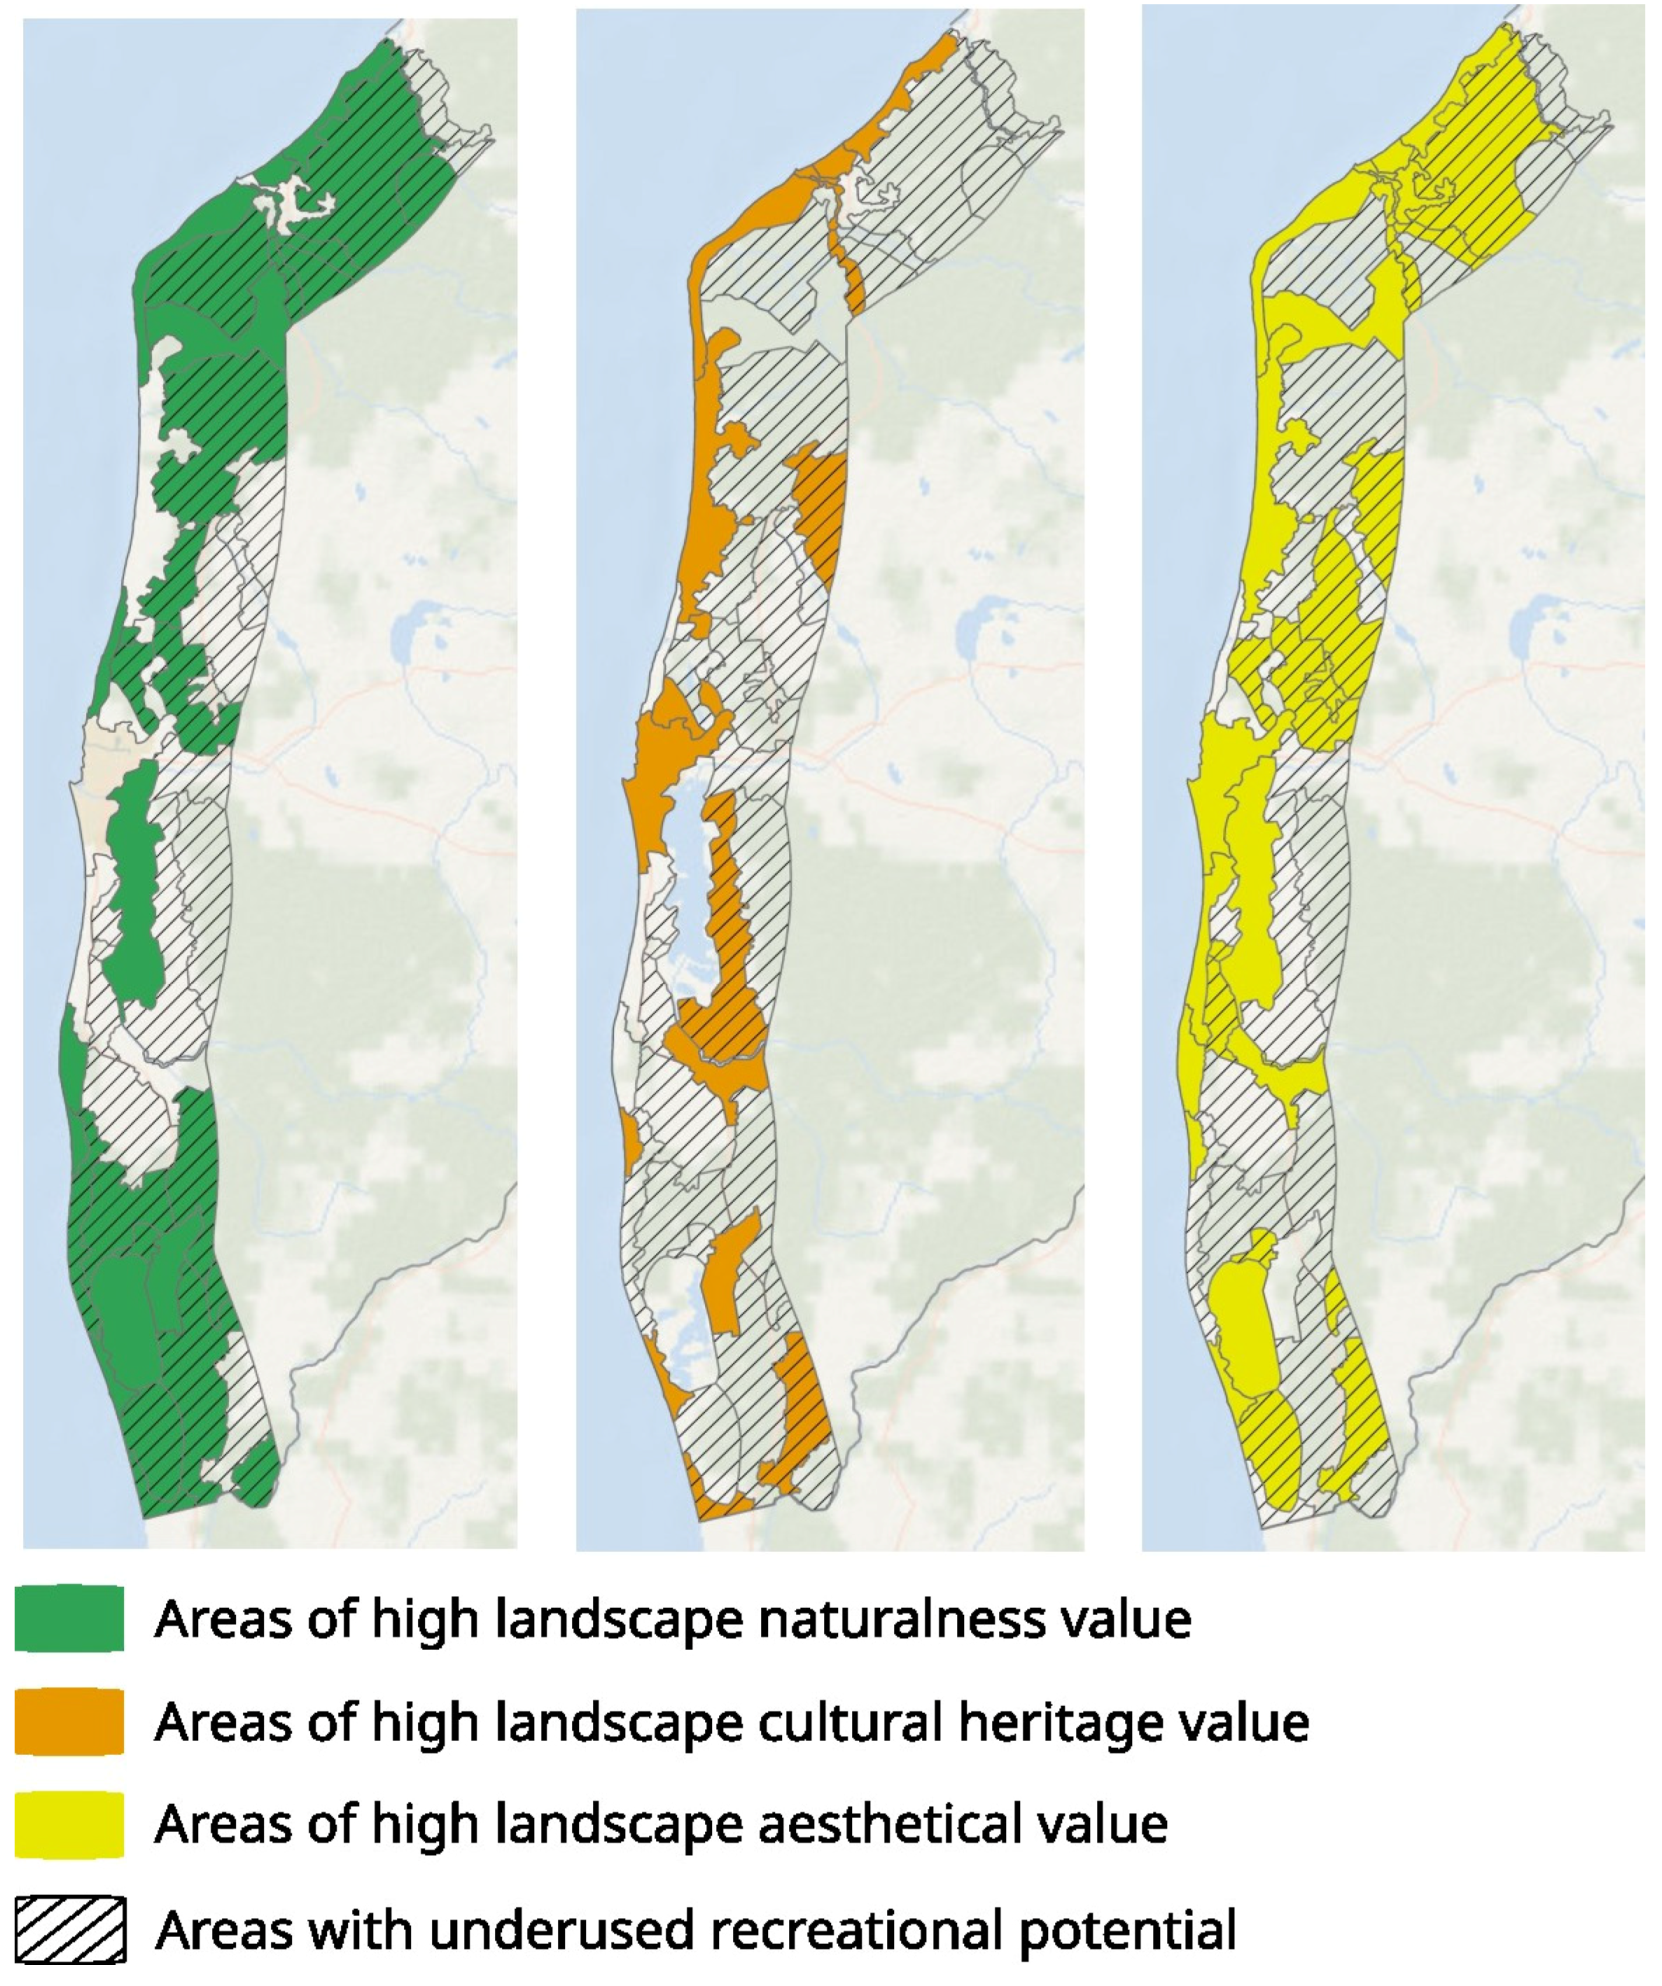
The solutions for sustainable tourism development in the Southwestern Kurzeme coastal area were constructed based on the results of landscape quality assessment and the evaluation of current tourism and recreational potential in each landscape area. We identified 31 landscape areas with high naturalness value, 24 landscape areas with high cultural heritage value, and 30 landscape areas with high aesthetic value (Figure 8).
For the creation of the solutions, data from the PGIS exercise were analyzed to draw attention to favored places and their features. In total, the PGIS survey identified 82 points of tourism and recreational interest. The results highlight the multifunctionality of the coast, with 80 of the surveyed points being associated with the potential to perform several socio-cultural activities. The predominant functions were landscape appreciation, followed by hiking and walking and relaxation by the sea (Table 5).
The proposed solutions are based on the premise that tourism development should not only focus on the economic interests of the tourism industry but also respect nature values, landscapes, place identity, and cultural heritage of the area—factors that have provided the resources for tourism development potential. In addition, the proposed tourism development solutions for the Southwestern Kurzeme coastal area would facilitate and ensure that the increased tourism intensity does not harm (and even improve) the well-being of the local communities, as it aims at highlighting and preserving the values that are important to them.
The proposition for the direction of tourism development was constructed for each identified cluster of landscape values (Table 6). In the cluster of landscape areas with high naturalness values, the direction of tourism development should be linked to highlighting the naturalness of the landscape while considering that tourism development activities that conflict with the preservation of naturalness or nature conservation objectives should be avoided. In these areas, particular attention should be paid to monitoring and prevention of anthropogenic pressures. In the cluster of landscape areas with high cultural heritage values, the development of tourism should be linked to the sustainable integration of cultural heritage into the tourism offer. Appropriate management of the heritage is essential to ensure that the area’s tourism development potential is not undermined. In the cluster of landscape areas with high aesthetic values, the direction of tourism development in this cluster is related to the integration of the aesthetic value of landscapes into the tourism offer. In this cluster, the development of public infrastructure should be carried out in a way that does not conflict with the aesthetic value. Information on landscape areas with underused recreational potential serves as additional guidance for planners, identifying priority areas for infrastructure improvements, but infrastructure solutions should be designed according to the recommendations for each cluster.
4. Discussion
4.1. Landscape Character and Qualities for Enhanced Coastal CES Assessment
In our study, we use a landscape characterization approach in mapping and assessment of CES. The landscape, characterized by its fusion of biophysical and socio-cultural dimensions—provides a more comprehensive and robust understanding of CES [53]. Medeiros et al. [54] have highlighted the need for this comprehensive approach, particularly in the integration of socioeconomic, perceptual, and historical-cultural indicators. Landscape quality indicators play a crucial role in sustainable planning, as they help identify resources, qualities, and criticalities of a particular area [55]. These indicators should be flexible and universal, encompassing environmental, socio-economic, and aesthetic criteria [56].
The construction of correlation matrices of landscape quality indicators provided certain insights and valuable information for spatial planning. Strong positive correlations between certain indicators signify potential synergies that can be leveraged to design integrated spatial and development plans that address multiple indicators simultaneously, promoting holistic and efficient landscape management [57]. Strong negative correlations suggest potential trade-offs between certain indicators [58] and could guide planners when navigating the trade-offs by carefully balancing conflicting aspects and ensuring that improvements in one dimension do not come at the expense of another [59]. In our study, strong negative correlations were found among naturalness indicators and indicators associated with human use. To address this issue, we prioritized the values associated with naturalness in the planning proposals. High correlations between landscape quality indicators may suggest redundancy [60], allowing planners to allocate resources more effectively by focusing on unique aspects of landscape quality. Even though we argue that possible multicollinearity revealed in our analysis is not a sign of redundancy of certain indicators, it is rather spatial contingency. For instance, in the case of shoreline landscape quality assessment, the diversity of tourism objects and the presence of tourism infrastructure exhibited possible multicollinearity (as well as the diversity of tourism objects and accessibility in inland landscape quality, implying that both indicators capture the same aspect of landscape quality). However, it is conceivable that a situation might arise where the presence of tourism attractions coincides with low values of infrastructure quality or accessibility, thereby indicating the necessity for its development. As in the case of possible multicollinearity between attractive landscape elements and small landscape elements, these two indicators are not redundant as they represent different landscape quality criteria (landscape aesthetic quality and landscape diversity), but their definitions should be more specific to avoid possible double-counting.
4.2. Role of Public Preferences and Well-Being Aspects in Planning of Coastal Development
Coastal and marine ecosystems are increasingly recognized for their multifaceted contributions to human well-being. For, recent research by Severin et al. [61] underscores the role of coastal settings in stress reduction and energy restoration, while Ashbullby et al. [62] associate coastal visits with diverse health and social benefits. Despite these findings, the incorporation of non-material values, such as perceived well-being benefits and intangible social values, remains limited in spatial or development planning processes, as highlighted by various scholars investigating the perceived benefits of coastal environments [63].
The nationwide survey in Latvia delivers the priorities of the well-being benefits by residents, revealing a distinct emphasis on the value of diverse ecosystems, followed closely by perceived leisure and health benefits associated with coastal areas. Similar priorities were also discovered in a study conducted to explore the relationship between CES, socio-cultural values, and well-being in Ireland [64].
Employing a range of social research methods, including interactive workshops, interviews, and surveys, their findings underscored the high esteem in which individuals hold intangible coastal values, particularly wilderness experiences, aesthetic appreciation, and health benefits. Distinctly, leisure activities such as coastal walks emerged as significant contributors to the perceived well-being, with participants consistently expressing the profound impact of coastal environments on their overall quality of life.
Complementing these insights, a study by Ahtiainen et al. [65] on CES provided by the Baltic Sea further elucidates the specific coastal ecosystem services deemed crucial in the Latvian context. Recreation, habitats, and landscapes emerge as focal points, underscoring the nuanced interplay between ecosystem functionality and human well-being within coastal regions.
- Inhabitants versus visitors (regional versus national benefits)
The study results indicate that residents value all perceived well-being benefits offered by the Southwestern Kurzeme coastal area more than visitors. This observation is consistent with findings from research examining the perspectives of various stakeholder groups. Residents tend to attach greater value to local assets and demonstrate a stronger commitment to protecting resources, often due to the absence of readily available alternative sources of benefits. When studying natural resource-dependent communities, those whose material benefits depend on provisioning ES, the findings revealed that they simultaneously perceived the high importance of CES, such as scenic beauty, which can serve as a strong incentive for people to safeguard ecosystems [21]. Conversely, visitors may exhibit an increased awareness and appreciation of these distinctive environments, but they may also intentionally seek out alternative ways of enjoying coastal areas [66].
- Naturalness versus amenities in coastal recreation planning
Coastal regions offer a diverse array of recreational opportunities, ranging from water-based activities to nature exploration and cultural experiences. Understanding the preferences of visitors regarding different types of coastal recreation is vital for municipal planners, developers, and managers to tailor offerings and enhance satisfaction among both locals and visitors. One notable finding from our study suggests that planners should not necessarily aim to equip all beaches and coastal areas with extensive amenities and services, as a considerable proportion of respondents in Latvia express a preference for untouched beaches with no human-made elements.
This result resonates with previous research conducted in Latvia [67] and the broader Baltic Sea region [65,68], where respondents prioritize natural habitats and their elements, such as sandy beaches, clean water, dunes, pine forest landscapes over built amenities and entertainment options. Similar trends have been observed in studies conducted in various other regions as well. For instance, Dimmock’s study [66] uncovered a strong preference among residents and visitors for the natural aspects of marine landscapes along the coast of NSW, Australia. Furthermore, Bell et al. [69] stressed the significance of preserving coastline diversity to accommodate the diverse and individual ways in which people engage with the coast.
The segmentation of beach stretches and the management of visitor flows prove advantageous not only for stakeholders but also for the coastal ecosystem, which is particularly susceptible to the impacts of various natural and anthropogenic factors. A mutual connection between undertaking an activity, environmental awareness and appreciation has been articulated in previous studies [63], a connection that resonates with our study’s findings, including the outcomes of PGIS.
While people highly value the naturalness of coastal landscapes, clean water emerges as a crucial prerequisite for a significant portion of respondents in Latvia, as well as in other coastal countries in Europe and globally [64,70,71]. Therefore, establishing certain minimum facilities, such as toilets, becomes necessary to uphold water quality and prevent degradation.
4.3. Integrated Approach in CES Assessment to Support Coastal Planning
The necessity of integrating biophysical and social methods of ES assessment to support development planning and decision-making has been recognized by several authors [36,37,39]. Our study presents an integrated framework for coastal CES assessment, including biophysical mapping of service supply, as well as social methods for revealing public preferences in the use of CES and their contribution to perceived well-being, which allowed us to develop evidence-based spatial solutions and recommendations for coastal tourism development. A similar approach was applied by Inácio et al. [72] in mapping and assessing coastal CES in a neighboring country—Lithuania, where various spatial data sets were used to model the natural components (e.g., naturalness, relief heterogeneity, tree density, water bodies, and other landcover types, silent areas, protected areas) and cultural components (e.g., religious sites, points of interest, sports facilities, accommodation, gastronomy, tourism infrastructure) contributing to CES supply; whereas flow and demand of the services were assessed using the online PGIS survey, identify the sites visited for recreation and points of origin of respondents as well as using this information also for verification of the supply assessment. Our approach differs in terms of the assessment unit—landscape area, which encompasses relatively homogeneous biophysical and socio-cultural characteristics as well as place identity [26], therefore being more recognizable/perceivable by local stakeholders and robust for decision-making. The applicability of landscape areas in decision-making and conveying planning solutions was highlighted by Hazeau et al. [48] and Fish et al. [73] and demonstrated in our study by using the CES assessment at the scale of landscape areas to guide the costal tourism development recommendations and their communication to stakeholders.
In this study, the data collected with participatory methods had a complementary character in CES mapping and assessment (e.g., PIGIS data were used to verify the biophysical mapping results on recreational potential as well as provide insights into the use of the areas for different recreational activities). The contribution of social methods was crucial when designing the solutions. Public demand for the preservation of natural landscape qualities as a resource for well-being was taken as the basis for targeting coastal tourism development by our method of clustering of landscape areas (with priority for maintaining natural, cultural heritage or aesthetic values) and thus providing a foundation for sustainable development planning in coastal regions.
The active involvement of stakeholders throughout the planning process is fundamental to our framework. Understanding their needs and perceptions is crucial for informed decision-making and the successful implementation of planning initiatives [74,75]. Incorporating stakeholder input enhances the relevance and acceptance of planning outcomes, contributing to more sustainable and inclusive development practices [51].
The framework and methods demonstrated in this study offer a practical approach to addressing the complexities of planning processes associated with manifold ecosystem values. Our findings illustrate the applicability of this approach across various planning contexts, including thematic planning of coastal tourism development, maritime spatial planning, and the promotion of sustainable blue economy initiatives. By considering land-sea interactions, our framework enriches the planning process, ensuring a holistic approach that accounts for the interconnectedness of coastal ecosystems (shoreline, terrestrial) and human activities.
Practically, our approach serves as valuable input for the development of guidance tailored to respond to the needs of coastal planning practitioners [76,77]. By operationalizing the concept of CES through our framework, coastal communities can align their development goals with national governance ambitions, while addressing the priorities and concerns of local stakeholders.
5. Conclusions
In conclusion, our study presents a significant contribution to the field of coastal planning and management by offering a comprehensive framework for evaluating development potentials and associated trade-offs in coastal regions. By integrating coastal landscape ecology and social science to operationalize the concept of ecosystem services, our research provides valuable insights that can inform decision-making processes for marine and coastal planners.
Our findings emphasize the importance of adopting an interdisciplinary approach to coastal planning, which leverages the strengths of plural disciplines and assessments to ensure a more holistic representation of coastal CES. Through this approach, we can better recognize and value the well-being benefits provided by coastal ecosystems and use this information in development of planning solutions.
Moreover, our study highlights the necessity of a transdisciplinary approach that actively engages stakeholders and acknowledges their diverse perspectives and valuations of well-being. By systematically involving stakeholders throughout the planning process, we can foster a deeper understanding of local contexts, preferences, and benefits, ultimately leading to more inclusive and effective coastal management strategies.
While our proposed coastal planning framework has been tested at a regional level, its scalability to national and cross-border contexts holds high potential for addressing the complex challenges facing coastal areas globally. By enhancing the management of trade-offs through smart spatial segmentation, informed by interdisciplinary insights and stakeholder engagement, we envision a future where coastal regions and communities can achieve a balanced and sustainable trajectory of development for equitable well-being. Moving forward, it is essential to continue building upon this research by addressing multilevel and multi-scalar perspectives in the assessment of CES and well-being.
Author Contributions
Conceptualization, all; methodology, all; validation, all; formal analysis, I.V. and A.R. (Agnese Reke); investigation, A.R. (Anda Ruskule) and K.V.; data curation, I.V. and A.R. (Agnese Reke); writing—original draft preparation, all; writing—review and editing, all; visualization, I.V., A.R. (Anda Ruskule) and A.R. (Agnese Reke); supervision, K.V.; project administration, K.V.; funding acquisition, K.V. All authors have read and agreed to the published version of the manuscript.
Funding
This research was financially supported by a project of the Baltic Sea Region Interreg program, “Land-sea interactions advancing Blue Growth in Baltic Sea coastal areas” (Land-Sea-Act, #R098).
Institutional Review Board Statement
Not applicable.
Data Availability Statement
Data is contained within the article.
Acknowledgments
The authors would like to thank Marta Stube for her contributions to the study by supporting the team with her GIS knowledge and technical skills.
Conflicts of Interest
The authors declare no conflicts of interest. The funders had no role in the design of the study; in the collection, analyses, or interpretation of data; in the writing of the manuscript; or in the decision to publish the results.
Appendix A

Table A1.
Landscape quality assessment criteria, indicators, and data sources, applied to inland part of the case study area.
Table A1.
Landscape quality assessment criteria, indicators, and data sources, applied to inland part of the case study area.
| Landscape Quality | Indicators | Indicator Assessment Scale | Data Sources |
|---|---|---|---|
| Landscape aesthetic quality | Openness of landscape | 1—closed landscape (forest cover > 90%) 3—partly open landscape (mosaic type) 5—open landscape (forest < 20%) | Land cover maps Topography maps Field survey |
| Scenic views | 1—no scenic views (plain terrain) 2—very few scenic views (almost plain terrain) 3—several scenic views but mostly plain terrain 4—several scenic views, undulating terrain 5—many outstanding scenic views (e.g., sea view) | Field survey | |
| Attractive landscape elements (gardens, alleys, farmstead clusters, fishermen villages, small forest patches) | 1—no attractive landscape elements/landscape is visually homogeneous 3—few attractive landscape elements 5—many attractive landscape elements/landscape is visually diverse | Field survey | |
| Share of scenically attractive roads | 1—no scenically attractive roads or only short sections 3—few scenically attractive roads 5—many and diverse scenically attractive roads | Field survey | |
| Visual pollution and degrading elements (abandoned sites or agricultural land, demolished buildings) | 1—visual pollution dominates the landscape 3—few visual degrading elements 5—no visual degrading elements | Field survey | |
| Uniqueness of the landscape | Unique landscapes on a national/regional scale | 1—no unique landscapes of national or regional scale 3—at least one unique landscape 5—several unique landscapes of national or regional scale | Map of national/regional “landscape treasures” |
| Landscape diversity | Diversity of land use (LU) types | 1—low (dominated by one LU type) 2—medium low (in some parts of the area many LU types can be found) 3—medium (dominated by at least two LU types) 4—medium high (several LU types distributed all over the area) 5—high (several LU types well represented; many different LU type concentration areas) | Corine Land Cover Topography map |
| Small-scale landscape elements (rows of trees/alleys, single large trees, piles of stones, etc.) | 1—very few small-scale landscape elements 2—few significant small-scale landscape elements 3—several significant small-scale landscape elements, but their diversity is low 4—many different small-scale landscape elements, but not evenly distributed 5—many different small-scale landscape elements, distributed evenly all over the area | Topography map Field survey | |
| Settlement structure | 1—area not populated 2—very few settlements (farmsteads) 3—settlements distributed unevenly (e.g., along the roads) 4—several concentration areas of the settlements 5—settlement distributed all over the area | Topography map | |
| Landscape naturalness | Presence of natural microrelief | 1—no microrelief (levelled area) 3—microrelief in some parts maintained 5—microrelief maintained | Topography map Field survey |
| Naturalness of water streams and rivers | 1—almost completely regulated water streams (>90%) 3—water streams partly regulated 5—natural water streams | Topography map Map of drainage systems | |
| Share of semi-natural habitats | 1—no semi-natural habitats (<1%) 2—only few areas with semi-natural habitats (<20%) 3—medium distribution of semi-natural habitats (20–50%) 4—area dominated by semi-natural habitats (>50%) 5—almost only semi-natural habitats (>90%) | Habitat mapping data | |
| Share of protected areas | 1—no or negligible share of protected areas 3—relatively high share of protected areas (>20%) 5—protected areas are dominating (>50%) | Map of protected areas | |
| Presence of industrial objects (big agroindustry farms, wind-parks etc.) | 1—lot of different industrial objects are present throughout the landscape 3—few industrial objects are present at some locations 5—no industrial objects are visible in landscape | Field survey | |
| Cultural heritage | Number of cultural history monuments | 1—only few cultural heritage objects at some locations 3—relatively high number of cultural heritage objects, but distributed unevenly 5—high density of cultural heritage objects distributed evenly throughout the area | Data base of cultural history monuments Cultural heritage maps of the municipality spatial planning documents |
| Diversity of cultural history monuments | 1—no diversity of cultural heritage objects 3—medium diversity of cultural heritage objects (at least two types of objects), 5—high diversity—many different types of cultural heritage objects (at least three) | Data base of cultural history monuments Cultural heritage maps of the municipality spatial planning documents | |
| Presence of historical spatial structures (traditional landscape, historical roads or their sections, old villages, historic distribution pattern of farmsteads) | 1—very little evidence of historic spatial structures at some locations (landscape structure is significantly transformed) 3—medium diversity of historic spatial structures and uneven distribution 5—high diversity of historic spatial structures evenly distributed throughout the area | Field survey and other data (e.g., municipality spatial planning documents) | |
| Visually outstanding cultural history objects (manor houses, churches, mills, bridges, mounds, fishing villages, etc.) | 1—only few outstanding cultural heritage objects at some locations 3—relatively high number of outstanding cultural heritage objects, but distributed unevenly 5—high density of outstanding cultural heritage objects distributed evenly throughout the area | Field survey and other data (e.g., municipality spatial planning documents) | |
| Recreation potential | Density of tourism attractions/objects | 1—only few tourism objects at some locations 3—medium density of tourism objects, concentrated only in few locations 5—high density of tourism objects concentrated at several locations | Municipality spatial planning documents, thematic plans etc. |
| Accommodation possibilities | 1—very few (1–2 sites) or no accommodation possibilities 3—relatively good accommodation possibilities but only in a few locations 5—accommodation possibilities are more or less evenly distributed all over the area and concentrated near significant tourism objects | Data collected by tourism experts (A. Klepers), Accommodation websites, e.g., booking.com, airbnb.com (Accessed on 31 August 2020) | |
| Presence of nature parks, national parks and nature monuments | 1—no nature parks, national parks or nature monuments 3—one nature park, national park or nature monument 5—two or more nature parks, national parks or nature monument | Map of protected areas | |
| Diversity of tourism infrastructure | 1—no diversity of tourism infrastructure, since only one or few tourism objects are present in the area 3—medium diversity of tourism infrastructure 5—high diversity of tourism infrastructure | Municipality spatial planning documents, thematic plans etc. Field survey | |
| Cycling Routes | 1—no cycling routes 3—there are 1–2 cycling routes crossing the area 5—many cycling rotes, well distributed in the area | Municipality spatial planning documents, thematic plans etc. | |
| Accessibility | 1—access to tourism attractions is not provided or very limited/difficult 3—tourist attractions are relatively well reachable, but the infrastructure or quality of access roads is poor 5—free and convenient access to tourist attractions with appropriate infrastructure | Field survey Municipality spatial planning documents, thematic plans etc |
Table A2.
Landscape quality assessment criteria, indicators and data sources, applied to shoreline part of the study area.
Table A2.
Landscape quality assessment criteria, indicators and data sources, applied to shoreline part of the study area.
| Landscape Quality | Indicators | Expert Assessment Scale | Data Sources |
|---|---|---|---|
| Landscape aesthetic quality | Scenic views (cliffs, bays, capes etc.) | 1—Monotonous shoreline (or landscape when viewed from shore), different shore types cannot be distinguished 3—moderately monotonous shoreline/landscape 5—spectacular/attractive shoreline, diverse landscape/shore types | Field survey |
| Attractive landscape elements (fishermen boats, ships, yacht, big stones/rocks) | 1—no attractive landscape elements/landscape is visually homogeneous 3—few attractive landscape elements 5—many attractive landscape elements/landscape is visually diverse | Field survey | |
| Visual pollution and degrading elements (abandoned sites, demolished buildings) | 1—visual pollution dominates the landscape 3—few visual degrading elements 5—no visual degrading elements | Field survey | |
| Uniqueness of the landscape | Unique landscapes on a national/regional scale | 1—no unique landscapes of national or regional scale 3—at least one unique landscape 5—several unique landscapes of national or regional scale | Map of national/regional “Landscape treasures” |
Landscape diversity | Shoreline diversity depending on its character (bays, capes etc) and exposition | 1—low (smooth shoreline, dominated by one shore type) 2—medium low (some parts of the shoreline stretch have a different character/shore type) 3—medium (two shore types dominate equally) 4—medium high (several shore types are present) 5—high (great variety of shore types, many bays, estuaries) | Corine Land Cover Topography map Map of shore types Field survey |
| Small-scale landscape elements—presence of natural and human made elements in landscape (e.g., lighthouses, piers, ships, boats, rocks, fallen/washed out trees) | 1—very few small-scale landscape elements 2—few significant small-scale landscape elements 3—several significant small-scale landscape elements, but their diversity is low 4—many different small-scale landscape elements, but not evenly distributed 5—many different small-scale landscape elements, distributed evenly all over the area | Topography map Field survey | |
| Landscape naturalness | Share of natural shoreline stretches | 1—artificial/transformed shore—port 3—partly natural shore 5—distinctly natural shore | Field survey |
| Share of protected areas | 1—no or negligible share of protected areas 3—relatively high share of protected areas (>20%) 5—protected areas are dominating (>50%) | Map of protected areas | |
| Cultural heritage | Number of cultural history monuments (e.g., wrecks, lighthouses etc.) | 1—no cultural history monuments 3—few (1–2) cultural history monuments 5—many cultural history monuments | Data base of cultural history monuments Cultural heritage maps of the municipality, spatial planning documents and MSP |
| Presence of traditional land/sea use practices (e.g., fishing) in the landscape | 1—No signs of traditional practices 2—Some elements (e.g., few fisherman boats) 3—Many fisherman boats, fishing nets or other features | Field survey | |
| Visually outstanding cultural history objects (manor houses, churches, mills, bridges, mounds, fishing villages, lighthouses etc.) | 1—only few outstanding cultural heritage objects at some locations 3—relatively high number of outstanding cultural heritage objects, but distributed unevenly 5—high density of outstanding cultural heritage objects distributed evenly throughout the area | Field survey and other data (municipality spatial plans, etc.) | |
| Recreation potential | Density of tourism attractions/objects | 1—only few tourism objects at some locations 3—medium density of tourism objects, concentrated only in few locations 5—high density of tourism objects concentrated at several locations | Density of tourism attractions/objects |
| Diversity of tourism infrastructure | 1—no diversity of tourism infrastructure, since only one or few tourism objects are present in the area 3—medium diversity of tourism infrastructure 5—high diversity of tourism infrastructure | Municipality spatial planning documents, thematic plans etc. Field survey | |
| Accessibility | 1—access to tourism attractions is not provided or very limited/difficult 3—tourist attractions are relatively well reachable, but the infrastructure or quality of the access roads is poor 5—free and convenient access to tourist attractions with appropriate infrastructure | Field survey Assessment of coastal infrastructure | |
| Number of visitors | 1—negligible number of visitors (<100) 2—low number of visitors (100–300) 3—average number of visitors (300–1000) 4—high number of visitors (1000–5000) 5—intensively visited beach (>5000) | Visitor counts |
Appendix B
Questionnaire for assessing the perceived well-being benefits provided by the Southwestern Kurzeme coastal area
Please note—originally, the questionnaire was developed and distributed in Latvian and Russian languages. The English translation is generated for the purpose of this publication only.
Questions that were not utilized in this study are excluded from the translated version.
INTRODUCTION
Hello!
We are currently conducting a social survey about the importance of Southwestern Kurzeme coastal area for residents of Latvia. The survey is anonymous, and all your answers will be used only in an aggregated form. The survey will take ~10 min.
QUESTIONNAIRE
- D1 Gender
- D2 Age
- D3 Nationality
- D4 Place of residence
In case the place of the residence indicated by the respondent is geographically part of Southwestern Kurzeme coasal area, the respondent is automatically classified as local inhabitant of Southwestern Kurzeme coastal area and therefore excluded from several questions directed to visitors (see “FILTER”).

INTRO1: Please take a look at this map. This is the area we identify as the “Southwestern Kurzeme coastal area” in this study. The marked territory includes Liepāja, Pāvilosta, Grobiņa, Grobiņa Parish, Medzes Parish, Nīcas Parish, Otaņki Parish, Sakas Parish, Vērgales Parish, Rucavas Paris.
FILTER: Display only to “Not a permanent resident of the Southwestern Kurzeme coastal area”
Q1 When was the last time you visited the Southwestern Kurzeme coastal area?
- In the last three years (2018–2021)
- 4–10 years ago (2011–2017)
- Earlier than 10 years ago (before 2011)
- I have never been to the Southwestern Kurzeme coastal area -> excluded from Q2–Q5
FILTER: Display only to “Not a permanent resident of the Southwestern Kurzeme coastal area”
Q2 Please select which of the following statements best describes your connection to the Southwestern Kurzeme coastal area? You can select multiple answers.
- I live on the Southwestern coast occasionally/seasonally (e.g., I own or rent a summer house/apartment/cottage there)
- I visit the Southwestern Kurzeme coastal area for private business (e.g., recreation, visiting relatives/friends, cultural and sport events)
- I visit the Southwestern Kurzeme coastal area for work
- I visit the Southwestern Kurzeme coastal area when passing through (i.e., it is not my main destination)
FILTER: Display to “Not a permanent resident of the Southwestern Kurzeme coastal area” and has visited the Southwestern Kurzeme in the last three years (Q1 = 1)
Q3 How many times have you visited the Southwestern Kurzeme coastal area in the last 3 years?
- 1–2 times
- 3–5 times
- 6–10 times
- 11–30 times
- 31 or more times
- I don’t know
FILTER: Display only to “Not a permanent resident of the Southwestern Kurzeme coastal area”
Q4 Which seasons of the year do you usually visit the Southwestern Kurzeme coastal area? You can select multiple answers.
- Spring
- Summer
- Autumn
- Winter
FILTER: Display to all respondents, except the ones who have never been in Soutwestern Kurzeme coastal area (Q1 = 4)
Q5 Please rate the following statements!
| Compl. Dis- Agree | Part. Dis- Agree | Part. Agree | Compl. Agree | I Don’t Know | ||
| 1. | Visiting the Southwestern Kurzeme coastal area provides me with an opportunity to relax and clarify my thoughts | 1 | 2 | 3 | 4 | n/a |
| 2. | I feel healthier, more energetic after visiting the Southwestern Kurzeme coastal area | 1 | 2 | 3 | 4 | n/a |
| 3. | The natural resources provided by the Southwestern Kurzeme coastal area significantly contribute to my financial well-being (my work is related to the coast—hospitality, fishing, tourism, etc.) | 1 | 2 | 3 | 4 | n/a |
| 4. | The opportunity to fish, pick berries, mushrooms and other goods for self-consumption on the Southwestern Kurzeme coastal area is important for me | 1 | 2 | 3 | 4 | n/a |
| 5. | The Southwestern Kurzeme coastal area plays a crucial role in my social life: I spend time with my family and/or friends here, engage in social activities | 1 | 2 | 3 | 4 | n/a |
| 6. | Exploring the Southwestern Kurzeme coastal areas has enabled me to acquire new knowledge (e.g., about nature, the sea) | 1 | 2 | 3 | 4 | n/a |
| 7. | The Southwestern Kurzeme coastal area holds a significance for me in terms of recreation opportunities | 1 | 2 | 3 | 4 | n/a |
| 8. | The role of the Southwestern Kurzeme coastal area in strenghtening the national military security holds importance for me | 1 | 2 | 3 | 4 | n/a |
| 9. | The potential energy independence that can be achieved through the establishment of wind farms along the Southwestern Kurzeme coastal area is vital for me | 1 | 2 | 3 | 4 | n/a |
| 10. | The Southwestern Kurzeme coastal area provides me with a sense of security—I feel protected from the effects of climate change, natural disasters (storms, floods etc.) | 1 | 2 | 3 | 4 | n/a |
| 11. | I hold the nature diversity of the Southwestern Kurzeme coastal area in high regard, and its preservation brings me a sense of satisfaction | 1 | 2 | 3 | 4 | n/a |
FILTER: All respondents
Q9 Which of these picture collages best fits your idea of a pleasant environment for recreation?
- A
- B
- Difficult to say

FILTER: All respondents
Q10 Please rate how important are these factors are to you when selecting a recreation site by the sea!
| Compl. Un-Import. | Minor Import. | Import. but Not Decisive | Very Import. | I Don’t Know | ||
| 1. | Amenities are available (e.g., benches, changing rooms, access paths, children’s playgrounds) | 1 | 2 | 3 | 4 | n/a |
| 2. | Services are available nearby (e.g., shops, restaurants, cafes) | 1 | 2 | 3 | 4 | n/a |
| 3. | The site has special nature values (e.g., beautiful beaches, dunes, many bird species) | 1 | 2 | 3 | 4 | n/a |
| 4. | There are not many other visitors on the site | 1 | 2 | 3 | 4 | n/a |
| 5. | The site is clean | 1 | 2 | 3 | 4 | n/a |
| 6. | The site has beautiful landscapes/seascapes | 1 | 2 | 3 | 4 | n/a |
| 7. | Easy access by private transport | 1 | 2 | 3 | 4 | n/a |
| 8. | Easy access by public transport | 1 | 2 | 3 | 4 | n/a |
Appendix C
PGIS survey: Recreation on the Southwestern Kurzeme coast
Please note—originally the PGIS survey was developed and distributed in Latvian language. The English translation is generated for the purpose of this publication only.
Introduction
We would like to find out what you think are the most important recreation/tourism sites on the Southwestern Kurzeme coastal area. The information is being gathered within the framework of the Interreg project Land-Sea-Act to find solutions to balance the development of offshore wind farms with the interests of the local community and tourism industry.
FILTER: All respondents
Q1 Please mark on the interactive map a place of interest for tourism/recreation! Please select a place within the marked project area.

FILTER: All respondents
Q2 Please type the name of the place: _____________
FILTER: All respondents
Q3 The marked place is suitable for:
You can select multiple answers.
- Relaxation by the sea
- Water sports
- Jet skis
- Yacht and boat decks
- Fishing
- Hunting
- Bird watching
- Hiking and walking
- Exploring cultural history
- Public entertainment events (festivals, performances etc.)
- Sports
- Overnighting
- Enjoying landscape/seascape
- Other ____ (please specify)
FILTER: Optional question
Q4 Additional comments about the place: ___________
Demographic questions
D1 Place of residence (city, parish or municipality)
D2 Occupation
D3 Age
Appendix D
Table A3.
Descriptive statistics for the rating of the factors influencing the choice of coastal recreation sites. Note that responses of “I don’t know” were excluded from the analysis, resulting in varying number of responses (N) across factors.
Table A3.
Descriptive statistics for the rating of the factors influencing the choice of coastal recreation sites. Note that responses of “I don’t know” were excluded from the analysis, resulting in varying number of responses (N) across factors.
| Factor * | N | Mean | SD | Coefficient of Variation |
|---|---|---|---|---|
| Availability of amenities | 981 | 3.059 | 0.833 | 0.272 |
| Availability of services | 976 | 2.858 | 0.835 | 0.292 |
| Presence of nature values | 977 | 3.540 | 0.616 | 0.174 |
| Low visitor density | 973 | 3.270 | 0.714 | 0.218 |
| Cleanliness of the site | 981 | 3.744 | 0.514 | 0.137 |
| Beautiful landscapes | 978 | 3.566 | 0.587 | 0.164 |
| Private transport access | 974 | 3.270 | 0.830 | 0.254 |
| Public transport access | 967 | 2.620 | 1.056 | 0.403 |
* For full statements used in the survey see Appendix B, Q10.
| 1 | Land-Sea-Act Map Explorer: https://experience.arcgis.com/experience/2447e76e306a4e68bf82323e33b72b26/ (accessed on 31 January 2024). |
| 2 | https://ainavudargumi.lv/en/ (accessed on 31 January 2024). |
References
- European Environment Agency. Marine Messages II: Navigating the Course towards Clean, Healthy and Productive Seas through Implementation of an Ecosystem-Based Approach; Publications Office: Luxembourg, 2019. [Google Scholar]
- Petrişor, A.-I.; Hamma, W.; Nguyen, H.D.; Randazzo, G.; Muzirafuti, A.; Stan, M.-I.; Tran, V.T.; Aştefănoaiei, R.; Bui, Q.-T.; Vintilă, D.-F.; et al. Degradation of Coastlines under the Pressure of Urbanization and Tourism: Evidence on the Change of Land Systems from Europe, Asia and Africa. Land 2020, 9, 275. [Google Scholar] [CrossRef]
- Dahlet, L.I.; Selim, S.A.; Van Putten, I. A Review of How We Study Coastal and Marine Conflicts: Is Social Science Taking a Broad Enough View? Marit. Stud. 2023, 22, 29. [Google Scholar] [CrossRef]
- Turner, R.K. Integrating Natural and Socio-Economic Science in Coastal Management. J. Mar. Syst. 2000, 25, 447–460. [Google Scholar] [CrossRef]
- Bennett, E.M.; Chaplin-Kramer, R. Science for the Sustainable Use of Ecosystem Services. F1000Research 2016, 5, 2622. [Google Scholar] [CrossRef]
- Smart, L.S.; Vukomanovic, J.; Sills, E.O.; Sanchez, G. Cultural Ecosystem Services Caught in a ‘Coastal Squeeze’ between Sea Level Rise and Urban Expansion. Glob. Environ. Chang. 2021, 66, 102209. [Google Scholar] [CrossRef]
- Eurostat Data Browser. Available online: https://ec.europa.eu/eurostat/databrowser/product/page/TOUR_OCC_NINATDC (accessed on 31 January 2024).
- Custodio, M.; Moulaert, I.; Asselman, J.; Van Der Biest, K.; Van De Pol, L.; Drouillon, M.; Hernandez Lucas, S.; Taelman, S.E.; Everaert, G. Prioritizing Ecosystem Services for Marine Management through Stakeholder Engagement. Ocean Coast. Manag. 2022, 225, 106228. [Google Scholar] [CrossRef]
- Frederiksen, P.; Morf, A.; Von Thenen, M.; Armoskaite, A.; Luhtala, H.; Schiele, K.S.; Strake, S.; Hansen, H.S. Proposing an Ecosystem Services-Based Framework to Assess Sustainability Impacts of Maritime Spatial Plans (MSP-SA). Ocean Coast. Manag. 2021, 208, 105577. [Google Scholar] [CrossRef]
- Galparsoro, I.; Pınarbaşı, K.; Gissi, E.; Culhane, F.; Gacutan, J.; Kotta, J.; Cabana, D.; Wanke, S.; Aps, R.; Bazzucchi, D.; et al. Operationalisation of Ecosystem Services in Support of Ecosystem-Based Marine Spatial Planning: Insights into Needs and Recommendations. Mar. Policy 2021, 131, 104609. [Google Scholar] [CrossRef]
- Veidemane, K.; Ruskule, A.; Strake, S.; Purina, I.; Aigars, J.; Sprukta, S.; Ustups, D.; Putnis, I.; Klepers, A. Application of the Marine Ecosystem Services Approach in the Development of the Maritime Spatial Plan of Latvia. Int. J. Biodivers. Sci. Ecosyst. Serv. Manag. 2017, 13, 398–411. [Google Scholar] [CrossRef]
- Braat, L.C.; De Groot, R. The Ecosystem Services Agenda: Bridging the Worlds of Natural Science and Economics, Conservation and Development, and Public and Private Policy. Ecosyst. Serv. 2012, 1, 4–15. [Google Scholar] [CrossRef]
- Heckwolf, M.J.; Peterson, A.; Jänes, H.; Horne, P.; Künne, J.; Liversage, K.; Sajeva, M.; Reusch, T.B.H.; Kotta, J. From Ecosystems to Socio-Economic Benefits: A Systematic Review of Coastal Ecosystem Services in the Baltic Sea. Sci. Total Environ. 2021, 755, 142565. [Google Scholar] [CrossRef] [PubMed]
- Schröter, M.; Van Der Zanden, E.H.; Van Oudenhoven, A.P.E.; Remme, R.P.; Serna-Chavez, H.M.; De Groot, R.S.; Opdam, P. Ecosystem Services as a Contested Concept: A Synthesis of Critique and Counter-Arguments. Conserv. Lett. 2014, 7, 514–523. [Google Scholar] [CrossRef]
- Van Oudenhoven, A.P.E.; Schröter, M.; Drakou, E.G.; Geijzendorffer, I.R.; Jacobs, S.; Van Bodegom, P.M.; Chazee, L.; Czúcz, B.; Grunewald, K.; Lillebø, A.I.; et al. Key Criteria for Developing Ecosystem Service Indicators to Inform Decision Making. Ecol. Indic. 2018, 95, 417–426. [Google Scholar] [CrossRef]
- Millenium Ecosystem Assessment. Ecosystems and Human Well-Being: Synthesis; Island Press: Washington, DC, USA, 2005; ISBN 1-56973-597-2. [Google Scholar]
- Tengberg, A.; Fredholm, S.; Eliasson, I.; Knez, I.; Saltzman, K.; Wetterberg, O. Cultural Ecosystem Services Provided by Landscapes: Assessment of Heritage Values and Identity. Ecosyst. Serv. 2012, 2, 14–26. [Google Scholar] [CrossRef]
- Milcu, A.I.; Hanspach, J.; Abson, D.; Fischer, J. Cultural Ecosystem Services: A Literature Review and Prospects for Future Research. Ecol. Soc. 2013, 18, 44. [Google Scholar] [CrossRef]
- Nevzati, F.; Veldi, M.; Külvik, M.; Bell, S. Analysis of Landscape Character Assessment and Cultural Ecosystem Services Evaluation Frameworks for Peri-Urban Landscape Planning: A Case Study of Harku Municipality, Estonia. Land 2023, 12, 1825. [Google Scholar] [CrossRef]
- Schaich, H.; Bieling, C.; Plieninger, T. Linking Ecosystem Services with Cultural Landscape Research. GAIA—Ecol. Perspect. Sci. Soc. 2010, 19, 269–277. [Google Scholar] [CrossRef]
- Elwell, T.L.; López-Carr, D.; Gelcich, S.; Gaines, S.D. The Importance of Cultural Ecosystem Services in Natural Resource-Dependent Communities: Implications for Management. Ecosyst. Serv. 2020, 44, 101123. [Google Scholar] [CrossRef]
- Blicharska, M.; Smithers, R.J.; Hedblom, M.; Hedenås, H.; Mikusiński, G.; Pedersen, E.; Sandström, P.; Svensson, J. Shades of Grey Challenge Practical Application of the Cultural Ecosystem Services Concept. Ecosyst. Serv. 2017, 23, 55–70. [Google Scholar] [CrossRef]
- Drakou, E.G.; Kermagoret, C.; Liquete, C.; Ruiz-Frau, A.; Burkhard, K.; Lillebø, A.I.; Van Oudenhoven, A.P.E.; Ballé-Béganton, J.; Rodrigues, J.G.; Nieminen, E.; et al. Marine and Coastal Ecosystem Services on the Science–Policy–Practice Nexus: Challenges and Opportunities from 11 European Case Studies. Int. J. Biodivers. Sci. Ecosyst. Serv. Manag. 2017, 13, 51–67. [Google Scholar] [CrossRef]
- Cabana, D.; Ryfield, F.; Crowe, T.P.; Brannigan, J. Evaluating and Communicating Cultural Ecosystem Services. Ecosyst. Serv. 2020, 42, 101085. [Google Scholar] [CrossRef]
- Leyshon, C. Finding the Coast: Environmental Governance and the Characterisation of Land and Sea. Area 2018, 50, 150–158. [Google Scholar] [CrossRef]
- Pikner, T.; Piwowarczyk, J.; Ruskule, A.; Printsmann, A.; Veidemane, K.; Zaucha, J.; Vinogradovs, I.; Palang, H. Sociocultural Dimension of Land–Sea Interactions in Maritime Spatial Planning: Three Case Studies in the Baltic Sea Region. Sustainability 2022, 14, 2194. [Google Scholar] [CrossRef]
- Banela, M.; Kitsiou, D. Mapping Cultural Ecosystem Services: A Case Study in Lesvos Island, Greece. Ocean Coast. Manag. 2023, 246, 106883. [Google Scholar] [CrossRef]
- Garcia Rodrigues, J.; Conides, A.; Rivero Rodriguez, S.; Raicevich, S.; Pita, P.; Kleisner, K.; Pita, C.; Lopes, P.; Alonso Roldán, V.; Ramos, S.; et al. Marine and Coastal Cultural Ecosystem Services: Knowledge Gaps and Research Priorities. One Ecosyst. 2017, 2, e12290. [Google Scholar] [CrossRef]
- Kosanic, A.; Petzold, J. A Systematic Review of Cultural Ecosystem Services and Human Wellbeing. Ecosyst. Serv. 2020, 45, 101168. [Google Scholar] [CrossRef]
- Hernández-Morcillo, M.; Plieninger, T.; Bieling, C. An Empirical Review of Cultural Ecosystem Service Indicators. Ecol. Indic. 2013, 29, 434–444. [Google Scholar] [CrossRef]
- Brown, G.; Hausner, V.H. An Empirical Analysis of Cultural Ecosystem Values in Coastal Landscapes. Ocean Coast. Manag. 2017, 142, 49–60. [Google Scholar] [CrossRef]
- Vieira Da Silva, C.; Ortigão, M.; Willaert, T.; Rosa, R.; Nunes, L.C.; Cunha-e-Sá, M.A. Participatory Geographic Information Systems (PGIS): Alternative Approaches to Identify Potential Conflicts and Positional Accuracy in Marine and Coastal Ecosystem Services. Mar. Policy 2021, 131, 104650. [Google Scholar] [CrossRef]
- Brown, G.; Reed, P.; Raymond, C.M. Mapping Place Values: 10 Lessons from Two Decades of Public Participation GIS Empirical Research. Appl. Geogr. 2020, 116, 102156. [Google Scholar] [CrossRef]
- Brown, G.; Montag, J.M.; Lyon, K. Public Participation GIS: A Method for Identifying Ecosystem Services. Soc. Nat. Resour. 2012, 25, 633–651. [Google Scholar] [CrossRef]
- Fagerholm, N.; Raymond, C.M.; Olafsson, A.S.; Brown, G.; Rinne, T.; Hasanzadeh, K.; Broberg, A.; Kyttä, M. A Methodological Framework for Analysis of Participatory Mapping Data in Research, Planning, and Management. Int. J. Geogr. Inf. Sci. 2021, 35, 1848–1875. [Google Scholar] [CrossRef]
- Burdon, D.; Potts, T.; McKinley, E.; Lew, S.; Shilland, R.; Gormley, K.; Thomson, S.; Forster, R. Expanding the Role of Participatory Mapping to Assess Ecosystem Service Provision in Local Coastal Environments. Ecosyst. Serv. 2019, 39, 101009. [Google Scholar] [CrossRef]
- Vihervaara, P.; Viinikka, A.; Brander, L.; Santos-Martín, F.; Poikolainen, L.; Nedkov, S. Methodological Interlinkages for Mapping Ecosystem Services—From Data to Analysis and Decision-Support. One Ecosyst. 2019, 4, e26368. [Google Scholar] [CrossRef]
- Ruskule, A.; Klepers, A.; Veidemane, K. Mapping and Assessment of Cultural Ecosystem Services of Latvian Coastal Areas. One Ecosyst. 2018, 3, e25499. [Google Scholar] [CrossRef]
- McKinley, E.; Acott, T.; Yates, K.L. Marine Social Sciences: Looking towards a Sustainable Future. Environ. Sci. Policy 2020, 108, 85–92. [Google Scholar] [CrossRef]
- Jernberg, S.; Kuosa, H.; Boström, C.; Burdon, D.; Haavisto, F.; Heiskanen, A.-S.; Kiviluoto, S.; Kuningas, S.; Kunnasranta, M.; Uusitalo, L.; et al. Linking Natural Capital Stocks with Ecosystem Services in the Northern Baltic Sea. Ecosyst. Serv. 2024, 65, 101585. [Google Scholar] [CrossRef]
- National Statistical System of Latvia. Population in Urban (Densely Populated) and Rural (Sparsely Populated) Areas in Regions, Cities, Municipalities, Towns and Rural Territories (after Administrative-Territorial Reform in 2021) 2022–2023; National Statistical System of Latvia: Riga, Latvia, 2023. [Google Scholar]
- Veidemane, K. The Impact of Driving Forces and Protection Policies on Future Coastal Landscapes: A Case Study of Latvia. In Global Change and Baltic Coastal Zones; Schernewski, G., Hofstede, J., Neumann, T., Eds.; Coastal Research Library; Springer: Dordrecht, The Netherlands, 2011; Volume 1, pp. 193–210. ISBN 978-94-007-0399-5. [Google Scholar]
- Ruskule, A.; Kotta, J.; Saha, C.R.; Arndt, P.; Ustups, D.; Strāķe, S.; Bergström, L. Testing the Concept of Green Infrastructure at the Baltic Sea Scale to Support an Ecosystem-Based Approach to Management of Marine Areas. Mar. Policy 2023, 147, 105374. [Google Scholar] [CrossRef]
- Swanwick, C. Landscape Character Assessment: Guidance for England and Scotland; The Countryside Agency & Scottish Natural Heritage: Cheltenham, UK, 2002. [Google Scholar]
- Tudor, C. An Approach to Landscape Character Assessment; Natural England: London, UK, 2014; ISBN 978-78367-141-0. [Google Scholar]
- Anderson, C. Guidance on Coastal Character Assessment.; Scottish National Heritage: Inverness, UK, 2017; p. 24. [Google Scholar]
- Sowińska-Świerkosz, B.N.; Chmielewski, T.J. A New Approach to the Identification of Landscape Quality Objectives (LQOs) as a Set of Indicators. J. Environ. Manag. 2016, 184, 596–608. [Google Scholar] [CrossRef]
- Hazeu, G.W.; Metzger, M.J.; Mücher, C.A.; Perez-Soba, M.; Renetzeder, C.; Andersen, E. European Environmental Stratifications and Typologies: An Overview. Agric. Ecosyst. Environ. 2011, 142, 29–39. [Google Scholar] [CrossRef]
- Zariņa, A.; Vinogradovs, I.; Vološina, M.; Reķe, A.; Briede, A.; Ušča, M.; Avotiņš, A.; Vītols, J.; Immurs, D.V. Zemgales Reģionālais Ainavas un Zaļās Infrastruktūras Plāns 2020–2027. Gadam. 2019. Available online: https://www.zemgale.lv/lv/media/109/download?attachment (accessed on 31 January 2024).
- Haines-Young, R.; Potschin, M. Common International Classification of Ecosystem Services (CICES) V5.1: Guidance on the Application of the Revised Structure. Available online: https://cices.eu/content/uploads/sites/8/2018/01/Guidance-V51-01012018.pdf (accessed on 31 January 2024).
- Morf, A.; Kull, M.; Piwowarczyk, J.; Gee, K. Towards a Ladder of Marine/Maritime Spatial Planning Participation. In Maritime Spatial Planning; Zaucha, J., Gee, K., Eds.; Springer International Publishing: Cham, Switzerland, 2019; pp. 219–243. ISBN 978-3-319-98695-1. [Google Scholar]
- JASP Team. JASP (Version 0.18.3); 2024. Available online: https://jasp-stats.org/download/ (accessed on 31 January 2024).
- Plieninger, T.; Van Der Horst, D.; Schleyer, C.; Bieling, C. Sustaining Ecosystem Services in Cultural Landscapes. Ecol. Soc. 2014, 19, 59. [Google Scholar] [CrossRef]
- Medeiros, A.; Fernandes, C.; Gonçalves, J.F.; Farinha-Marques, P. Research Trends on Integrative Landscape Assessment Using Indicators—A Systematic Review. Ecol. Indic. 2021, 129, 107815. [Google Scholar] [CrossRef]
- Bruni, D. Landscape Quality and Sustainability Indicators. Agric. Agric. Sci. Procedia 2016, 8, 698–705. [Google Scholar] [CrossRef]
- Stauskis, G. Identifying Key Criteria for Quality Assessment of Landscape Architecture Projects. Archit. Urban Plan. 2020, 16, 5–11. [Google Scholar] [CrossRef]
- Galler, C.; Von Haaren, C.; Albert, C. Planning Multifunctional Measures for Efficient Landscape Management: Quantifying and Comparing the Added Value of Integrated and Segregated Management Concepts. In Landscape Ecology for Sustainable Environment and Culture; Fu, B., Jones, K.B., Eds.; Springer: Dordrecht, The Netherlands, 2013; pp. 249–284. ISBN 978-94-007-6529-0. [Google Scholar]
- Maron, M.; Cockfield, G. Managing Trade-Offs in Landscape Restoration and Revegetation Projects. Ecol. Appl. 2008, 18, 2041–2049. [Google Scholar] [CrossRef]
- Gunton, R.M.; Marsh, C.J.; Moulherat, S.; Malchow, A.; Bocedi, G.; Klenke, R.A.; Kunin, W.E. Multicriterion Trade-offs and Synergies for Spatial Conservation Planning. J. Appl. Ecol. 2017, 54, 903–913. [Google Scholar] [CrossRef]
- Wiggering, H.; Müller, K.; Werner, A.; Helming, K. The Concept of Multifunctionality in Sustainable Land Development. In Sustainable Development of Multifunctional Landscapes; Helming, K., Wiggering, H., Eds.; Springer: Berlin/Heidelberg, Germany, 2003; pp. 3–18. ISBN 978-3-642-05502-7. [Google Scholar]
- Severin, M.I.; Raes, F.; Notebaert, E.; Lambrecht, L.; Everaert, G.; Buysse, A. A Qualitative Study on Emotions Experienced at the Coast and Their Influence on Well-Being. Front. Psychol. 2022, 13, 902122. [Google Scholar] [CrossRef] [PubMed]
- Ashbullby, K.J.; Pahl, S.; Webley, P.; White, M.P. The Beach as a Setting for Families’ Health Promotion: A Qualitative Study with Parents and Children Living in Coastal Regions in Southwest England. Health Place 2013, 23, 138–147. [Google Scholar] [CrossRef]
- Clarke, B.; Thet, A.K.; Sandhu, H.; Dittmann, S. Integrating Cultural Ecosystem Services Valuation into Coastal Wetlands Restoration: A Case Study from South Australia. Environ. Sci. Policy 2021, 116, 220–229. [Google Scholar] [CrossRef]
- Bullock, C.; Joyce, D.; Collier, M. An Exploration of the Relationships between Cultural Ecosystem Services, Socio-Cultural Values and Well-Being. Ecosyst. Serv. 2018, 31, 142–152. [Google Scholar] [CrossRef]
- Ahtiainen, H.; Liski, E.; Pouta, E.; Soini, K.; Bertram, C.; Rehdanz, K.; Pakalniete, K.; Meyerhof, J. Cultural Ecosystem Services Provided by the Baltic Sea Marine Environment. Ambio 2019, 48, 1350–1361. [Google Scholar] [CrossRef]
- Dimmock, K. The Importance of Marine Leisure Environments: Investigating Visitor and Local Resident Perceptions and Uses of Marine Environments on Coffs Coast, NSW Australia. Ann. Leis. Res. 2012, 15, 243–260. [Google Scholar] [CrossRef]
- Veidemane, K.; Nikodemus, O. Latvijas pludmales ainavu sniegto rekreācijas pakalpojumu vērtējums. Latv. Univ. Raksti. Zemes Un Vides Zinātnes 2013, 791, 61–74. [Google Scholar]
- Reimann, M.; Ehrlich, Ü.; Tõnisson, H. Regional Differences in Recreational Preferences of Estonian Coastal Landscapes. J. Coast. Res. 2014, 70, 420–425. [Google Scholar] [CrossRef]
- Bell, S.L.; Phoenix, C.; Lovell, R.; Wheeler, B.W. Seeking Everyday Wellbeing: The Coast as a Therapeutic Landscape. Soc. Sci. Med. 2015, 142, 56–67. [Google Scholar] [CrossRef]
- Nieminen, E.; Ahtiainen, H.; Lagerkvist, C.-J.; Oinonen, S. The Economic Benefits of Achieving Good Environmental Status in the Finnish Marine Waters of the Baltic Sea. Mar. Policy 2019, 99, 181–189. [Google Scholar] [CrossRef]
- Maguire, G.S.; Miller, K.K.; Weston, M.A.; Young, K. Being beside the Seaside: Beach Use and Preferences among Coastal Residents of South-Eastern Australia. Ocean Coast. Manag. 2011, 54, 781–788. [Google Scholar] [CrossRef]
- Inácio, M.; Gomes, E.; Bogdzevič, K.; Kalinauskas, M.; Zhao, W.; Pereira, P. Mapping and Assessing Coastal Recreation Cultural Ecosystem Services Supply, Flow, and Demand in Lithuania. J. Environ. Manag. 2022, 323, 116175. [Google Scholar] [CrossRef] [PubMed]
- Fish, R.; Church, A.; Winter, M. Conceptualising Cultural Ecosystem Services: A Novel Framework for Research and Critical Engagement. Ecosyst. Serv. 2016, 21, 208–217. [Google Scholar] [CrossRef]
- Agnew, S.; Kopke, K.; Power, O.-P.; Troya, M.D.C.; Dozier, A. Transdisciplinary Research: Can Citizen Science Support Effective Decision-Making for Coastal Infrastructure Management? Front. Mar. Sci. 2022, 9, 809284. [Google Scholar] [CrossRef]
- Kuhn, T.; Vikström, S.; Suškevičs, M.; Storie, J.T.; Saikkonen, L.; Rees, R.; Håkansson, C.; Oinonen, S.; Burkhard, B. Literature Syntheses to Inform Marine Ecosystem Management: Lessons Learned from Stakeholder Participation. Ecosyst. People 2023, 19, 2188970. [Google Scholar] [CrossRef]
- Longato, D.; Cortinovis, C.; Albert, C.; Geneletti, D. Practical Applications of Ecosystem Services in Spatial Planning: Lessons Learned from a Systematic Literature Review. Environ. Sci. Policy 2021, 119, 72–84. [Google Scholar] [CrossRef]
- Dang, A.N.; Jackson, B.M.; Benavidez, R.; Tomscha, S.A. Review of Ecosystem Service Assessments: Pathways for Policy Integration in Southeast Asia. Ecosyst. Serv. 2021, 49, 101266. [Google Scholar] [CrossRef]
Figure 1.
Location of the study area (ESRI base map).

Figure 2.
Framework and workflow of the study.

Figure 3.
Identified inland and shoreline landscape areas and their classification in landscape types.
Figure 3.
Identified inland and shoreline landscape areas and their classification in landscape types.

Figure 4.
Aggregated value of landscape qualities in inland landscape areas (darker color—higher value).
Figure 4.
Aggregated value of landscape qualities in inland landscape areas (darker color—higher value).

Figure 5.
Aggregated value of landscape qualities in shoreline landscape areas (dark green color—very high value; light green—high value; orange—medium value).
Figure 5.
Aggregated value of landscape qualities in shoreline landscape areas (dark green color—very high value; light green—high value; orange—medium value).

Figure 6.
Mean ratings of the perceived well-being benefits based on the survey results. Values of the rating scale: 1—completely disagree, 2—partially disagree, 3—partially agree, 4—completely agree. For full statements included in the survey see Table 4—numbers in brackets correspond to table column “Statement No”.

Figure 7.
Mean ratings including Standard deviation (SD) of the factors that influence the choice of coastal recreation site. Values of the rating scale: 1—completely unimportant, 2—minor importance, 3—important but not decisive, 4—very important.
Figure 7.
Mean ratings including Standard deviation (SD) of the factors that influence the choice of coastal recreation site. Values of the rating scale: 1—completely unimportant, 2—minor importance, 3—important but not decisive, 4—very important.

Figure 8.
Landscape based solutions for sustainable tourism development: colors indicate areas of specific value and the striped pattern—areas with underused recreational potential.
Figure 8.
Landscape based solutions for sustainable tourism development: colors indicate areas of specific value and the striped pattern—areas with underused recreational potential.

Table 1.
Landscape quality assessment criteria and indicators and related CES (according to CICES v.5.1 [50]).
Table 1.
Landscape quality assessment criteria and indicators and related CES (according to CICES v.5.1 [50]).
| CICES Code | Landscape Quality Criteria | Domain | Indicators | Abbreviations of Indicator |
|---|---|---|---|---|
| 3.1.2.4 | Landscape aesthetic quality (LAQ) | Land | Openness of landscape | LAQ_open |
| Land/Shore | Scenic views | LAQ_views | ||
| Land/Shore | Attractive landscape elements (inland: gardens, alleys, farmstead clusters, fishermen villages, small forest patches; shoreline: fishermen boats, ships, yacht, big stones/rocks) | LAQ_attr.el. | ||
| Land | Share of scenically attractive roads | LAQ_roads | ||
| Land/Shore | Visual pollution and degrading elements (abandoned sites, demolished buildings) | LAQ_vis.pol. | ||
| 3.1.2.4 | Uniqueness of the landscape (UN) | Land/Shore | Unique landscapes on a national/regional scale | UN_unique |
| 3.1.2.4 | Landscape diversity (LD) | Land | Diversity of land use types | LD_land.use |
| Shore | Shoreline diversity depending on its character (bays, capes etc.) and exposition | LD_shoreline | ||
| Land/Shore | Small-scale landscape elements (inland: rows of trees/alleys, single large trees, piles of stones; shoreline: lighthouses, piers, ships, boats, rocks, fallen/washed out trees) | LD_small.el. | ||
| Land | Settlement structure | LD_settl.str. | ||
| 3.1.1.2. | Landscape naturalness (LN) | Land | Presence of natural microrelief | LN_micro.rel. |
| Land | Naturalness of water streams and rivers | LN_water | ||
| Land | Share of semi-natural habitats | LN_habitat | ||
| Shore | Share of natural shoreline stretches | LN_shoreline | ||
| Land/Shore | Share of protected areas | LN_prot.area | ||
| Land | Presence of industrial objects (big agroindustry farms, wind-parks etc.) | LN_industr. | ||
| 3.1.2.3 | Cultural heritage (CH) | Land/Shore | Number of cultural history monuments | CH_No.mon. |
| Land | Diversity of cultural history monuments | CH_div.mon. | ||
| Shore | Presence of traditional land/sea use practices (e.g., fishing) in the landscape | CH_trad.use | ||
| Land | Presence of historical spatial structures (traditional landscape, historical roads or their sections, old villages, historic distribution pattern of farmsteads) | CH_sp.str. | ||
| Land/Shore | Visually outstanding cultural history objects (manor houses, churches, mills, bridges, mounds, fishing villages, lighthouses etc.) | CH_outst.ob. | ||
| 3.1.1.1 | Recreation potential (RP) | Land/Shore | Density of tourism attractions/objects | RP_den.tour.ob |
| Land | Accommodation possibilities | RP_accom. | ||
| Land | Presence of nature parks, national parks and nature monuments | RP_nat.park | ||
| Land/Shore | Diversity of tourism infrastructure | RP_div.tour.inf. | ||
| Land | Cycling Routes | RP_cycling | ||
| Land/Shore | Accessibility | RP_access | ||
| Shore | Number of visitors | RP_visitors |
Table 2.
Correlation matrix of landscape quality indicators in shoreline landscape, with cells highlighted in green indicating strong positive correlations (r > 0.5) and cells highlighted in red indicating strong negative correlations (r < −0.5).
Table 2.
Correlation matrix of landscape quality indicators in shoreline landscape, with cells highlighted in green indicating strong positive correlations (r > 0.5) and cells highlighted in red indicating strong negative correlations (r < −0.5).
| LAQ views | LAQ Attr.el. | LAQ vis.pol. | UN unique | LD shoreline | LD small.el. | LN shoreline | LN prot.area | CH No.mon. | CH. trad.use | CH outst.ob. | RP den.tour.ob | RP div.tour.inf. | RP access. | RP visitors | |
|---|---|---|---|---|---|---|---|---|---|---|---|---|---|---|---|
| LAQ_views | 1 | ||||||||||||||
| LAQ_attr.el. | 0.33 | 1 | |||||||||||||
| LAQ_vis.pol. | 0.41 | −0.31 | 1 | ||||||||||||
| UN_unique | 0.63 | 0.37 | 0.22 | 1 | |||||||||||
| LD_shoreline | 0.44 | 0.76 | −0.01 | 0.57 | 1 | ||||||||||
| LD_small.el. | 0.30 | 0.89 | −0.30 | 0.49 | 0.78 | 1 | |||||||||
| LN_shoreline | −0.25 | −0.70 | 0.33 | −0.51 | −0.57 | −0.79 | 1 | ||||||||
| LN_prot.area | −0.22 | −0.29 | 0.34 | −0.44 | −0.20 | −0.41 | 0.57 | 1 | |||||||
| CH_No.mon. | 0.15 | 0.25 | 0.02 | 0.20 | 0.21 | 0.47 | −0.39 | 0.11 | 1 | ||||||
| CH_trad.use | 0.36 | 0.32 | 0.31 | 0.20 | 0.38 | 0.45 | −0.13 | 0.26 | 0.58 | 1 | |||||
| CH_outst.ob. | 0.22 | 0.58 | −0.37 | 0.11 | 0.45 | 0.62 | −0.75 | −0.43 | 0.30 | −0.05 | 1 | ||||
| RP_den.tour.ob | 0.44 | 0.20 | 0.25 | 0.20 | 0.49 | 0.39 | −0.17 | −0.01 | 0.45 | 0.39 | 0.41 | 1 | |||
| RP_div. tour.inf. | 0.44 | 0.27 | 0.24 | 0.18 | 0.47 | 0.40 | −0.28 | −0.11 | 0.42 | 0.29 | 0.50 | 0.92 | 1 | ||
| RP_access | 0.23 | 0.23 | 0.04 | 0.11 | 0.32 | 0.37 | −0.04 | −0.38 | −0.03 | 0.03 | 0.29 | 0.64 | 0.58 | 1 | |
| RP_visitors | 0.028 | 0.21 | 0.05 | −0.07 | 0.46 | 0.26 | −0.06 | 0.02 | −0.04 | −0.03 | 0.38 | 0.68 | 0.65 | 0.75 | 1 |
Table 3.
Correlation matrix of landscape quality indicators in inland landscape areas, with cells highlighted in green indicating strong positive correlations (r > 0.5) and cells highlighted in red indicating strong negative correlations (r < −0.5).
Table 3.
Correlation matrix of landscape quality indicators in inland landscape areas, with cells highlighted in green indicating strong positive correlations (r > 0.5) and cells highlighted in red indicating strong negative correlations (r < −0.5).
| LAQ_open | LAQ_views | LAQ_attr.el. | LAQ_roads | LAQ_vis.pol. | UN_unique | LD_land.use | LD_small.el | LD_settl.str. | LN_micro.rel. | LN_water | LN_habitat | LN_prot.area | LN_industr. | CH_no.mon. | CH_div.mon. | CH_sp.str. | CH_outst.ob. | RP_den.tour.ob | RP_accom. | RP_nat.park | RP_div.tour.ob | RP_cycling | RP_access | |
| LAQ_open | 1.00 | |||||||||||||||||||||||
| LAQ_views | 0.06 | 1.00 | ||||||||||||||||||||||
| LAQ_attr.el. | 0.13 | 0.75 | 1.00 | |||||||||||||||||||||
| LAQ_roads | 0.35 | 0.42 | 0.33 | 1.00 | ||||||||||||||||||||
| LAQ_vis.pol. | −0.44 | −0.10 | −0.10 | −0.41 | 1.00 | |||||||||||||||||||
| UN_unique | 0.09 | 0.20 | 0.44 | 0.17 | −0.29 | 1.00 | ||||||||||||||||||
| LD_land.use | 0.36 | 0.16 | 0.10 | 0.13 | −0.43 | −0.13 | 1.00 | |||||||||||||||||
| LD_small.el | 0.16 | 0.54 | 0.69 | 0.39 | −0.41 | 0.65 | 0.08 | 1.00 | ||||||||||||||||
| LD_settl.str. | 0.33 | 0.24 | 0.34 | 0.60 | −0.63 | 0.44 | 0.27 | 0.55 | 1.00 | |||||||||||||||
| LN_micro.rel. | 0.25 | 0.58 | 0.37 | 0.15 | 0.00 | 0.13 | 0.03 | 0.18 | −0.05 | 1.00 | ||||||||||||||
| LN_water | −0.39 | 0.12 | 0.20 | −0.22 | 0.38 | −0.05 | −0.34 | −0.08 | −0.30 | 0.31 | 1.00 | |||||||||||||
| LN_habitat | −0.17 | 0.33 | 0.34 | −0.20 | 0.11 | 0.10 | −0.03 | 0.19 | −0.17 | 0.42 | 0.41 | 1.00 | ||||||||||||
| LN_prot.area | 0.12 | 0.04 | 0.23 | −0.23 | 0.17 | 0.14 | −0.01 | 0.05 | −0.24 | 0.19 | 0.21 | 0.64 | 1.00 | |||||||||||
| LN_industr. | −0.44 | 0.00 | −0.07 | −0.21 | 0.65 | −0.26 | −0.27 | −0.32 | −0.47 | 0.31 | 0.44 | 0.14 | 0.25 | 1.00 | ||||||||||
| CH_no.mon. | 0.22 | 0.21 | 0.14 | 0.47 | −0.40 | 0.31 | 0.18 | 0.30 | 0.40 | 0.21 | −0.23 | −0.10 | −0.05 | −0.19 | 1.00 | |||||||||
| CH_div.mon. | 0.25 | 0.38 | 0.34 | 0.45 | −0.35 | 0.36 | −0.01 | 0.40 | 0.44 | 0.21 | −0.10 | −0.01 | −0.08 | −0.32 | 0.69 | 1.00 | ||||||||
| CH_sp.str. | −0.01 | 0.65 | 0.74 | 0.21 | −0.22 | 0.42 | 0.13 | 0.71 | 0.36 | 0.39 | 0.21 | 0.37 | 0.16 | −0.10 | 0.13 | 0.20 | 1.00 | |||||||
| CH_outst.ob. | 0.02 | 0.46 | 0.49 | 0.36 | −0.32 | 0.40 | 0.13 | 0.55 | 0.55 | 0.12 | 0.01 | 0.07 | −0.26 | −0.31 | 0.33 | 0.51 | 0.44 | 1.00 | ||||||
| RP_den.tour.ob | 0.03 | 0.50 | 0.60 | 0.24 | −0.13 | 0.51 | −0.02 | 0.65 | 0.33 | 0.29 | 0.02 | 0.48 | 0.24 | −0.17 | 0.28 | 0.29 | 0.55 | 0.48 | 1.00 | |||||
| RP_accom. | 0.16 | 0.41 | 0.46 | 0.35 | −0.33 | 0.63 | 0.12 | 0.79 | 0.57 | 0.07 | −0.13 | 0.13 | −0.04 | −0.30 | 0.37 | 0.40 | 0.52 | 0.58 | 0.62 | 1.00 | ||||
| RP_nat.park | 0.02 | 0.25 | 0.30 | 0.16 | 0.12 | 0.17 | −0.14 | 0.24 | −0.09 | 0.26 | 0.26 | 0.36 | 0.51 | 0.17 | 0.35 | 0.24 | 0.18 | 0.18 | 0.40 | 0.21 | 1.00 | |||
| RP_div.tour.ob | 0.08 | 0.57 | 0.65 | 0.21 | −0.10 | 0.26 | −0.01 | 0.64 | 0.20 | 0.19 | 0.16 | 0.33 | 0.14 | −0.10 | 0.12 | 0.27 | 0.57 | 0.64 | 0.51 | 0.45 | 0.44 | 1.00 | ||
| RP_cycling | −0.04 | 0.40 | 0.43 | 0.31 | −0.11 | 0.47 | 0.00 | 0.55 | 0.39 | 0.28 | 0.00 | 0.20 | −0.03 | −0.09 | 0.21 | 0.33 | 0.24 | 0.63 | 0.60 | 0.57 | 0.26 | 0.42 | 1.00 | |
| RP_access | 0.08 | 0.49 | 0.61 | 0.15 | −0.25 | 0.36 | 0.03 | 0.65 | 0.28 | 0.15 | 0.00 | 0.29 | 0.12 | −0.22 | 0.15 | 0.30 | 0.57 | 0.62 | 0.52 | 0.42 | 0.22 | 0.86 | 0.42 | 1.00 |
Table 4.
Results of perceived well-being benefit assessment.
| Well-Being Dimension | State-Ment No. | Statement Included in the Survey | No of Responses (Excl. “I Don’t Know”) | Mean | p-Value | |
|---|---|---|---|---|---|---|
| Health and life satisfaction | 1 | Visiting the Southwestern Kurzeme coastal area provides me with an opportunity to relax and clarify my thoughts | Locals | 87 | 3.506 | <0.001 |
| Visitors | 564 | 3.041 | ||||
| Health and life satisfaction | 2 | I feel healthier, more energetic after visiting the Southwestern Kurzeme coastal area | Locals | 86 | 3.512 | <0.001 |
| Visitors | 546 | 3.046 | ||||
| Financ./ material security | 3 | The natural resources provided by the Southwestern Kurzeme coastal area significantly contribute to my financial well-being (my work is related to the coast—hospitality, fishing, tourism, etc.) | Locals | 79 | 2.051 | 0.002 |
| Visitors | 564 | 1.711 | ||||
| Financ./ material security | 4 | The opportunity to fish, pick berries, mushrooms and other goods for self-consumption on the Southwestern Kurzeme coastal area is important for me | Locals | 87 | 3.540 | <0.001 |
| Visitors | 546 | 2.489 | ||||
| Social relations | 5 | The Southwestern Kurzeme coastal area plays a crucial role in my social life: I spend time with my family and/or friends here, engage in social activities | Locals | 87 | 3.264 | <0.001 |
| Visitors | 543 | 2.223 | ||||
| Education | 6 | Exploring the Southwestern Kurzeme coastal area has enabled me to acquire new knowledge (e.g., about nature, the sea) | Locals | 81 | 3.136 | <0.001 |
| Visitors | 537 | 2.784 | ||||
| Leisure | 7 | The Southwestern Kurzeme coastal area holds a significance for me in terms of recreation opportunities | Locals | 86 | 3.651 | <0.001 |
| Visitors | 579 | 2.926 | ||||
| Safety and sense of security | 8 | The role of the Southwestern Kurzeme coastal area in strengthening the national military security holds importance for me | Locals | 70 | 2.457 | 0.095 |
| Visitors | 485 | 2.233 | ||||
| Safety and sense of security | 9 | The potential energy independence that can be achieved through the establishment of wind farms along the Southwestern Kurzeme coastal area is vital for me | Locals | 79 | 2.734 | 0.376 |
| Visitors | 516 | 2.659 | ||||
| Safety and sense of security | 10 | The Southwestern Kurzeme coastal area provides me with a sense of security—I feel protected from the effects of climate change, natural disasters (storms, floods etc.) | Locals | 78 | 2.808 | <0.001 |
| Visitors | 470 | 2.398 | ||||
| Ecological content-ment | 11 | I hold the nature diversity of the Southwestern Kurzeme coastal area in high regard, and its preservation brings me a sense of satisfaction | Locals | 86 | 3.547 | <0.001 |
| Visitors | 590 | 3.197 | ||||
Table 5.
The number of mapped and described locations suitable for conducting identified socio-cultural activities in the study areas.
Table 5.
The number of mapped and described locations suitable for conducting identified socio-cultural activities in the study areas.
| Socio-Cultural Activities | No of PGIS Points in the Study Area |
|---|---|
| Enjoying landscape/seascape | 73 |
| Hiking and walking | 70 |
| Relaxation by the sea | 60 |
| Overnighting | 31 |
| Bird watching | 28 |
| Exploring cultural history | 27 |
| Fishing | 26 |
| Public entertainment events | 25 |
| Sports | 19 |
| Water sports | 18 |
| Yacht and boat docks | 14 |
| Jet skis | 12 |
| Hunting | 3 |
Table 6.
Recommendations to planners for sustainable coastal tourism development.
| Cluster | Characteristics of the Cluster | Recommendations |
|---|---|---|
| Areas of high aesthetic value | scenic views, open landscape with attractive landscape elements and roads, no visual pollution | Landscape experts should be involved in identification of valuable landscapes and integration of the landscape qualities in spatial planning/development documents. Access to the attractive landscape sites/scenic views should be improved, including suitable public infrastructure and information for tourism marketing. |
| Areas of high naturalness value | high share of protected areas, natural or semi-natural land cover and natural (not modified) streams | Nature experts should be involved in assessment of anthropogenic pressure and developing measures for risk prevention as well as ensure appropriate integration of the nature values in the spatial planning/development documents. Suitable public infrastructure should be developed or improved for reducing anthropogenic pressure to vulnerable habitats and species, not contrasting with landscape character, and including nature education elements |
| Areas of high cultural heritage value | high number and diversity of cultural heritage monuments, historic land use features and visually impressive historic objects | Cultural heritage experts should be involved in identification of cultural heritage values and ensuring their appropriate integration in the spatial planning/development documents. Action plans should be developed for better integration of cultural heritage in tourism offer. Connection between nature and cultural heritage should be highlighted (e.g., coastal meadows, grey dunes etc.). Public infrastructure should be harmonic with the cultural historic identity of the site. |
Disclaimer/Publisher’s Note: The statements, opinions and data contained in all publications are solely those of the individual author(s) and contributor(s) and not of MDPI and/or the editor(s). MDPI and/or the editor(s) disclaim responsibility for any injury to people or property resulting from any ideas, methods, instructions or products referred to in the content. |
© 2024 by the authors. Licensee MDPI, Basel, Switzerland. This article is an open access article distributed under the terms and conditions of the Creative Commons Attribution (CC BY) license (https://creativecommons.org/licenses/by/4.0/).
Share and Cite
MDPI and ACS Style
Veidemane, K.; Reke, A.; Ruskule, A.; Vinogradovs, I. Assessment of Coastal Cultural Ecosystem Services and Well-Being for Integrating Stakeholder Values into Coastal Planning. Land 2024, 13, 362. https://doi.org/10.3390/land13030362
AMA Style
Veidemane K, Reke A, Ruskule A, Vinogradovs I. Assessment of Coastal Cultural Ecosystem Services and Well-Being for Integrating Stakeholder Values into Coastal Planning. Land. 2024; 13(3):362. https://doi.org/10.3390/land13030362
Chicago/Turabian StyleVeidemane, Kristina, Agnese Reke, Anda Ruskule, and Ivo Vinogradovs. 2024. "Assessment of Coastal Cultural Ecosystem Services and Well-Being for Integrating Stakeholder Values into Coastal Planning" Land 13, no. 3: 362. https://doi.org/10.3390/land13030362
Note that from the first issue of 2016, this journal uses article numbers instead of page numbers. See further details here.