

Spatial and Temporal Changes in Soil Freeze-Thaw State and Freezing Depth of Northeast China and Their Driving Factors

College of Geography and Ocean Sciences, Yanbian University, Yanji 133000, China
*
Author to whom correspondence should be addressed.
Land 2024, 13(3), 368; https://doi.org/10.3390/land13030368
Submission received: 25 January 2024
/
Revised: 11 March 2024
/
Accepted: 12 March 2024
/
Published: 14 March 2024
(This article belongs to the Topic Climate Change and Environmental Sustainability, 3rd Volume)
Abstract
:It is necessary to further investigate the spatial considerations, temporal characteristics, and drivers of change affecting the beginning and end of soil freezing and thawing, including the maximum depth of the seasonal freezing (MDSF) and the active layer thickness (ALT) in Northeast China. Hourly soil temperature, among other data, from 1983–2022 were investigated, showing a delay of about 6 days in freezing. In contrast, thawing and complete thawing advanced by about 26 and 20 d, respectively. The freezing period and total freeze-thaw days decreased by about 29 and 23 days, respectively. The number of complete thawing period days increased by about 22 days, while the MDSF decreased by about 25 cm. The ALT increased by about 22 cm. Land Surface Temperature (LST) is the main factor influencing the beginning and end of soil freezing and thawing, MDSF and ALT changes in Northeast China; air temperature, surface net solar radiation, and volumetric soil water content followed. The influence of the interacting factors was greater than the single factors, and the interactive explanatory power of the LST and surface net solar radiation was highest when the soil started to freeze (0.858). The effect of the LST and the air temperature was highest when the soil was completely thawed (0.795). LST and the volumetric soil water content interacted to have the first explanatory power for MDSF (0.866) and ALT (0.85). The results of this study can provide scientific reference for fields such as permafrost degradation, cold zone ecological environments, and agricultural production in Northeast China.
1. Introduction
The soil (rock) layers on the surface of the earth’s crust that freeze in the cold season and thaw in the warm season yearly are known as the seasonal freezing and thawing layers, respectively. In the permafrost zone, the near-surface layer above the permafrost layer and at a certain depth below the surface, which thaws in the warm season and completely refreezes in the cold season, is called the active layer. The maximum thawing depth at the end of thawing season is also regarded as the active layer thickness (ALT) [1]. The shallow layer of non-frozen soil below, formed by heat exchange at the surface under the negative temperature condition in the cold season, is the seasonally frozen layer, i.e., seasonally frozen soil [2,3]. Under the influence of global warming, the temperature of the permafrost layer has increased, the ALT has increased, the maximum depth of the seasonal freezing (MDSF) has decreased, and the soil freeze-thaw state has changed significantly [4]. Changes in the soil freeze-thaw state may alter surface albedo and thermal conductivity, affecting surface energy transfer and leading to changes in regional hydrological processes, vegetation growth, and soil microbiological processes [5]. Degrading frozen soil can lead to damaged infrastructure such as railroads and highways, with phenomena such as uneven roadbed settlement and reduced slope stability observed in some areas [6]. Frozen soil degradation has resulted in the emission of large amounts of decomposed soil organic carbon into the atmosphere, exacerbating climate warming and causing a range of adverse environmental impacts [7]. Regarding agricultural production, altered soil freeze-thaw cycles can disrupt the soil structure and increase erodibility, resulting in the loss of land resources [8]. Additionally, such changes have been shown to lengthen the growing period of crops and aggravate crop pests and diseases, reducing the amount of food produced and limiting the daily income of farmers [9]. Therefore, it is important to study the spatial and temporal variations of the soil freeze-thaw state, the permafrost degradation, and the influence mechanisms behind them.
Northeast China is located at the southern edge of the permafrost in Eurasia, which is the second largest permafrost area in China [10]. The fragile storage conditions and poor thermal stability of the frozen soil in this region render it vulnerable to changes in the climate and external environment, resulting in a typical climate-fragile region that is particularly sensitive to the effects of climate warming [7]. The soil freeze-thaw state and frozen soil changes in Northeast China over the past few years has been previously investigated. Xu et al. [5] used observational data to find significant changes in the first day of soil freezing, the thawing day, and the MDSF in the Heilongjiang Province, the results of which also suggested that the differences were significant for different land-use types, such as forests or grassland. Chao et al. [11] used frozen soil data from 143 observation stations in Northeast China to indicate that the first day of soil freezing in Northeast China generally occurs from October to November, with complete thawing occurring from March to May and a freezing period ranging from 97–290 days. The study also indicated an average decrease of 7.0 cm per decade in the MDSF, and an investigation of the effect that air temperature has on the freezing depth was conducted. Long-term monitoring of the permafrost area in the northern Da Xing’anling Mountains by Chang et al. [10] using boreholes, snow characteristic observation, and active layer temperature and moisture monitoring, indicated that vegetation, the snowpack, and other factors impact permafrost. Chen et al. [12] analyzed the interannual soil moisture variation in the Northeast of China’s permafrost region using the European Centre for Medium-Range Weather Forecasts Interim Reanalysis soil moisture data and meteorological data, the results of which showed a decreasing trend in the average annual soil moisture at depths of 7 and 28 cm for Northeast China’s permafrost region, with the lowest value observed in 2008. Gong et al. [13] used freezing depth measurements from meteorological stations and statistical modeling to refine the spatial and temporal characteristics of ground temperature and freezing depth in Northeast China, the results of which indicated that the ground temperature decreases by approximately 1 °C for every two degrees of latitude in the northerly direction and that the average annual MDSF is increased by about 30 cm as a result.
Although previous researchers have studied the soil freeze-thaw state and the frozen soil in Northeast China from different perspectives, investigations have mostly focused on localized areas or have analyzed a certain, single element, such as soil freezing and thawing, ground temperature, or freezing depth. Research on such influencing factors has mainly dealt with common climatic factors and is not sufficiently comprehensive. There are different types of frozen soil in Northeast China, and the specific conditions vary greatly, but previous studies in Northeast China have rarely distinguished between seasonally frozen soil and permafrost. Changes in soil freezing and thawing and permafrost degradation affects regional environmental security, agricultural and forestry production, and human life. Therefore, the study of their spatial and temporal variations and driving mechanisms is of great significance for both regional ecological security and agricultural production practices.
The objectives of this study were (1) to analyze the characteristics of spatial and temporal variation in the first freezing day, first thawing day, complete thawing day, freeze period days, total freeze-thaw days, complete thaw period days, the MDSF, and the ALT over the last 40 years; and (2) to analyze the effects of temperature, precipitation, Digital Elevation Model (DEM), Normalized Difference Vegetation Index (NDVI), volumetric soil water content, surface net solar radiation, snow depth, and Land Surface Temperature (LST) on the soil freeze-thaw state, MDSF, and ALT. This study is expected to provide guidance and reference for ecological security and agroforestry production management in cold regions.
2. Materials and Methods
2.1. Study Area
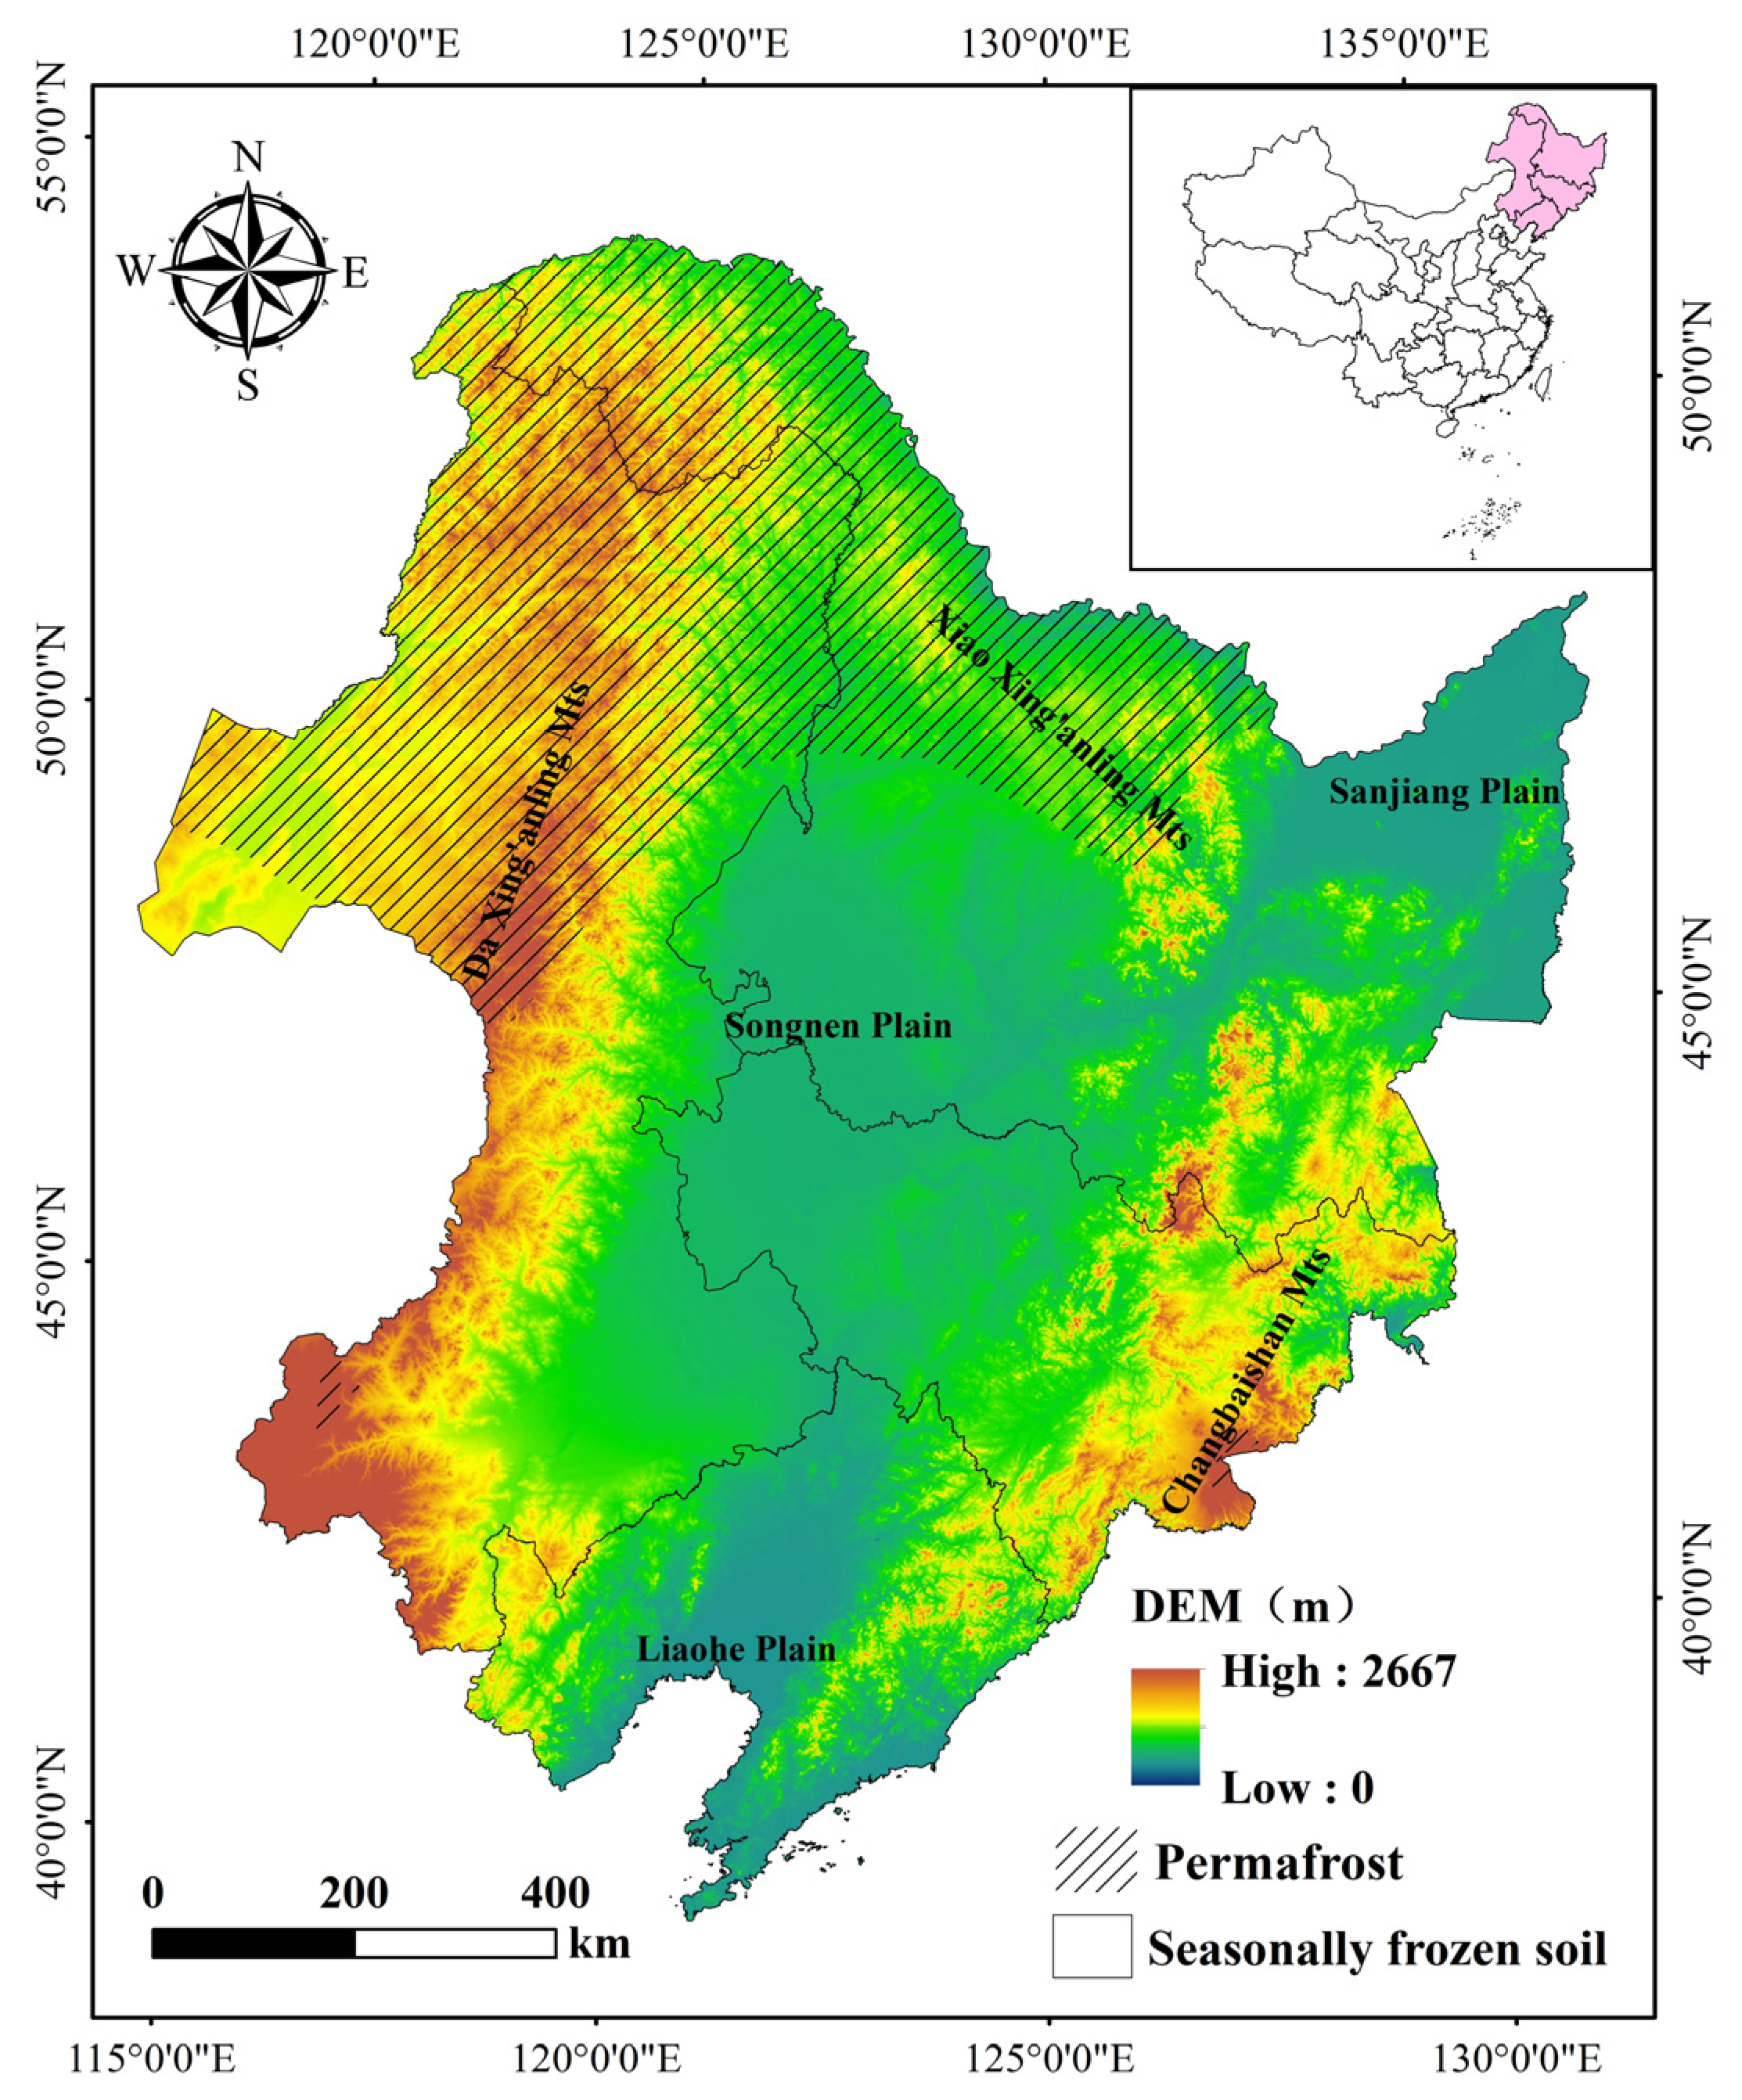
Northeast China is located between 115°3′–135°02′ E in longitude and 38°43′–53°36′ N in latitude, with a total area of 1,243,000 km2 [14] mainly encompassing the provinces of Heilongjiang, Jilin, and Liaoning, and the four leagues of Hulunbeier, Xing’an, Tongliao, and Chifeng in the eastern part of the Inner Mongolia Autonomous Region [15] (Figure 1). The region straddles mesothermal and cold temperate zones from south to north, with long, cold winters and warm, short summers; it is associated with complex and varied topography with the Changbai Mountains to the east, Xiao Xing’anling Mountains to the north, and Da Xing’anling Mountains to the west, and a vast plain in the center that shows an average elevation of less than 300 m above sea level [16]. The soil in the study area is particularly fertile and is important for commercial grain production. In recent years, significant warming, high climate variability, and frequent meteorological disasters in Northeast China have indicated that it is a typical climate-vulnerable area that is highly sensitive to the effects of climate warming. Northeastern China is located on the southern edge of the permafrost zone in the Eurasian continent and is the second-largest permafrost distribution area in China [17]. To better elucidate the frozen soil circumstances in the region, the “1:4 million Map of Snow, Ice, and Frozen Ground in China” released by National Cryosphere Desert Data Center (http://www.ncdc.ac.cn, accessed on 19 October 2023) [18], Northeast China was divided into permafrost and seasonally frozen soil zones.
2.2. Data Sources and Applicability
The hourly reanalysis soil temperature and the total soil water content ratio data used in this study were obtained from the fifth generation of the European Re-Analysis Land (ERA5-LAND) dataset that is provided by the European Center for Medium-Range Weather Forecasts [19], which are reanalysis data that use the Ensemble-4Dvar assimilation scheme [20]. Monthly air temperature data with a spatial resolution of 9 km and a single-layer hourly dataset with a temporal resolution of 1 h were selected, with data describing the soil temperature and total soil water content ratio in the first layer (0–7 cm). The spatial deviation in the ERA5-LAND air temperature data is within −2.0–2.0 °C compared to those obtained in the field, with a temporal deviation within −0.26–0.16 °C and a correlation coefficient greater than 0.9. The obtained soil temperature (0–7 cm) showed a spatial deviation of −0.34 °C and a temporal deviation of −1.2–0.4 °C compared to that obtained in the field, with correlation coefficients greater than 0.8 [21]. The deviation of the volumetric soil water content from the actual data was 0.011 with a root mean square error of 0.026 [22]. In addition, the ERA5-LAND snow scheme improves the calculation of the snow cover fraction and snow surface albedo, introducing a new parameter, snow liquid water, and a new parameterization scheme for snow density, increasing the snow insulation effect and reducing the negative bias generally observed for the soil temperature under snow [23]. ERA5-LAND is particularly applicable for use in Northeast China and Inner Mongolia, with the ERA5-LAND reanalysis data revealing the actual distribution characteristics and quantitative values of the soil and air temperatures obtained in the region [21]. Data describing the precipitation, volumetric soil water content, surface net solar radiation, and snow depth were derived with a spatial resolution of 9 km. Monthly NDVI data for 1983–2000 and 2001–2022 were also obtained from the National Earth System Science Data Centre (http://www.geodata.cn, accessed on 15 October 2023) at spatial resolutions of 5 and 1 km, respectively. DEM data were obtained from the Geospatial Data Cloud website (https://www.gscloud.cn, accessed on 15 October 2023) at a spatial resolution of 90 m. Daily LST data were obtained from the National Tibetan Plateau Data Centre (https://data.tpdc.ac.cn, accessed on 1 March 2024) at a spatial resolution of 1 km. Soil data were obtained from the Harmonized World Soil Database (HWSD) constructed by the Food and Agriculture Organization (United Nations) and the International Institute for Applied Systems Analysis in Vienna. Data were also sourced from the Nanjing Soil Institute, which performed the second national land survey in China, with 1:1 million soil datapoints used to obtain information about the soil dry bulk density and soil texture classification.
2.3. Methods
2.3.1. Determination of Soil Freeze-Thaw Thresholds
The daily minimum and maximum soil temperatures are generally used as thresholds to define soil freezing and thawing [24]. Generally, a daily freeze-thaw cycle will occur should the daily maximum soil temperature be >0 °C, and the daily minimum is <0 °C, i.e., should the soil freeze at night and thaw during the day [25]. Therefore, this paper used a soil temperature of 0 °C as the threshold for judging soil freeze-thaw. Simultaneously, the possibility that the minimum and maximum soil temperatures may be >0 °C following the first daily freeze-thaw cycle is also considered. Therefore, to avoid the influence of random weather, the start and end of freezing and thawing is defined as the point at which the daily freeze-thaw cycle has lasted for 3 days. The first day upon which this condition is fulfilled is recorded as the starting time [24].
2.3.2. Procesing of Soil Temperature Data and Classification of Freeze-Thaw Phases
In this study, based on the hour-by-hour soil temperature data from 0–7 cm, every 10 years were divided into one period, and the minimum soil temperature and maximum soil temperature values were obtained by climate data operators for five periods in 1983, 1993, 2003, 2013, and 2022. To ensure the continuity of the soil freezing and thawing process, the first and last days of frozen soil were obtained according to the selection criteria from the Central Meteorological Administration’s “Specification for Surface Meteorological Observation-General (http://www.cma.gov.cn, accessed on 9 October 2023) [26]”, in which the freezing year is defined as the period from September 1 of the current year to August 31 of the following year [27]. The onset of soil freezing in Northeast China generally occurs after September; thus, in this study, the first day on which the maximum soil temperature is greater than 0 °C and the minimum is less than 0 °C is regarded as the first freezing day (FFD), and the first day upon which the maximum soil temperature is greater than 0 °C and the minimum is less than 0 °C between January 1 and August 31 of the following year is considered the first thawing day (FTD). The first day on which the maximum and minimum soil temperatures are both greater than 0 °C is defined as the complete thawing day (CTD). The freeze period days (FPDs) are the number of days between FFD and FTD, and the total freeze-thaw days (TFTDs) represent the number of days between FPD and CTD. The complete thaw period days (CTPDs) are the number of days from the CTD to the FFD in the next freeze year. For ease of handling and presentation, the freeze-thaw start and end dates are expressed as a sequence of days in each calendar year.
2.3.3. Stefan Solution
Stefan’s equation is used to link changes in the surface temperature with the freezing and thawing of the soil layer via a simple formula, which greatly simplifies the analysis and calculation of the freezing and thawing processes of soil. Its reliability and ease of use have rendered the equation one of the most commonly used methods for simulating freezing and thawing [28]. The equation fully considers the climatic conditions, soil thermal properties, and moisture conditions, with few input parameters, a simple form, and a good simulation effect, and it can be used to simulate the depth of freezing and thawing on a single point, as well as the spatial distribution of the thickness of the active layer on large scales [29]. Stefan’s formula was therefore used in this study to simulate MDSF and ALT in Northeast China [4,30]:
where MDSF is the maximum depth of the seasonal freezing (m); ALT is the active layer thickness (m); DDT and DDF are the annual freezing and thawing indexes (°C·d/a); Nf and Nt are the N-factor and refer to the ratio of the ground freezing index to the air freezing index and the ratio of the ground thawing index to the air thawing index, respectively; Kf is the heat transfer coefficient of frozen soil; Kt is the heat transfer coefficient of thawed soil (W·m−1·°C −1); Pb is the dry bulk density (kg·m−3); L represents the latent heat of melting of ice (3.3 × 10⁵ J·kg−1); W represents the total water content ratio of the soil (%); and Wu represents the unfrozen water rate (5%). This study selected the soil temperature and total soil water content ratio from the ERA5-LAND single-layer hourly dataset, the dry bulk density of the soil was mainly in accordance with information from the HWSD database, and the thermal conductivity of the soil was determined in conjunction with the “GB50324-2014” [31].
2.3.4. Theil-Sen Median Trend Analysis and Mann-Kendall Testing
The use of Theil-Sen median trend analysis in conjunction with the Mann-Kendall test has become a well-established method for long-term series analysis [32]. This method has several advantages over linear regression analysis: Data samples are not required to follow a specific distribution and are less susceptible to outliers, and measurement errors or anomalous data can be avoided [33]. The equation used is as follows:
Positive/negative slopes indicate an upward/downward trend.
The Mann–Kendall test was used to judge the significance of the trend. With reference to previous studies [34], trend significance judgment was carried out at a 0.05 confidence level (|Z| ≥ 1.96). Combined with the trend analysis results, the results were classified into five trend change levels: significant decrease (advance) (slope < −0.0005,|Z| ≥ 1.96), slight decrease (advance) (slope < −0.0005, |Z| < 1.96), relative stability (|slope| < 0.0005,|Z| < 1.96), slight increase (delay) (slope > 0.0005, |Z| < 1.96), and significant increase (delay) (slope > 0.0005,|Z| ≥ 1.96). Further details concerning the basic principle calculation formula can be found in the existing literature [35].
2.3.5. GeoDetector
GeoDetector is a set of statistical methods that are used to detect spatial dissimilarity and reveal its driving forces. The core idea is based on the assumption that if an independent variable has a significant effect on the dependent variable, the spatial distributions of the two variables should be similar [36]. In this study, factor probes and interaction probes were used to analyze the drivers leading to soil freeze-thaw initiation and termination and the freezing depth in the study area.
The magnitude of a factor detector, which is used to detect the spatial dissimilarity of the dependent variable Y and the influence of factor X on the spatial distribution of the dependent variable Y, can be measured using a q-value (0 ≤ q ≤ 1) [36], with a q value close to 1 indicating greater influence for a particular factor.
Interaction detectors can be used to identify whether the effects of interaction between different factors such as freezing, thawing, or freezing depth, can be enhanced, diminished, or be independent compared to the single factor. These interactions are listed in Table 1.
3. Results
3.1. Spatial and Temporal Distribution of the FFD, FTD and CTD
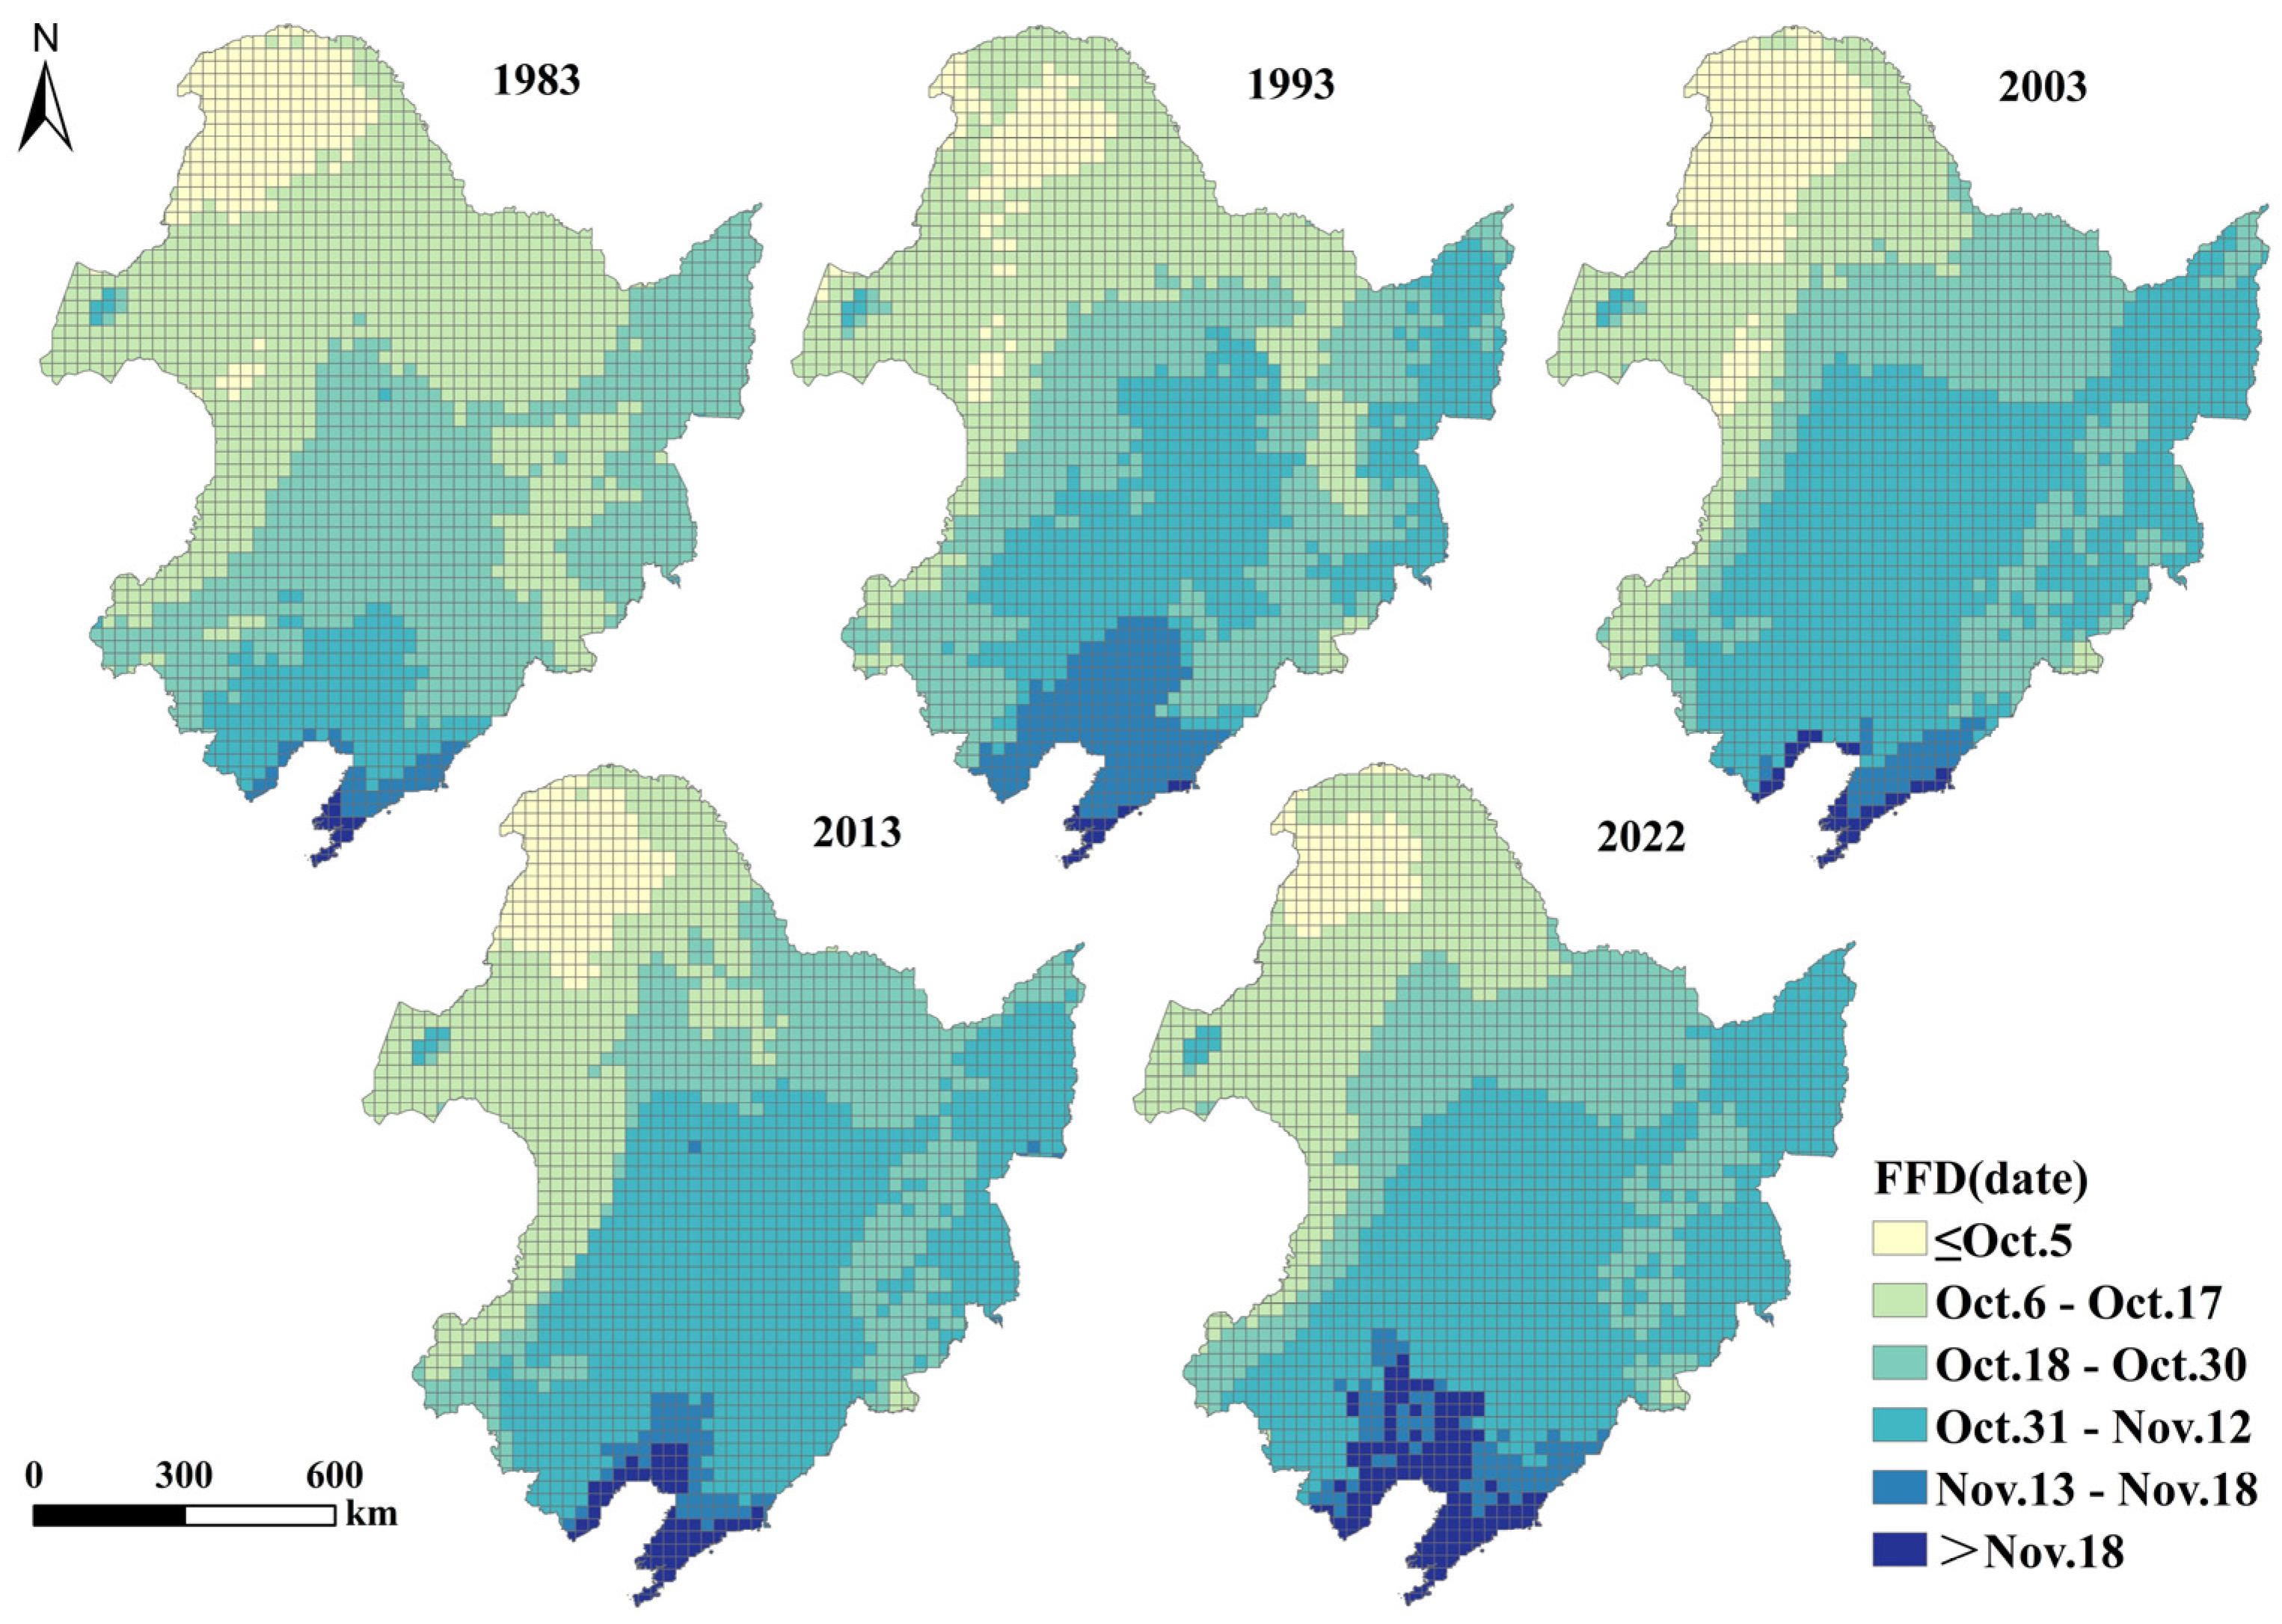
Significant spatial differences can be observed in the FFD over Northeast China (Figure 2), occurring mainly during October–November. The FFD occurs later from northwest to southeast, with freeze-thaw alternation starting in early October in the northern part of the Da Xing’anling Mountains, concentrated in mid-to-late October in Heilongjiang Province, and the latest freeze-thaw alternation usually in mid-to-late November in the Liaodong Peninsula area in the south. The time series data indicates that the area in which the FFD occurred before 5 October 1983 was mainly concentrated in the northern part of the Da Xing’anling Mountains, narrowing in 2022, whereas the FFD was mainly in Liaoning Province after 31 October 1983, with the gradual expansion northwards in 1993, followed by a further increase to the Sanjiang Plain and Changbai Mountain in 2022.
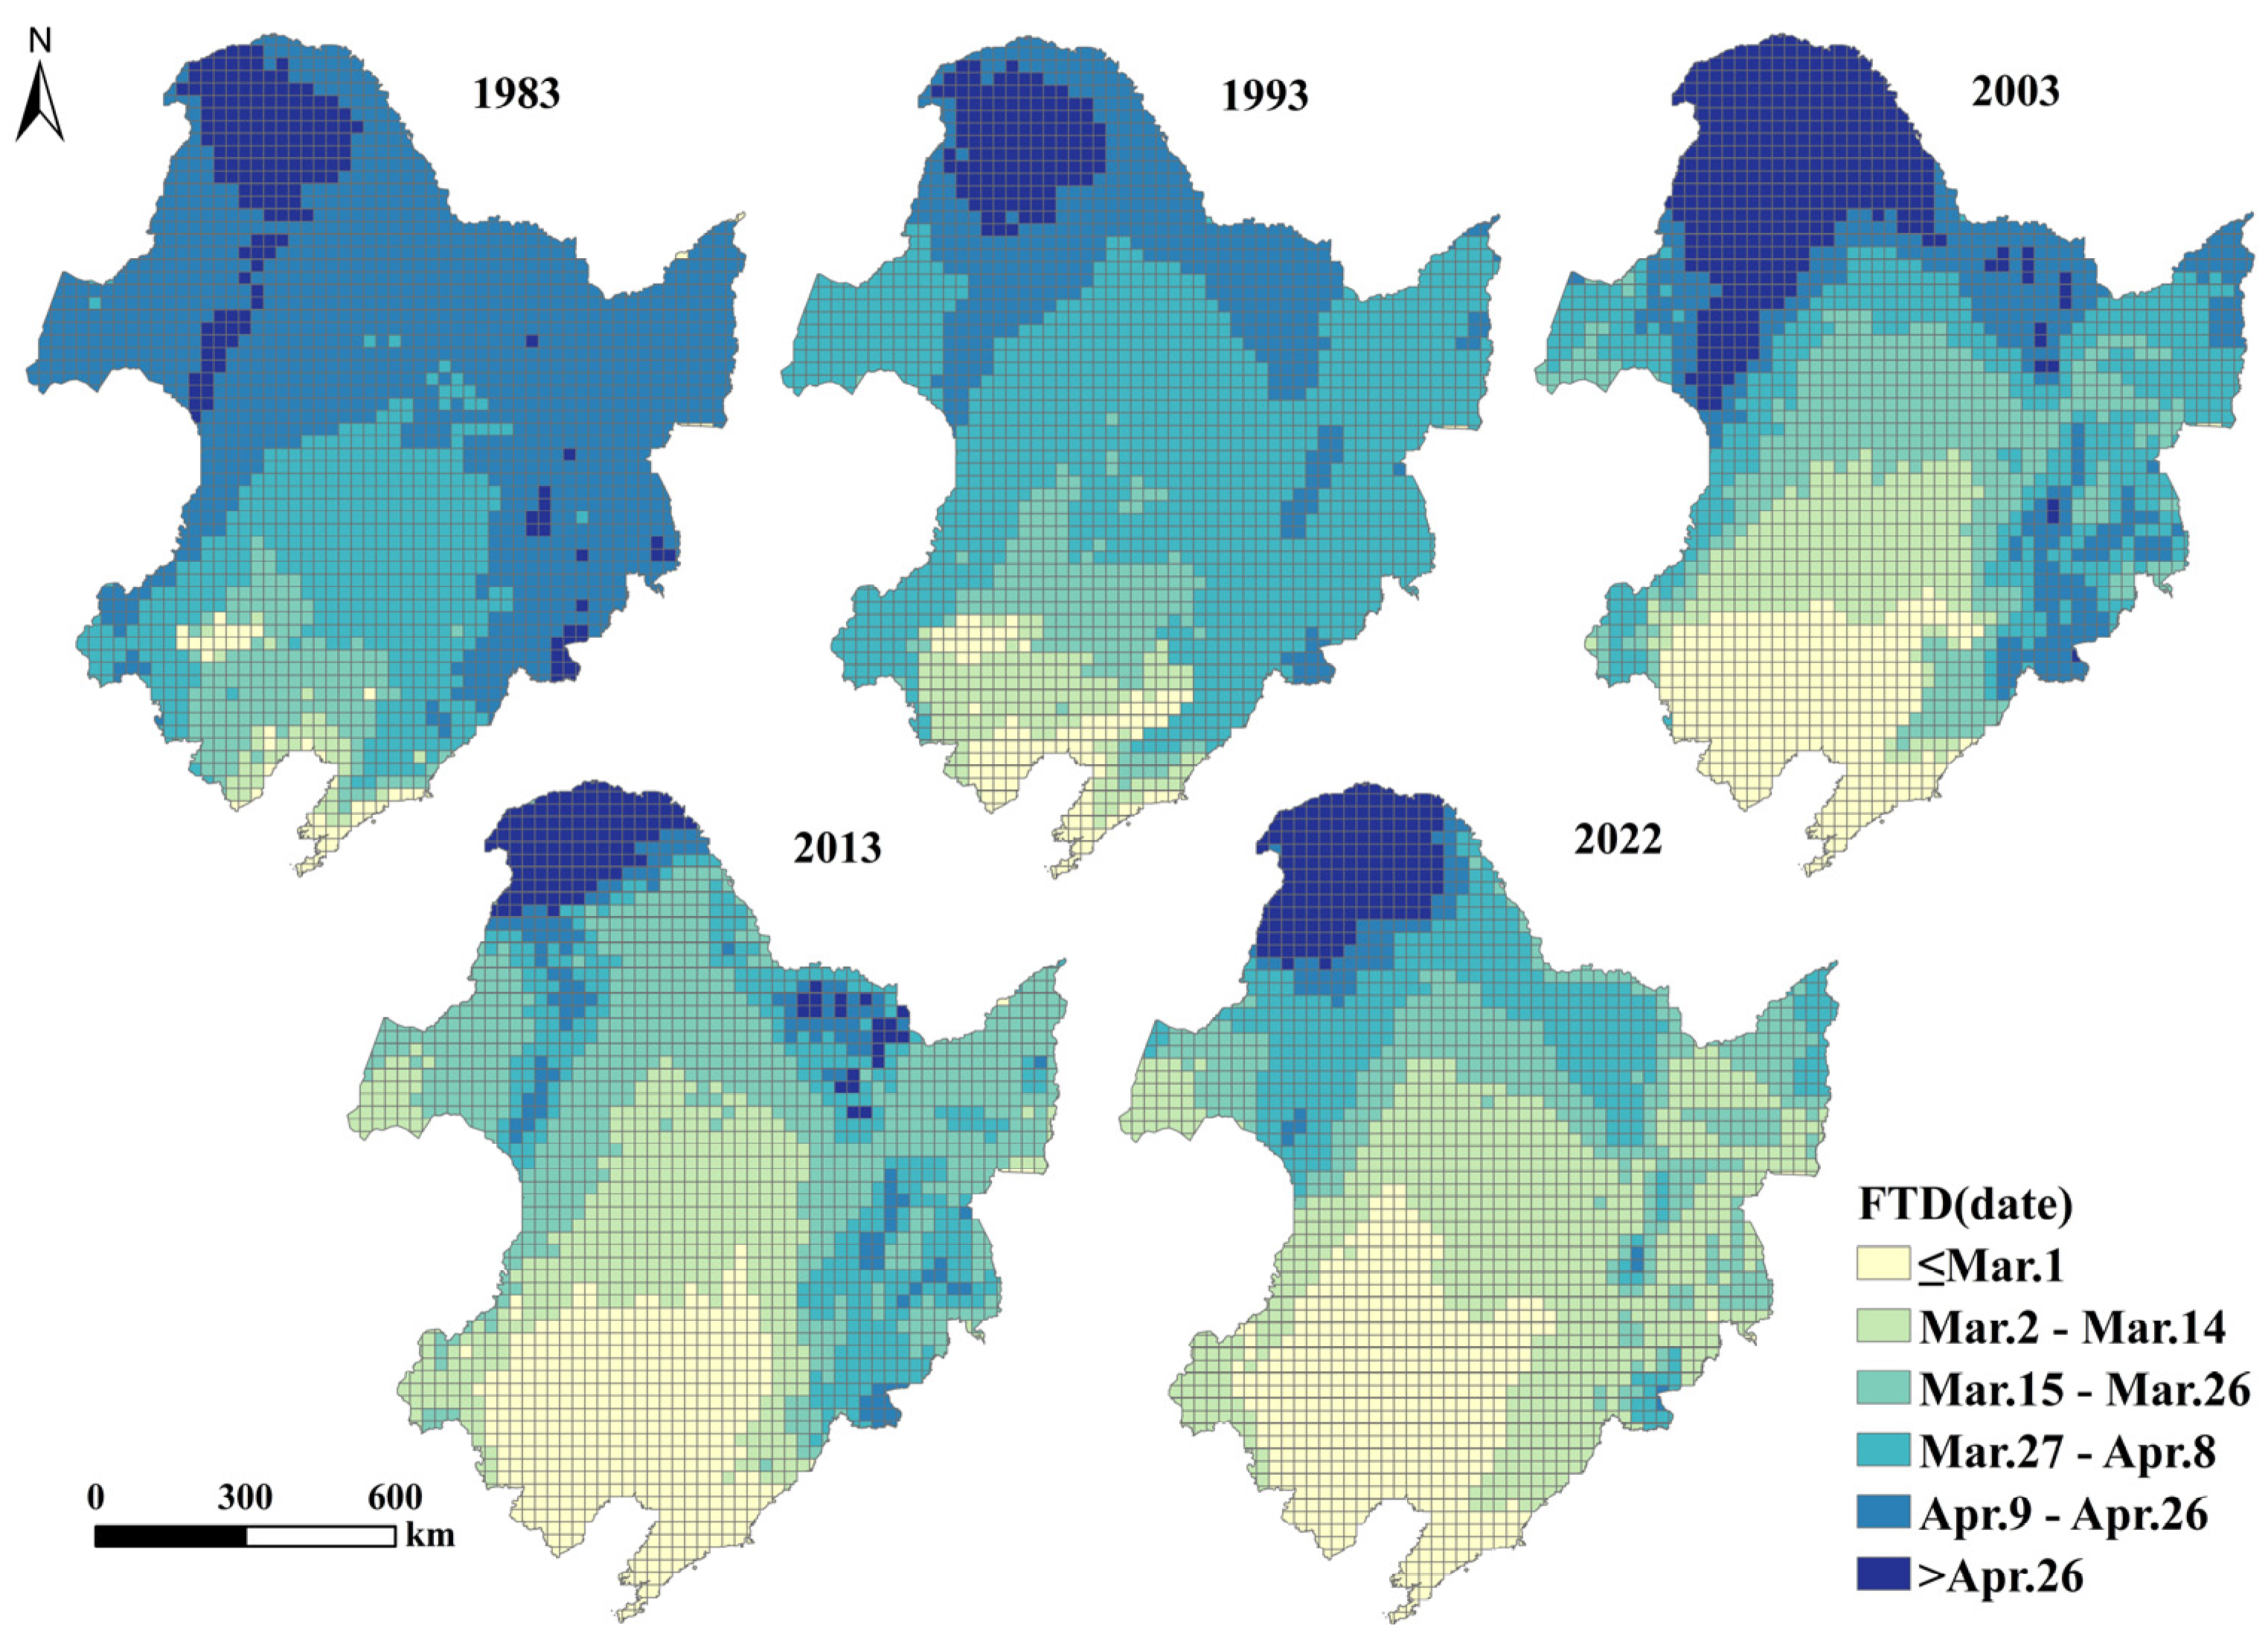
As can be seen from Figure 3, the FTD in Northeast China mainly occurs in March–April, with a gradual delay from south to north. The earliest occurrence is in late February in the southern part of the study area and at the end of April in the northern part of the Da Xing’anling Mountains. In addition to the influence of latitude, topography, and geomorphology play important roles. Northeast China is surrounded by the Da Xing’anling, Xiao Xing’anling Mountains, and the Changbai Mountains, and the central part of the region is a vast plain. Therefore, the FTD occurs significantly earlier on the Northeast Plain than in other regions at the same latitude. In terms of the time series, the FTD occurred after 27 March in the vast majority of Northeast China in 1983, narrowed significantly in 1993, and was observed only in the Da Xing’anling Mountains and Xiao Xing’anling Mountains and parts of the Changbai Mountains after 2013, whereas the area where the FTD occurs before March 1 expanded to the middle of the Northeast Plain.
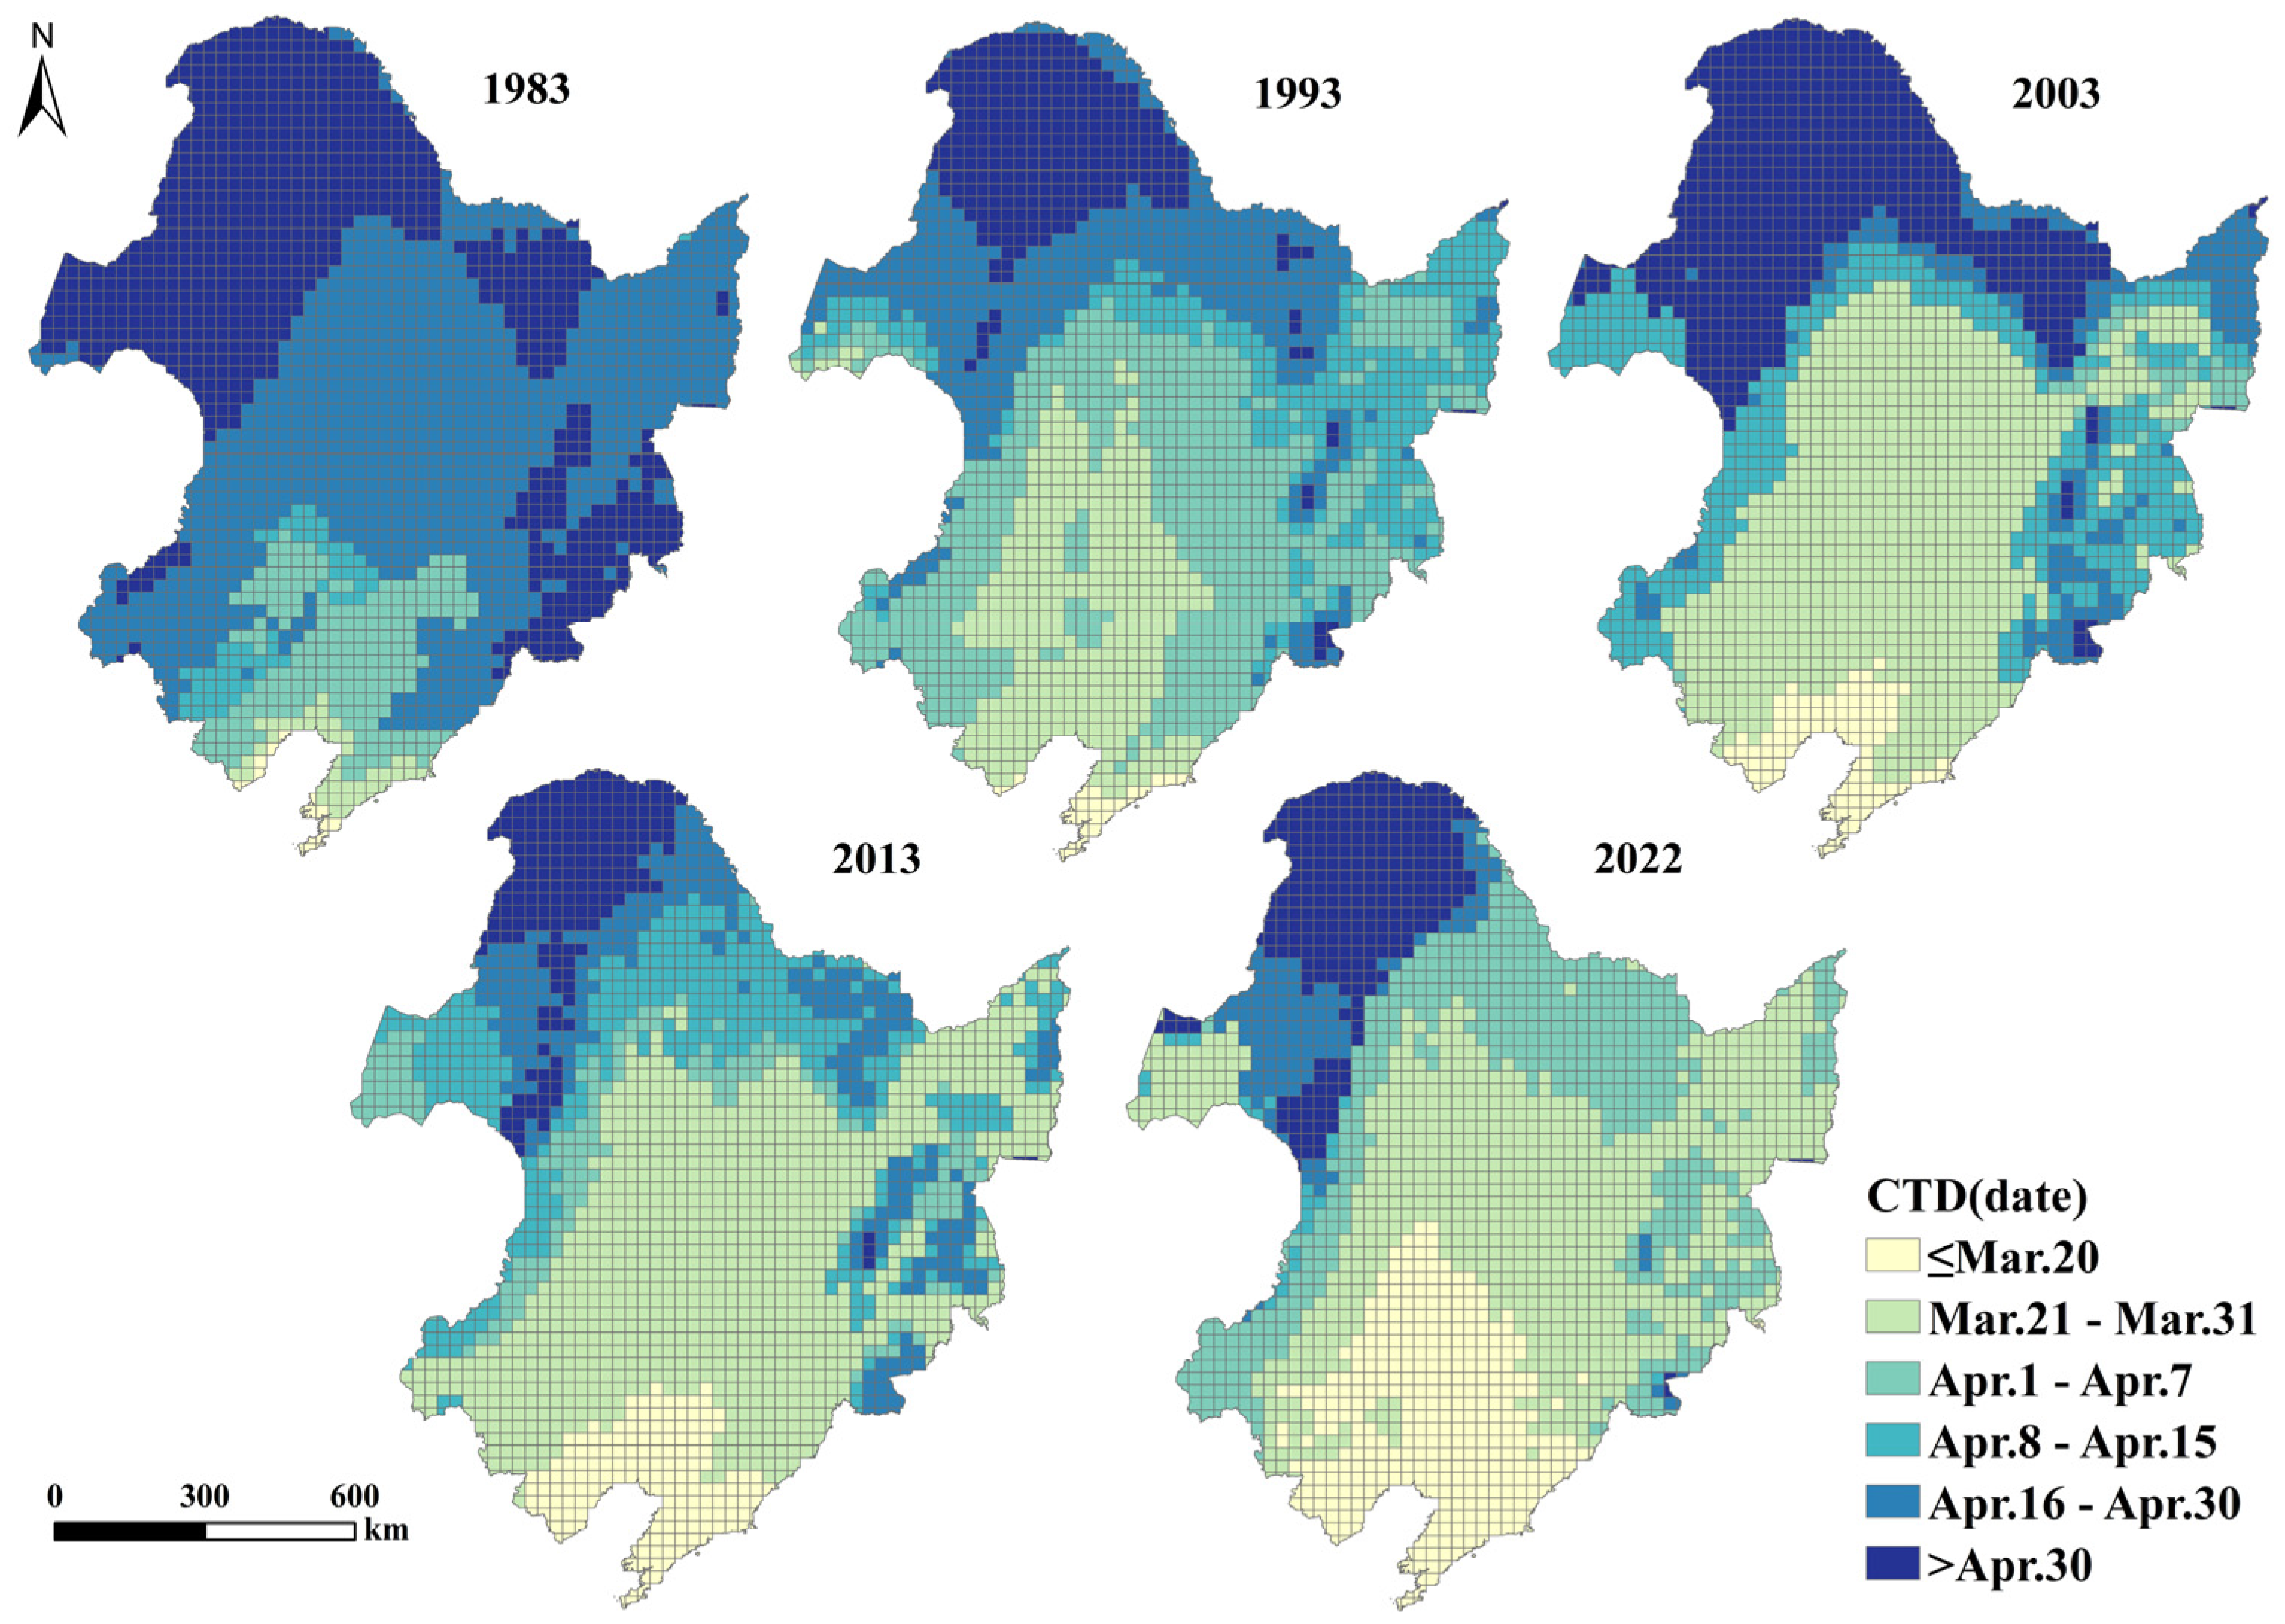
As shown in Figure 4, the CTD in the study area is also affected by latitude and topography, with the earliest occurrence in mid-to-late March in the southern part of the study area, April in the Changbai and Xiao Xing’anling Mountains, and mid-to-early May in the northern part of the Da Xing’anling Mountains. Similar to the FTD, the regional CTD occurred after April 16, 1983, except for Chifeng, eastern Tongliao, and parts of Liaoning and Jilin. The range narrowed significantly to the north in 1993 and, by 2022 could only be observed in scattered areas around the Da Xing’anling and eastern Changbai Mountains. In addition, the area where the CTD occurred before March 20 expanded northward from a sporadic occurrence in the Liaodong Peninsula to the Northeastern plains. In summary, the increases observed for areas where the FFD occurred later and the FTD and CTD occurred earlier indicated delayed soil freezing and earlier thawing.
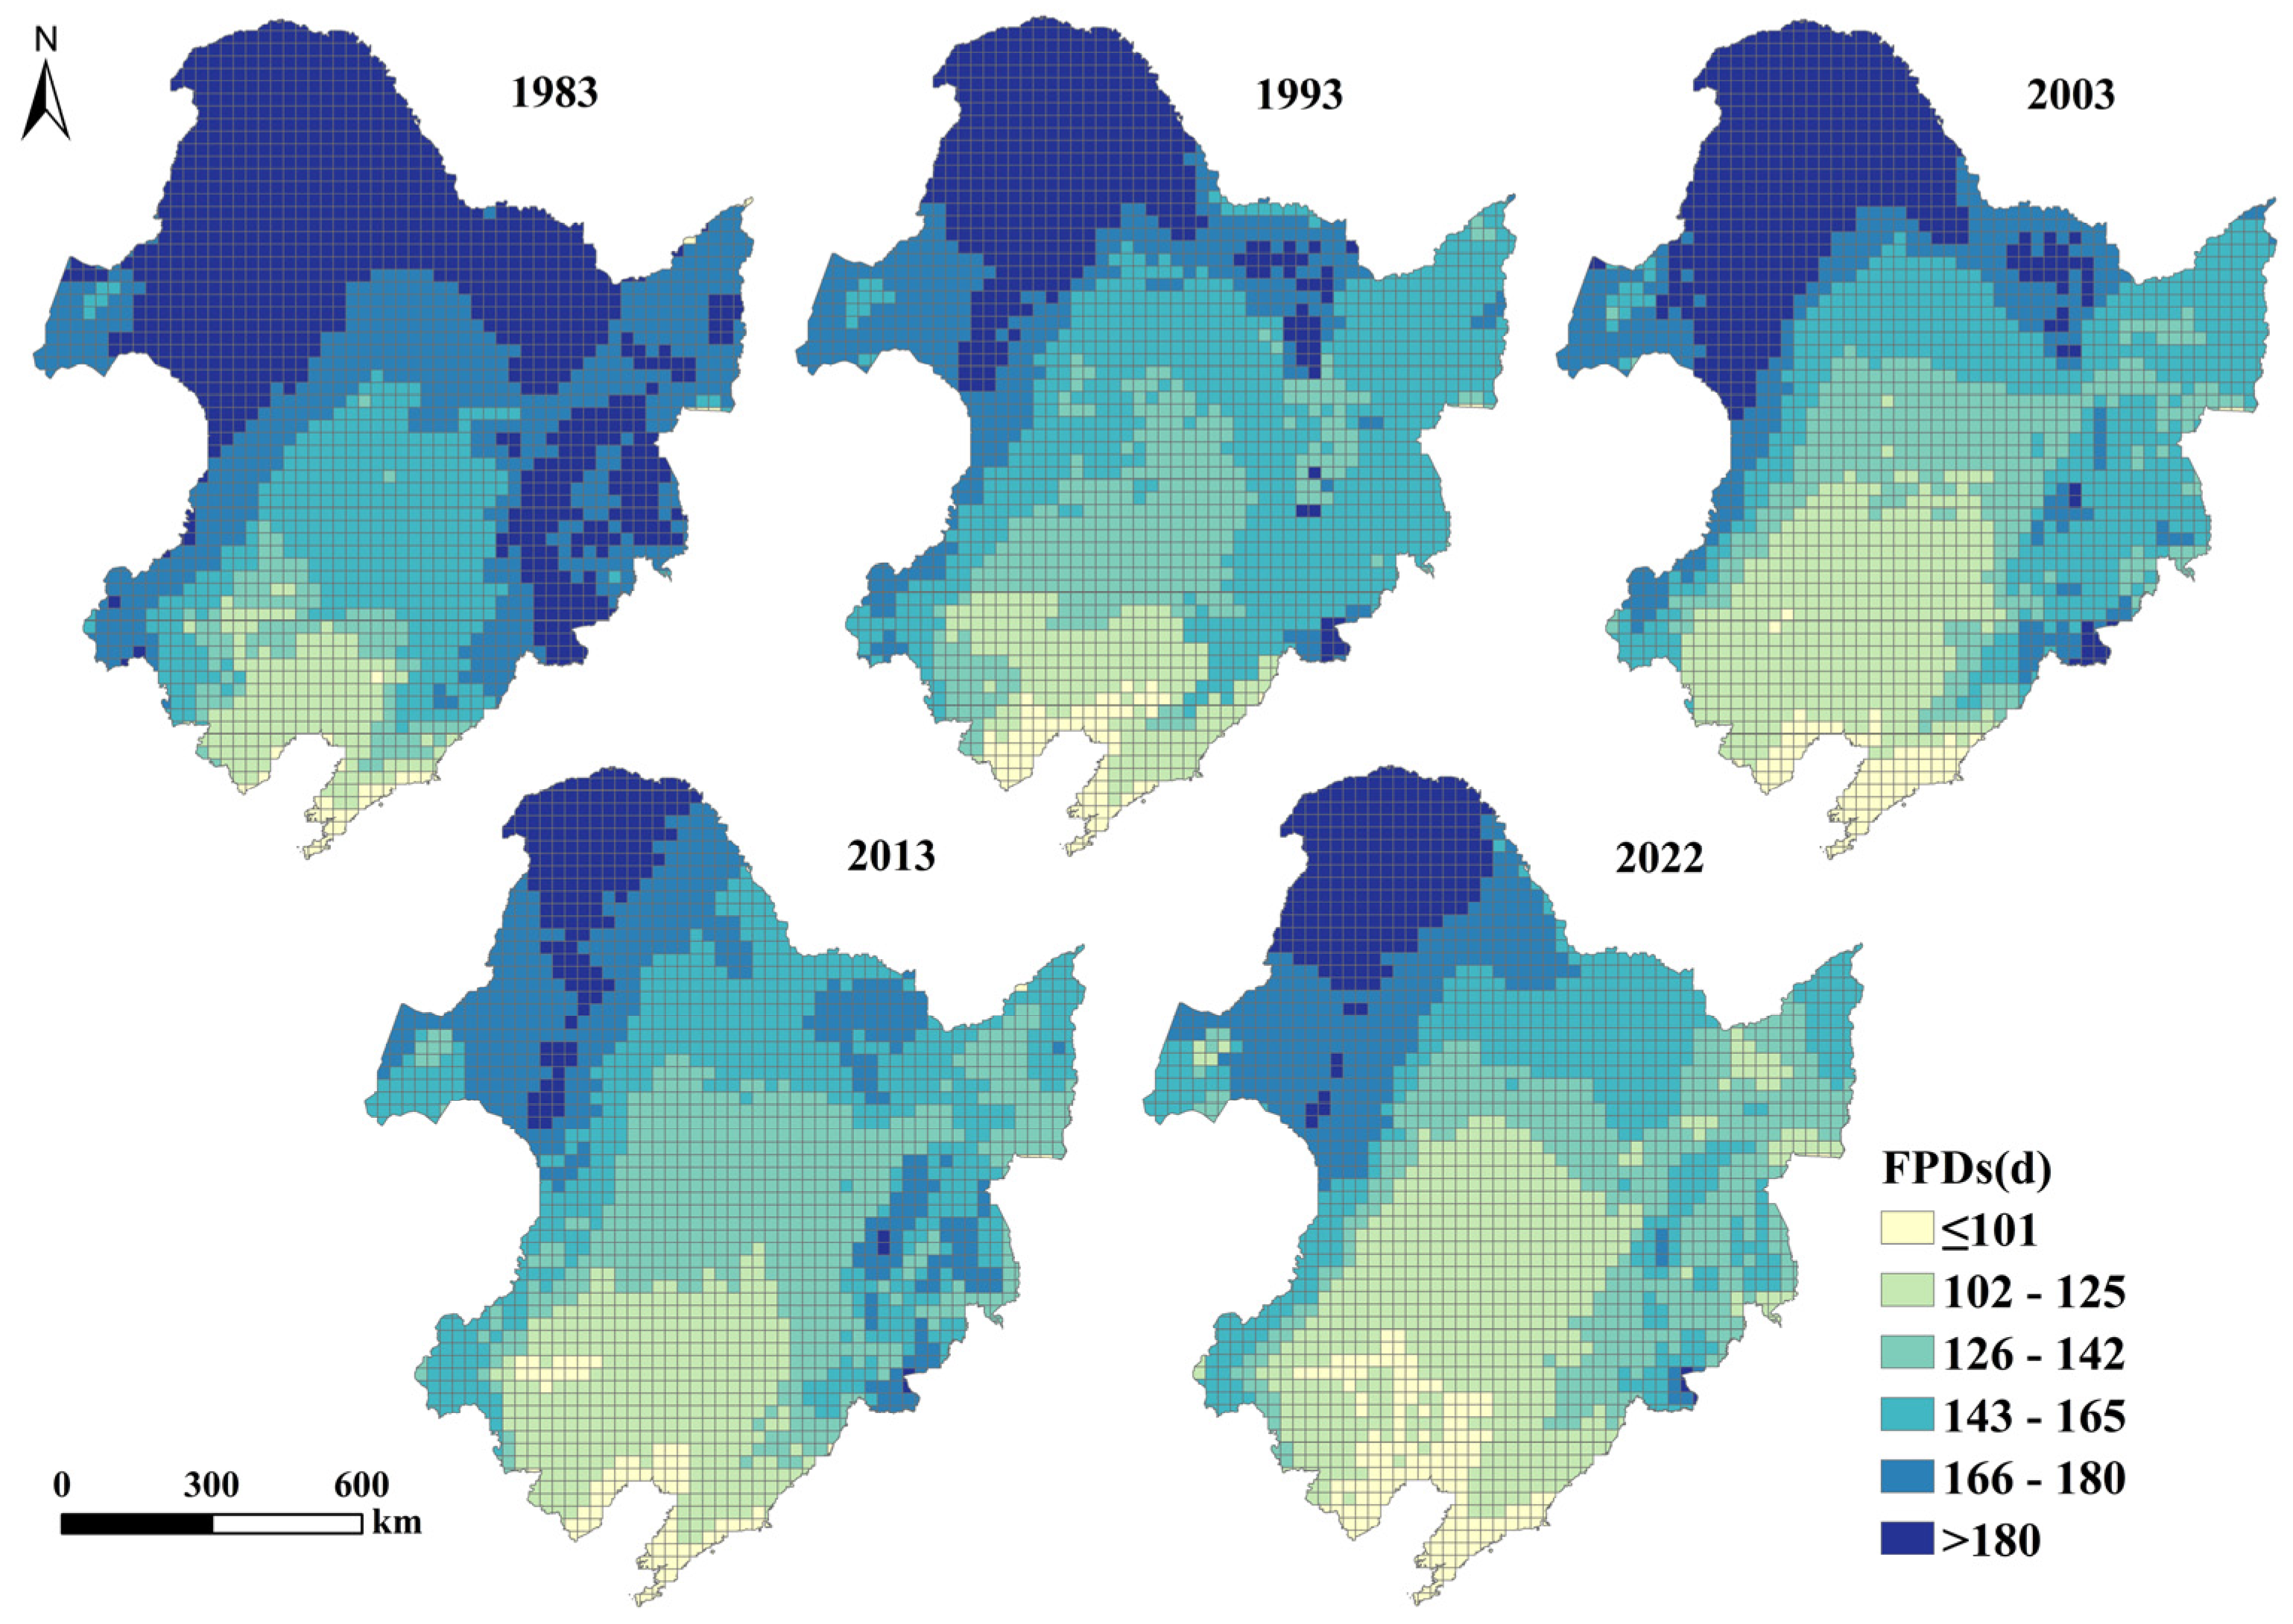
3.2. Spatial and Temporal Distribution of the FPDs, TFTDs, and CTPDs
Spatially, more FPDs occurred in the north than in the south, east, west, and center of the study area (Figure 5), mainly in the Da Xing’anling and Xiao Xing’anling mountain regions, where up to 166 days more freeze days are observed. Soil melting also occurs later in these areas. Fewer FPDs were observed in Liaodong Peninsula, where the FTD occurred earlier, by less than 100 days. From the time series, more than 180 FPDs were observed in the Da Xing’anling, Xiao Xing’anling, and Changbai Mountain regions in 1983, with the scattered freezing observed in the eastern part of the Changbai Mountain in 1993 covering an even smaller range in 2022, at which point only the northern part of the Greater Da Xing’anling Mountains froze.
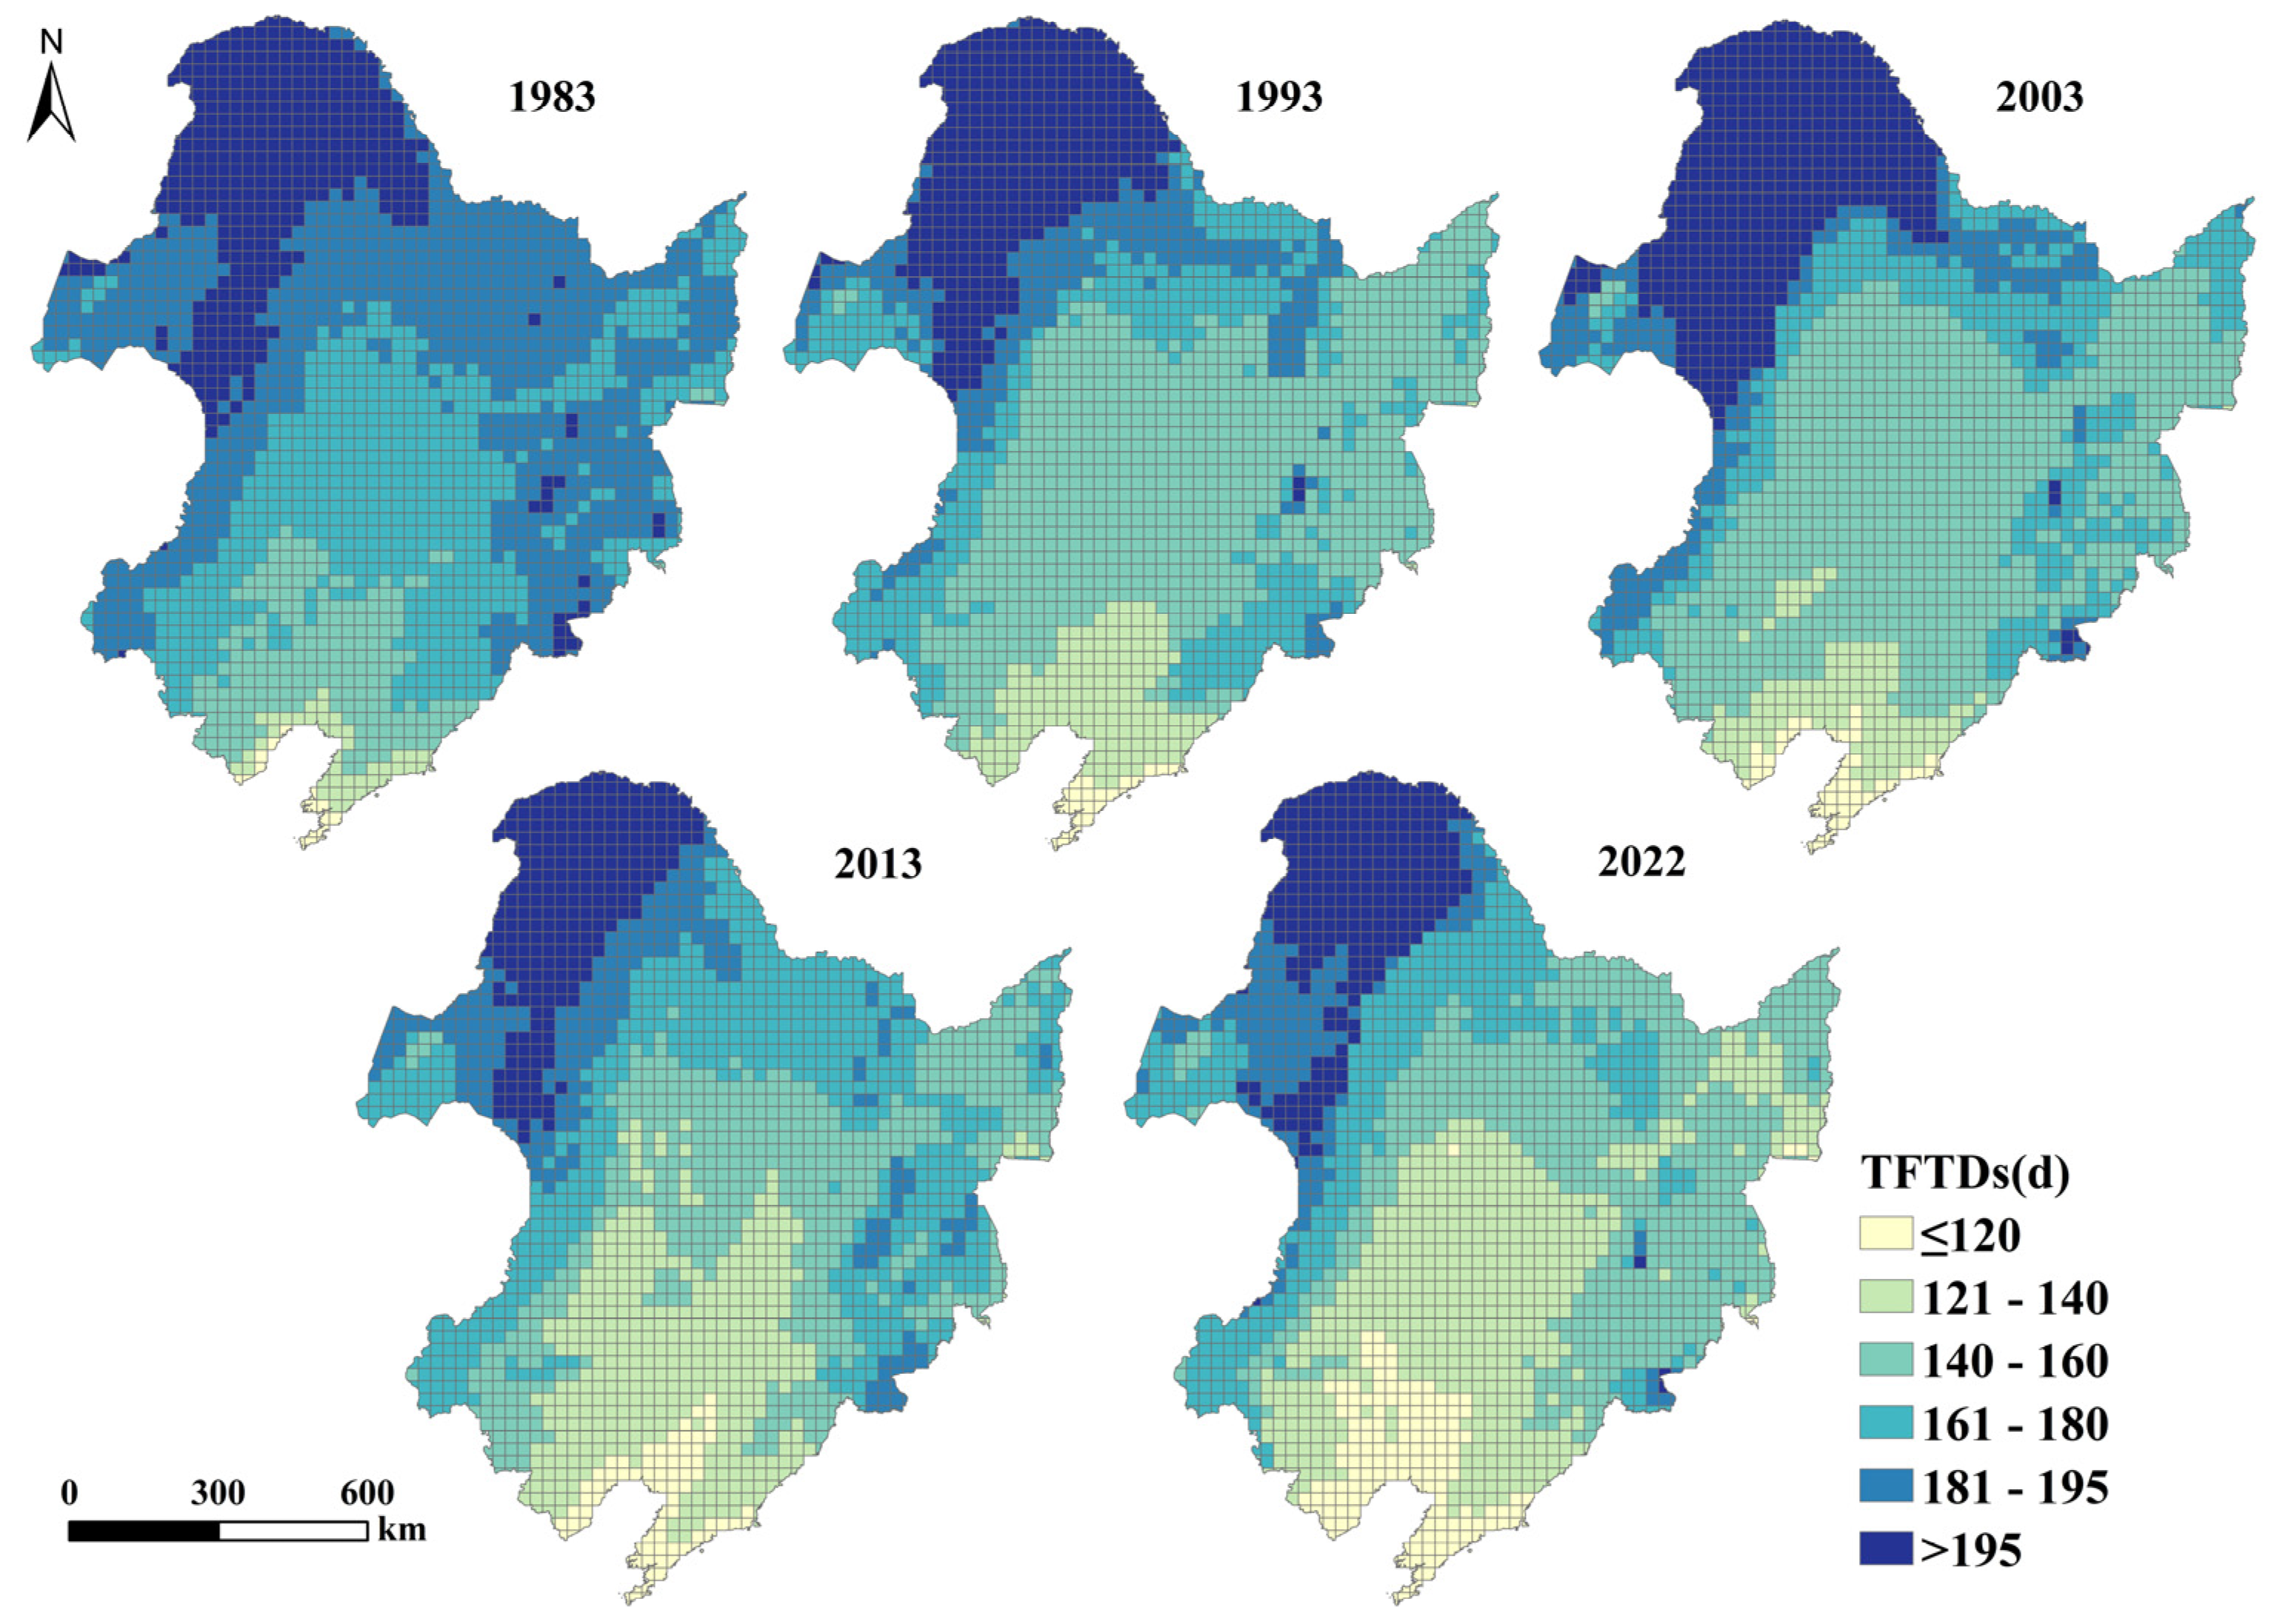
The spatial characteristics of the TFTDs and FPDs are similar (Figure 6), with the highest number of TFTDs reaching more than 195 days in the northern part of the study area and less than 120 days in certain southern areas. Significantly more TFTDs occurred at the southern end of the Da Xing’anling and Changbai Mountains than in the central plain at the same latitude. In the studied time series, only Liaodong Bay and the Liaodong Peninsula showed less than 140 TFTDs in 1983, and the range expanded to most of Liaoning Province in 1993 and the northern parts of the Northeast Plain and Sanjiang Plain region in 2022. Changes in regions with more than 195 TFTDs were relatively more subdued, and in general, the number of regions with shorter durations increased.
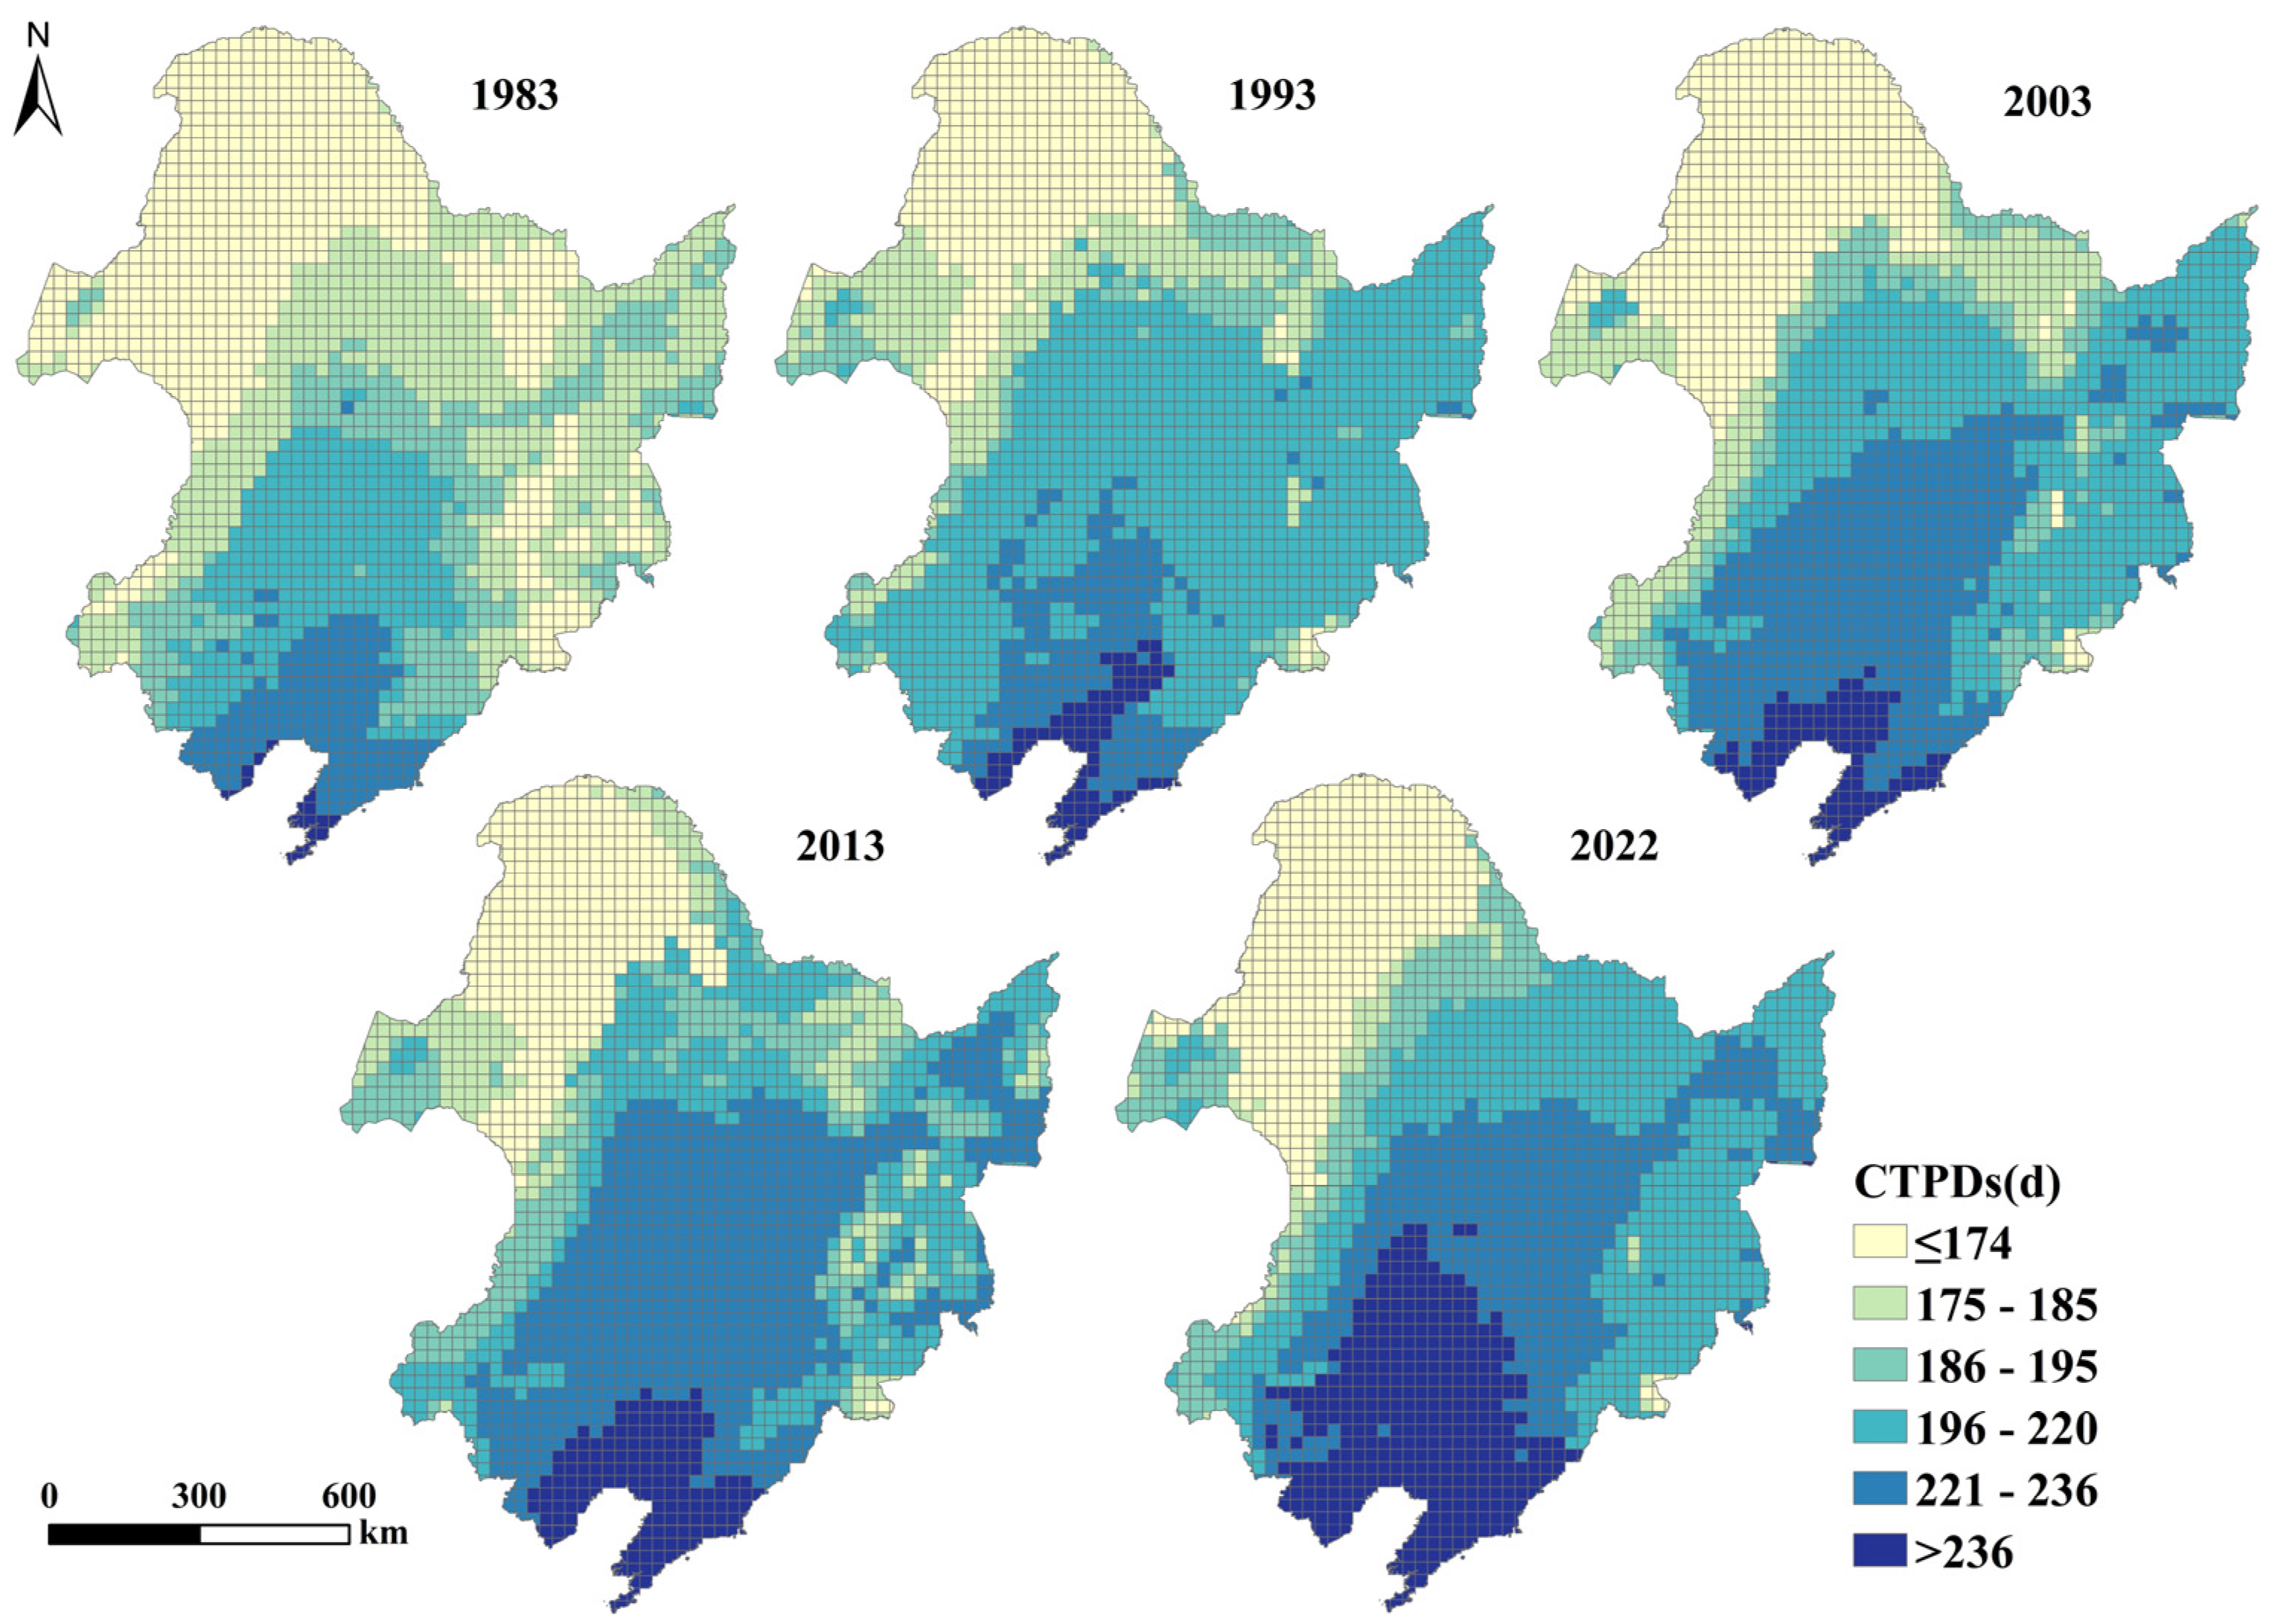
The spatial distribution of the CTPDs shows clear latitudinal and vertical zonality characteristics, with a gradual decreasing trend from southeast to northwest (Figure 7). Influenced by both latitude and altitude, the lowest number of CTPDs was observed in the northwestern part of the Da Xing’anling Mountains, with a minimum of less than 174 days, followed by the mountainous and hilly areas in the north, with more than 221 CTPDs observed in the central plains. In terms of the time series, generally fewer than 185 CTPDs occurred around Changbai Mountain in 1983, whereas 196–220 were observed in the same region in 2022. Areas with more than 221 days of the CTPDs were mainly located in the Liaodong Peninsula in 1983, and the range showing this number expanded to the northern part of the Songnen and Sanjiang plains in 2022.
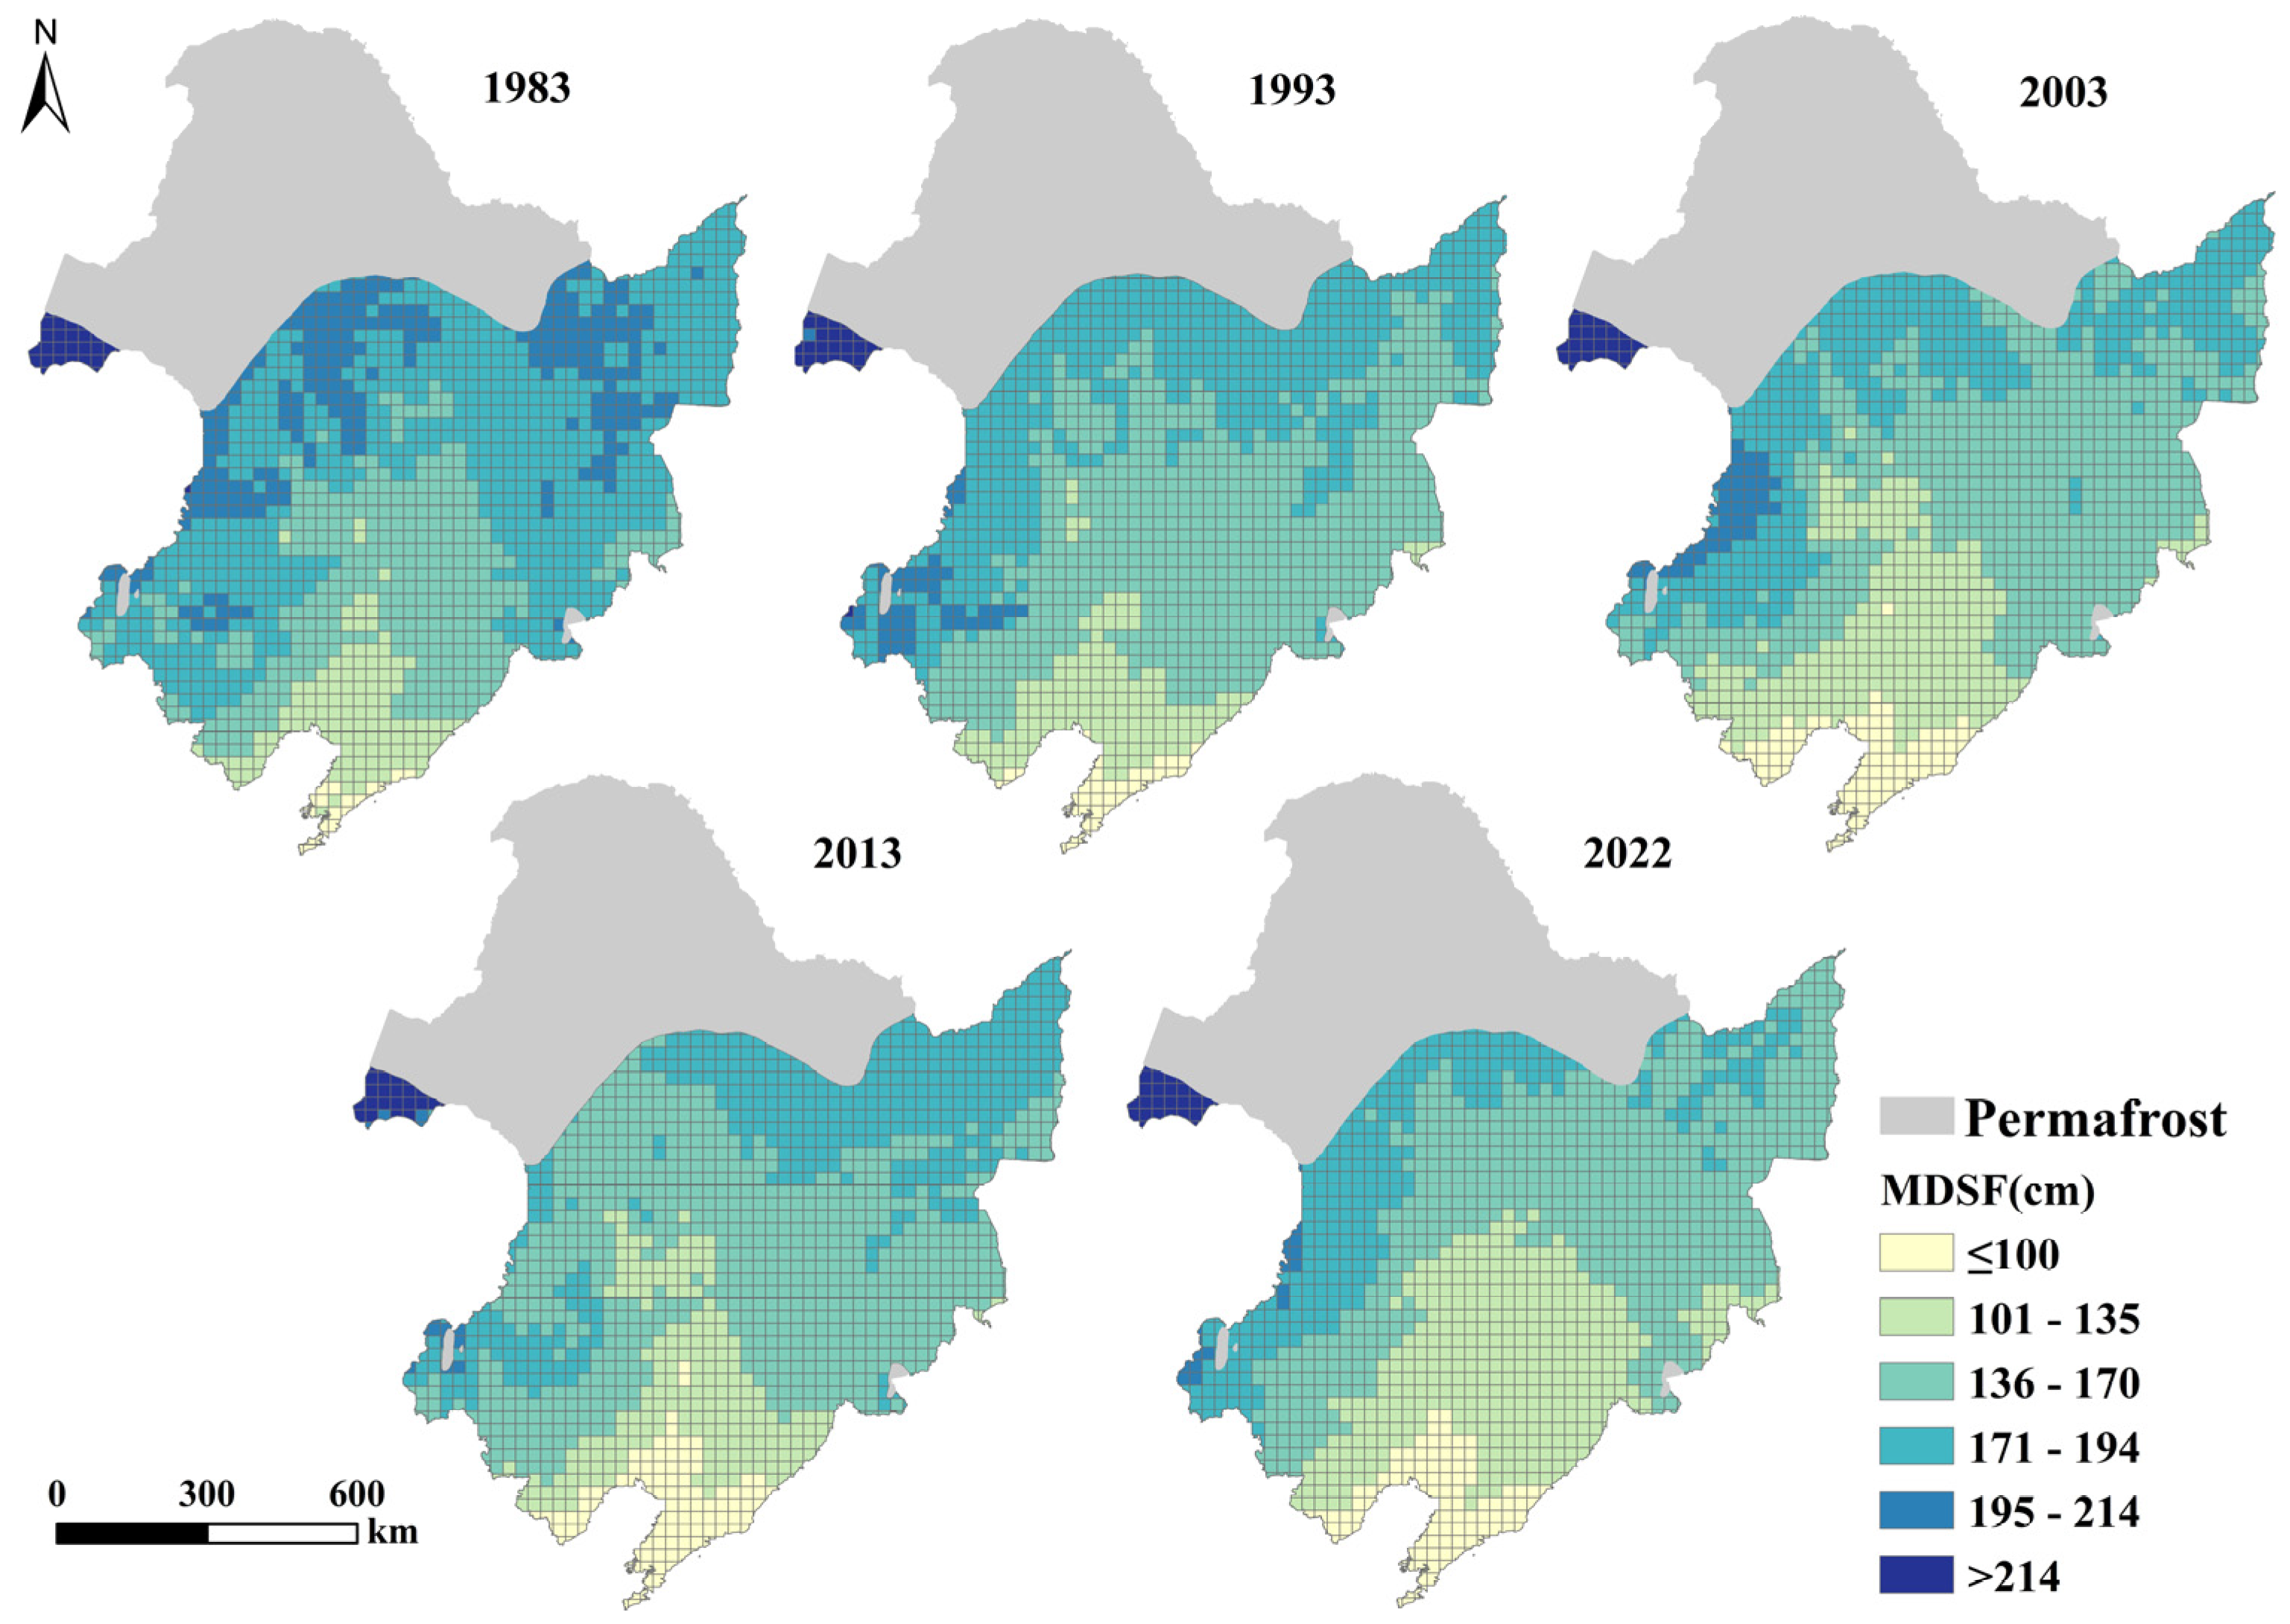
3.3. Spatial and Temporal Distribution of the MDSF and ALT
Under the influence of global warming, both MDSF and ALT have changed significantly. As shown in Figure 8, the spatial distribution of the MDSF in Northeast China varies significantly, with an overall decrease from north to south that is not exactly parallel to the latitude line and a relatively low freezing depth at the same latitude in the central plains. The high-value MDSF area is mainly distributed in the southwestern part of Hulunbeier, with an average of more than 214 cm, whereas low MDSFs are mainly distributed in Liaodong Bay and the Liaodong Peninsula, with an average of less than 100 cm and a minimum of less than 60 cm. From the time series, the area with an MDSF between 195 and 214 cm was mainly distributed south of the Da Xing’anling Mountains, north of Songnen Plain, and around the Xiao Xing’anling Mountains in 1983. This range narrowed significantly in 1993 and almost disappeared after 2013, while the area with an MDSF between 101 cm and 135 cm expanded significantly.
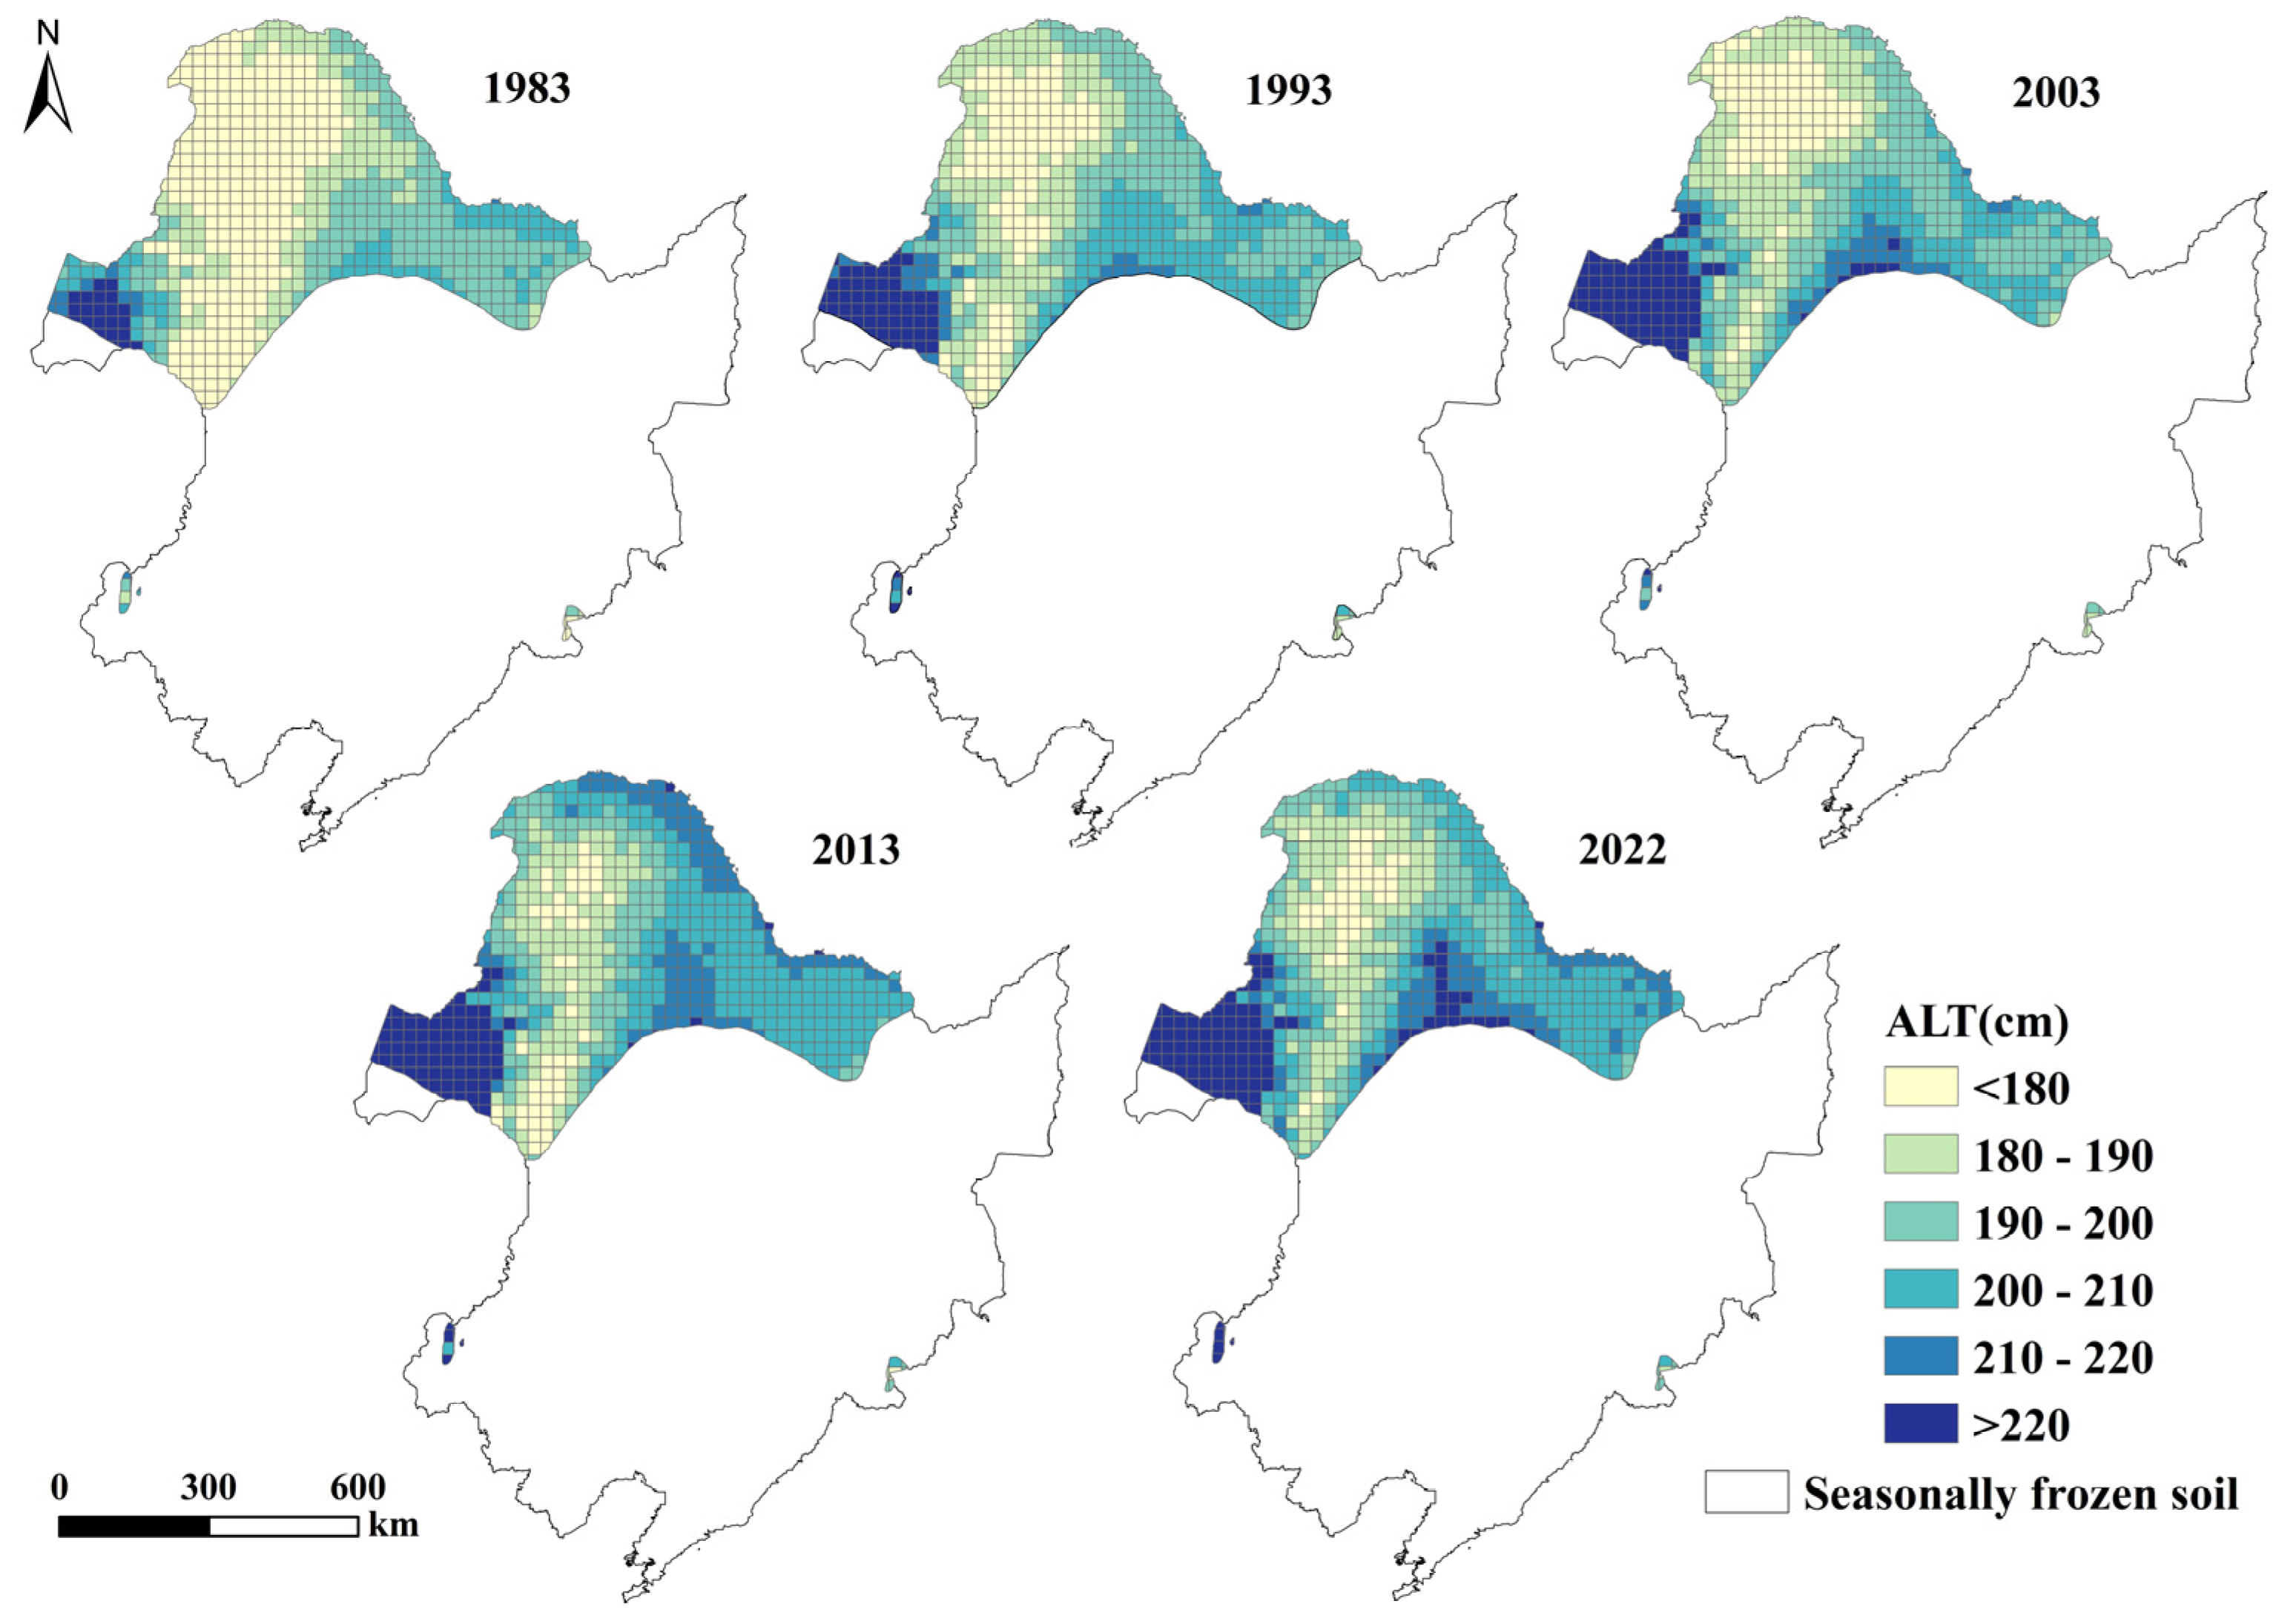
In areas of continuous permafrost, where the active layer is underlain by articulated permafrost, the ALT is usually considered the maximum depth of seasonal thawing [3,37]. The area of shallow depth of seasonal thawing in Northeast China is mainly located in the Da Xing’anling Mountains (Figure 9), which is generally less than 180 cm; where extensive permafrost is distributed, DEM is high, and annual temperatures are low. The maximum depths of seasonal thawing values are higher on the south side of the Hulunbeier and Xiao Xing’anling Mountains, up to more than 220 cm. From the time series, the maximum depth of seasonal thawing showed an increasing trend from 1983 to 2022, with a significant expansion of the area in which it reached to a depth of more than a 200 cm, whereas the area in Da Xing’anling Mountains with the maximum depth of seasonal thawing of less than 180 cm was significantly smaller.
3.4. Trend Change Analysis
3.4.1. Trends in the FFD, FTD, and CTD
Combining the results of Theil-Sen median trend analysis with the Mann-Kendall test effectively reflects the spatial distribution of the trend in the soil freeze-thaw onset and end date changes in Northeast China from 1983 to 2022. The results are classified into five types as follows (Table 2).
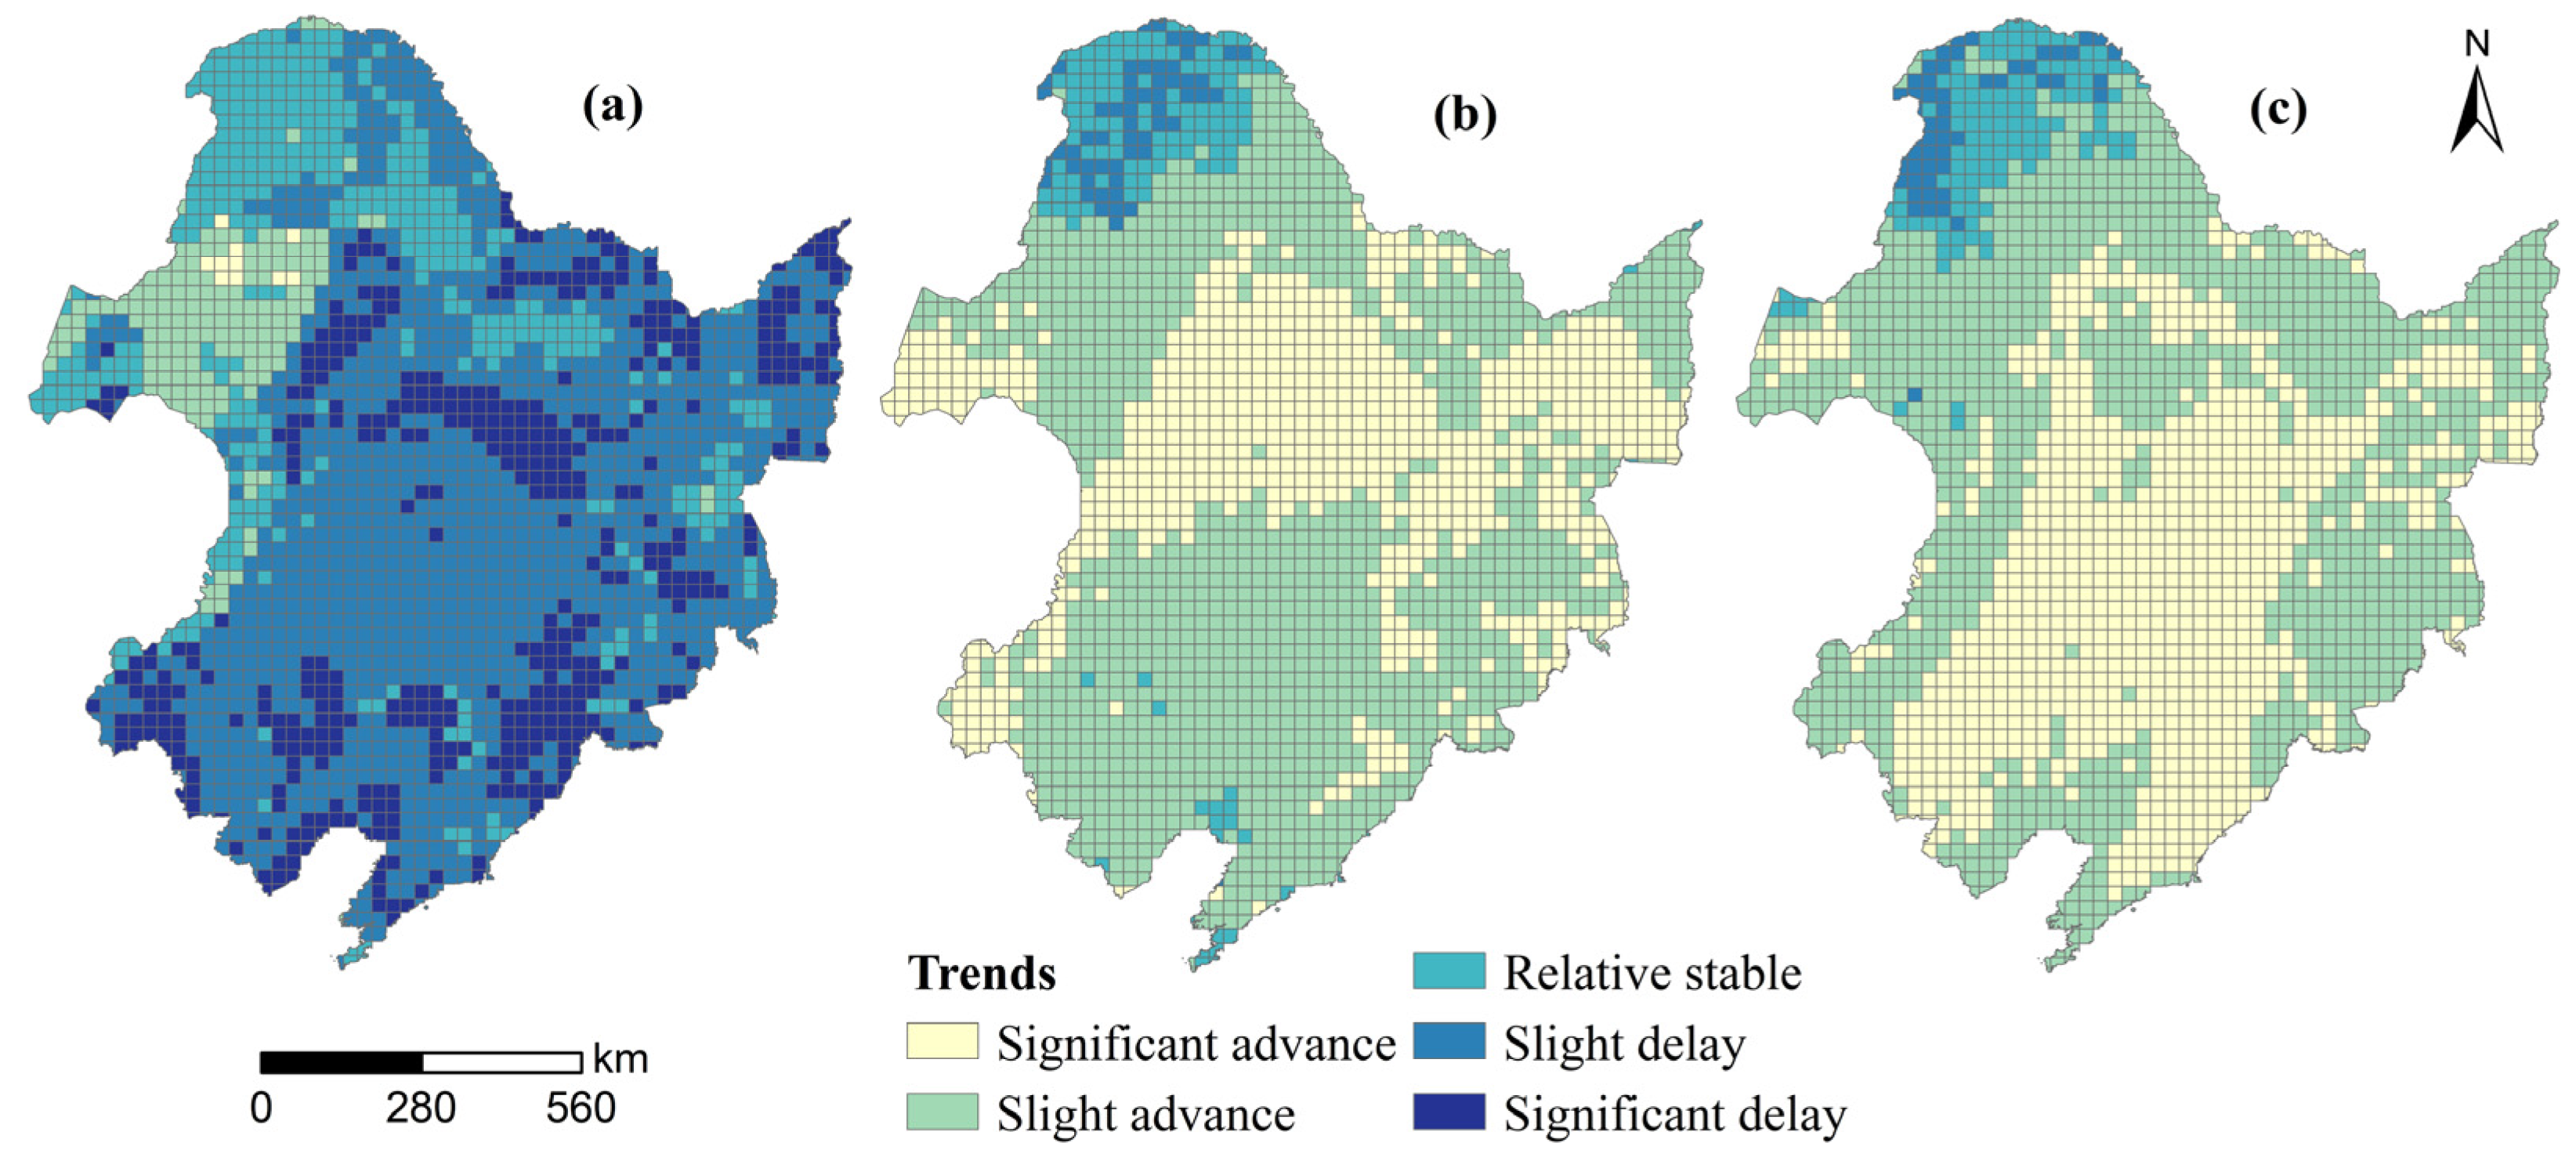
As shown in Figure 10a, the FFD was generally delayed by an average of 1.49 days/10 a in Northeast China from 1983 to 2022, with the significantly delayed areas mainly distributed in the low hills and valley plains on the east side of the Da Xing’anling Mountains, the Sanjiang Plain, and the Northeast Plain, accounting for 21.4% of the total area. The slightly deferred areas were widely distributed across most of the Northeast China, accounting for 52.2% of the total area. From Figure 10b, it can be seen that except for the northern Da Xing’anling Mountains, the FTD has generally become earlier, with the significant advancement areas mainly distributed in Hulunbeier, the southern and eastern sides of the Da Xing’anling Mountains, the Northeastern plains, and the Sanjiang Plain, which accounts for 33.9% of the total area. The slightly advanced areas are widely distributed, accounting for 57.0% of the total area. From 1983 to 2022, the CTD advances by about 20 days at a rate of −5.06 days per decade. The advanced area substantially exceeds the delayed area (Figure 10c), with the significantly and slightly advanced areas accounting for 91.7% of the study area. In summary, the FTD and CTD have advanced substantially in Northeast China, which is inextricably linked to the significant summer warming in Northeast China over recent decades [38].
3.4.2. Trends in the FPDs, TFTDs, CTPDs, MDSF, and ALT
FPDs, TFTDs, CTPDs, MDSF, and ALT all show significant changes under the influence of global warming. Percentage statistics for these changes are given in Table 3.
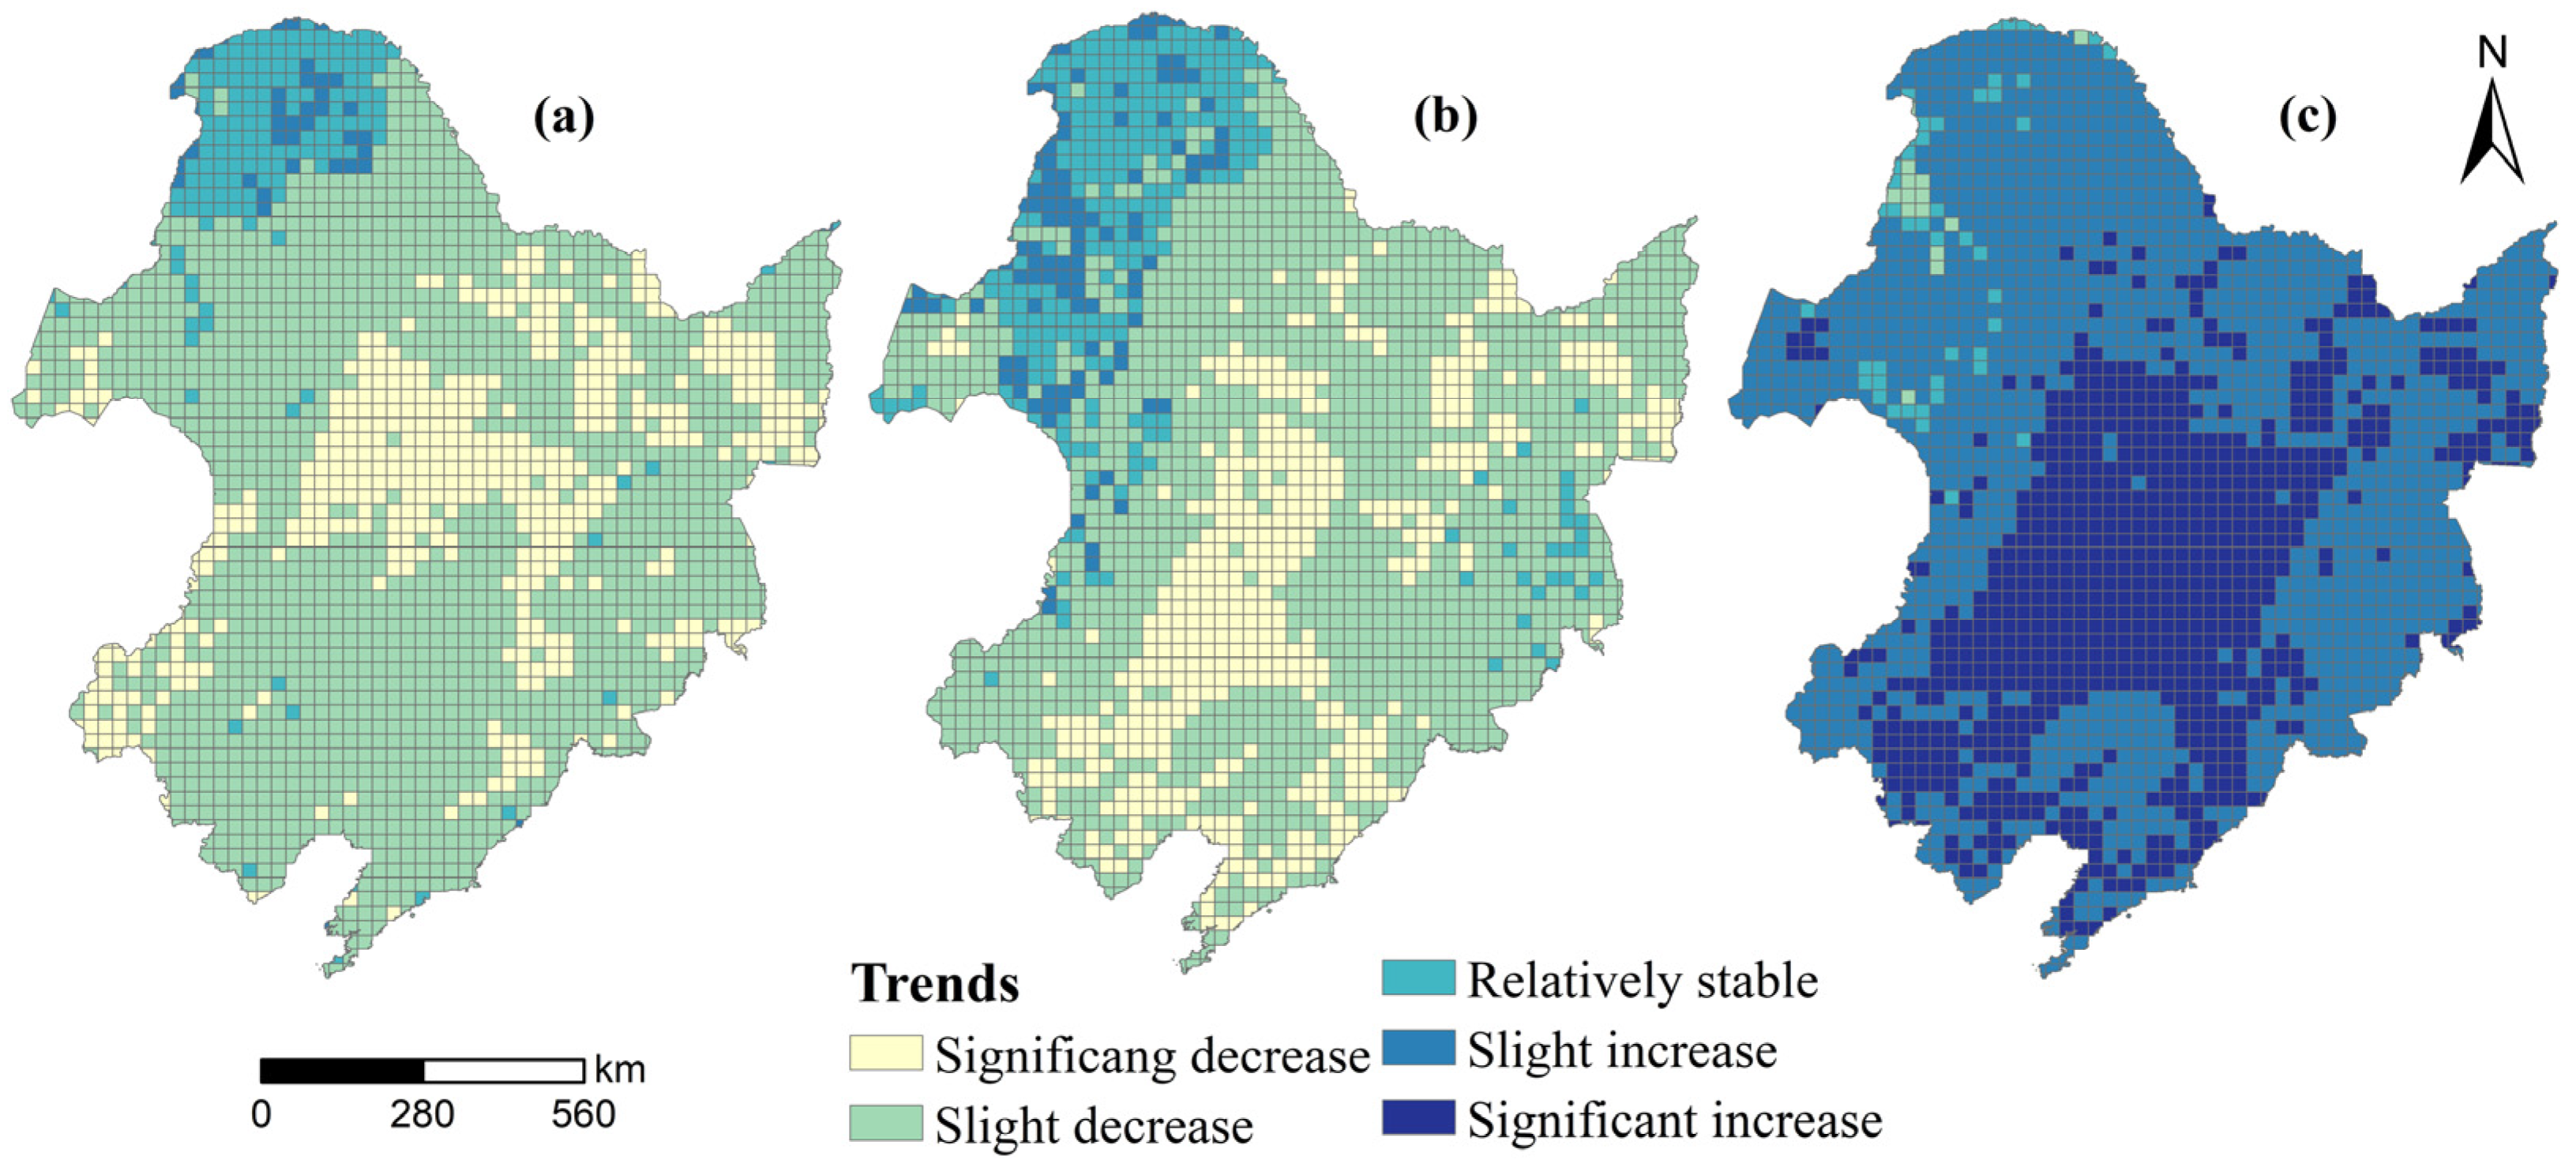
The vast majority of Northeast China FPDs show a decreasing trend over the period from 1983–2022 (Figure 11a), with relatively stable and increasing areas mainly distributed in the northern part of the Da Xing’anling Mountains, and significant decreases in the Northeastern plains, the Sanjiang Plain, and the southern end of the Da Xing’anling Mountains accounting for 22.0% of the total area. Areas that show slight decreases are widely distributed, accounting for 68.7% of the total area. From Figure 11b, it can be seen that the TFTDs and FPDs show similar characteristics, with relative stability and slight increases mainly distributed in the northern and central parts of the Da Xing’anling Mountains and a few parts of Changbai Mountain. Areas with significant decreases in the number of TFTDs are mainly located in the central, southern, and northeastern parts of the study area, whereas areas that show slight decreases are widely distributed and account for 60.4% of the total area. An increasing trend in the CTPDs occupies almost the whole of Northeast China, while the relatively stable and slightly decreasing areas are fewer and distributed only in the Da Xing’anling Mountains (Figure 11c). The areas of significant increase are mainly located in the central plains and southern regions, accounting for 35.9% of the total area, whereas areas that show slight increases account for 61.1% of the total area. From 1983–2022, CTPDs increased by approximately 22 days at a rate of 5.662 days per decade.
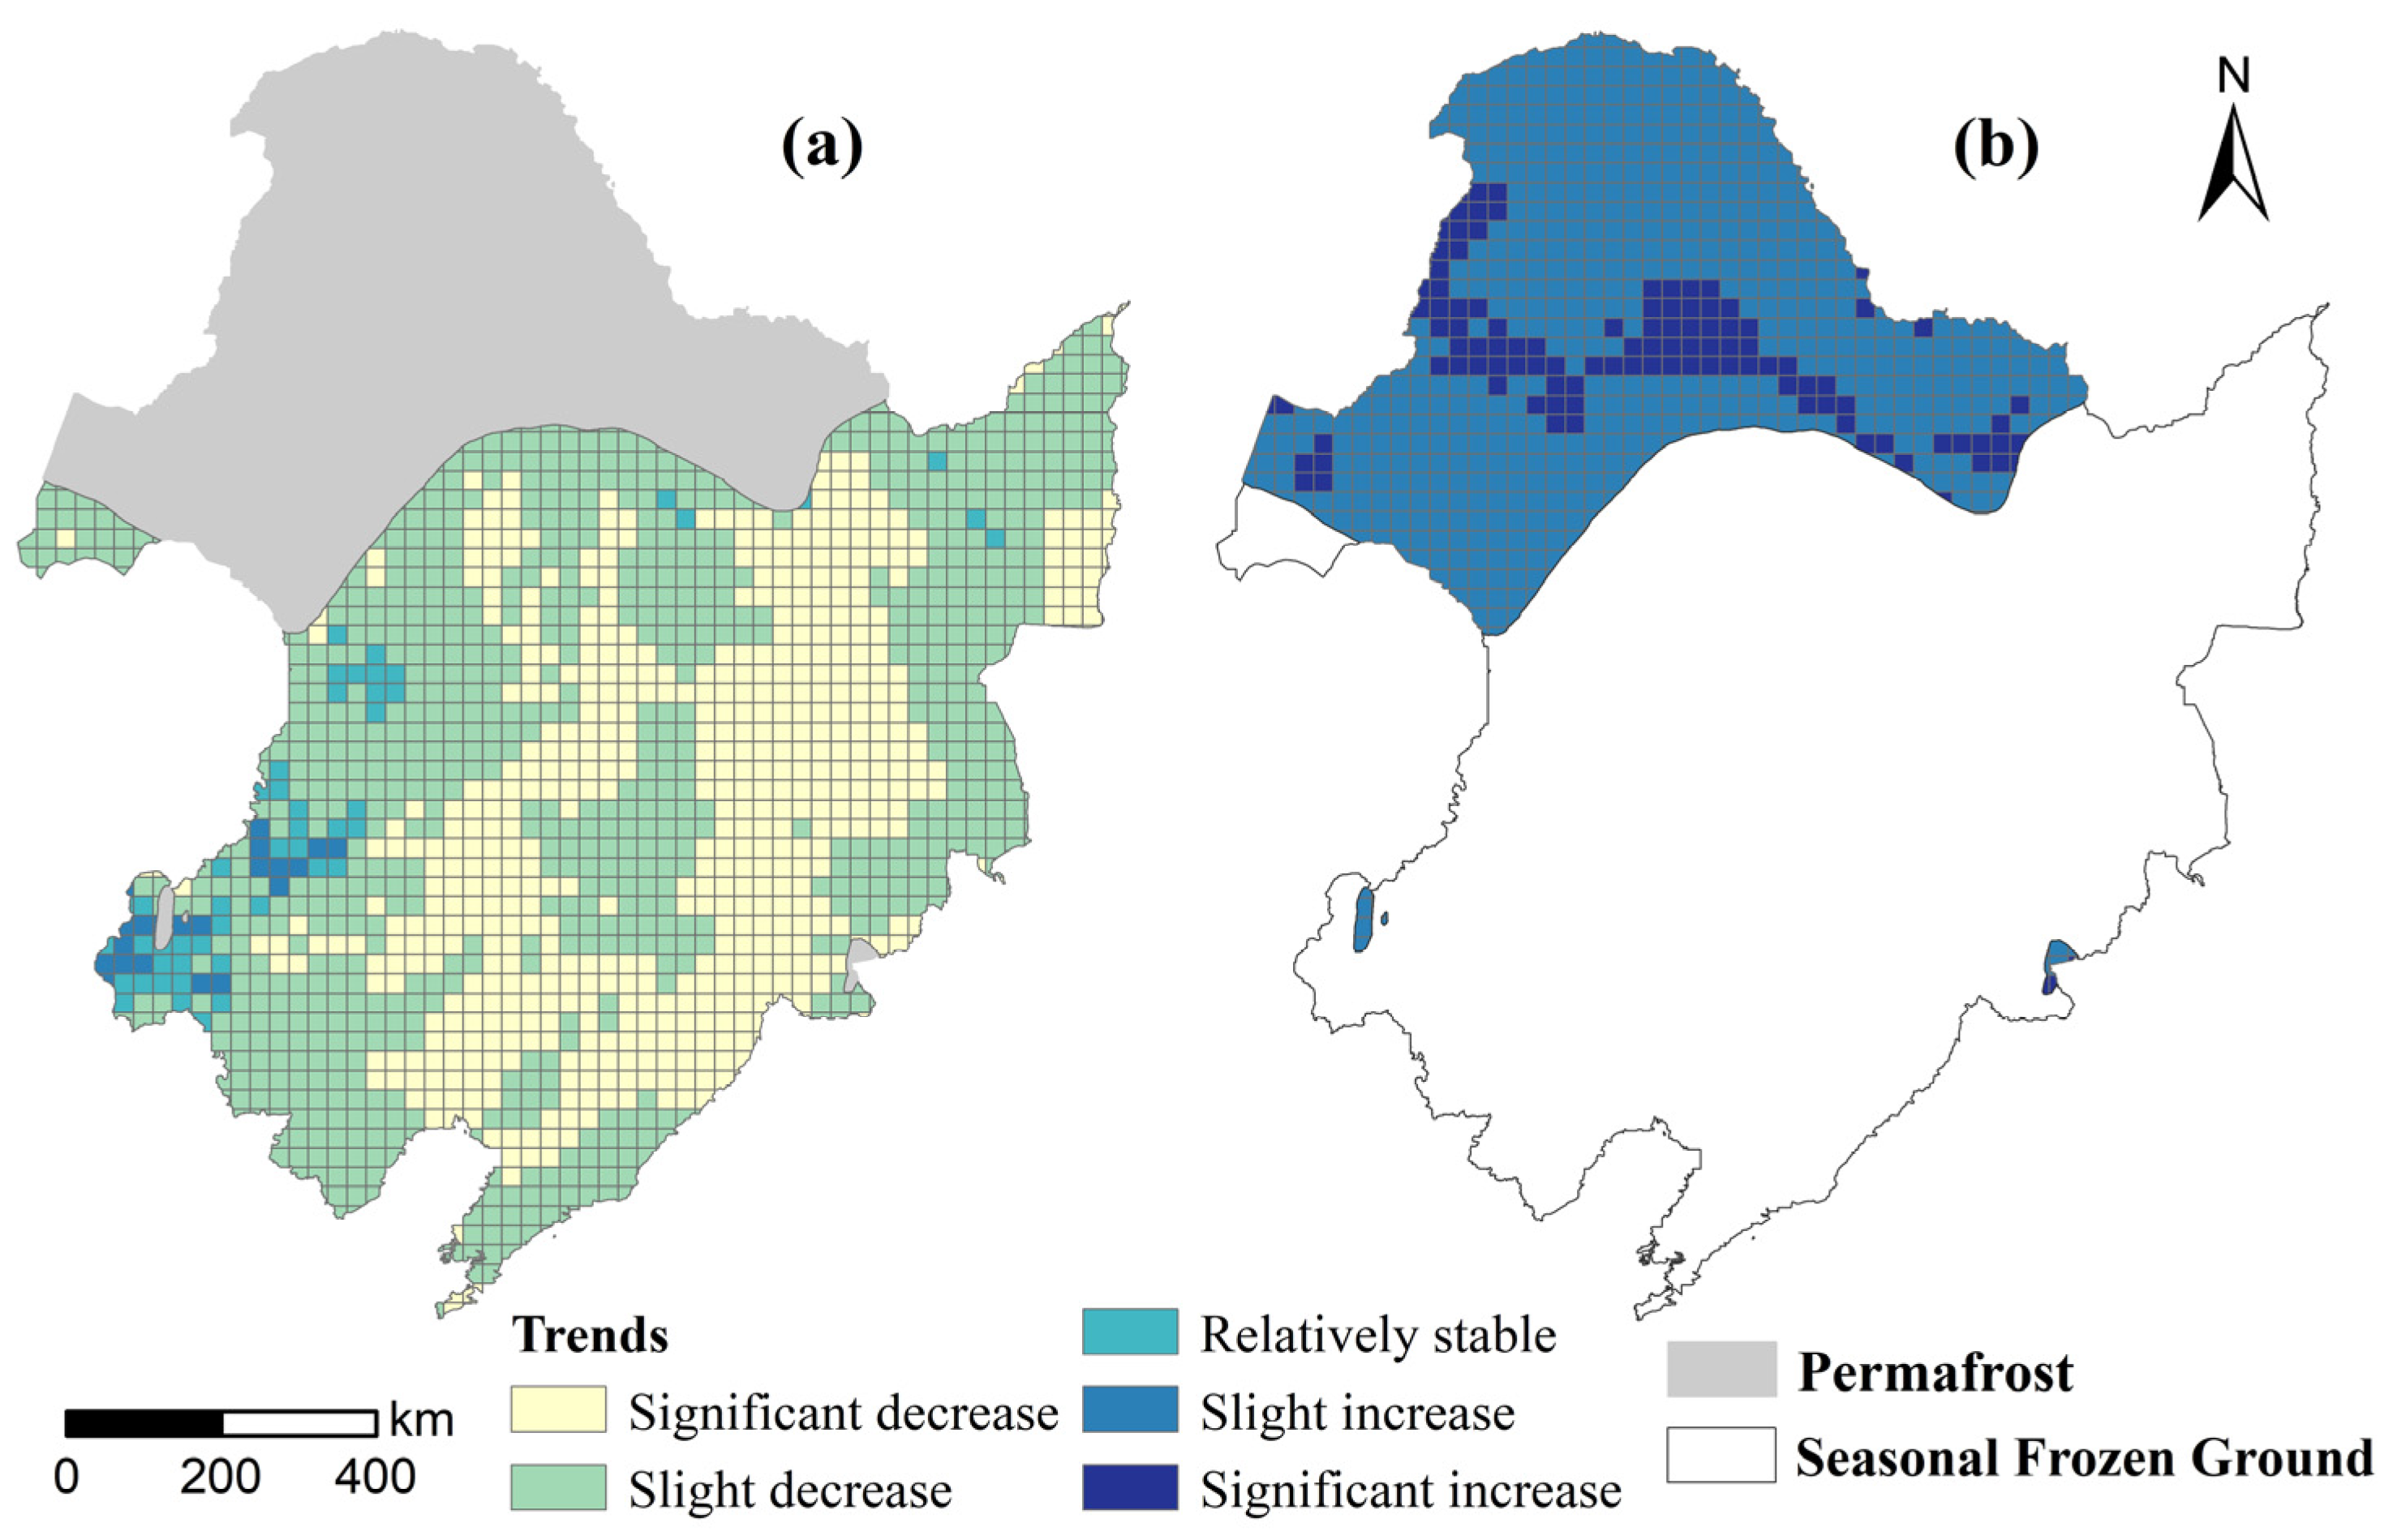
The MDSF decreases by about 25 cm at a rate of −6.31 cm/10 a from 1983 to 2022, which is consistent with the results of Chao et al. [11], who used station observation data to ascertain changes. As shown in Figure 12a, the vast majority of the region shows a decreasing trend in the MDSF from 1983–2022, with significant decreases accounting for 38.2% of the total area and widely distributed slight decreases accounting for 57.1% of the total area. The few areas that show relative stability with only a slight increase are mainly in the central and southern parts of the Da Xing’anling Mountains.
The depth of the ALT increased by approximately 22 cm from 1983 to 2022 in Northeast China, mainly at 5.49 cm/10 a. As shown in Figure 12b, a significantly increased ALT is mainly distributed in the northwestern part of the Da Xing’anling and the Xiao Xing’anling Mountains, accounting for 15.9% of the total area. The area of slight increase is widely distributed and accounts for 84.1%of the total.
3.5. Influencing Factors
Air temperature (X1), precipitation (X2), DEM (X3), NDVI (X4), volumetric soil water content (X5), surface net solar radiation (X6), snow depth (X7), and LST (X8) were selected as the driving factors in this study. As the FPDs, TFTDs, and CTPDs were calculated based on the freeze-thaw dates, the FFD (start of freeze), CTD (complete thaw), MDSF and ALT in 2022 were selected as the dependent variables for the driver analyses in this study. The 0–7 cm soil temperature at the time of FFD and CTD as well as MDSF and ALT values were the four dependent variables, and X1–X8 were the independent variables, respectively. The detection of FFD, CTD, MDSF, and ALT by each factor was obtained using factor detection and interaction detector.
The results of the single-factor detection show that the greatest explanatory power for FFD is given by LST (0.751), air temperature (0.719), and net surface solar radiation (0.487), and the explanatory power of all these factors is more than 48% (Table 4), which indicates that they are the main factors affecting FFD. The explanatory power of precipitation, DEM, and NDVI for FFD mainly ranged from 0.131 to 0.289, while snow depth had the weakest explanatory power (0.07). This is due to the fact that soil freezing dates in northeastern China generally occur from October to November when snowfall has not yet occurred in most of the region. LST (0.726), air temperature (0.589), and surface net solar radiation (0.471) ranked as the top three in terms of their explanatory power for CTD. In addition, snow depth (0.350) and DEM (0.267) had greater than 26% explanatory power for CTD, which indicates that factors such as DEM and snow depth indirectly play an important role when soil is thawing. The explanatory power of the remaining other factors such as precipitation and NDVI, in addition to the strong influence of LST, air temperature, and surface net solar radiation, ranged from 12.5% to 33.1% for both MDSF and ALT; this indicates that both are affected by a combination of factors. It is also noteworthy that the same factor has a high variability in its explanatory power for different soil freeze-thaw states. Soil volumetric water content ranked seventh in terms of explanatory power for FFD and rose to fourth for MDSF and ALT (0.331 and 0.316). Snow depth ranked eighth in terms of explanatory power for FFD and rose to fifth for both MDSF and ALT (0.276 and 0.298).
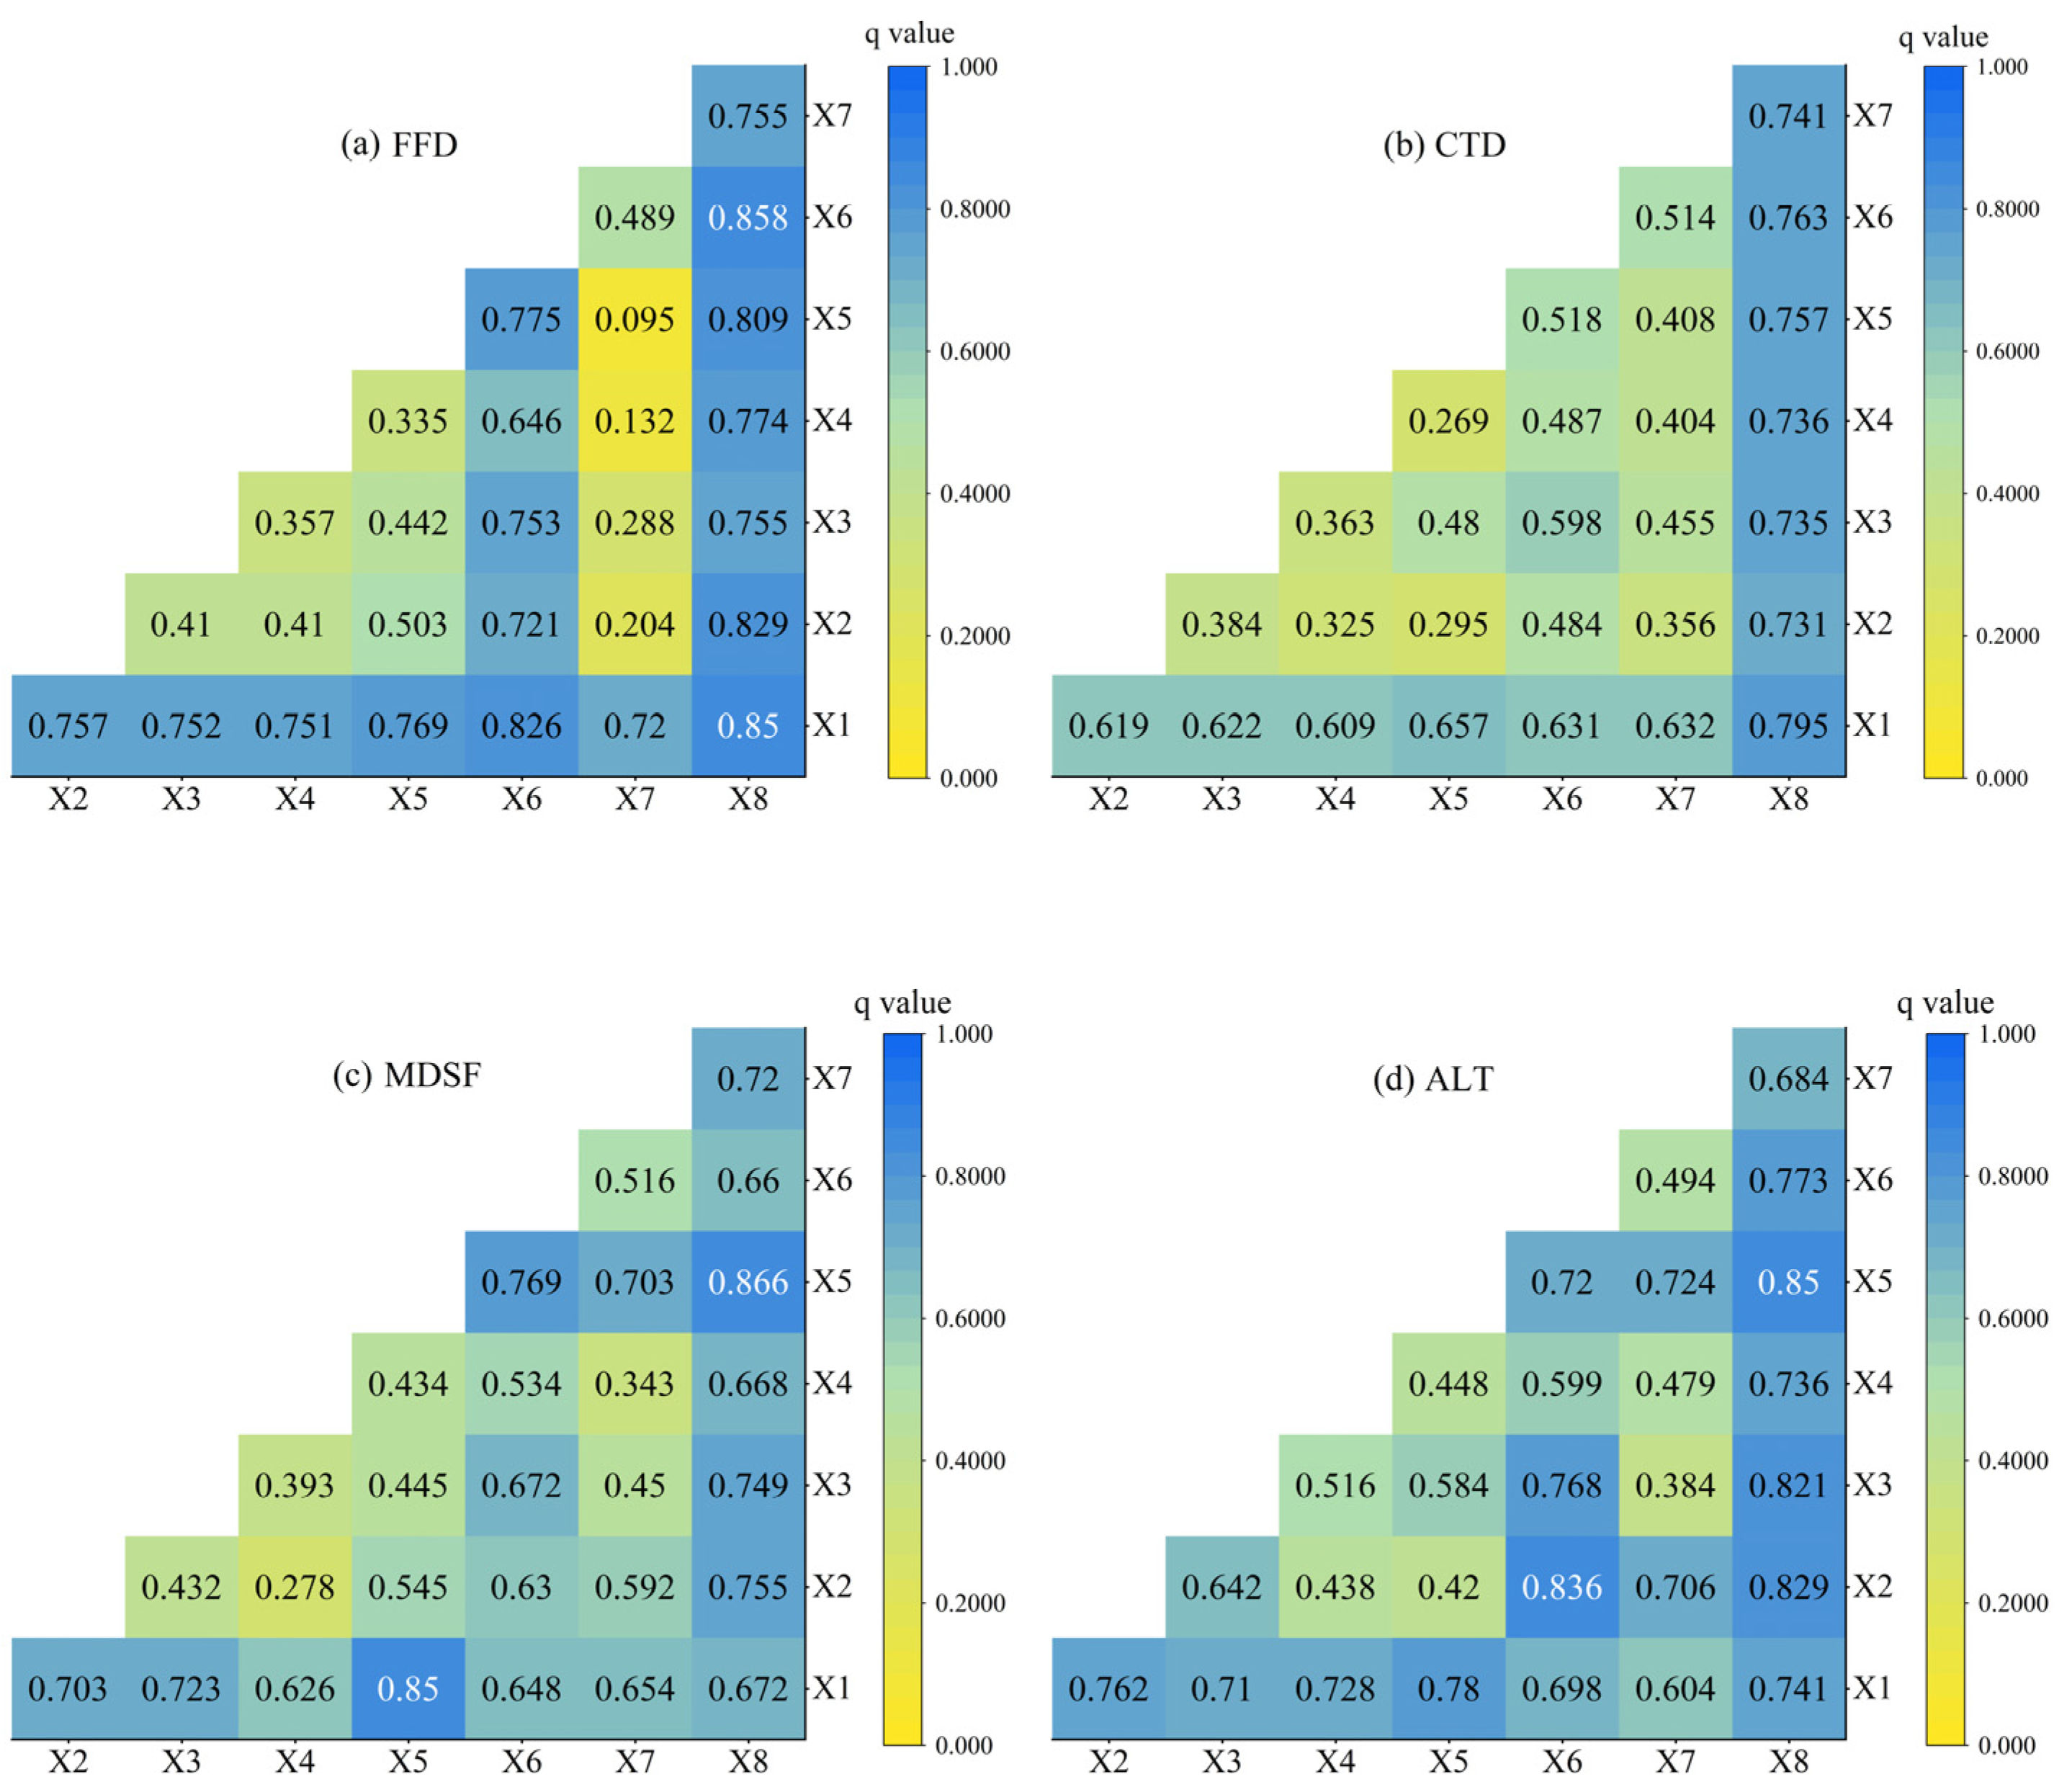
Interaction detection was then used to determine the effects of different factor interactions. The results showed that the influence of the interaction between two factors was greater than that of a single factor, with both two-factor and nonlinear enhancements suggesting that FFD, CTD, MDSF, and ALT are affected by the combined effects of multiple factors. As shown in Figure 13a–d, LST (X8) and surface net solar radiation (X6) interactions ranked first in terms of explanatory power for FFD (0.858), and LST (X8) and air temperature (X1) ranked first in terms of explanatory power for CTD (0.795). The explanatory power of all these factors was significantly increased after the interaction, and this result corroborated the single-factor detection results, further indicating that LST, air temperature, and surface net solar radiation dominate in soil freezing and thawing. LST (X8) and soil volumetric water content (X5) had the greatest explanatory power (0.866) for MDSF after interacting. This is because when the soil temperature drops below 0°C, the water in the soil begins to change from liquid to solid and solidifies with the moist soil particles, and the lower the temperature, the longer the duration and the greater the freezing depth. ALT was likewise strongly affected by LST (X8) and the volumetric soil water content (X5), with an explanatory power of 0.85 after their interaction. ALT in the high latitudes of the Northern Hemisphere generally reaches its maximum in summer [3], which may be related to gradually increasing precipitation and snowmelt in late spring and early summer, which recharges soil moisture and contributes to frozen soil thawing. In summary, the interaction of LST and the surface net solar radiation had the greatest effect when the soil started to freeze, and the greatest effect of LST and air temperature occurred when the soil was completely thawed. MDSF and ALT were mainly affected by the interaction of LST and the soil volumetric water content.
3.6. Reliability Analysis
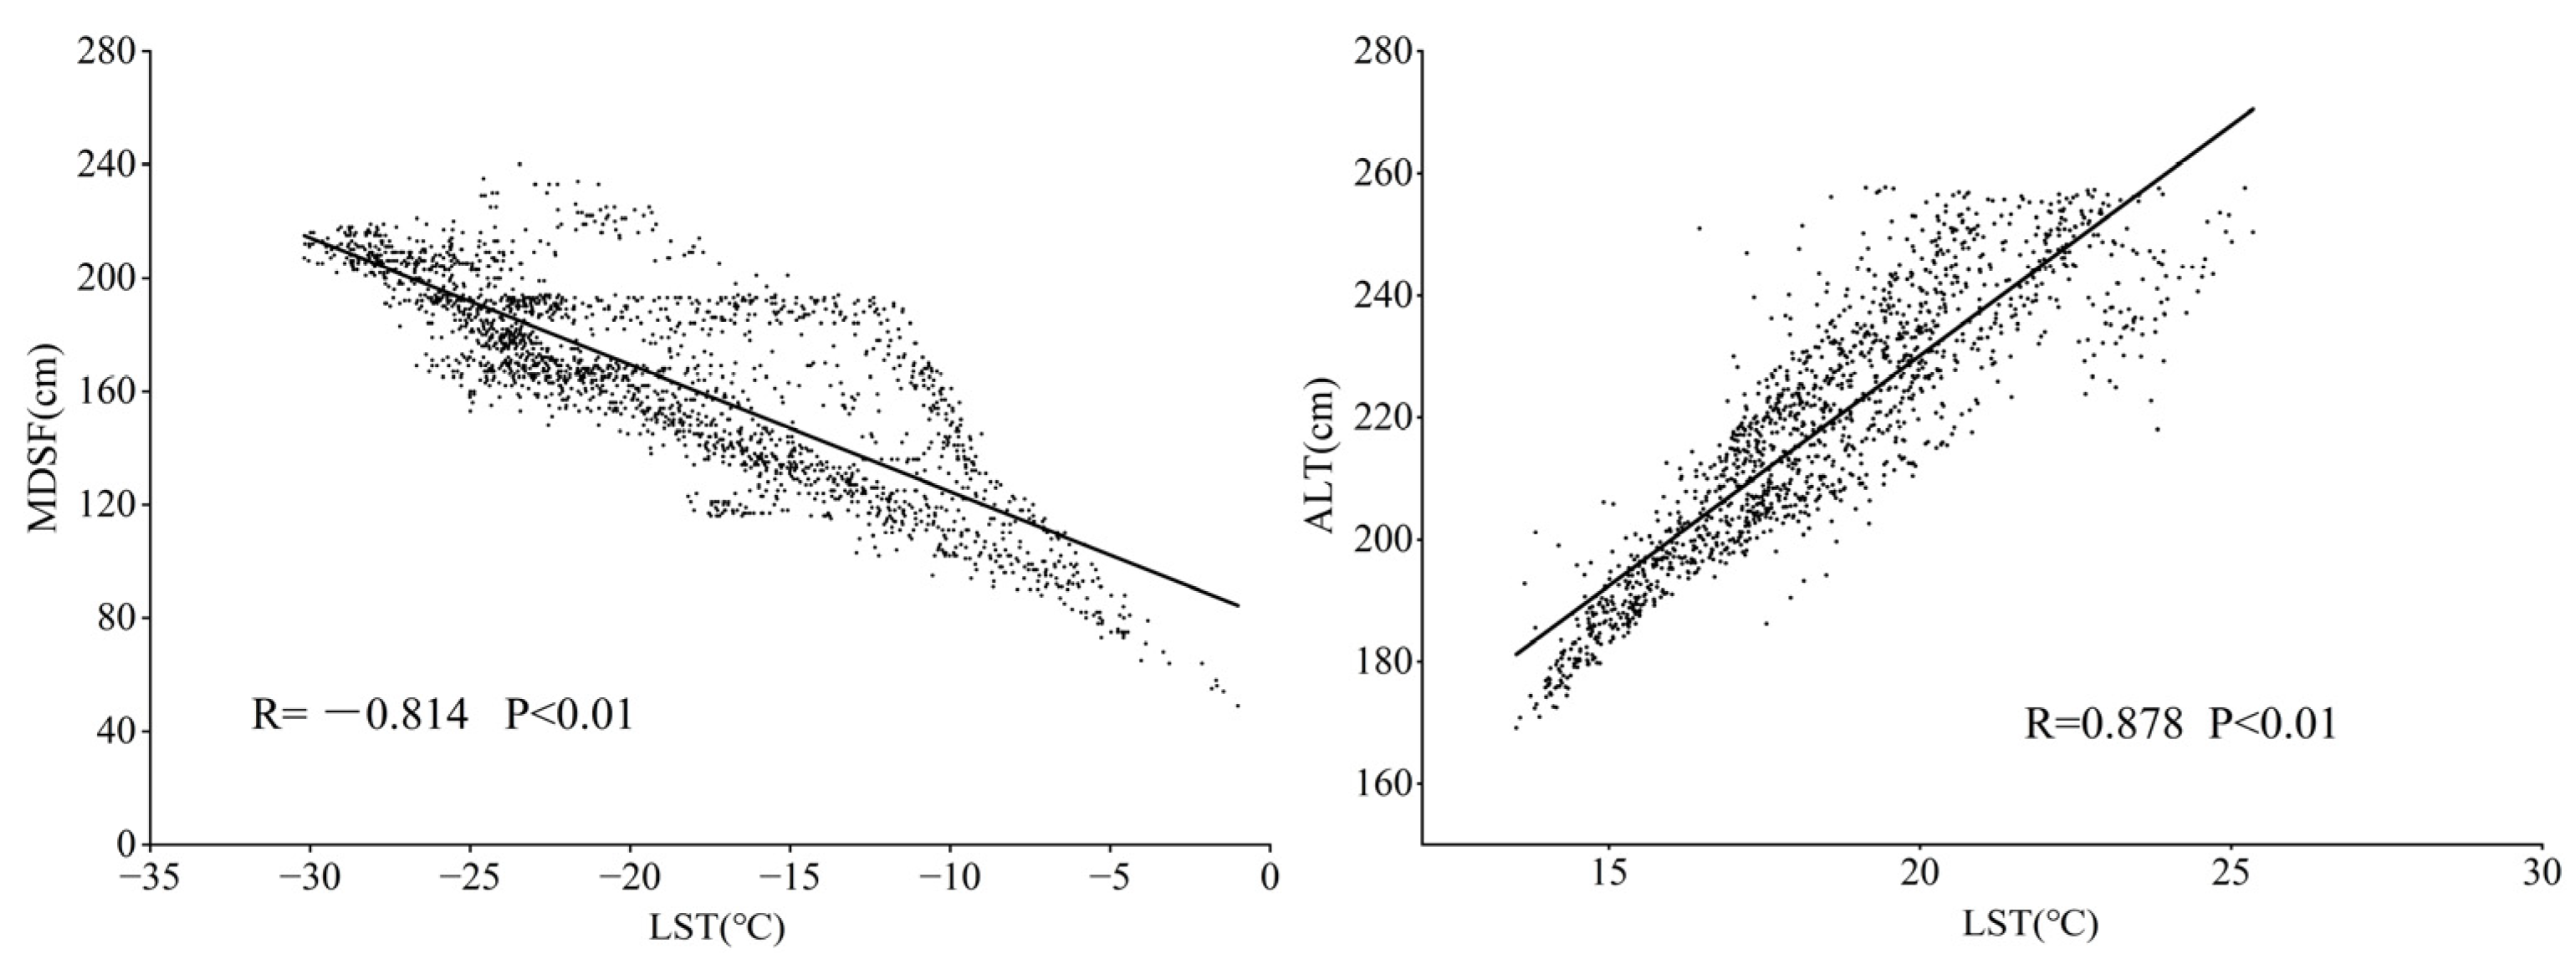
As soil temperature located at 0 cm has a direct effect on MDSF and ALT, in order to assess the reliability of the MDSF and ALT simulations, this study used LST data to validate the simulation results. As shown in Figure 14, there was a significant correlation between LST and MDSF with a correlation coefficient of R = −0.814 (p < 0.01). LST was likewise significantly correlated with ALT with a correlation coefficient of R = 0.878 (p < 0.01). Therefore, the results indicate that the simulation results for MDSF and ALT are sufficiently reliable.
4. Discussion
The spatial distribution of FFD in northeastern China shows obvious latitudinal zonal characteristics, and DEM also plays an important role. Freezing started to occur in early October in the northern part of the Da Xing’anling Mountains, mostly in mid- to late October in the central part of Heilongjiang, and was delayed until the end of November in the southern Liaodong Peninsula, whereas it occurred relatively late in the central plains at the same latitude. In terms of the CTD, complete thawing begins in mid-to-late March in southern Liaoning, and in early May in parts of the Da Xing’anling, Xiao Xing’anling, and Changbai Mountains. It has been shown that the average air temperature increases significantly during all seasons in Northeast China [39]. In this study, significantly delayed and advanced trends were observed for the FFD and CTD in Northeast China, indicating that soils are strongly affected by increasing temperatures in both the cool and warm seasons. In addition, the ALT increased at a rate of 5.49 cm/10 a, whereas the MDSF decreased at a rate of −5.97 cm/10 a, which is significantly higher than the average decreasing trend observed in Eurasia (−0.45 cm/ a) [40].
Both the climate and local factors such as DEM, NDVI, and snow depth influence soil freezing and thawing. It was found that LST ranked first in terms of single-factor explanatory power for FFD, CTD, MDSF, and ALT in the Northeast than the air temperature (Table 4). This indicates that LST has a macro-regulatory effect on soil freezing and thawing in Northeast China, which is consistent with the results of the others [41]. This indicates that surface temperature is more appropriate than air temperature for modelling the effects of climate change on ecology, the environment, and especially the permafrost of the cryosphere. The explanatory power of surface net solar radiation is ranked third in all cases, and it mainly affects changes in the process of heat absorption at the surface, which transfers energy to increase soil temperature [42]. In the local factors, the DEM was the main factor influencing the ground thermal state divergence, with higher elevations in the Daxinganling, Xiaoxinganling, and Changbai Mountains where the FFD occurs earlier and the CTD later. Vegetation reduces the soil temperature in summer by reducing the amount of direct solar radiation received via reflection and transpiration, and it acts as a thermal insulator that blocks soil heat dissipation and insulates the soil in winter by reducing the near-surface wind speed [43]. Snow affects the surface water-heat balance through water-heat exchange and phase-change processes, such as the reflection of solar radiation or sublimation by melting, and is an important local factor that affects soil freezing and thawing at high latitudes [3]. As shown in Table 4, snow depth had the highest explanatory power for CTD (0.350) and the following explanatory power for ALT (0.298). This is because Northeast China, the second snowiest region in China, has a thicker and longer snowpack that effectively prevents surface heat loss. During the spring and early summer, the snow cover has a delaying effect on soil thawing, while during the warm season, water from snowmelt acts as a recharge to soil moisture, which, in combination with other factors, has a significant effect on ALT. It is worth noting that precipitation and NDVI, while not outstanding in terms of their single-factor explanatory powers, interacted with LST to explain more than 66% of each of the four dependent variables (Figure 13). The explanatory power of ALT reached 0.829 after the interaction of precipitation and LST, and 0.774 after the interaction of NDVI and LST, and the effects of both precipitation and NDVI on ALT were higher than those of FFD, CTD, and MDSF (Table 4), which is consistent with the results of the others [44,45]. This is due to warmer temperatures and increased precipitation during the warm season when vegetation is in its growing season, both of which are factors that significantly impact the soil thaw depth [45]. In addition, the same factors had differential effects on different soil freeze-thaw states of the soil, with volumetric soil water content ranking seventh in explaining FFD, fourth in explaining MDSF and ALT, and becoming the dominant factor affecting MDSF and ALT after interacting with LST. This is because soil moisture undergoes phase change during freezing and thawing, profoundly affecting the surface-subsurface energy transfer and heat transfer and influencing the freeze-thaw state of the soil.
Under the drastic influence of global warming, the annual mean temperature in Northeast China has increased significantly at a rate of 0.38 °C/10 a (p < 0.01) over recent decades [39], with a gradual northward shift of the permafrost boundary, a significant decrease in the MDSF, and a significant increase in the ALT. Frozen soil degradation leads to the melting of subterranean ice and the lowering of the water table [46], altering the transport patterns of surface and groundwater [47], while leading to the degradation, shrinkage, and even extinction of vegetation which brings great threats to the fragile alpine ecosystem [48]. It has been shown that a reduction in the MDSF is the main reason for the advancement of the vegetation growing season [49]. The growing season has been extended compared to the previous one, which is beneficial for adjusting the cropping system. However, the gradual degradation of frozen soil means that the water-holding capacity of the soil decreases, making it susceptible to drought during years with low spring precipitation [50]. In addition, higher soil temperatures make it easier for insect eggs to overwinter, leading to an increase in the number of crop pests and diseases, decreasing grain production [51] and increasing freeze-thaw erosion in Northeast China, which in turn impacts China’s food security [8].
Although this study contributes to understanding the changes in the soil freeze-thaw state, MDSF, and ALT in Northeast China and their drivers, several limitations remain. First, the spatial resolution of the ERA5-LAND hour-by-hour 0–7 cm soil temperature data is 9 km, and the influence factor LST is different from the temperature beneath the surface cover, so there may be some differences between the results obtained and the real soil freezing and thawing conditions. Higher-resolution and deeper layers of temperature data beneath the surface cover must be selected for future studies and their differences quantitatively compared. Second, as both MDSF and ALT values in this study were obtained by simulation using Stefan’s formula, validation of the accuracy of the results needs to be carried out in future studies. Third, frozen soil degradation will inevitably lead to the release of a large amount of soil organic carbon, which will exacerbate climate warming and bring about a series of adverse impacts on the environment. In the future, research on the interrelationship between frozen soil degradation and soil organic carbon should be strengthened, specifically reseach regarding its specific impacts on human economic and environmental change. Finally, Northeast China is an important commercial grain production base [52], and given the high productivity and extension of these lands, significant changes in soil freezing and thawing will inevitably impact grain production and food security. Consequently, it will be a key issue for future research to protect agricultural production in the studied region to effectively address climate change and global warming and thus achieve sustainable development.
5. Conclusions
In this study, the soil freeze-thaw state was classified into three states: freezing, thawing, and complete thawing based on the hour-by-hour 0–7 cm soil temperature data from ERA5-LAND, and the number of days of changes in each state was derived based on the specific dates of freezing, thawing, and complete thawing of the soil in 1983 and 2022. The MDSF and ALT in Northeast China were simulated using Stefan’s formula, and the drivers of the changes in FFD, CTD, MDSF, and ALT were analyzed by factors such as air temperature, precipitation, and LST, and the following conclusions were drawn.
The FFD in Northeast China is delayed by about 6 days from 1983 to 2022, and the FTD and CTD are advanced by about 26 and 20 days, respectively. In the freeze-delayed and thaw-advanced states, FPDs and TFTDs decrease by about 29 and 23 days, respectively, and CTPDs increase by about 22 days. In addition, MDSF decreased by about 25 cm and ALT increased by about 22 cm.
The LST was the dominant factor affecting FFD, CTD, MDSF, and ALT in Northeast China, followed by factors such as air temperature, surface net solar radiation, and volumetric soil water content. There was variability in the effects of the driving factors on different soil freeze-thaw states. The interactive explanatory power of the LST and surface net solar radiation was highest when the soil started to freeze (0.858), and the effects of the LST and the air temperature were highest when the soil was completely thawed (0.795). The LST and the volumetric soil water content interacted to have the first explanatory power for both MDSF (0.866) and ALT (0.85).
The changes in FFD, CTD, MDSF, and ALT in Northeast China profoundly affect the ecological environment, infrastructure construction, and agricultural production in the high-latitude cold region. Therefore, clarifying their detailed changes and driving factors is of great theoretical value and research significance for realizing the coordinated development of the regional ecological and socio-economic environment. In addition, the monitoring of agricultural, climatic and environmental changes should be strengthened. It would be conducive to responding to the negative impacts of global warming and thus to achieving sustainable development.
Author Contributions
Conceptualization, J.Y. and H.Y.; formal analysis, J.Y., H.Y. and L.L.; writing—original draft preparation, J.Y.; writing—review and editing, H.Y. and L.L.; validation, H.Y. and L.L.; supervision, W.Z. All authors have read and agreed to the published version of the manuscript.
Funding
This work was supported by the Jilin Province Science and Technology Development Plan (Grant No. YDZJ202201ZYTS478), the Youth Program by the National Natural Science Foundation of China (Grant No. 41901123), and the National Natural Science Foundation of China (Grant No. 41830643).
Data Availability Statement
The original contributions presented in the study are included in the article, further inquiries can be directed to the corresponding author.
Conflicts of Interest
The authors declare no conflicts of interest.
References
- Xu, X.; Wu, Q. Active Layer Thickness Variation on the Qinghai-Tibetan Plateau: Historical and Projected Trends. J. Geophys. Res. Atmos. 2021, 126, e2021JD034841. [Google Scholar] [CrossRef]
- Luo, D.; Jin, H.; Lv, L.; Wu, Q. Spatiotemporal characteristics of freezing and thawing of the active layer in the source areas of the Yellow River. Chin. Sci. Bull. 2014, 59, 1327–1336. [Google Scholar] [CrossRef]
- Luo, D.; Jin, H.; Wu, Q. Active layer thickness (ALT) in permafrost regions under natural/undisturbed state: A review. J. Glaciol. Geocryol. 2023, 45, 558–574. [Google Scholar] [CrossRef]
- Li, Y.; Wen, J.; Liu, W.; Chen, Y. The Spatio-temporal Distribution of the Start-end Date and Freezing Depth and their Relationships with Air Temperature over the Western China. Plateau Meteorol. 2023, 42, 657–670. [Google Scholar] [CrossRef]
- Xu, S.; Fu, Q.; Li, T.; Meng, F. Spatiotemporal characteristics of the soil freeze-thaw state and its variation under different land use types—A case study in Northeast China. Agric. For. Meteorol. 2022, 312, 108737. [Google Scholar] [CrossRef]
- Zhao, D.; Liu, J. A review of main studies on permafrost degradation in northeast China. Sci. Technol. Eng. 2022, 22, 13151–13161. [Google Scholar]
- Chen, S.; Zang, S.; Sun, L. Permafrost degradation in Northeast China and its environmental effects:present situation and prospect. J. Glaciol. Geocryol. 2018, 40, 298–306. [Google Scholar] [CrossRef]
- Zuo, X.; Wang, L. Effects of Freeze-thaw Cycles and Soil Properties on Mollisol Shear Strength in Chinese Black Soil Region. J. Soil Water Conserv. 2020, 34, 30–35+42. [Google Scholar] [CrossRef]
- Han, Y. Discussion on the impact of global warming on agriculture, analysis of its causes and countermeasures. Anhui Agric. Sci. 2011, 39, 9884–9885+10006. [Google Scholar] [CrossRef]
- Chang, X.; Jin, H. Review of permafrost monitoring in the Northern Daxinganling, Northeast China. J. Glaciol. Geocryol. 2013, 35, 93–100. [Google Scholar] [CrossRef]
- Chao, H. Characteristics of spatial and temporal variations of permafrost in Northeast China. Mod. Agric. Technol. 2019, 18, 144–147+153. [Google Scholar]
- Chen, S.; Zang, S.; Sun, L. Dynamic Variation of Soil Moisture and Impact in Permafrost Regions in Northeast China. Res. Soil Water Conserv. 2020, 27, 113–118. [Google Scholar] [CrossRef]
- Gong, Q. Detailed analysis of spatial and temporal characteristics of ground temperature and frost depth in Northeast China. J. Glaciol. Geocryol. 2021, 43, 1782–1793. [Google Scholar] [CrossRef]
- Zhang, L.; Yao, Y.; Bei, X.; Jia, K. Assessing the Remotely Sensed Evaporative Drought Index for Drought Monitoring over Northeast China. Remote Sens. 2019, 11, 1960. [Google Scholar] [CrossRef]
- Wang, S.; Zhou, C.; Liu, J. Simulation Analyses of Terrestrial Carbon Cycle Balance Model in Northeast China. Acta Geogr. Sin. 2001, 56, 390–400. [Google Scholar] [CrossRef]
- Li, Y.; Liu, D.; Li, T.; Fu, Q. Responses of spring soil moisture of different land use types to snow cover in Northeast China under climate change background. J. Hydrol. 2022, 608, 127610. [Google Scholar] [CrossRef]
- Mao, D.; Wang, Z. Dynamic changes of vegetation net primary productivity in permafrost zone of Northeast China in 1982–2009 in response to global change. Chin. J. Appl. Ecol. 2012, 23, 1511–1519. [Google Scholar] [CrossRef]
- Shi, Y.; Mi, D. 1:4 Million Map of Snow, Ice, and Frozen Ground in China; National Cryosphere Desert Data Center: Lanzhou, China, 1990; Volume 12, p. 7. Available online: http://www.ncdc.ac.cn (accessed on 19 October 2023). [CrossRef]
- Munoz-Sabater, J.; Dutra, E.; Agusti-Panareda, A.; Albergel, C. ERA5-Land: A state-of-the-art global reanalysis dataset for land applications. Earth Syst. Sci. Data 2021, 13, 4349–4383. [Google Scholar] [CrossRef]
- Zhao, D.; Zhang, L.; Zhou, T.; Liu, J. Contributions of Local and Remote Atmospheric Moisture Fluxes to East China Precipitation Estimated from CRA-40 Reanalysis. J. Meteorol. Res. 2021, 35, 32–45. [Google Scholar] [CrossRef]
- Shan, S.; Shen, R. Evaluation of Land Surface Temperature and 2 m Air Temperature fromFive Reanalyses Datasets across North China in Winter. Plateau Meteorol. 2020, 39, 37–47. [Google Scholar] [CrossRef]
- Ling, X.; Huang, Y.; Guo, W.; Wang, Y. Comprehensive evaluation of satellite-based and reanalysis soil moisture products using in situ observations over China. Hydrol. Earth Syst. Sci. 2021, 25, 4209–4229. [Google Scholar] [CrossRef]
- Dutra, E.; Balsamo, G.; Viterbo, P.; Miranda, P.M.A. An Improved Snow Scheme for the ECMWF Land Surface Model: Description and Offline Validation. J. Hydrometeorol. 2010, 11, 899–916. [Google Scholar] [CrossRef]
- Yang, S.; Wu, T.; Li, R.; Zhu, X. Spatial-temporal Changes of the Near surface Soil Freeze-thaw Status over the Qinghai-Tibetan Plateau. Plateau Meteorol. 2018, 37, 43–53. [Google Scholar] [CrossRef]
- Yang, M.; Hirose, N.; Hideyuki, F. Daily freeze-thaw cycles in surface soils of the Tibetan Plateau. Chin. Sci. Bull. 2006, 52, 1974–1976. [Google Scholar] [CrossRef]
- Central Meteorological Administration. Specification for Surface Meteorological Observation-General; Meteorological Press: Beijing, China, 2003. Available online: http://www.cma.gov.cn (accessed on 9 October 2023).
- Wang, X.; Chen, R.; Liu, G.; Yang, Y. Spatial distributions and temporal variations of the near-surface soil freeze state across China under climate change. Glob. Planet. Chang. 2019, 172, 150–158. [Google Scholar] [CrossRef]
- Shen, T.; Jiang, P.; Ju, Q.; Yu, Z. Changes in permafrost spatial distribution and active layer thickness from 1980 to 2020 on the Tibet Plateau. Sci. Total Environ. 2023, 859, 60381. [Google Scholar] [CrossRef]
- Liu, W.; Xie, C. Application of Stefan equation on simulating freezing-thawing process of permafrost. J. Glaciol. Geocryol. 2022, 44, 327–339. [Google Scholar] [CrossRef]
- Xu, X.; Wu, Q.; Zhang, Z. Responses of active layer thickness on the Qinghai-Tibet Plateau to climate change. J. Glaciol. Geocryol. 2017, 39, 1–8. [Google Scholar] [CrossRef]
- GB50324-2014; Specification for Geological Investigation of Permafrost Engineering. Ministry of Housing and Urban-Rural Development of the People’s Republic of China: Beijing, China, 2014.
- Ali, R.; Kuriqi, A.; Abubaker, S.; Kisi, O. Long-Term Trends and Seasonality Detection of the Observed Flow in Yangtze River Using Mann-Kendall and Sen’s Innovative Trend Method. Water 2019, 11, 1855. [Google Scholar] [CrossRef]
- Cai, B.; Yu, R. Advance and evaluation in the long time series vegetation trends research based on remote sensing. Natl. Remote Sens. Bull. 2009, 13, 1170–1186. [Google Scholar] [CrossRef]
- Yuan, L.; Jiang, W.; Shen, W. The spatio-temporal variations of vegetation cover in the Yellow River Basin from 2000 to 2010. Acta Ecol. Sin. 2013, 33, 7798–7806. [Google Scholar] [CrossRef]
- Yue, S.; Pilon, P.; Cavadias, G. Power of the Mann–Kendall and Spearman’s rho tests for detecting monotonic trends in hydrological series. J. Hydrol. 2002, 259, 254–271. [Google Scholar] [CrossRef]
- Wang, J.; Xu, C. Geodetector: Principle and prospective. Acta Geogr. Sin. 2017, 72, 116–134. [Google Scholar] [CrossRef]
- Xu, X.; Wu, Q. Research on the variation characteristics of active layer thickness of permafrost in the Three River Source Region. J. Glaciol. Geocryol. 2024, 1, 1–15. [Google Scholar]
- Li, J.; Jiao, M.; Hu, C.; Li, F. Characteristics of summer temperature and its impact factors in Northeast China from 1951 to 2012. J. Meteorol. Environ. 2016, 32, 74–83. [Google Scholar] [CrossRef]
- He, W.; Bu, R.; Xiong, Z. Characteristics of temperature and precipitation in Northeastern China from 1961 to 2005. Acta Ecol. Sin. 2013, 33, 519–531. [Google Scholar] [CrossRef]
- Frauenfeld, O.W.; Zhang, T. An observational 71-year history of seasonally frozen ground changes in the Eurasian high latitudes. Environ. Res. Lett. 2011, 6, 044024. [Google Scholar] [CrossRef]
- Luo, D.; Jin, H.; Marchenko, S.S.; Romanovsky, V.E. Difference between near-surface air, land surface and ground surface temperatures and their influences on the frozen ground on the Qinghai-Tibet Plateau. Geoderma 2018, 312, 74–85. [Google Scholar] [CrossRef]
- Li, L.; Li, Y. Changing Trend and Reasons of Winter Maximum Frozen Soil Depth in Shiyang River Basin. Chin. J. Soil Sci. 2012, 43, 587–593. [Google Scholar] [CrossRef]
- Gao, Y.; Luo, D. Characteristics of the thermal regime and freeze-thaw cycles on the ground surface in permafrost regions in the Headwater Area of the Yellow River. Acta Geogr. Sin. 2023, 78, 604–619. [Google Scholar] [CrossRef]
- Peng, X.; Zhang, T.; Frauenfeld, O.W.; Wang, K. Response of seasonal soil freeze depth to climate change across China. Cryosphere 2017, 11, 1059–1073. [Google Scholar] [CrossRef]
- Peng, X. Spatial-Temporal Variations of Seasonally Frozen Ground and Its Response to Climate Change in the Northern Hemisphere. 2017. Available online: https://kns.cnki.net/kcms2/article/abstract?v=0Vs2Vpqj5we0lftwlIXfOgJxQ3PbzOQu62-0imUfgBoN__wtBn1jMxJmyX-VNTMbHxcqFiIwbQyEJntI4ti1x0FtxLy_THX_zu4r5ukrJ2FUNU35MwdLSJDqJkWIQmlqu6c_5Zz_s4Dh0Ul8UqoC9g==&uniplatform=NZKPT&language=CHS (accessed on 1 March 2024).
- Cao, W.; Sheng, Y.; Wu, J.; Peng, E. Review and Outlook on Hill-Slope Hydrological Process Affected by Permafrost Degradation. J. China Hydrol. 2020, 40, 1–6. [Google Scholar] [CrossRef]
- Yue, S.; Yan, Y.; Zhang, S. Spatiotemporal variations of soil freeze-thaw state in Northeast China based on the ERA5-LAND dataset. Acta Geogr. Sin. 2021, 76, 2765–2779. [Google Scholar] [CrossRef]
- Ye, R.; Cang, J. Study of groundwater in permafrost regions of China: Status and process. J. Glaciol. Geocryol. 2019, 41, 183–196. [Google Scholar]
- Qin, Y.; Lei, H.; Yang, D.; Gao, B. Long-term change in the depth of seasonally frozen ground and its ecohydrological impacts in the Qilian Mountains, northeastern Tibetan Plateau. J. Hydrol. 2016, 542, 204–221. [Google Scholar] [CrossRef]
- Ding, Y.; Gong, X.; Xing, Z.; Cai, H. Attribution of meteorological, hydrological and agricultural drought propagation in different climatic regions of China. Agric. Water Manag. 2021, 255, 106996. [Google Scholar] [CrossRef]
- Xing, Y. Possible Influence of Effects of Greenhouse on Agriculture and Its Countermeasures. Res. Agric. Mod. 2004, 1, 72–76. [Google Scholar]
- Han, X.; Zhou, W. Research Perspectives and Footprint of Utilization and Protection of Black Soil in Northeast China. Acta Pedol. Sin. 2021, 58, 1341–1358. [Google Scholar] [CrossRef]
Figure 1.
Location map of the study area.

Figure 2.
Spatial and temporal distribution of the first freezing day (FFD).

Figure 3.
Spatial and temporal distribution of the first thawing day (FTD).

Figure 4.
Spatial and temporal distribution of the complete thawing day (CTD).

Figure 5.
Spatial and temporal distribution of the freeze period days (FPDs).

Figure 6.
Spatial and temporal distribution of the total freeze-thaw days (TFTDs).

Figure 7.
Spatial and temporal distribution of the complete thaw period days (CTPDs).

Figure 8.
Spatial and temporal distribution of the maximum depth of the seasonal freezing (MDSF).

Figure 9.
Spatial and temporal distribution of the active layer thickness (ALT).

Figure 10.
Trends in the first day of freezing (FFD), the first day of thawing (FTD), and the day of complete thaw (CTD). Notes: (a) FFD, (b) FTD, and (c) CTD.
Figure 10.
Trends in the first day of freezing (FFD), the first day of thawing (FTD), and the day of complete thaw (CTD). Notes: (a) FFD, (b) FTD, and (c) CTD.

Figure 11.
Trends of the freeze period days (FPDs), the total freeze-thaw days (TFTDs), and the complete thaw period days (CTPDs). Notes: (a) FPDs, (b) TFTDs, and (c) CTPDs.
Figure 11.
Trends of the freeze period days (FPDs), the total freeze-thaw days (TFTDs), and the complete thaw period days (CTPDs). Notes: (a) FPDs, (b) TFTDs, and (c) CTPDs.

Figure 12.
Trends in the maximum depth of the seasonal freezing (MDSF) and the active layer thickness (ALT). Notes: (a) MDSF and (b) ALT.
Figure 12.
Trends in the maximum depth of the seasonal freezing (MDSF) and the active layer thickness (ALT). Notes: (a) MDSF and (b) ALT.

Figure 13.
Interactive detection results: (a) FFD, (b) CTD, (c) MDSF, and (d) ALT. Notes: X1: air temperature; X2: precipitation; X3: DEM; X4: NDVI; X5: volumetric soil water content; X6: surface net solar radiation; X7: snow depth; and X8: LST.
Figure 13.
Interactive detection results: (a) FFD, (b) CTD, (c) MDSF, and (d) ALT. Notes: X1: air temperature; X2: precipitation; X3: DEM; X4: NDVI; X5: volumetric soil water content; X6: surface net solar radiation; X7: snow depth; and X8: LST.

Figure 14.
Correlation between Land Surface Temperature (LST) and the maximum depth of the seasonal freezing (MDSF) and the active layer thickness (ALT).
Figure 14.
Correlation between Land Surface Temperature (LST) and the maximum depth of the seasonal freezing (MDSF) and the active layer thickness (ALT).


Table 1.
Interactions between explanatory variables and the associated interactive impacts.
| Interaction | Interaction Relationship |
|---|---|
| Nonlinear weakening | q(X1∩X2) < Min [q(X1), q(X2)] |
| Univariable weakening | Min [q(X1), q(X2)] < q(X1∩X2) < Max [q(X1), q(X2)] |
| Bivariate enhancement | q(X1∩X2) > Max [q(X1), q(X2)] |
| Independence | q(X1∩X2) = q(X1) + q(X2)] |
| Nonlinear enhancement | q(X1∩X2) > q(X1) + q(X2)] |
Table 2.
Percentage trends for FFD, FTD, and CTD.
| Sen’s Slope | Z | Trends | FFD | FTD | CTD |
|---|---|---|---|---|---|
| <−0.0005 | <−1.96 | Significant advance | 0.46% | 33.9% | 40.4% |
| <−0.0005 | −1.96–1.96 | Slight advance | 7.40% | 57.0% | 51.3% |
| −0.0005–0.0005 | −1.96–1.96 | Relative stable | 18.3% | 6.2% | 5.6% |
| ≥0.0005 | −1.96–1.96 | Slight delay | 52.2% | 2.7% | 2.5% |
| ≥0.0005 | ≥1.96 | Significant delay | 21.4% | 0% | 0% |
Table 3.
Percentage trends for FPDs, TFTDs, CTPDs, MDSF, and ALT.
| Sen’s Slope | Z | Trends | FPDs | TFTDs | CTPDs | MDSF | ALT |
|---|---|---|---|---|---|---|---|
| <−0.0005 | <−1.96 | Significant decrease | 22.0% | 22.1% | 0% | 38.2% | 0% |
| <−0.0005 | −1.96–1.96 | Slight decrease | 68.7% | 60.4% | 0.65% | 57.1% | 0% |
| −0.0005–0.0005 | −1.96–1.96 | Relative stable | 7.3% | 12.1% | 2.2% | 3.3% | 0% |
| ≥0.0005 | −1.96–1.96 | Slight increase | 2.0% | 5.2% | 61.1% | 1.4% | 84.1% |
| ≥0.0005 | ≥1.96 | Significant increase | 0% | 0% | 35.9% | 0% | 15.9% |
Table 4.
Single factor (q value) test results.
| Air Temperature | Precipitation | DEM | NDVI | Volumetric Soil Water Content | Surface Net Solar Radiation | Snow Depth | LST | |
|---|---|---|---|---|---|---|---|---|
| FFD | 0.719 | 0.198 | 0.287 | 0.131 | 0.095 | 0.487 | 0.07 | 0.751 |
| CTD | 0.589 | 0.194 | 0.267 | 0.133 | 0.189 | 0.471 | 0.350 | 0.726 |
| MDSF | 0.606 | 0.149 | 0.212 | 0.125 | 0.331 | 0.493 | 0.276 | 0.646 |
| ALT | 0.560 | 0.220 | 0.140 | 0.289 | 0.316 | 0.327 | 0.298 | 0.670 |
Disclaimer/Publisher’s Note: The statements, opinions and data contained in all publications are solely those of the individual author(s) and contributor(s) and not of MDPI and/or the editor(s). MDPI and/or the editor(s) disclaim responsibility for any injury to people or property resulting from any ideas, methods, instructions or products referred to in the content. |
© 2024 by the authors. Licensee MDPI, Basel, Switzerland. This article is an open access article distributed under the terms and conditions of the Creative Commons Attribution (CC BY) license (https://creativecommons.org/licenses/by/4.0/).
Share and Cite
MDPI and ACS Style
Yu, J.; Yu, H.; Li, L.; Zhu, W. Spatial and Temporal Changes in Soil Freeze-Thaw State and Freezing Depth of Northeast China and Their Driving Factors. Land 2024, 13, 368. https://doi.org/10.3390/land13030368
AMA Style
Yu J, Yu H, Li L, Zhu W. Spatial and Temporal Changes in Soil Freeze-Thaw State and Freezing Depth of Northeast China and Their Driving Factors. Land. 2024; 13(3):368. https://doi.org/10.3390/land13030368
Chicago/Turabian StyleYu, Jiangtao, Hangnan Yu, Lan Li, and Weihong Zhu. 2024. "Spatial and Temporal Changes in Soil Freeze-Thaw State and Freezing Depth of Northeast China and Their Driving Factors" Land 13, no. 3: 368. https://doi.org/10.3390/land13030368
Note that from the first issue of 2016, this journal uses article numbers instead of page numbers. See further details here.