
“It’s Only a Model”: When Protein Structure Predictions Need Experimental Validation, the Case of the HTLV-1 Tax Protein


Retroviruses and Structural Biochemistry Team, Molecular Microbiology and Structural Biochemistry, UMR 5086 CNRS-Lyon 1, CNRS, Université de Lyon, 69007 Lyon, France
*
Author to whom correspondence should be addressed.
Pathogens 2024, 13(3), 241; https://doi.org/10.3390/pathogens13030241
Submission received: 19 February 2024
/
Revised: 6 March 2024
/
Accepted: 7 March 2024
/
Published: 8 March 2024
(This article belongs to the Special Issue Retroviruses: Molecular Biology, Immunology and Pathogenesis)
Abstract
:Human T-cell Leukemia Virus type 1 (HTLV-1) is a human retrovirus responsible for leukaemia in 5 to 10% of infected individuals. Among the viral proteins, Tax has been described as directly involved in virus-induced leukemogenesis. Tax is therefore an interesting therapeutic target. However, its 3D structure is still unknown and this hampers the development of drug-design-based therapeutic strategies. Several algorithms are available that can be used to predict the structure of proteins, particularly with the recent appearance of artificial intelligence (AI)-driven pipelines. Here, we review how the structure of Tax is predicted by several algorithms using distinct modelling strategies. We discuss the consequences for the understanding of Tax structure/function relationship, and more generally for the use of structure models for modular and/or flexible proteins, which are frequent in retroviruses.
1. Introduction
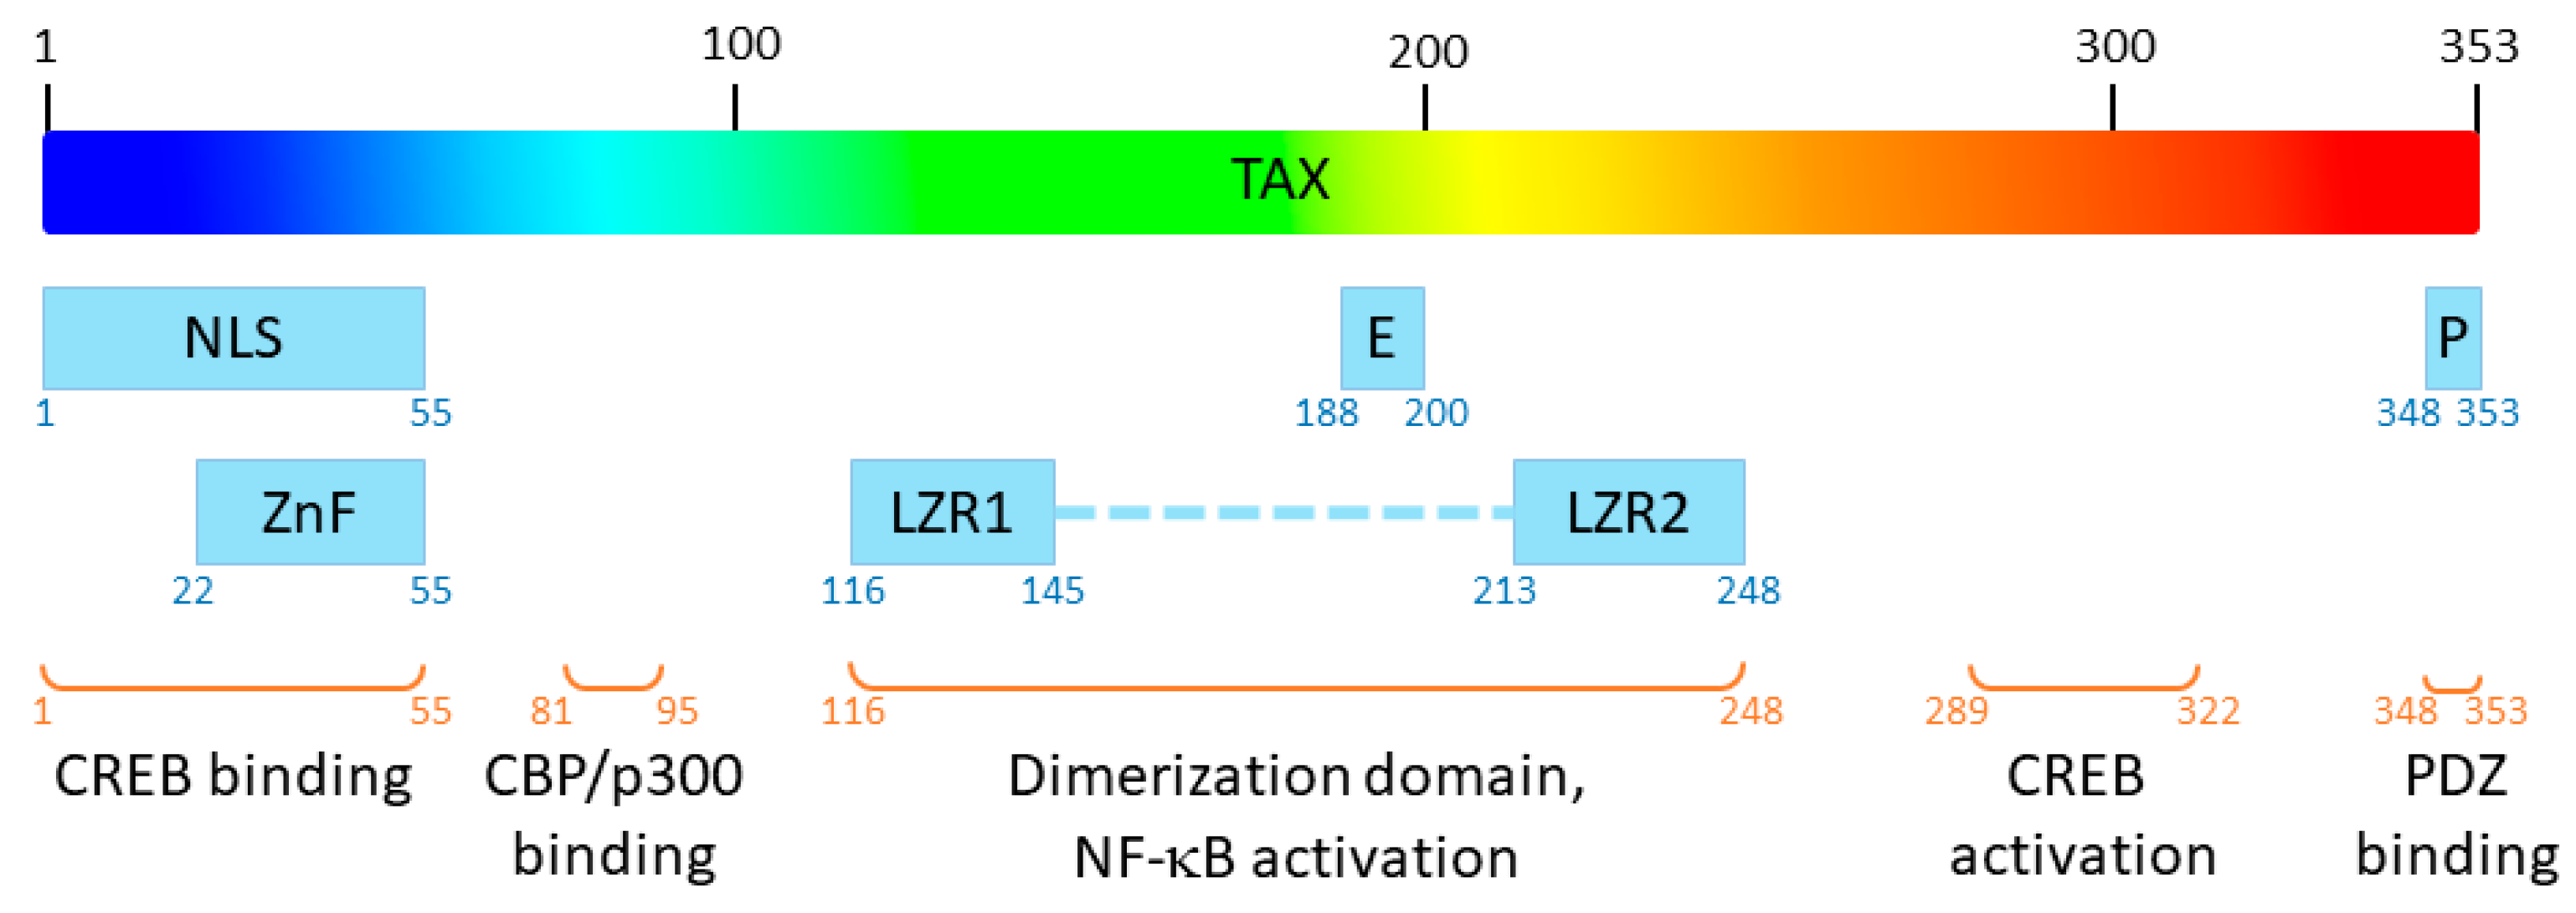
Human T-Leukemia virus type 1 (HTLV-1) was the first oncogenic retrovirus discovered in humans [1]. It is estimated that 5 to 10 million people are infected with HTLV worldwide, in areas of high endemicity [2]. HTLV is the etiological agent of adult T-cell leukaemia (ATL) and Tropical Spastic Paraparesis (TSP) which occur in 5 to 10% of infected people [2]. Interestingly, only HTLV type 1 virus (HTLV-1) but not its type 2 homolog (HTLV-2) induces ATL in humans [3]. Among HTLV-1 proteins, Tax plays a central role in viral replication and HTLV-1–related pathologies [4]. Tax is a 353-residue-long viral protein (~40 kDa), in which several functional domains have been described [5] (Figure 1) which confer numerous functions to the protein.
Indeed, this viral effector recruits cellular proteins such as RNA polymerase II, CREB transcription factor and p300/CBP coactivator on the viral promotor located in the 5′ LTR of the provirus to allow efficient transcription of the HTLV-1 genome [5,6]. In addition to its function as a viral transactivator, this pleiotropic oncoprotein is able to interact directly with a large panel of cellular proteins, from transcription factors [7,8] to proteins involved in cell signalling, cell cycle or apoptotic pathways [8,9] or mRNA quality control [10], thereby playing a central role in HTLV-1 oncogenesis [4,8,11]. In particular, the expression of Tax is necessary for the proliferation of primary T-cells in ATL patients [12]. Thus, Tax represents an interesting therapeutic target for treatment against ATL, and deciphering its 3D structure would be a significant breakthrough towards the development of anti-HTLV-1 drugs. Unfortunately, the experimental solving of the 3D structure of Tax remains elusive. To date, the only published structures concerning HTLV-1 Tax are that of short peptides in complex with HLA molecules [13,14,15,16,17,18,19,20,21,22,23] or structures of the last eight residues of the C-terminal extremity of Tax, forming a PDZ-binding motif, in complex with PDZ proteins [24,25,26,27].
In the absence of experimental data on the structure of a complete Tax protein, it is tempting to consider modelling this 3D structure de novo. Until recently, the algorithms for the prediction of protein 3D structures were based on homology modelling: schematically, the algorithm will compare the sequence of the protein of interest (query sequence) with sequences of proteins for which experimental structural data are available in protein structure databases, extract its predicted secondary structures, and compare with those of the sequences of proteins that were the closest homologues in the multiple sequence alignment. Then, based on these sequence/secondary structure alignments, it models the structure of the protein of interest using the 3D scaffold of the identified model(s) and a final energy minimization step. With the emergence of artificial intelligence (AI), new structure prediction pipelines have been described. Schematically, these algorithms are based on neural networks and deep learning that are aggregating the physical and geometric constraints that are present in stretches of sequences present in published protein structures as well as global constraints to generate 3D models. These recent algorithms appear to perform with high efficacy in the yearly critical assessment of protein structure prediction (CASP, https://predictioncenter.org, accessed on 3 February 2024).
In the view of these recent developments in structure prediction, we investigated whether the 3D structure of the HTLV-1 Tax protein could be accurately modelled. Thus, we performed the structure predictions of HTLV-1 Tax proteins using eight different homology or AI-driven predictors. We then observed and compared the obtained structures in order to get a better knowledge on Tax structure and its potential use for drug design strategies, but also on the potential limitations of structure prediction.
2. Predicting the Structure of HTLV-1 Tax
First of all, it is worth noticing that the confidence scores for the predictions are given by distinct indexes and calculation depending on the modelling algorithm. Therefore, for each prediction, we will calculate the confidence score of all the models using a single index for clarity, i.e., the composite QMEANDisCo score [28] available via the “Structure Assessment” tool (https://swissmodel.expasy.org/assess, accessed on 29 January 2024) of the Swiss-Model server [29]. A good quality prediction is expected to have a QMEANDisCo above 0.70.
2.1. Predictions Using Homology Modelling
We used three different servers providing structure homology modelling methods to predict the structure of Tax: Swiss-Model [29], Phyre2 [30], and I-Tasser [31,32,33].
Swiss-Model (https://swissmodel.expasy.org, accessed on 25 January 2024) predicts a β-stranded structure, which includes only 41 residues from the N-terminus of Tax (Figure 2A, residues 27–67). The predicted fragment is homologous to the nitrite reductase small subunit from Vibrio parahaemolyticus (PDB ID 3C0D [34]) and its confidence score QMEANDisCo is of 0.31 ± 0.12. Thus, this partial model appears poorly reliable.
Phyre2 (http://www.sbg.bio.ic.ac.uk/phyre2, accessed on 29 January 2024) predicts a structure of a 60 residue-long fragment (Figure 2B, residues 27 to 96), which encompasses the Swiss-Model structure and is homologous to the ferrodoxin component of a bacterial toluene-4-monooxygenase complex (PDB ID 1VM9 [35]). Notably, the β-strands predicted by Swiss-Model are also present and the extra modelled region contains one α-helix and two β-strands. However, the confidence score of this compact model is still low with a QMEANDisCo of 0.35 ± 0.11.
The Phyre2 server can also be used with an “intensive” option to force the modelling of the complete protein through a multiple template modelling (i.e., using several model structures based on local sequence homologies). By doing so, we obtained a model of the whole Tax protein (Figure 2C). The predicted region 27–96 is unchanged and the appended modelled parts are constructed from several other template proteins, such as a plant ferrodoxin reductase (PDB ID 1FND [36], Tax residues 207–250). The resulting predicted structure is modular with the N- and C-terminal domains separated by a flexible linker (Figure 2C) but the C-terminal part, which is not modelled with the default settings, appears to be loosely folded, with few secondary structure elements. The QMEANDisCo score of this model is lower (0.27 ± 0.05) than with the default settings. It is worth noting that this ”intensive” Phyre2 algorithm had been already used to model Tax in a publication from 2021 in which the authors reported that the model quality was also below the expected confidence scores, despite the fact that they had performed additional rounds of structure refinement [37].
Then, we moved to I-Tasser (https://zhanggroup.org/I-TASSER/, accessed on 26 January 2024) which is based on the assembly of PDB templates from local homology domains. The server was able to generate a structure prediction for the full protein (Figure 2D) and the first threading template was the human S-phase kinase-associated protein 2 (PDB ID 1FQV, chain A [38]). Because of this new template, the N-terminal domain of Tax is predicted to contain α-helices instead of the previous β-strands. The modelled central region (residues 100–200) and C-terminal extremity (residues 300–353) contains more secondary structure elements than the “Phyre2 intensive” model (Figure 2C,D) but the predicted tertiary structure is still loosely folded. The calculated QMEANDisCo score is also low with a value of 0.35 ± 0.05.
In summary, the predictions of Tax structure by homology modelling give bad to mediocre results: some models are only partial (Figure 2) and all of them have a low confidence score with QMEANDisCo between 0.27 and 0.35 (Table 1).
The variety of homology templates, together with the low confidence scores, explains the high divergence of the predicted structures, which was evident from the side-by-side comparison of the different models (Figure 2). Yet, three out of four algorithms predicted an N-terminal domain with a β-strand-rich region. This domain of Tax contains four cysteine and three histidine residues, potentially forming a zinc finger responsible for the interaction of this region with the viral DNA promoter [5]. However, none of the template proteins identified by the servers have been described to possess this motif, although they are metal-binding enzymes [34,35].
Altogether, these low confidence scores and the discrepancy between the templates identified by the modelling tools and what is known from Tax function confirms that, to date, no homologous structure of the Tax protein has been described. This is not completely surprising, as the sequence of Tax is the results of years of co-evolution of the virus with its host and has probably evolutionary diverged in a specific way. However, homology modelling remains an interesting approach when trying to predict the structure of a viral protein of interest, even when sequence similarity is low: there are examples of viral proteins displaying low sequence homologies (around 20%) but a similar fold because of conserved structure-function requirements (e.g., the Gag protein of lentiviruses [39]). Moreover, as the amount of protein structures available in structure databases is quickly increasing (https://www.rcsb.org/stats/growth/growth-released-structures, accessed on 2 February 2024), a HTLV-1 Tax homologue (e.g., a Tax-like protein from a distant oncoretrovirus) might sooner or later be published and therefore identified by these algorithms. Thus, it could be interesting to regularly renew these predictions as homology modelling of Tax can become conclusive.
Altogether, the use of homology modelling for Tax can only lead to the conclusion that this protein possesses a peculiar sequence for which no structural homologue could be identified to date, even for the zinc finger region.
2.2. Predictions Using AI-Based Pipeline
The difficulties in predicting the 3D structure of proteins that have no homologues in structure databases, as described above for Tax, is a problem which has been encountered for years. The recent appearance of AI-based algorithms, which all appeared to perform with high efficacy in international protein structure prediction competitions, has given new hopes for the deciphering ab initio of structure function relationships. Because they are based on different AI-driven processes, we have used four of them to predict the structure of Tax: AlphaFold 2 [40], RoseTTAFold [41], ESMFold [42] and D-I-Tasser [43] (Figure 3). AlphaFold 2 and ESMFold binaries were installed and run on an in-house server, while RoseTTAFold and D-I-Tasser were run through their primary webservice (https://robetta.bakerlab.org/submit.php accessed on 25 January 2024 and https://zhanggroup.org/D-I-TASSER/ accessed on 26 January 2024, respectively). The mean per-residue confidence metric called pLDDT, available in AlphaFold 2, is given for each AI-prediction when known, and the QMEANDisCo score is systematically calculated.
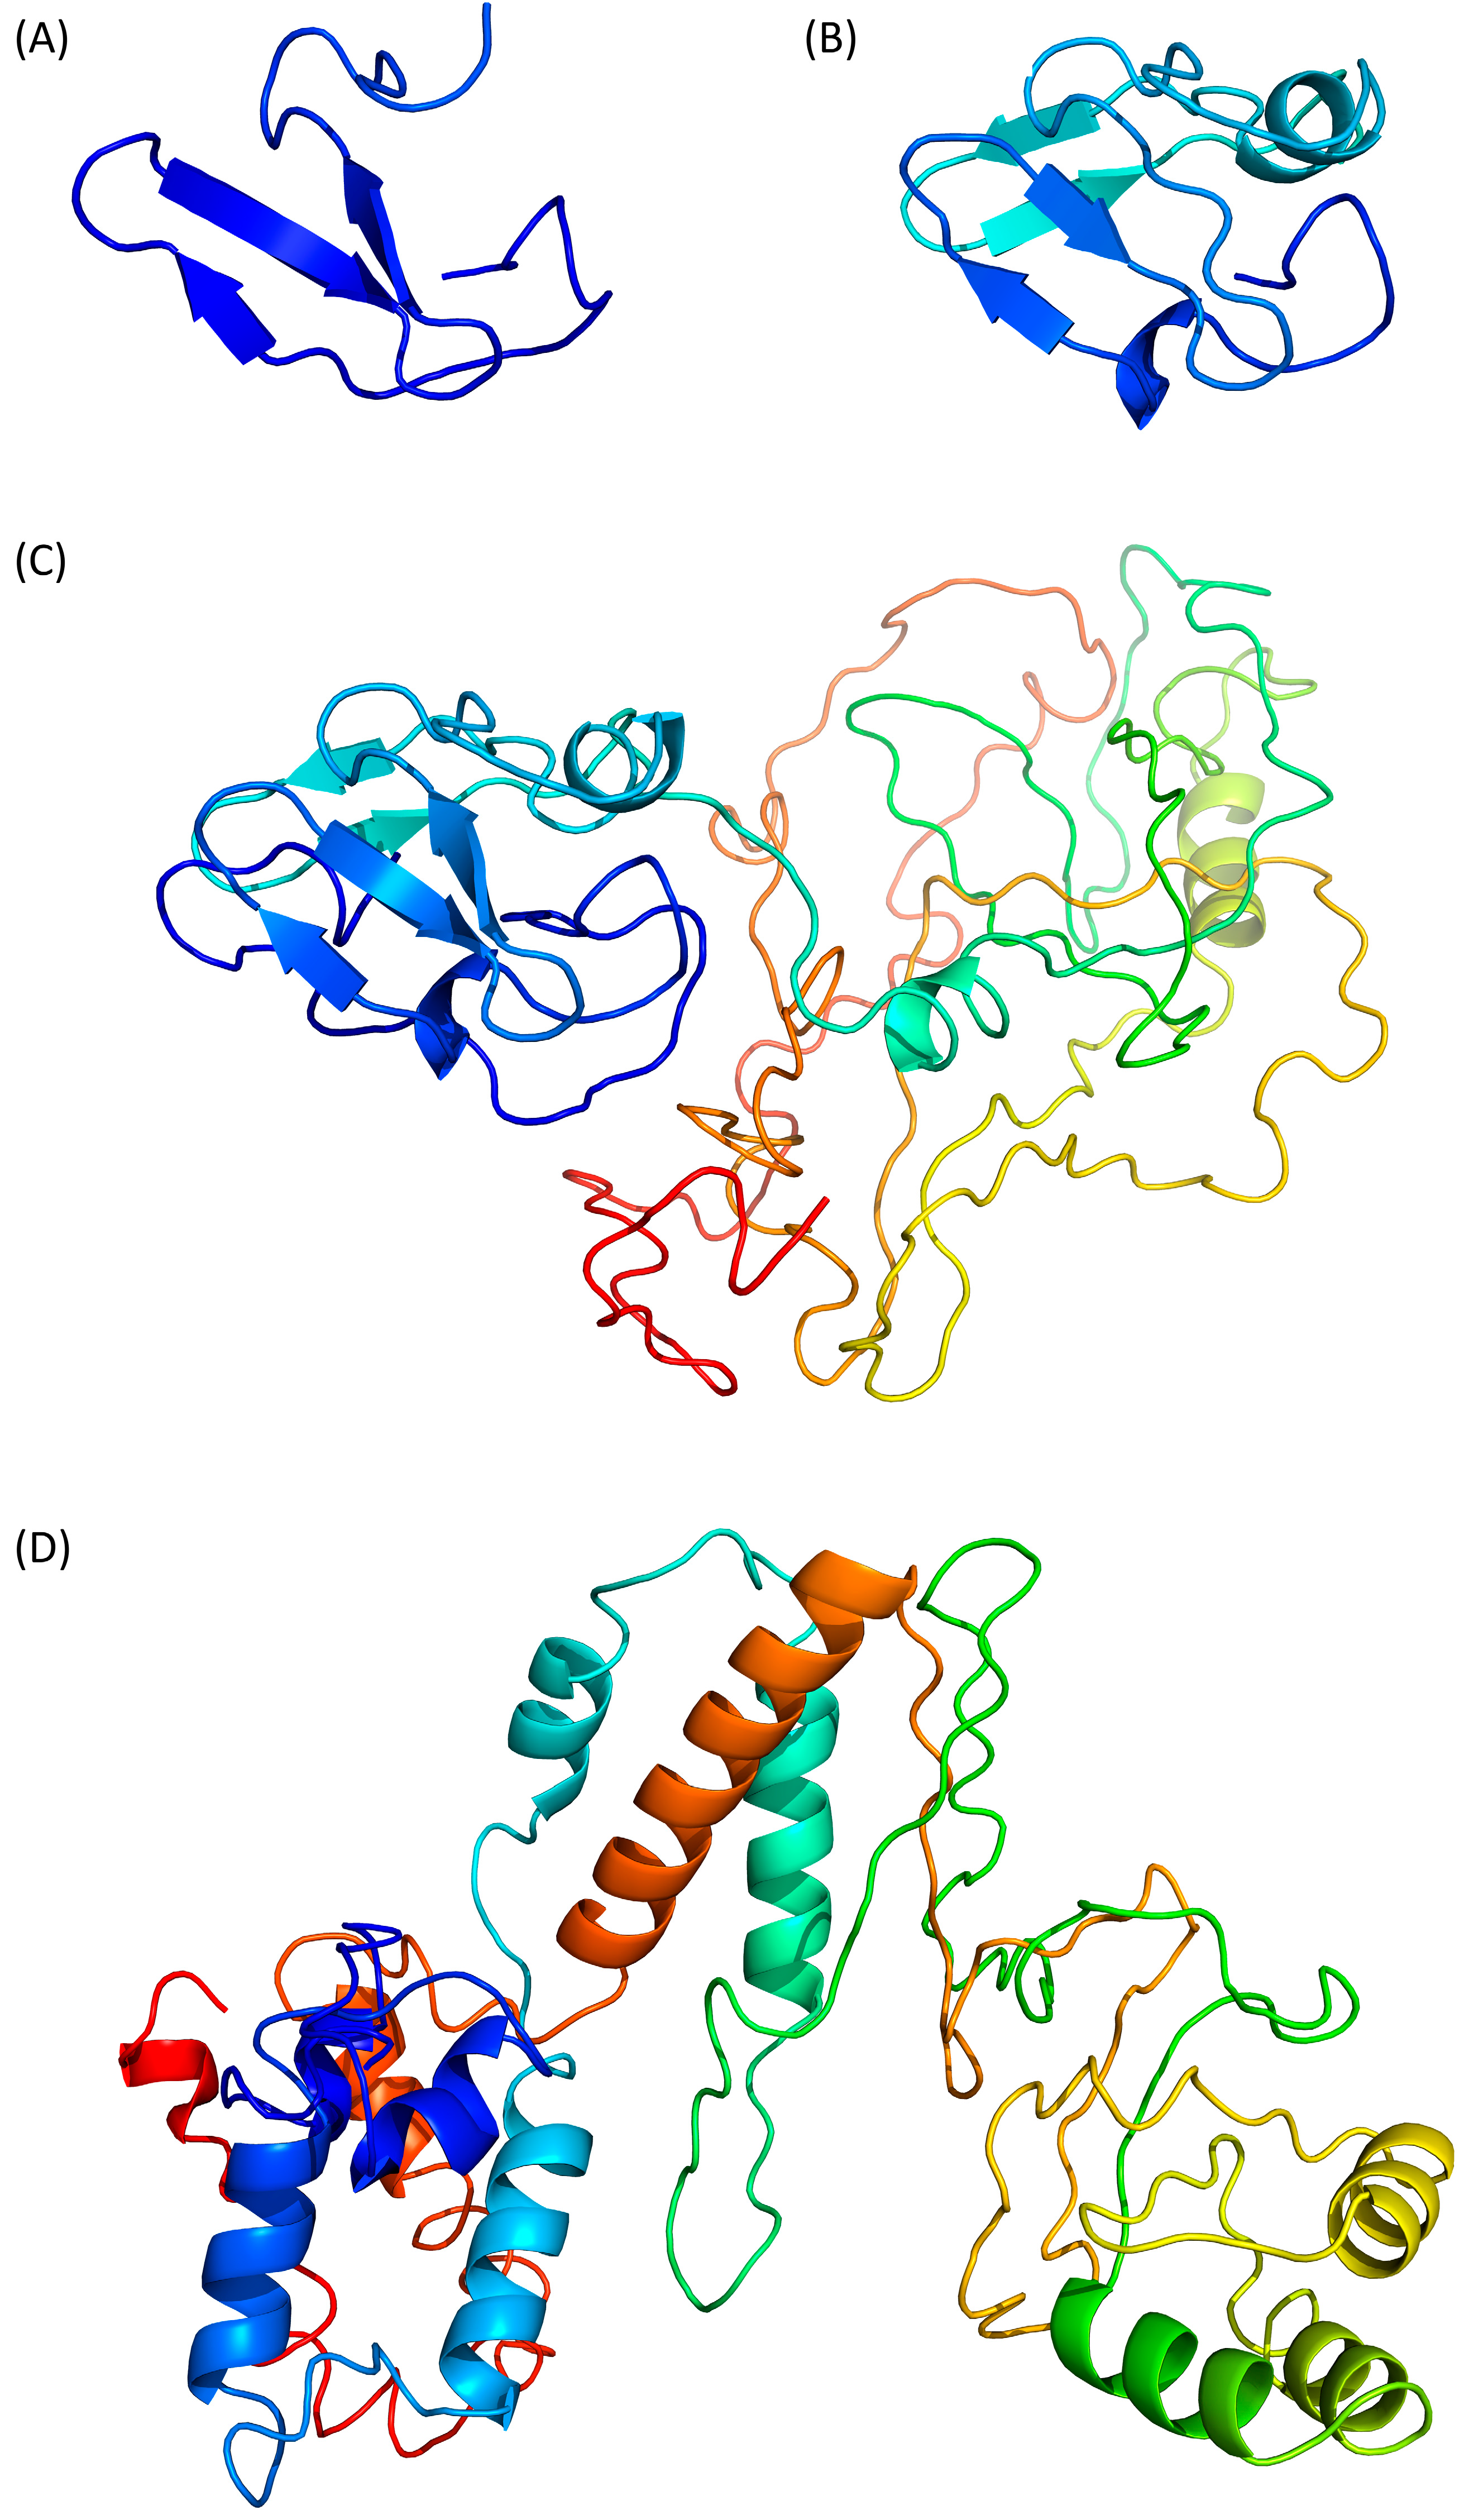
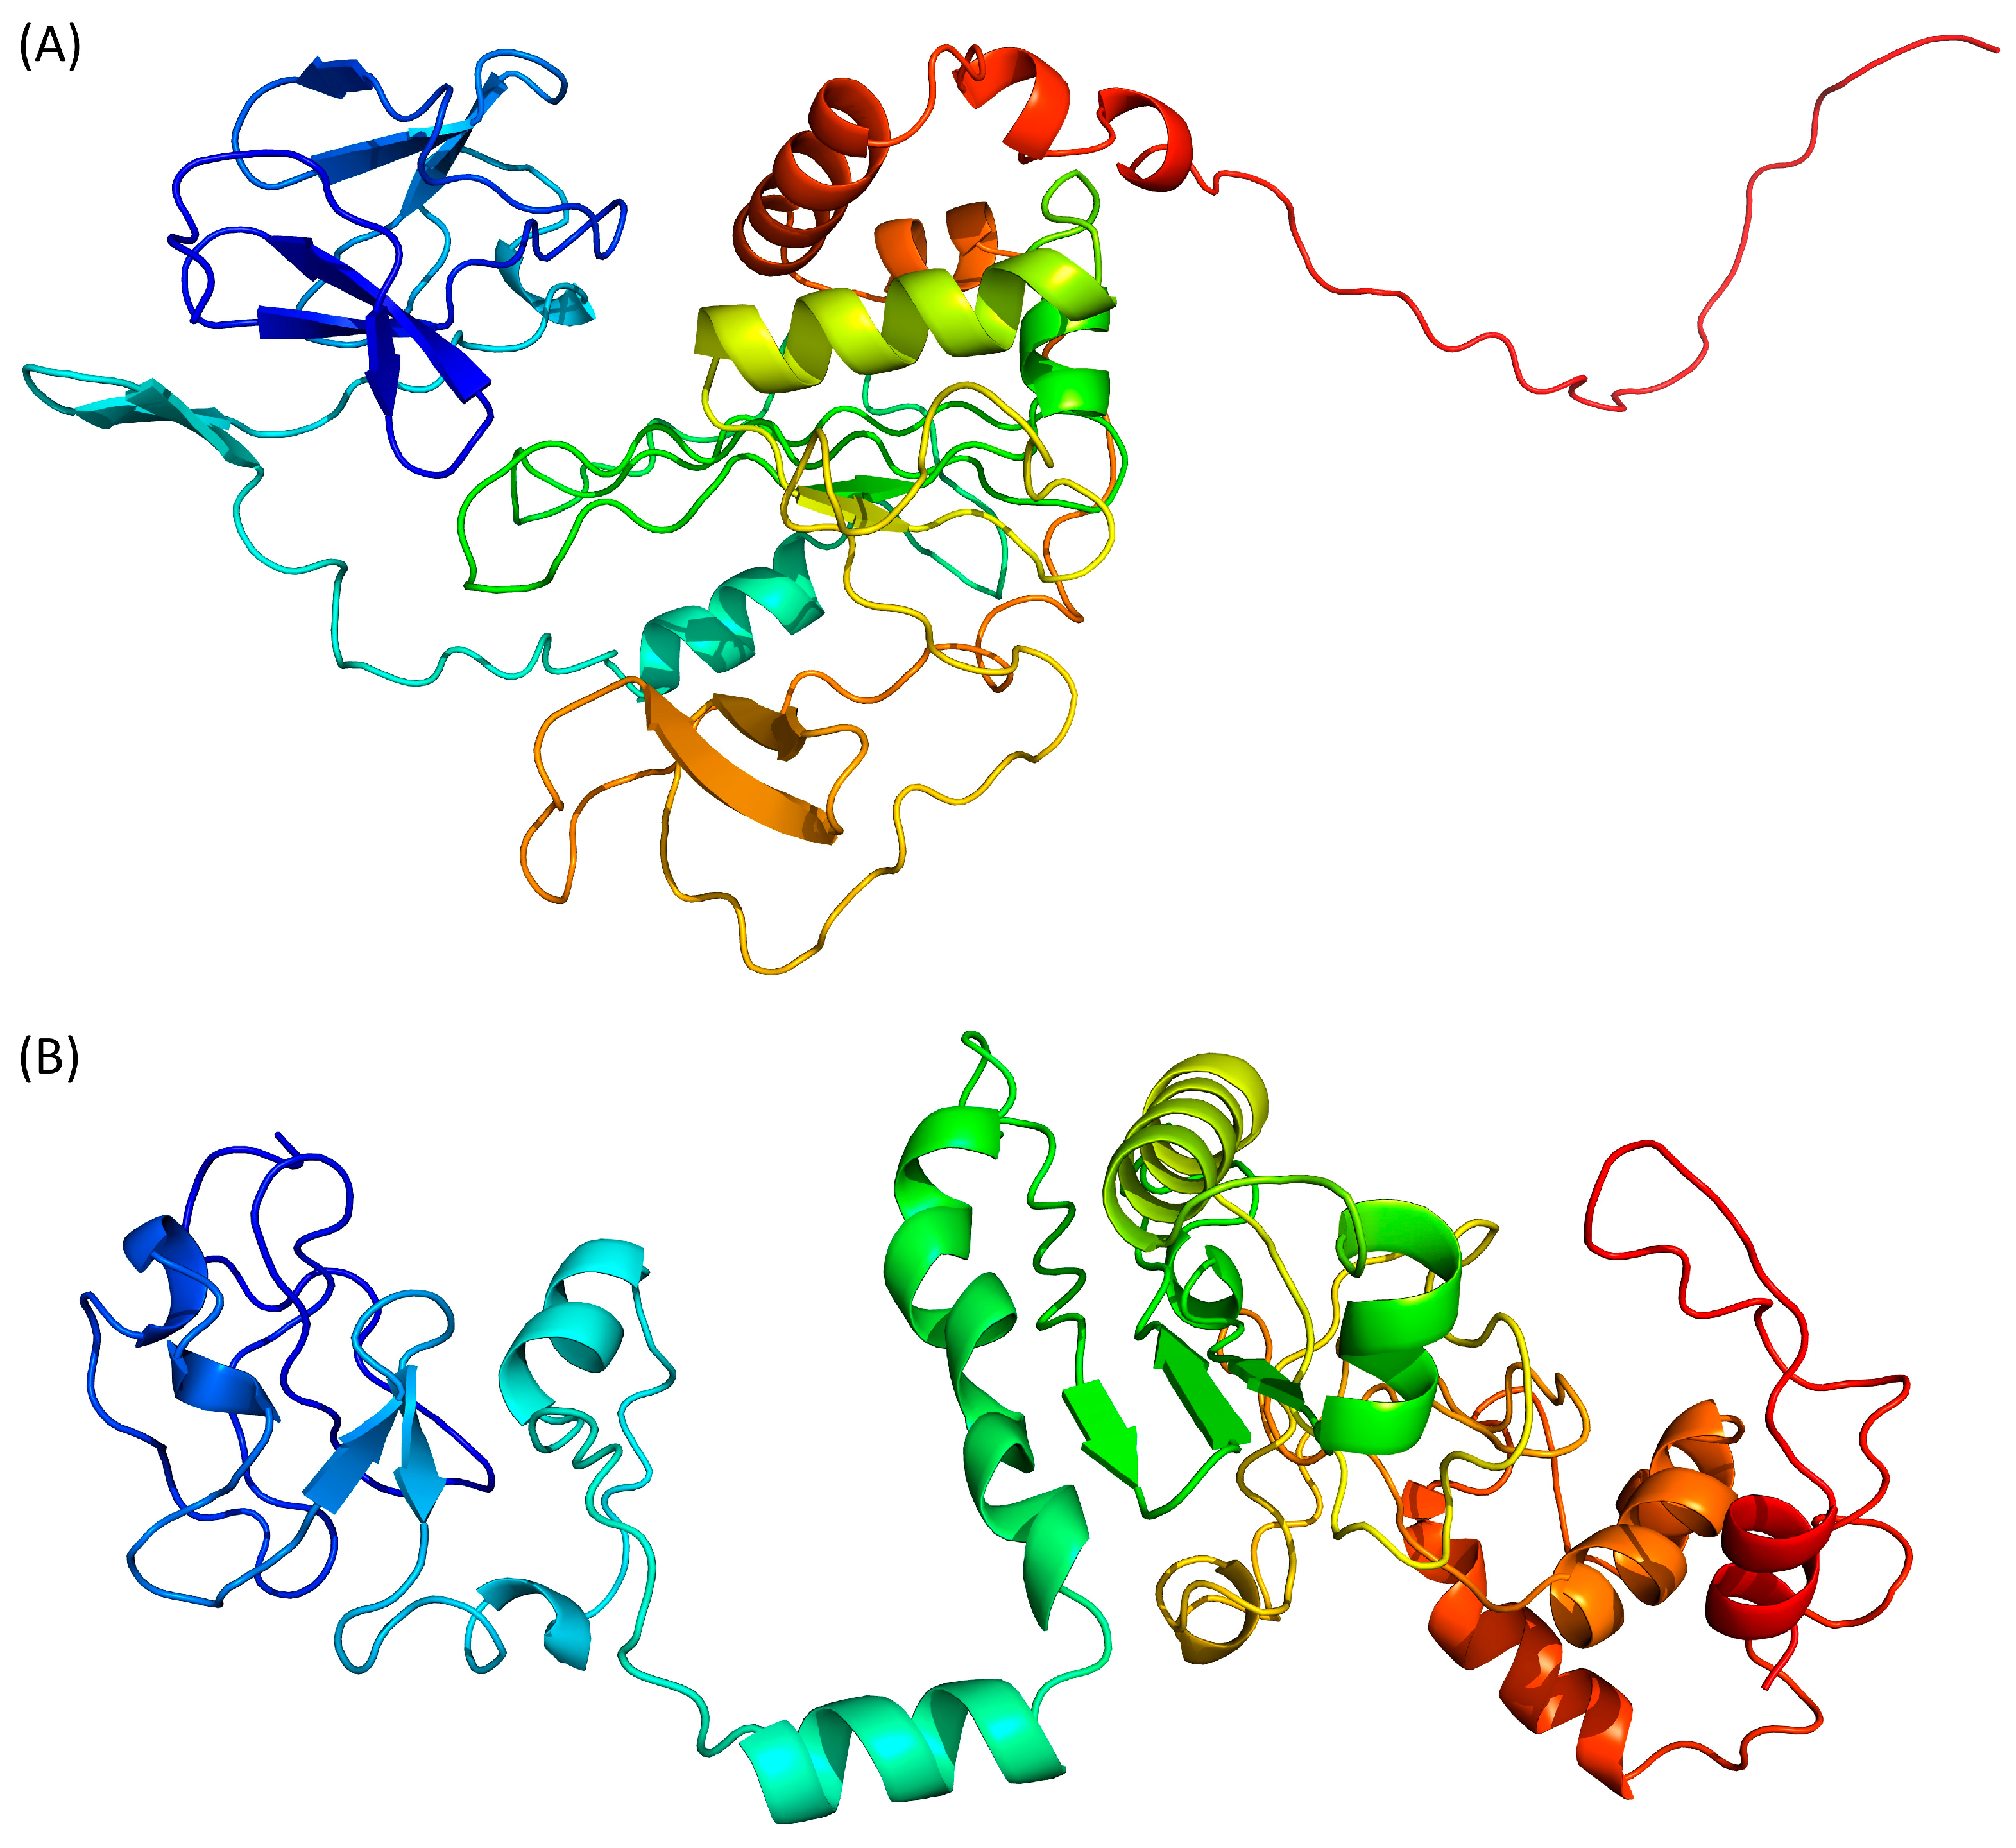
AlphaFold 2 is using neural networks based on evolutionary, physical and geometric constraints of protein structures [40]. The model generated by this algorithm (Figure 3A) shows a two-domains protein. The N-terminal domain is composed of β-strands while the central domain, which is rather compact, contains both β-strands and α-helices. No secondary structure elements are predicted in the C-terminal end. The confidence score pLDDT for the whole protein is 37.4, while the target values are >70 for a confident score and >90 for a very high confidence score. Even the pLDDT per residue never reaches a value above 70. This low-confidence score is confirmed by the QMEANDisCo of this model, which is 0.35 ± 0.05.
RoseTTAFold is using a “three-track network” in which information at the sequence, the secondary structure, and the 3D level are successively integrated [41]. Based on the Tax sequence, RoseTTAFold is also predicting a two-domain protein, separated by an isolated α-helix (Figure 3B). Both the N- and C-terminal domains are containing a mixture of β-strands and α-helices. However, by opposition to the AlphaFold 2 model, the C-terminal region of Tax is predicted here as containing two α-helices. The N-terminal region (residues 20–74) is predicted to contain helical motifs that are absent from the AlphaFold 2 model (Figure 3A). It is also the only region of the protein where the error estimates per residue of the model are below 6 Å. However, the overall confidence score of the RoseTTAFold model is 0.35 (target > 0.70), while a calculated QMEANDisCo of 0.39 ± 0.05. Thus, even with some locally favourable confidence scores for the N-terminal region, this model is not estimated as very reliable overall.
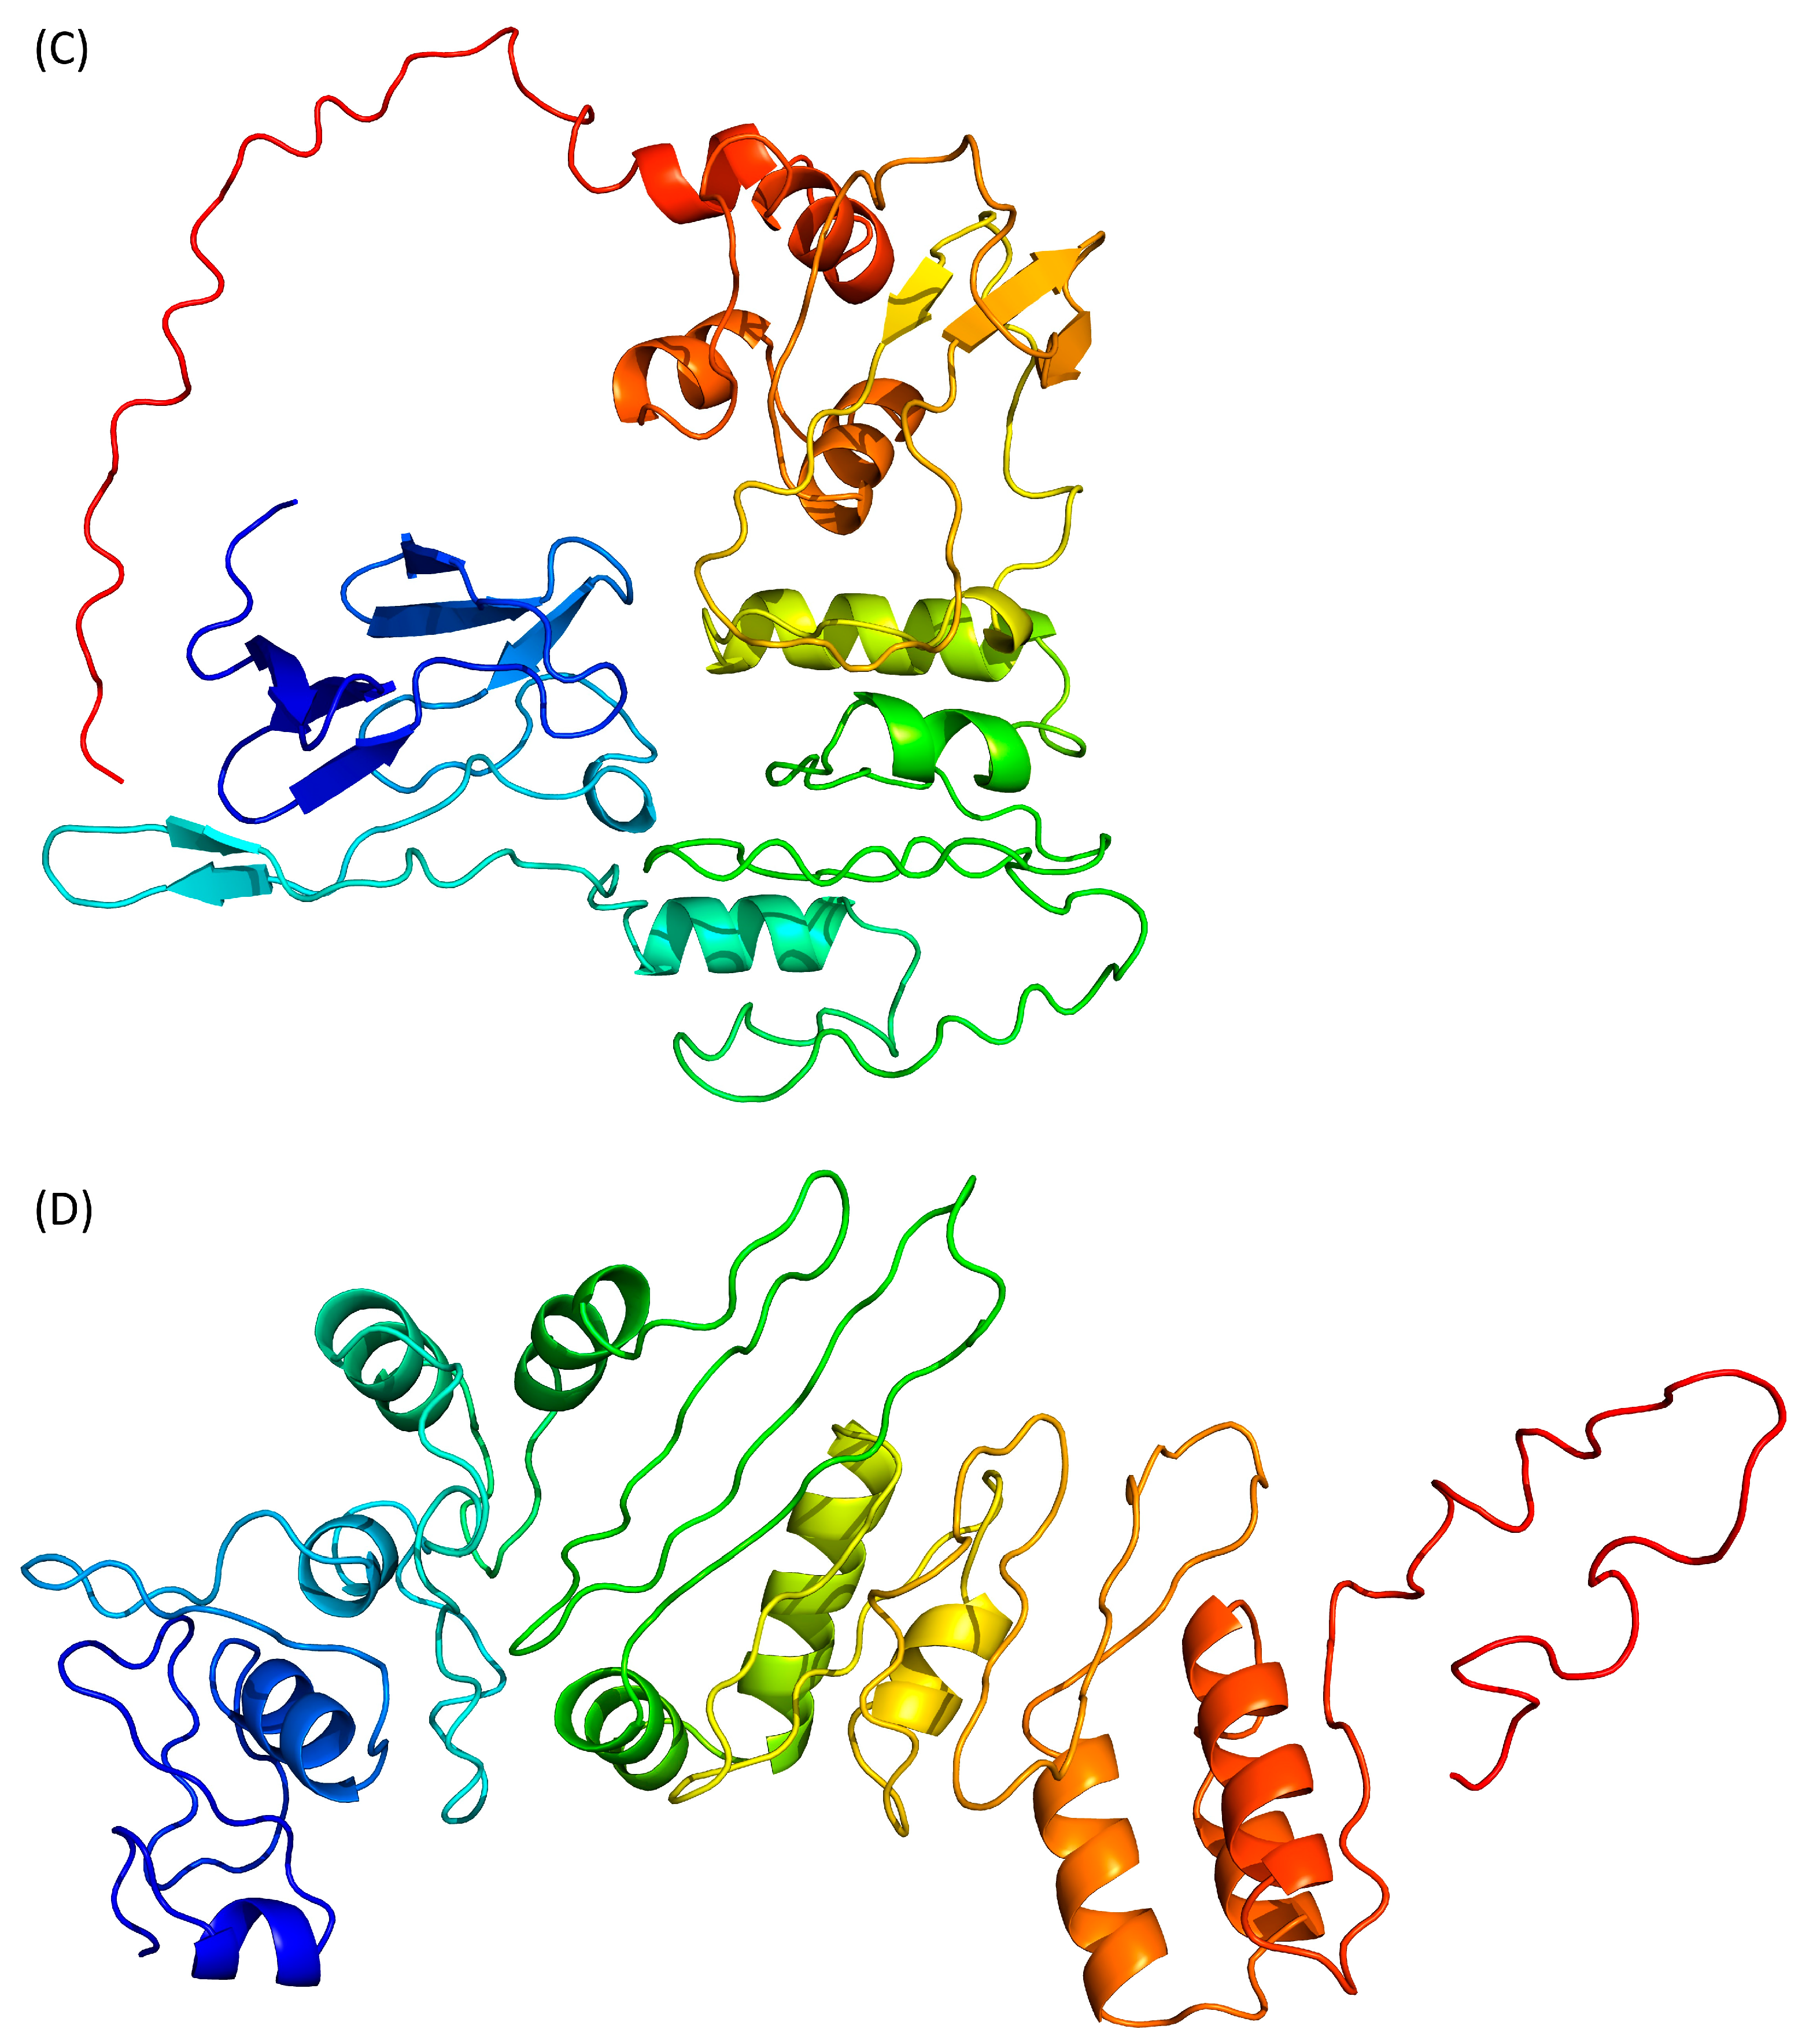
ESMFold adopts a different approach, as it uses language models trained on protein sequences and therefore does not depend on multiple sequence alignments [42]. ESMFold, like the other AI-based algorithms, predicts that the Tax protein is composed of two domains (Figure 3C). The N-terminal region is composed only of β-strands, while the central domain contains both β-strands and α-helices, and the C-terminal extremity is predicted as disordered. The mean pLDDT is 47.6 (target > 70) and the calculated QMEANDisCo value is 0.43 ± 0.05 (target > 0.70). Of interest, pLDDT scores per residue are between 70 and 80 (i.e., scoring as “confident”) for the residues at the N-terminus (residues 15–75).
Finally, we used D-I-Tasser which is an evolution of I-Tasser (see above) that includes a deep neural-network predictors analysis coupled to the I-Tasser force fields (Figure 3D). D-I-Tasser predicted a model for the whole protein and the first threading template is, this time, a protein from the drosophila apoptosome (PDB ID 1VT4 [44]). As a consequence, the predicted topology is different from the I-Tasser one and the D-I-Tasser model has more α-helices (Figure 2D and Figure 3D). The confidence score of the D-I-Tasser model is better than the one of I-Tasser with a QMEANDisCo of 0.44 ± 0.05, which is within the range of the other AI-programs. Yet, it remains well below the confidence threshold of 0.70.
In summary, the predictions of the structure of the whole Tax protein by AI-based modelling algorithms gave low confidence scores (QMEANDisCo between 0.35 and 0.44, Table 2), with D-I-Tasser having the best score.
When comparing QMEANDisCo values for all the generated model (Table 1 and Table 2), it is noticeable that no algorithm performed significantly better than the others, and that both homology and AI-based algorithms reach similar low QMEANDisCo confidence scores. This means that the sequence of the Tax protein seems resistant to modelling, whether by homology or ab initio.
3. Comparison of HTLV-1 Tax Structure Models
Two of the four AI-generated models (RoseTTAFold and ESMFold) exhibited the best local confidence scores for the N-terminal domain of Tax, which is the zinc finger domain which was also modelled by Swiss-Model and Phyre2. Therefore, we wondered if there could be some conserved local folding which would be identifiable although the confidence scores of the whole models were not good. Thus, we compared the secondary structures elements of all these models with respect to Tax functional regions (Figure 4).
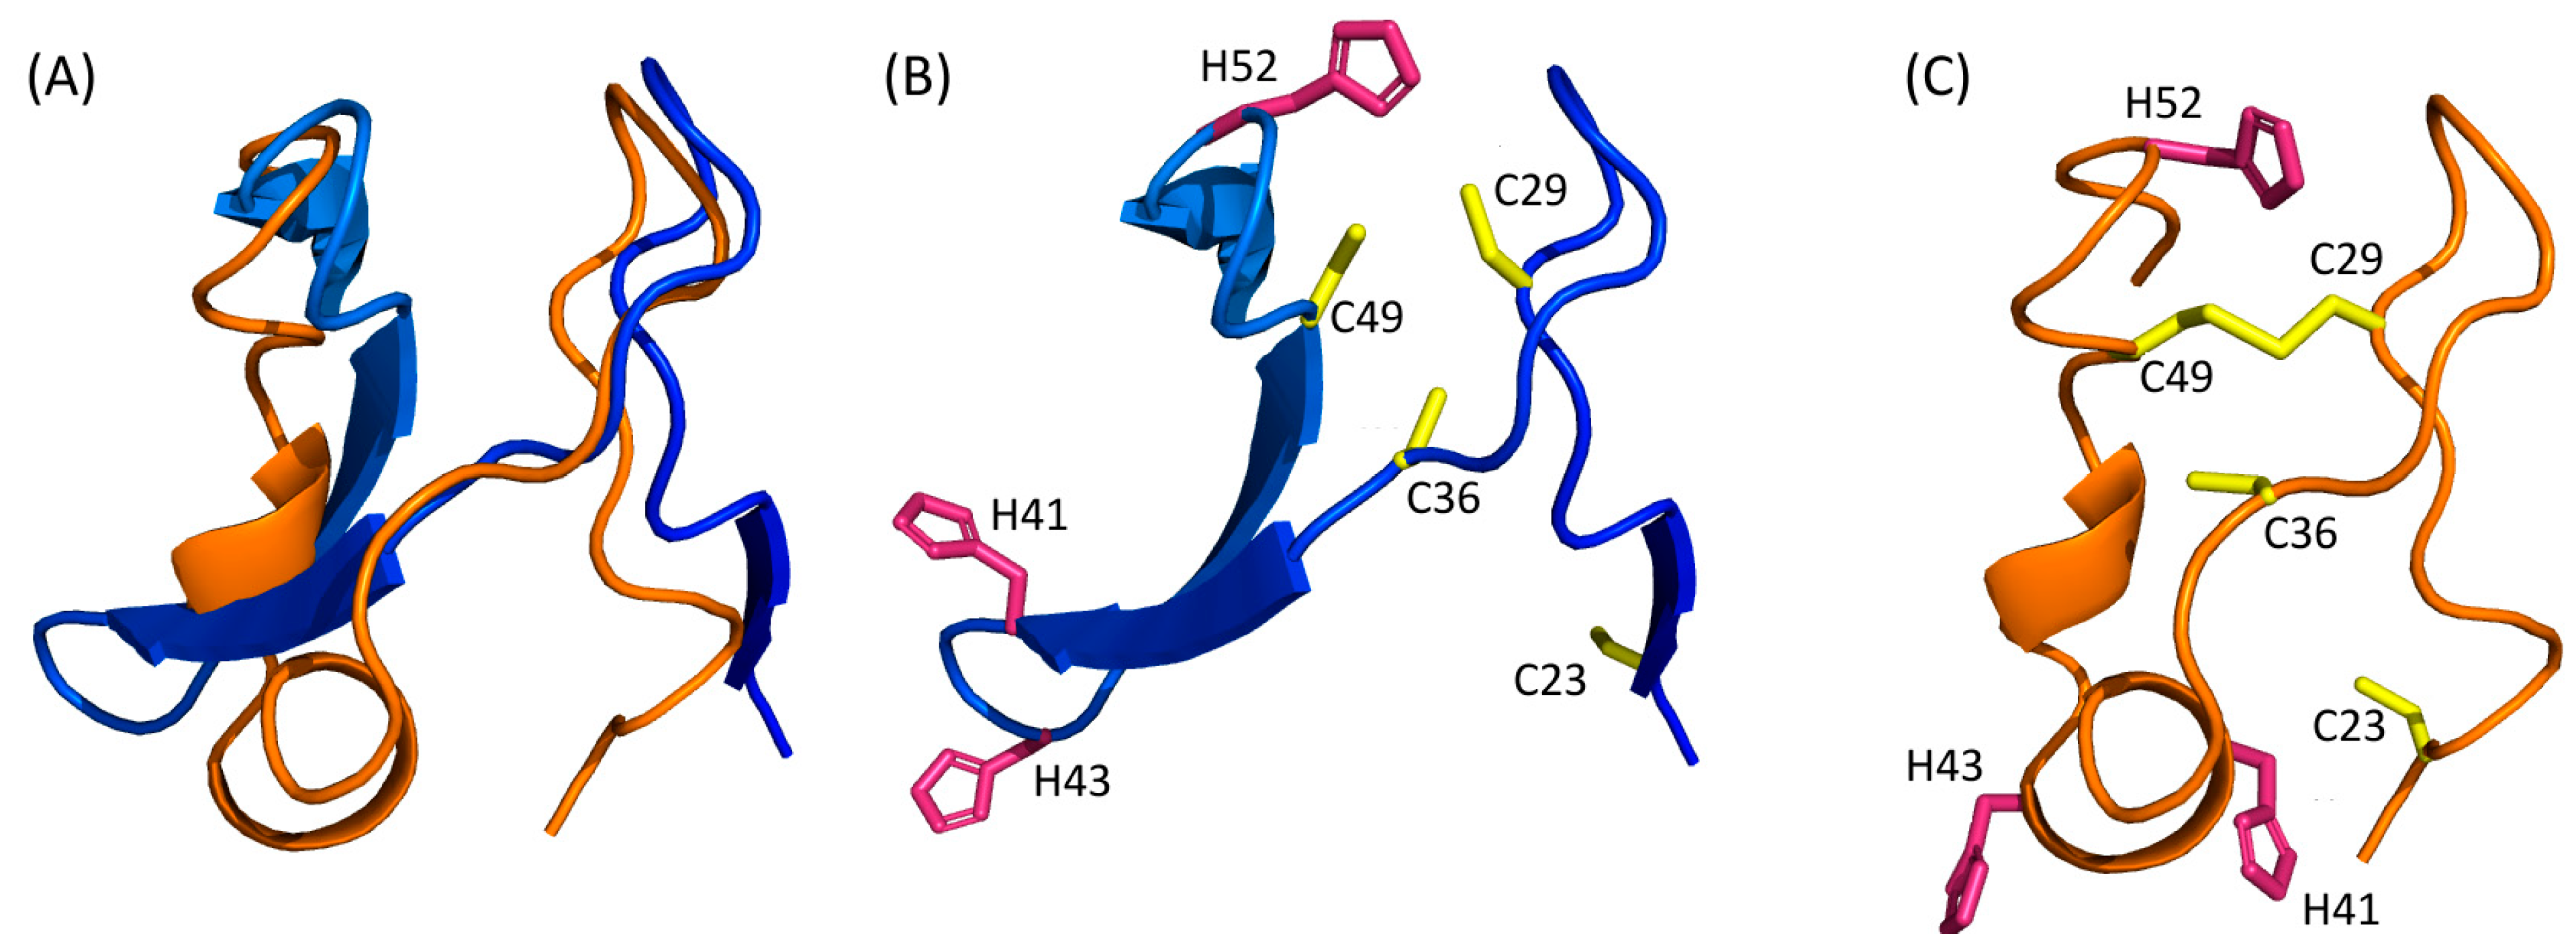
It appears that the Nuclear Export Signal and the centre of the dimerization domain are predicted as being in an α-helical region by all predictors that modelled this region (residues 175–205). Notably, it is the region which had the best local confidence score in the D-I-Tasser model. For the rest of the protein, none of the models are convergent (Figure 4). For example, if we consider the zinc finger domain of Tax, we can observe that five models are predicted to have a β-stranded fold (AlphaFold 2, ESMFold, Swiss-Model and both Phyre2 models), while the other three (RoseTTAFold, I-Tasser and D-I-Tasser) predicted the presence of helical elements and turns, together with β-strands or replacing them. Furthermore, despite having good local confidence scores for this domain, the Cα trace of the ESMFold and RoseTTAFold models do not superpose (Figure 5A).
As there are a lot of different topologies for zinc fingers that have already been described in the literature [45], this observation could suggest that the Tax protein harbours another, yet undescribed, zinc finger topology that the algorithms do not identify, especially as they do not support the prediction of metal coordination. Indeed, although not superposing, both ESMFold and RoseTTAFold predicted three cysteines (C29, C36 and C49) and one histidine (H52) in close vicinity, which could coordinate a zinc ion (Figure 5B,C). Such zinc fingers with three cysteines and one histidine (CCCH) have been described and are involved in RNA metabolism [46]. Their consensus sequence is C-(X4–15)-C-(X4–6)-C-(X3–4)-H (with X for any amino-acid) [47]. Thus, this putative CCCH zinc finger in Tax, with the sequence C-X6-C-X12-C-X2-H, would be non-canonical and marked by a particularly longer distance between the second and third cysteines (12 instead of 4 to 6). Of note, this zinc finger is also predicted by AlphaFold 2 but not by D-I-Tasser, nor by any other homology modelling method.
Another possibility is that this region of Tax is intrinsically disordered and that the zinc finger is only forming through induced folding when Tax interacts with a biological partner. The formation of the zinc finger of Tax could also require trans-complementation with domains or residues of the interacting partner, as it contains only seven cysteines or histidine residues while eight are needed to complete two zinc fingers. Such an induced folding and trans-complementation for the formation of the zinc finger have been described for the HIV-1 Tat protein: this regulatory protein, which is intrinsically disordered [48,49], contains seven cysteine residues and uses a residue from its interacting partner, Cyclin T1, to complete its two zinc fingers that are then folded as α-helices [50].
The experimental elucidation of the 3D structure of this region of Tax, alone or in complex with one of its biological partners, will be necessary to conclude on this matter.
4. Conclusions and Perspectives
In conclusion, the only convergent result that can be obtained from the comparisons of all these models is that the Tax protein seems to be a modular protein, containing two more or less compact domains separated by a flexible linker, with a nuclear export domain probably α-helical, and with a C-terminal end which is loosely structured and/or can adopt different folding. As soon as we try to go deeper in the details, the different models that we have obtained are divergent. This could be expected by the fact that none of the models had good confidence scores, suggesting that they are all (at least partially) wrong.
When we focus on specific functional domains such as the zinc finger, some models seemed to converge, but there are still some discrepancies, even between models that predicted this region with good confidence scores. Thus, to date, it appears that it is not possible to model the structure of the Tax protein with a sufficient accuracy to use any of these predictions to understand structure-function relationships of Tax and even less to guide a structure-based drug design.
Notably, Tax can undergo several post-translational modifications, such as phosphorylation [51], acetylation [52], SUMOylation and/or poly-ubiquitination [53] which are important for its function [8] and may influence its conformation, as described for other proteins [54,55,56]. However, there is no algorithm to date which includes this parameter during protein structure prediction.
This work on the Tax protein has three consequences for the understanding of Tax structure, but also beyond the HTLV-1 field for the use of structure models of modular proteins.
First, it underlies that, although the confidence scores must be the first criterion to consider, a good confidence score, even at a local scale, is not enough to discern “good” from “bad” models, as exemplified by the comparison of the N-terminal regions that showed good local confidence scores with RoseTTAFold and ESMFold (Figure 5). Therefore, even for models which are predicted with pLDDT confidence scores around 70–80%, it should be recommended to use two or three distinct structure prediction algorithms to check if there is some convergence or not.
Second, one should keep in mind that it may difficult to predict the structure of some proteins because of their intrinsic complexity. This is particularly true for retroviral proteins such as Tax of HTLV-1. Indeed, the genome of retroviruses is about 10kb in size, but must still sustain a complete viral replication cycle. This means that retroviral proteins have often several functions (and it is the case of Tax), which force them to adopt different conformations to adapt to different needs of the virus. As a consequence, retroviral proteins tend to be modular proteins with flexible regions, that are undergoing conformational changes with reorganization of the respective orientations of some domains/subdomains [57,58]. Some of them can even be mostly intrinsically disordered and/or undergo induced folding, i.e., appearance of secondary/tertiary structure elements only in certain conditions [48,59]. Predicting such a fluctuating landscape, even at a local scale, could be unreachable for 3D modelling algorithms. This has been demonstrated for AlphaFold 2 [60,61], but it is probably a problem for all structure modelling strategies.
This leads to the third consequence of this work: algorithms predicting the structure of proteins must still be fed by experimental structural data, in order to increase their panel of possible conformations and thereby their accuracy. The case studied here clearly shows that whatever programs are used, even the most recent and innovative ones based on AI, they all find themselves faced with a “gray zone”, which does not allow them to deliver reliable predictions. It is when the structure of Tax will be experimentally solved that we will understand which model, if any, was the closest to reality and where it was wrong. It will also help identify which domains of Tax had specific, unpredictable structures. These unique features would be the best targets for the development of anti HTLV-drugs.
Author Contributions
Conceptualization: C.G.; 3D structure modelling: X.R. and C.G.; secondary structure alignments: X.R. and P.G.; project administration and funding acquisition: P.G. and C.G. Writing, review and editing: all authors. All authors have read and agreed to the published version of the manuscript.
Funding
This research was funded by “la Ligue contre le Cancer Auvergne-Rhône-Alpes” (Grant R23GOUET).
Institutional Review Board Statement
Not applicable.
Informed Consent Statement
Not applicable.
Data Availability Statement
The raw data supporting the conclusions of this article will be made available by the authors on request.
Acknowledgments
The authors want to thank E. Bettler (PRABI, UMR5305, Lyon) for the access to the AlphaFold 2 and ESMFold programs and helpful discussions.
Conflicts of Interest
The authors declare no conflicts of interest.
References
- Poiesz, B.J.; Ruscetti, F.W.; Gazdar, A.F.; Bunn, P.A.; Minna, J.D.; Gallo, R.C. Detection and isolation of type C retrovirus particles from fresh and cultured lymphocytes of a patient with cutaneous T-cell lymphoma. Proc. Natl. Acad. Sci. USA 1980, 77, 7415–7419. [Google Scholar] [CrossRef] [PubMed]
- Gessain, A.; Cassar, O. Epidemiological aspects and world distribution of HTLV-1 infection. Front. Microbiol. 2012, 3, 388. [Google Scholar] [CrossRef] [PubMed]
- Martinez, M.P.; Al-Saleem, J.; Green, P.L. Comparative virology of HTLV-1 and HTLV-2. Retrovirology 2019, 16, 21. [Google Scholar] [CrossRef] [PubMed]
- Currer, R.; van Duyne, R.; Jaworski, E.; Guendel, I.; Sampey, G.; Das, R.; Narayanan, A.; Kashanchi, F. HTLV tax: A fascinating multifunctional co-regulator of viral and cellular pathways. Front. Microbiol. 2012, 3, 406. [Google Scholar] [CrossRef] [PubMed]
- Boxus, M.; Twizere, J.-C.; Legros, S.; Dewulf, J.-F.; Kettmann, R.; Willems, L. The HTLV-1 Tax interactome. Retrovirology 2008, 5, 76. [Google Scholar] [CrossRef] [PubMed]
- Martella, C.; Waast, L.; Pique, C. Tax, marionnettiste de la transcription du HTLV-1. Med. Sci. 2022, 38, 359–365. [Google Scholar] [CrossRef]
- Fochi, S.; Mutascio, S.; Bertazzoni, U.; Zipeto, D.; Romanelli, M.G. HTLV deregulation of the NF-kappaB pathway: An update on Tax and antisense proteins role. Front. Microbiol. 2018, 9, 285. [Google Scholar] [CrossRef]
- Mohanty, S.; Harhaj, E.W. Mechanisms of Oncogenesis by HTLV-1 Tax. Pathogens 2020, 9, 543. [Google Scholar] [CrossRef]
- Simonis, N.; Rual, J.-F.; Lemmens, I.; Boxus, M.; Hirozane-Kihijawa, T.; Gatot, J.-S.; Dricot, A.; Hao, T.; Vertommen, D.; Legros, S.; et al. Host-pathogen interactome mapping for HTLV-1 and HTLV-2. Retrovirology 2012, 9, 26. [Google Scholar] [CrossRef]
- Fiorini, F.; Robin, J.P.; Kanaan, J.; Borowiak, M.; Croquette, V.; Le Hir, H.; Jalinot, P.; Mocquet, V. HTLV-1 Tax plugs and freezes UPF1 helicase leading to nonsense-mediated mRNA decay inhibition. Nat. Commun. 2018, 9, 431. [Google Scholar] [CrossRef]
- Higuchi, M.; Fujii, M. Distinct functions of HTLV-1 Tax1 from HTLV-2 Tax2 contribute key roles to viral pathogenesis. Retrovirology 2009, 6, 117. [Google Scholar] [CrossRef] [PubMed]
- Hleihel, R.; Skayneh, H.; de The, H.; Hermine, O.; Bazarbachi, A. Primary cells from patients with adult T cell leukemia/lymphoma depend on HTLV-1 Tax expression for NF-kappaB activation and survival. Blood Cancer J. 2023, 13, 67. [Google Scholar] [CrossRef]
- Garboczi, D.N.; Ghosh, P.; Utz, U.; Fan, Q.R.; Biddison, W.E.; Wiley, D.C. Structure of the complex between human T-cell receptor, viral peptide and HLA-A2. Nature 1996, 384, 134–141. [Google Scholar] [CrossRef]
- Gagnon, S.J.; Borbulevych, O.Y.; Davis-Harrison, R.L.; Baxter, T.K.; Clemens, J.R.; Armstrong, K.M.; Turner, R.V.; Damirjian, M.; Biddison, W.E.; Baker, B.M. Unraveling a hotspot for TCR recognition on HLA-A2: Evidence against the existence of peptide-independent TCR binding determinants. J. Mol. Biol. 2005, 353, 556–573. [Google Scholar] [CrossRef]
- Ding, Y.H.; Smith, K.J.; Garboczi, D.N.; Utz, U.; Biddison, W.E.; Wiley, D.C. Two human T cell receptors bind in a similar diagonal mode to the HLA-A2/Tax peptide complex using different TCR amino acids. Immunity 1998, 8, 403–411. [Google Scholar] [CrossRef] [PubMed]
- Ding, Y.H.; Baker, B.M.; Garboczi, D.N.; Biddison, W.E.; Wiley, D.C. Four A6-TCR/peptide/HLA-A2 structures that generate very different T cell signals are nearly identical. Immunity 1999, 11, 45–56. [Google Scholar] [CrossRef]
- Gagnon, S.J.; Borbulevych, O.Y.; Davis-Harrison, R.L.; Turner, R.V.; Damirjian, M.; Wojnarowicz, A.; Biddison, W.E.; Baker, B.M. T cell receptor recognition via cooperative conformational plasticity. J. Mol. Biol. 2006, 363, 228–243. [Google Scholar] [CrossRef]
- Piepenbrink, K.H.; Borbulevych, O.Y.; Sommese, R.F.; Clemens, J.; Armstrong, K.M.; Desmond, C.; Do, P.; Baker, B.M. Fluorine substitutions in an antigenic peptide selectively modulate T-cell receptor binding in a minimally perturbing manner. Biochem. J. 2009, 423, 353–361. [Google Scholar] [CrossRef]
- Khan, A.R.; Baker, B.M.; Ghosh, P.; Biddison, W.E.; Wiley, D.C. The structure and stability of an HLA-A*0201/octameric tax peptide complex with an empty conserved peptide-N-terminal binding site. J. Immunol. 2000, 164, 6398–6405. [Google Scholar] [CrossRef]
- Singh, N.K.; Alonso, J.A.; Harris, D.T.; Anderson, S.D.; Ma, J.; Hellman, L.M.; Rosenberg, A.M.; Kolawole, E.M.; Evavold, B.D.; Kranz, D.M.; et al. An Engineered T Cell Receptor Variant Realizes the Limits of Functional Binding Modes. Biochemistry 2020, 59, 4163–4175. [Google Scholar] [CrossRef] [PubMed]
- Borbulevych, O.Y.; Piepenbrink, K.H.; Gloor, B.E.; Scott, D.R.; Sommese, R.F.; Cole, D.K.; Sewell, A.K.; Baker, B.M. T cell receptor cross-reactivity directed by antigen-dependent tuning of peptide-MHC molecular flexibility. Immunity 2009, 31, 885–896. [Google Scholar] [CrossRef] [PubMed]
- Li, L.; Muzahim, Y.; Bouvier, M. Crystal structure of adenovirus E3-19K bound to HLA-A2 reveals mechanism for immunomodulation. Nat. Struct. Mol. Biol. 2012, 19, 1176–1181. [Google Scholar] [CrossRef]
- Madden, D.R.; Garboczi, D.N.; Wiley, D.C. The antigenic identity of peptide-MHC complexes: A comparison of the conformations of five viral peptides presented by HLA-A2. Cell 1993, 75, 693–708. [Google Scholar] [CrossRef]
- Gogl, G.; Zambo, B.; Kostmann, C.; Cousido-Siah, A.; Morlet, B.; Durbesson, F.; Negroni, L.; Eberling, P.; Jane, P.; Nomine, Y.; et al. Quantitative fragmentomics allow affinity mapping of interactomes. Nat. Commun. 2022, 13, 5472. [Google Scholar] [CrossRef]
- Maseko, S.B.; Brammerloo, Y.; van Molle, I.; Sogues, A.; Martin, C.; Gorgulla, C.; Plant, E.; Olivet, J.; Blavier, J.; Ntombela, T.; et al. Identification of small molecule antivirals against HTLV-1 by targeting the hDLG1-Tax-1 protein-protein interaction. Antiviral Res. 2023, 217, 105675. [Google Scholar] [CrossRef]
- Cousido-Siah, A.; Carneiro, L.; Kostmann, C.; Ecsedi, P.; Nyitray, L.; Trave, G.; Gogl, G. A scalable strategy to solve structures of PDZ domains and their complexes. Acta Crystallogr. D Struct. Biol. 2022, 78, 509–516. [Google Scholar] [CrossRef] [PubMed]
- Javorsky, A.; Maddumage, J.C.; Mackie, E.R.R.; Soares da Costa, T.P.; Humbert, P.O.; Kvansakul, M. Structural insight into the Scribble PDZ domains interaction with the oncogenic Human T-cell lymphotrophic virus-1 (HTLV-1) Tax1 PBM. FEBS J. 2023, 290, 974–987. [Google Scholar] [CrossRef] [PubMed]
- Studer, G.; Rempfer, C.; Waterhouse, A.M.; Gumienny, R.; Haas, J.; Schwede, T. QMEANDisCo-distance constraints applied on model quality estimation. Bioinformatics 2020, 36, 1765–1771. [Google Scholar] [CrossRef]
- Waterhouse, A.; Bertoni, M.; Bienert, S.; Studer, G.; Tauriello, G.; Gumienny, R.; Heer, F.T.; de Beer, T.A.P.; Rempfer, C.; Bordoli, L.; et al. SWISS-MODEL: Homology modelling of protein structures and complexes. Nucleic Acids Res. 2018, 46, W296–W303. [Google Scholar] [CrossRef] [PubMed]
- Kelley, L.A.; Mezulis, S.; Yates, C.M.; Wass, M.N.; Sternberg, M.J. The Phyre2 web portal for protein modeling, prediction and analysis. Nat. Protoc. 2015, 10, 845–858. [Google Scholar] [CrossRef] [PubMed]
- Zhang, Y. I-TASSER server for protein 3D structure prediction. BMC Bioinform. 2008, 9, 40. [Google Scholar] [CrossRef]
- Roy, A.; Kucukural, A.; Zhang, Y. I-TASSER: A unified platform for automated protein structure and function prediction. Nat. Protoc. 2010, 5, 725–738. [Google Scholar] [CrossRef] [PubMed]
- Yang, J.; Yan, R.; Roy, A.; Xu, D.; Poisson, J.; Zhang, Y. The I-TASSER Suite: Protein structure and function prediction. Nat. Methods 2015, 12, 7–8. [Google Scholar] [CrossRef]
- Kuzin, A.P.; Abashidze, M.; Seetharaman, J.; Vorobiev, S.M.; Wang, D.; Fang, Y.; Owens, L.; Ma, L.-C.; Xiao, R.; Liu, J.; et al. Crystal Structure of the Putative Nitrite Reductase NADPH (Small Subunit) Oxidoreductase Protein Q87HB1. Available online: https://www.wwpdb.org/pdb?id=pdb_00003c0d (accessed on 3 February 2024).
- Moe, L.A.; Bingman, C.A.; Wesenberg, G.E.; Phillips, G.N., Jr.; Fox, B.G. Structure of T4moC, the Rieske-type ferredoxin component of toluene 4-monooxygenase. Acta Crystallogr. D Biol. Crystallogr. 2006, 62, 476–482. [Google Scholar] [CrossRef] [PubMed]
- Bruns, C.M.; Karplus, P.A. Refined crystal structure of spinach ferredoxin reductase at 1.7 A resolution: Oxidized, reduced and 2′-phospho-5′-AMP bound states. J. Mol. Biol. 1995, 247, 125–145. [Google Scholar] [CrossRef]
- Raza, M.T.; Mizan, S.; Yasmin, F.; Akash, A.S.; Shahik, S.M. Epitope-based universal vaccine for Human T-lymphotropic virus-1 (HTLV-1). PLoS ONE 2021, 16, e0248001. [Google Scholar] [CrossRef]
- Schulman, B.A.; Carrano, A.C.; Jeffrey, P.D.; Bowen, Z.; Kinnucan, E.R.; Finnin, M.S.; Elledge, S.J.; Harper, J.W.; Pagano, M.; Pavletich, N.P. Insights into SCF ubiquitin ligases from the structure of the Skp1-Skp2 complex. Nature 2000, 408, 381–386. [Google Scholar] [CrossRef] [PubMed]
- Long, M.; Toesca, J.; Guillon, C. Review and perspectives on the structure-function relationships of the Gag subunits of Feline Immunodeficiency Virus. Pathogens 2021, 10, 1502. [Google Scholar] [CrossRef]
- Jumper, J.; Evans, R.; Pritzel, A.; Green, T.; Figurnov, M.; Ronneberger, O.; Tunyasuvunakool, K.; Bates, R.; Zidek, A.; Potapenko, A.; et al. Highly accurate protein structure prediction with AlphaFold. Nature 2021, 596, 583–589. [Google Scholar] [CrossRef]
- Baek, M.; DiMaio, F.; Anishchenko, I.; Dauparas, J.; Ovchinnikov, S.; Lee, G.R.; Wang, J.; Cong, Q.; Kinch, L.N.; Schaeffer, R.D.; et al. Accurate prediction of protein structures and interactions using a three-track neural network. Science 2021, 373, 871–876. [Google Scholar] [CrossRef]
- Lin, Z.; Akin, H.; Rao, R.; Hie, B.; Zhu, Z.; Lu, W.; Smetanin, N.; Verkuil, R.; Kabeli, O.; Shmueli, Y.; et al. Evolutionary-scale prediction of atomic-level protein structure with a language model. Science 2023, 379, 1123–1130. [Google Scholar] [CrossRef]
- Zheng, W.; Wuyun, Q.; Freddolino, P.L.; Zhang, Y. Integrating deep learning, threading alignments, and a multi-MSA strategy for high-quality protein monomer and complex structure prediction in CASP15. Proteins 2023, 91, 1684–1703. [Google Scholar] [CrossRef]
- Yuan, S.; Yu, X.; Topf, M.; Dorstyn, L.; Kumar, S.; Ludtke, S.J.; Akey, C.W. Structure of the Drosophila apoptosome at 6.9 a resolution. Structure 2011, 19, 128–140. [Google Scholar] [CrossRef]
- Kluska, K.; Adamczyk, J.; Krezel, A. Metal binding properties of zinc fingers with a naturally altered metal binding site. Metallomics 2018, 10, 248–263. [Google Scholar] [CrossRef]
- Hajikhezri, Z.; Darweesh, M.; Akusjarvi, G.; Punga, T. Role of CCCH-Type Zinc Finger Proteins in Human Adenovirus Infections. Viruses 2020, 12, 1322. [Google Scholar] [CrossRef]
- Yuan, S.; Xu, B.; Zhang, J.; Xie, Z.; Cheng, Q.; Yang, Z.; Cai, Q.; Huang, B. Comprehensive analysis of CCCH-type zinc finger family genes facilitates functional gene discovery and reflects recent allopolyploidization event in tetraploid switchgrass. BMC Genom. 2015, 16, 129. [Google Scholar] [CrossRef]
- Foucault, M.; Mayol, K.; Receveur-Bréchot, V.; Bussat, M.-C.; Klinguer-Hamour, C.; Verrier, B.; Beck, A.; Haser, R.; Gouet, P.; Guillon, C. UV and X-ray structural studies of a 101-residue long Tat protein from a HIV-1 primary isolate and of its mutated, detoxified, vaccine candidate. Proteins 2010, 78, 1441–1456. [Google Scholar] [CrossRef] [PubMed]
- Shojania, S.; O’Neil, J.D. HIV-1 Tat is a natively unfolded protein: The solution conformation and dynamics of reduced HIV-1 Tat-(1-72) by NMR spectroscopy. J. Biol. Chem. 2006, 281, 8347–8356. [Google Scholar] [CrossRef] [PubMed]
- Tahirov, T.H.; Babayeva, N.D.; Varzavand, K.; Cooper, J.J.; Sedore, S.C.; Price, D.H. Crystal structure of HIV-1 Tat complexed with human P-TEFb. Nature 2010, 465, 747–751. [Google Scholar] [CrossRef] [PubMed]
- Bex, F.; Murphy, K.; Wattiez, R.; Burny, A.; Gaynor, R.B. Phosphorylation of the human T-cell leukemia virus type 1 transactivator tax on adjacent serine residues is critical for tax activation. J. Virol. 1999, 73, 738–745. [Google Scholar] [CrossRef] [PubMed]
- Lodewick, J.; Lamsoul, I.; Polania, A.; Lebrun, S.; Burny, A.; Ratner, L.; Bex, F. Acetylation of the human T-cell leukemia virus type 1 Tax oncoprotein by p300 promotes activation of the NF-kappaB pathway. Virology 2009, 386, 68–78. [Google Scholar] [CrossRef] [PubMed]
- Lavorgna, A.; Harhaj, E.W. Regulation of HTLV-1 tax stability, cellular trafficking and NF-kappaB activation by the ubiquitin-proteasome pathway. Viruses 2014, 6, 3925–3943. [Google Scholar] [CrossRef]
- Steinacher, R.; Schar, P. Functionality of human thymine DNA glycosylase requires SUMO-regulated changes in protein conformation. Curr. Biol. 2005, 15, 616–623. [Google Scholar] [CrossRef]
- Kumar, A.; Narayanan, V.; Sekhar, A. Characterizing Post-Translational Modifications and Their Effects on Protein Conformation Using NMR Spectroscopy. Biochemistry 2020, 59, 57–73. [Google Scholar] [CrossRef]
- Philipsen, L.; Reddycherla, A.V.; Hartig, R.; Gumz, J.; Kastle, M.; Kritikos, A.; Poltorak, M.P.; Prokazov, Y.; Turbin, E.; Weber, A.; et al. De novo phosphorylation and conformational opening of the tyrosine kinase Lck act in concert to initiate T cell receptor signaling. Sci. Signal 2017, 10, eaaf4736. [Google Scholar] [CrossRef]
- Gres, A.T.; Kirby, K.A.; KewalRamani, V.N.; Tanner, J.J.; Pornillos, O.; Sarafianos, S.G. X-ray crystal structures of native HIV-1 capsid protein reveal conformational variability. Science 2015, 349, 99–103. [Google Scholar] [CrossRef]
- Kwong, P.D.; Wyatt, R.; Majeed, S.; Robinson, J.; Sweet, R.W.; Sodroski, J.; Hendrickson, W.A. Structures of HIV-1 gp120 envelope glycoproteins from laboratory-adapted and primary isolates. Struct. Fold. Des. 2000, 8, 1329–1339. [Google Scholar] [CrossRef] [PubMed]
- Deshmukh, L.; Schwieters, C.D.; Grishaev, A.; Clore, G.M. Quantitative Characterization of Configurational Space Sampled by HIV-1 Nucleocapsid Using Solution NMR, X-ray Scattering and Protein Engineering. Chemphyschem 2016, 17, 1548–1552. [Google Scholar] [CrossRef]
- Chakravarty, D.; Porter, L.L. AlphaFold2 fails to predict protein fold switching. Protein Sci. 2022, 31, e4353. [Google Scholar] [CrossRef] [PubMed]
- Terwilliger, T.C.; Liebschner, D.; Croll, T.I.; Williams, C.J.; McCoy, A.J.; Poon, B.K.; Afonine, P.V.; Oeffner, R.D.; Richardson, J.S.; Read, R.J.; et al. AlphaFold predictions are valuable hypotheses and accelerate but do not replace experimental structure determination. Nat. Methods 2024, 21, 110–116. [Google Scholar] [CrossRef] [PubMed]
Figure 1.
Functional domains of Tax. NLS: nuclear localization signal; E: nuclear export signal, P: PDZ-binding motif; ZnF: zinc finger; LZR1 and LZR2: leucine zipper regions 1 and 2.
Figure 1.
Functional domains of Tax. NLS: nuclear localization signal; E: nuclear export signal, P: PDZ-binding motif; ZnF: zinc finger; LZR1 and LZR2: leucine zipper regions 1 and 2.

Figure 2.
Prediction of Tax 3D structure using (A) Swiss-Model, (B) Phyre2 with defaults settings, (C) Phyre2 with “intensive” settings and (D) I-Tasser. Models are coloured from N- to C-terminal from dark blue (residue 1) to red (residue 353), as in Figure 1. Therefore, a single residue will have the same colour on all models, including the partial models (A,B).

Figure 3.
Prediction of Tax 3D structure using (A) AlphaFold 2, (B) RoseTTAFold, (C) ESMFold and (D) D-I-Tasser. Colour scheme is identical to Figure 2.
Figure 3.
Prediction of Tax 3D structure using (A) AlphaFold 2, (B) RoseTTAFold, (C) ESMFold and (D) D-I-Tasser. Colour scheme is identical to Figure 2.


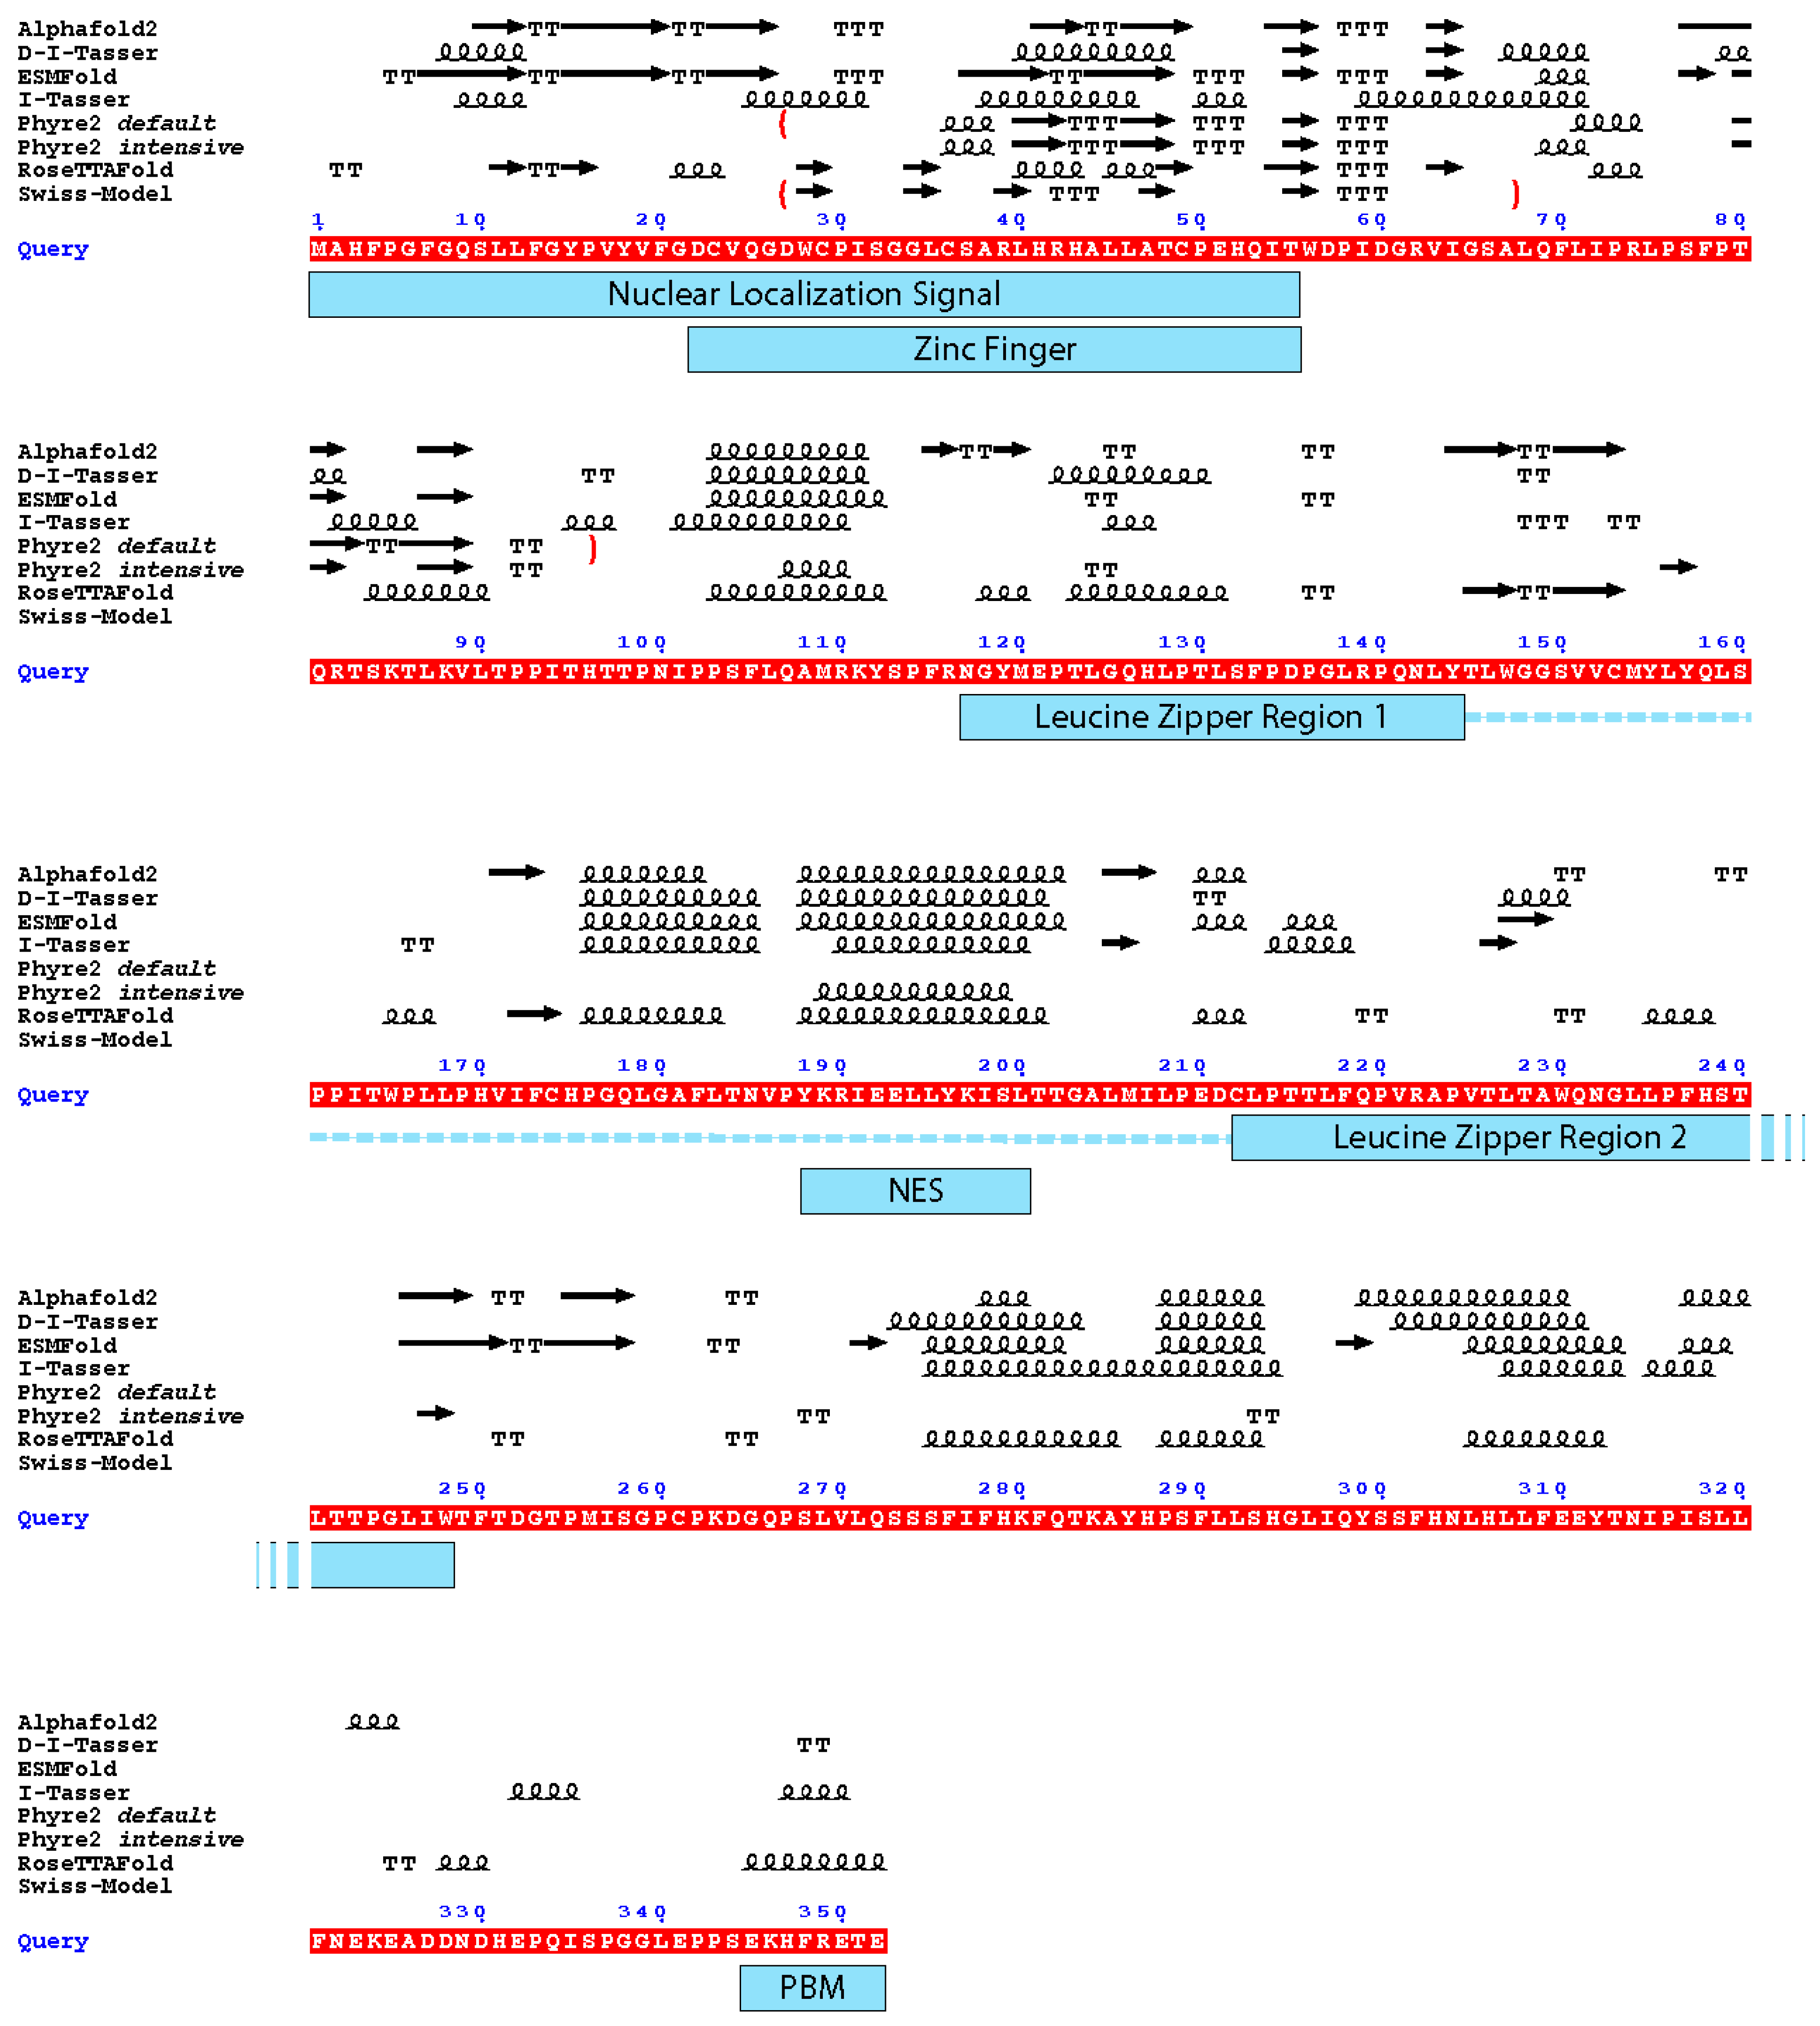
Figure 4.
Depiction of the secondary structure elements from the different models with the functional domains of the Tax protein. Underlined in red is the sequence of Tax used for the modelling (Query). Above the sequence: arrow: β-strand. Squiggles: α-helix. T: turn. The boundaries of the partial models are depicted by red brackets. Under the sequence, blue rectangles mark the functional domains of Tax depicted in Figure 1; the dotted line together with the leucine zipper regions depict the dimerization domain of Tax. NES: Nuclear Export Signal; PBM: PDZ-binding motif. The figure was generated by ESPript 3.0 [45].

Figure 5.
(A) Superimposition of the N-terminal domain (residues 15–74) of RoseTTAFold and ESMFold models. ESMFold and RoseTTAFold models are coloured with the same colour scheme as Figure 3 and orange, respectively. (B,C) CCCH zinc fingers predicted by ESMFold (B) and RoseTTAFold (C). All the cysteine residues are in yellow and histidine residues in pink.


Table 1.
Summary of confidence scores for each model of Tax generated by homology modelling. QMEANDisCo scores were calculated as explained in the text.
Table 1.
Summary of confidence scores for each model of Tax generated by homology modelling. QMEANDisCo scores were calculated as explained in the text.
| Modelling Server | Complete Protein Modelled? | Calculated QMEANDisCo |
|---|---|---|
| Swiss-Model | No | 0.31 ± 0.12 |
| Phyre2 (default) | No | 0.35 ± 0.11 |
| Phyre2 (intensive) | Yes | 0.27 ± 0.05 |
| I-Tasser | Yes | 0.35 ± 0.05 |
Table 2.
Summary of confidence scores for each model of Tax generated by AI-based algorithms. QMEANDisCo scores were calculated as explained in the text.
Table 2.
Summary of confidence scores for each model of Tax generated by AI-based algorithms. QMEANDisCo scores were calculated as explained in the text.
| Modelling Program | Complete Protein Modelled? | Original Confidence Score | Calculated QMEANDisCo |
|---|---|---|---|
| AlphaFold 2 | Yes | pLDDT = 37.4 | 0.35 ± 0.05 |
| RoseTTAFold | Yes | Predicted GDT = 0.35 | 0.39 ± 0.05 |
| ESMFold | Yes | pLDDT = 47.6 | 0.43 ± 0.05 |
| D-I-Tasser | Yes | eTM = 0.4 | 0.44 ± 0.05 |
Disclaimer/Publisher’s Note: The statements, opinions and data contained in all publications are solely those of the individual author(s) and contributor(s) and not of MDPI and/or the editor(s). MDPI and/or the editor(s) disclaim responsibility for any injury to people or property resulting from any ideas, methods, instructions or products referred to in the content. |
© 2024 by the authors. Licensee MDPI, Basel, Switzerland. This article is an open access article distributed under the terms and conditions of the Creative Commons Attribution (CC BY) license (https://creativecommons.org/licenses/by/4.0/).
Share and Cite
MDPI and ACS Style
Guillon, C.; Robert, X.; Gouet, P. “It’s Only a Model”: When Protein Structure Predictions Need Experimental Validation, the Case of the HTLV-1 Tax Protein. Pathogens 2024, 13, 241. https://doi.org/10.3390/pathogens13030241
AMA Style
Guillon C, Robert X, Gouet P. “It’s Only a Model”: When Protein Structure Predictions Need Experimental Validation, the Case of the HTLV-1 Tax Protein. Pathogens. 2024; 13(3):241. https://doi.org/10.3390/pathogens13030241
Chicago/Turabian StyleGuillon, Christophe, Xavier Robert, and Patrice Gouet. 2024. "“It’s Only a Model”: When Protein Structure Predictions Need Experimental Validation, the Case of the HTLV-1 Tax Protein" Pathogens 13, no. 3: 241. https://doi.org/10.3390/pathogens13030241
Note that from the first issue of 2016, this journal uses article numbers instead of page numbers. See further details here.