Per-length biomass estimates of Antarctic krill (Euphausia superba)
 Abigail J. R. Smith
 Simon J. Wotherspoon
 Martin J. Cox
- 1Australian Antarctic Program Partnership, Institute for Marine and Antarctic Studies, University of Tasmania, nipaluna/Hobart, TAS, Australia
- 2Southern Ocean Ecosystems Program, Australian Antarctic Division, Kingston, TAS, Australia
- 3Integrated Digital East Antarctica (IDEA), Australian Antarctic Division, Kingston, TAS, Australia
Total biomass and areal biomass density are often necessary to establish ecological relationships and enable informed management decisions, in particular setting fisheries catch limits. Further refining these estimates to sub-population biomass based on length informs ecological models of predator-prey dynamics, ecosystem energy transfer and biogeochemical cycles; however, measures of uncertainty in these per-length biomass estimates are needed. We present a statistical method to calculate the per-length biomass of Antarctic krill (Euphausia superba) from conversion factors using acoustic and net sample data. Variability in krill length-frequency, and wetmass introduced by net sampling is also explored through non-parametric bootstrapping. We applied this method on a 1 mm length window to active acoustic and net sample data collected during an Antarctic krill biomass survey in CCAMLR Division 58.4.2 (62 – 67°S; 55 – 80°E, with a survey area of 775,732 km2) performed between February – March 2021. We found that 77% of the total estimated biomass was attributable to krill of length 14 – 49 mm. The largest biomass of krill in a single length bin was estimated as 340,000 t (95% CI: 148,000 - 408,000 t) and was found in the 49 mm length bin (i.e., 48.5 to 49.5 mm). This method will allow future surveys (with sufficient data) to estimate biomass of krill on a per-length basis along with associated uncertainty (confidence intervals) derived from net sampling and so may be used to provision size-based ecosystem models with krill biomass.
1 Introduction
Antarctic krill (Euphausia superba) are a keystone species in Southern Ocean ecosystems, preyed on by whales, seals, seabirds and fish. With a circumpolar biomass of more than 300 million tons (Atkinson et al., 2009), Antarctic krill have a strong influence on biogeochemical cycles (Cavan et al., 2019, Ratnarajah, 2021, Smith et al., submitted) and contribute to the largest fishery in the Southern Ocean (Meyer et al., 2020). Environmental pressures as a result of climate change, including rising sea surface temperatures, sea ice melt and ocean acidification negatively impact Antarctic krill reproduction and recruitment (Moline et al., 2004, Veytia et al., 2021, Kawaguchi et al., 2011; Kawaguchi et al., 2013). This, in combination with an expanding fishery (CCAMLR, 2019), is expected to influence future Antarctic krill populations. Due to the significant role Antarctic krill (hereafter krill) play in Southern Ocean ecosystems, understanding the long-term trajectories for their populations and distributions is critical to sustainable management (Constable and de la Mare, 1996; Meyer et al., 2020).
Predators tend to be larger than their prey and the body size of an organism typically decreases with increasing abundance (Blanchard et al., 2017). Krill total length is proportional to the energy available to predators (Reid and Croxall, 2001) and the amount of biogenic and inorganic carbon retained or released by the animal (Wilson et al., 2009, Cavan et al., 2019, Clarke and Morris, 1983). Therefore, size-specific biomass may be used to inform trophodynamic and biogeochemical models. In fisheries, length and stock size is used to classify juvenile or spawning populations, estimate recruitment, and protect key reproductive areas (Larkin, 1978; Galaiduk et al., 2018). Furthermore, accurate estimates of juvenile krill abundance are required to map transport pathways from spawning grounds with oceanographic currents (Veytia et al., 2021; Bhattacharya, 1967). Measures of uncertainty in biomass estimates are needed to capture the sensitivity of models, particularly when considering impacts to ecosystems under changing climate conditions (Bryndum-Buchholz et al., 2019; Lotze et al., 2019).
Antarctic krill biomass is typically estimated from ship-based acoustic-trawl surveys (e.g., Krafft et al., 2021 and Bairstow et al., 2022, but see Cutter et al., 2022 for alternative sampling platforms). Currently, a single biomass estimate for the survey area is determined from the fisheries (active) acoustic and net sample data. The acoustic data is sampled along line transects and is used to sample krill in space, whereas the net data is used to sample krill demographics, length distribution and the length to wetmass relationship. The acoustic data do not sample krill density directly, so the net data are used to scale the acoustic data using a single survey-specific conversion factor.
The conversion factor C transforms a linear form of reflected acoustic energy (Nautical Area Scattering Coefficient, (sA [m2 nmi-2]; Maclennan et al., 2002) arising from krill into an areal biomass density ρA [g m-2]. In addition to the krill length frequency distribution and krill length to wetmass relationship, a length dependent target strength (spherical scattering cross-section, σsp) is also required to calculate the conversion factor (Calise and Skaret, 2011; Han et al., 2020; Bairstow et al., 2021). For a single survey, it is possible to use sA data to map the distribution of relative krill densities, but for repeat or interannual surveys the krill demographic parameters will change making the use of sA tenuous. This is because the same value of sA may be generated by different areal densities of krill with different length-frequency distributions (Figure 1).
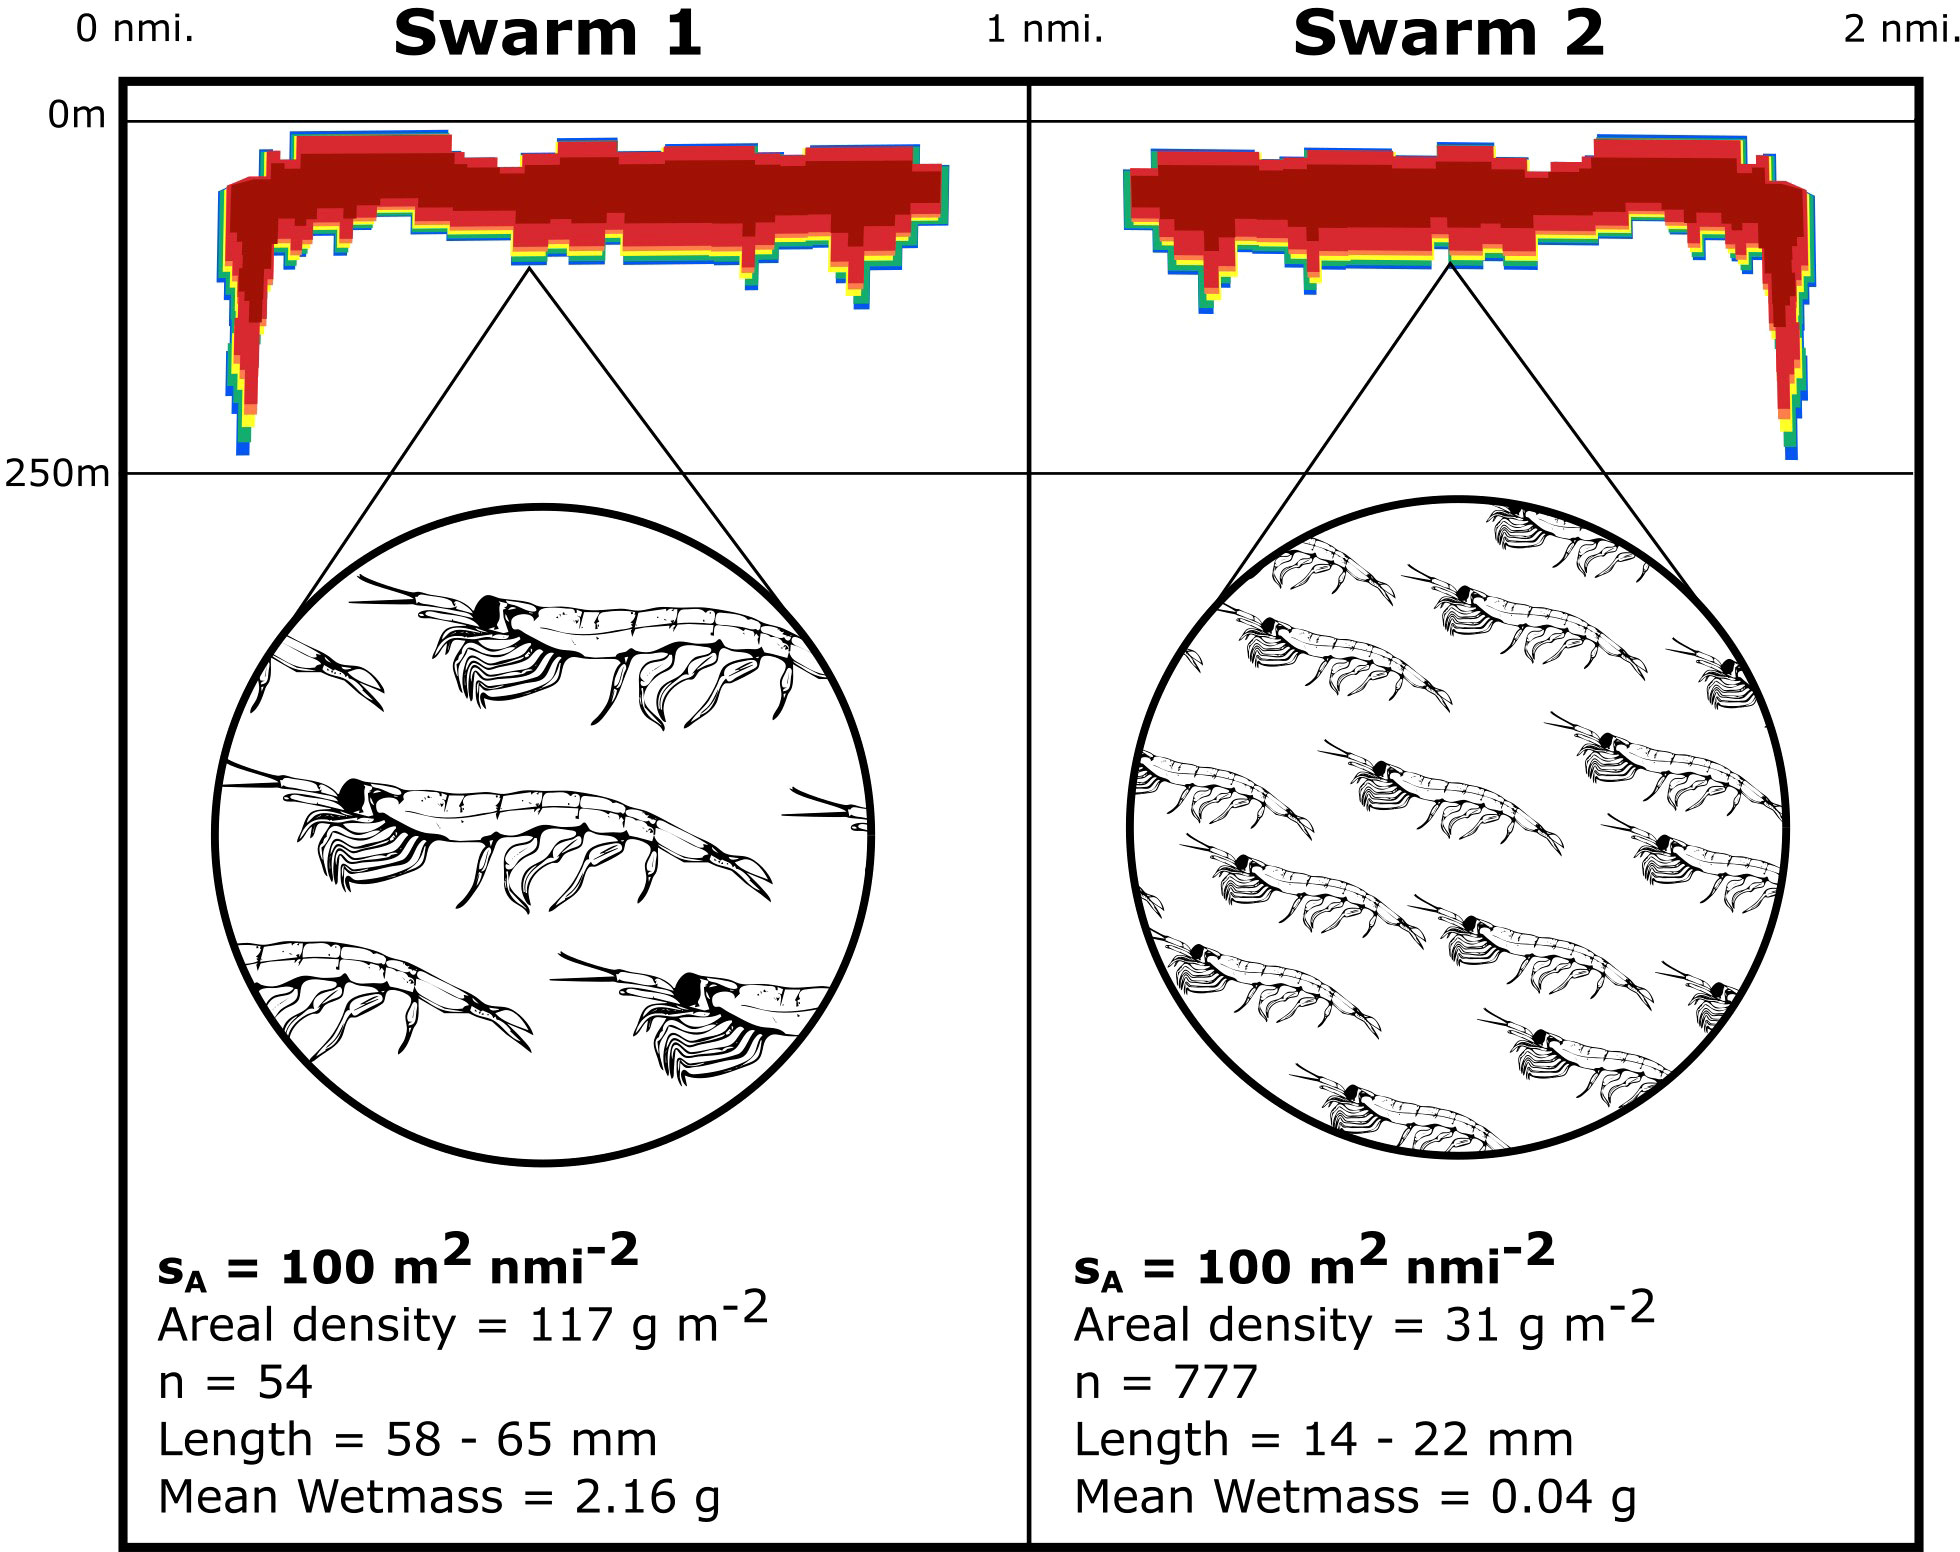
Figure 1 Two near-identical swarms may have a Nautical Area Scattering Coefficient (sA) value of 100 m2 nmi-2, yet comprise krill of different mean areal densities, length frequency distributions and wetmass demonstrating the importance of net samples to obtain information of krill demographics.
There are potential sources of uncertainty in the conversion factor. Krill swarms have demonstrated size sorting mechanisms in the field, meaning net sampling strategy may influence the length frequency distribution of krill measured from net samples (Watkins et al., 1992; Watkins, 1986) particularly when insufficient trawls are performed. Additionally, while total length measurements may be straightforward at sea, measuring krill wetmass on a moving vessel is challenging. As a result, many biomass surveys use established length-wetmass relationships, such as those described by Hewitt et al. (2004) and Morris et al. (1988), see for example Krafft et al. (2021). Such relationships assume a standard growth rate for all krill, i.e., a single regression line is fitted, and are often based on data from krill collected in West Antarctic (e.g. Morris et al., 1998; Hewitt et al., 2004), therefore may not be representative of krill collected in other locations. Variability in both krill length to wetmass relationships and length frequency distributions should be accounted for in calculation of conversion factors and associated confidence intervals.
The objective of this research is to develop methods enabling estimation of per-length krill biomass and variability attributed to net sampling. We apply the method to data from a recent (2021) acoustic-trawl survey of krill conducted in the East Antarctic in CCAMLR Division 58.4.2 (775,732 km2, Cox et al., 2022). Our method estimates biomass of krill in 1 mm length bins and associated measures of reliability using conversion factors with data derived from net samples.
2 Methods
2.1 Calculating the conversion factor
The conversion factor for a traditional krill biomass survey is calculated using:
where Li denotes the mid-length of the ith length bin, fi is the frequency of occurrence of krill in the ith length bin, W(Li) is the estimated wetmass of an individual at length i and σsp (Li) is the spherical cross-section scattering coefficient of krill at Li. The second term is applied to convert areal biomass density from nautical miles-2 to m-2.
Krill wetmass (g) was modelled as a power law in a standard measure of body length (L, mm)
where a and b are coefficients to be estimated. This relation was fitted to the net sample data by (nonlinear) generalized least squares (Pinheiro and Bates, 2023), assuming the error variance is proportional to the power of the predicted weight to allow for any heteroscedasticity in the data. A self-starting routine was implemented to establish suitable starting parameters for the power law and avoid convergence failures (Pinheiro and Bates, 2000).
The biomass density, B, for a survey is calculated by:
where is the mean sA for the survey area.
The per-length conversion factor for the jth length interval were calculated by the ratio:
where n is the number of length bins. And Cj can be written as:
where K is the normalizing factor:
Per-length conversion factors (Cj) were calculated and applied to to produce per-length biomass (Bi),
Where the sum of Cj is equal to C for the total survey and the sum of Bi equals the survey biomass.
2.2 Estimating uncertainty
The uncertainty in both the length specific and total conversion factors is estimated by non-parametric bootstrap (Tibshirani and Efron, 1993) over net hauls (see Supplementary Materials). Bootstrap samples are drawn by resampling (n = 2000) with replacement hauls from the net sample data. For each bootstrap sample, the length frequency distribution and length-wetmass relationship are re-estimated and used to determine new length specific and total conversion factors. The percentiles of the conversion factors derived from the bootstrap samples provide approximate confidence intervals for the conversion factors derived from the actual sample.
2.3 Data description
Acoustic and net sample data used in this study are described in Cox et al. (2022). Briefly acoustic data was collected along six latitudinal transects (62 - 68°S, 55 - 80°E), using a cold-water calibrated EK80 scientific echosounder (Simrad, Horten, Norway). All acoustic data processing was performed on the 120 kHz frequency using the ‘swarms-based’ method (CCAMLR, 2017; Krafft et al., 2021), however this method of calculating per-length biomass could also be applied to other target classification methods such as ‘dB-differencing’.
Net samples were taken using a rectangular mid-water trawl (RMT8 + 1, mesh size 4.5 mm, Roe and Shale, 1979). Both routine and target trawls were performed throughout the survey. Routine trawls were performed at regular intervals along transects in< 200 m depth, with the net open for an average of 20 minutes (n = 18). Target trawls were performed spontaneously in response to detection of an acoustic target (n = 41). Up to 250 krill were measured for total length (using S1 method, Mauchline et al., 1980) from each station. From 16 stations, a further 10 - 60 krill were subsampled for wetmass measurements using onboard motion-compensated balances (Ohaus AX224, Parsippany, USA). For a complete description of acoustic methods and total survey biomass determination see Cox et al. (2022).
All data were accessed at: https://data.aad.gov.au/metadata/AAS_4512_TEMPO_bioacoustics.
Spherical cross-section scattering coefficients (target strengths, TS) were taken from the 120 kHz target strength values () calculated by the 2019 CCAMLR Area 48 Survey (Krafft et al., 2021). The effect of target strength variability on biomass estimates has been explored by Bairstow et al. (2022), and will therefore not be considered at length in this study.
3 Results
3.1 Krill length frequency distribution
Krill total length ranged from 14.4 - 60.0 mm. Length frequency distributions from all trawls had a platykurtic distribution (Figure 2) and showed no apparent trend between stations (Bairstow et al., 2022; Cox et al., 2022). The mean length of krill caught by target trawls was 40.6 ± 7.1 mm compared to a marginally greater mean of 41.4 ± 7.8 mm caught by routine trawls. An asymptotic two-sample Kolmogorov-Smirnov test (KS-test) revealed significant variability in the length frequency distributions achieved by the two net haul methods (D = 0.087, p-value = 4.01 x 10⁻⁶), but it is unclear if this distribution difference is due to inherent sampling variability, rather than the trawling strategy used, i.e., routine or target trawling. Indeed, when the routine trawls were randomly assigned into two groups by trawl number (n = 7 trawls in each group), the KS-test result was (D = 0.1714, p-value = 1 x 10⁻⁷) and for target trawls (n = 10 in each group; D = 0.2505, p-value< 2.2 x 10⁻¹⁶), suggesting that sampling variability is of a similar magnitude to net sampling method.
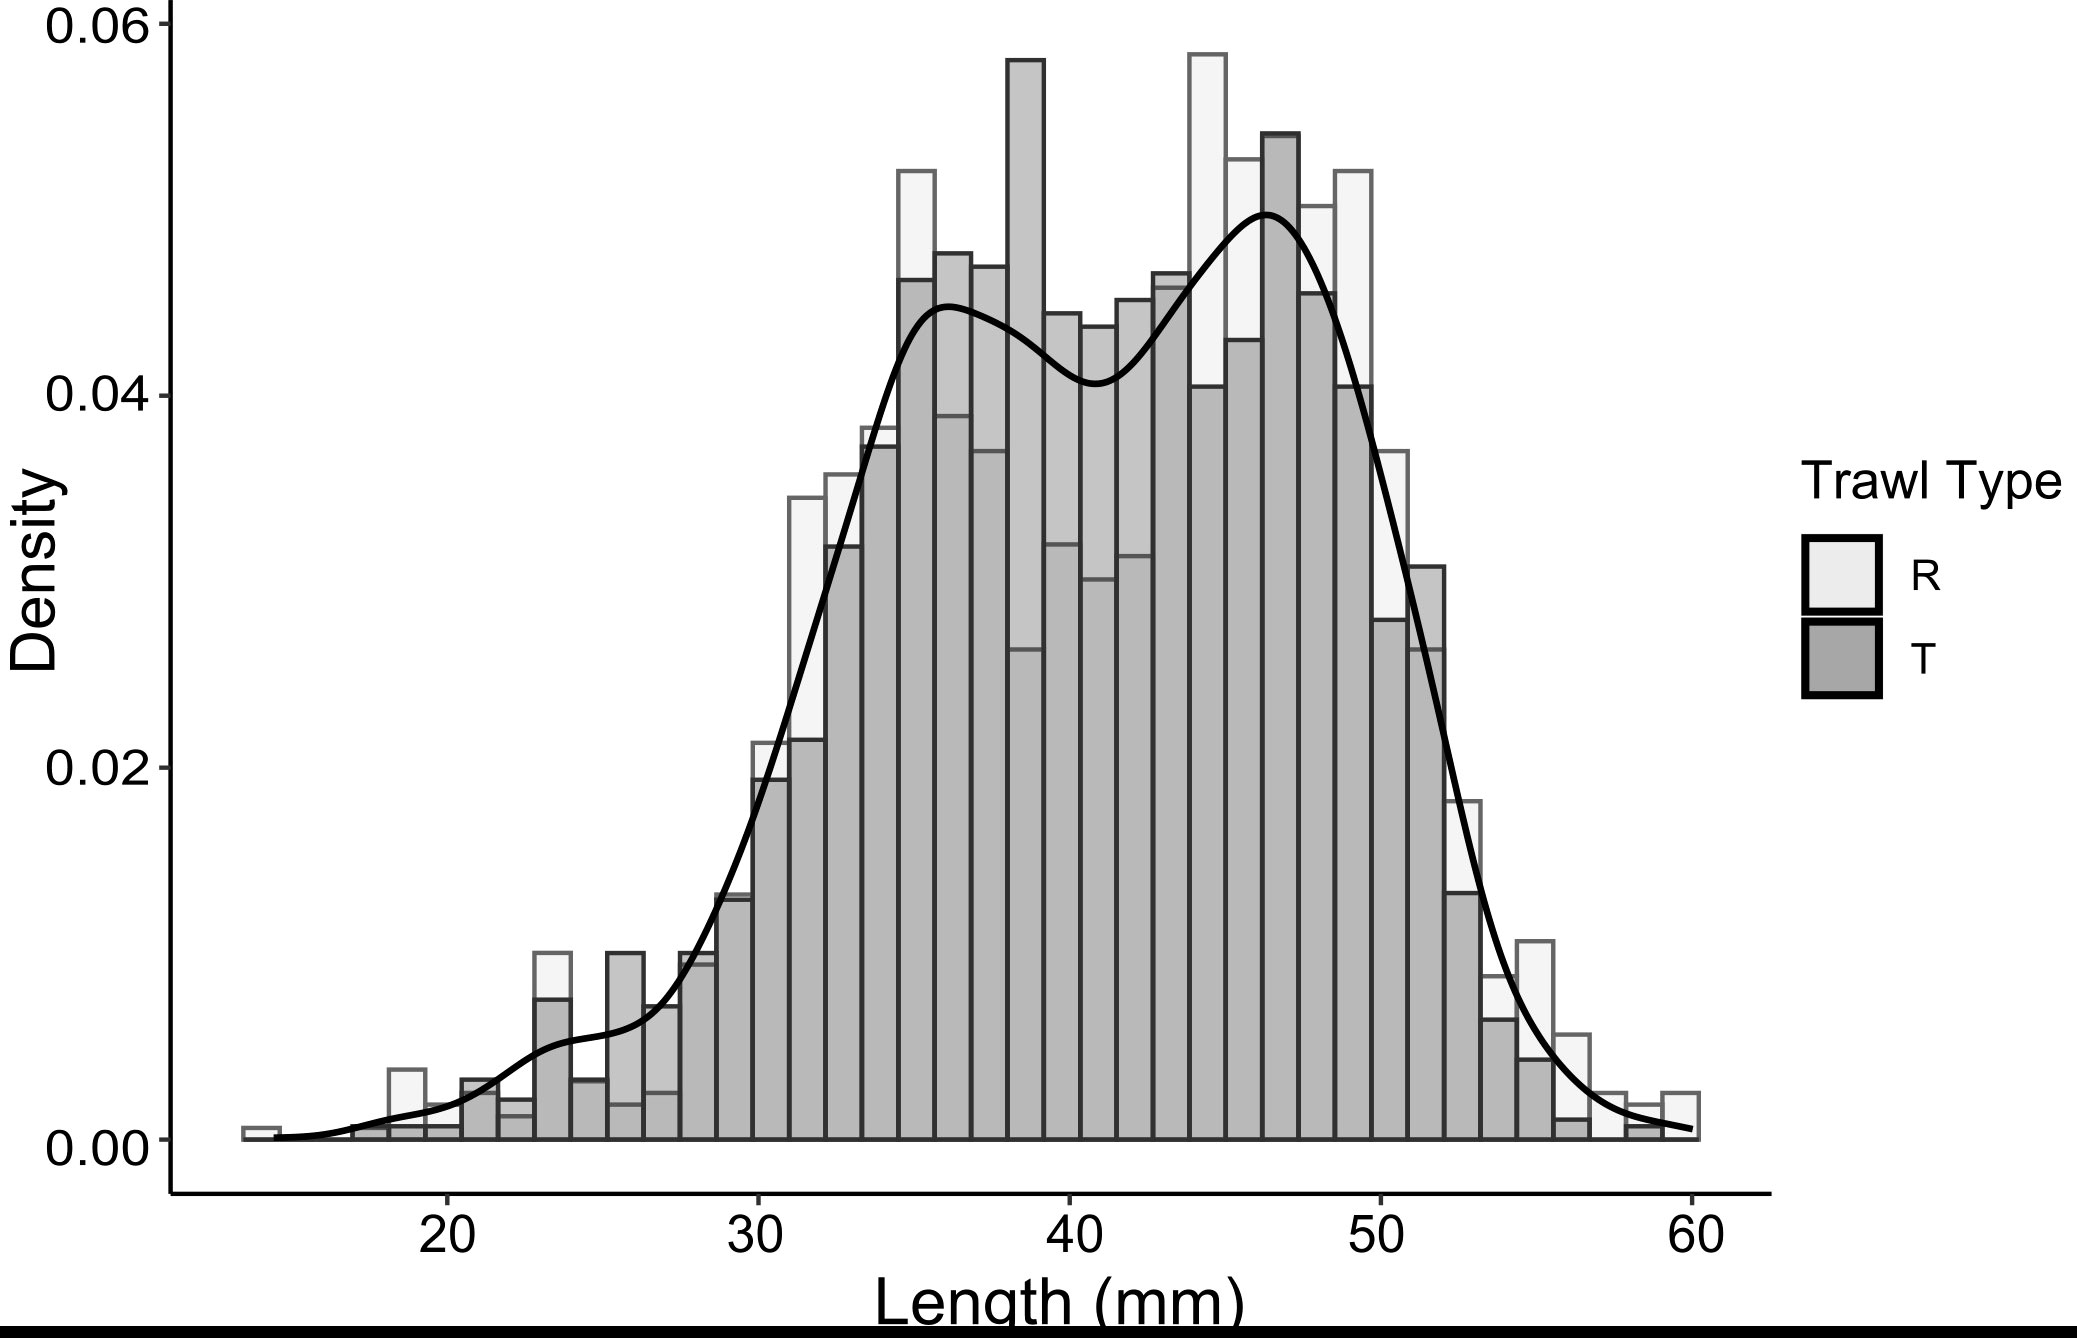
Figure 2 Histogram of observed krill length frequencies at 1 mm intervals from routine trawls (light grey) and target trawls (dark grey) with frequency polygon for the distribution of all net samples based on densities overlaid (solid black line).
3.2 Krill length-wetmass relationship
Krill length to wetmass data followed a power law (Figure 3) and were modeled as such (Equ. 2) producing a mean coefficient (a, × 10-6) of 4.4 (CV = 14.5%) and exponent (b) of 3.16 (CV = 1.26%). Increasing variability with length could be observed in the length-wetmass data, therefore a variance proportional to a 0.91 power of weight was used to normalize the data. Use of generalized nonlinear least squares to fit the length-wetmass relationship allowed for this heteroscedasticity to be captured in the model, where a nonlinear least squares fit would not (Supplementary Materials, Figure S1). Overlap in length and wetmass was observed between, male, female, and juvenile krill (Figure 3 box plots). Sex and stage may influence the variance observed in length to wetmass relationships. However, as the overlap makes it difficult to differentiate subpopulations, the effect of sex and stage on the length to wetmass relationship is not considered further.
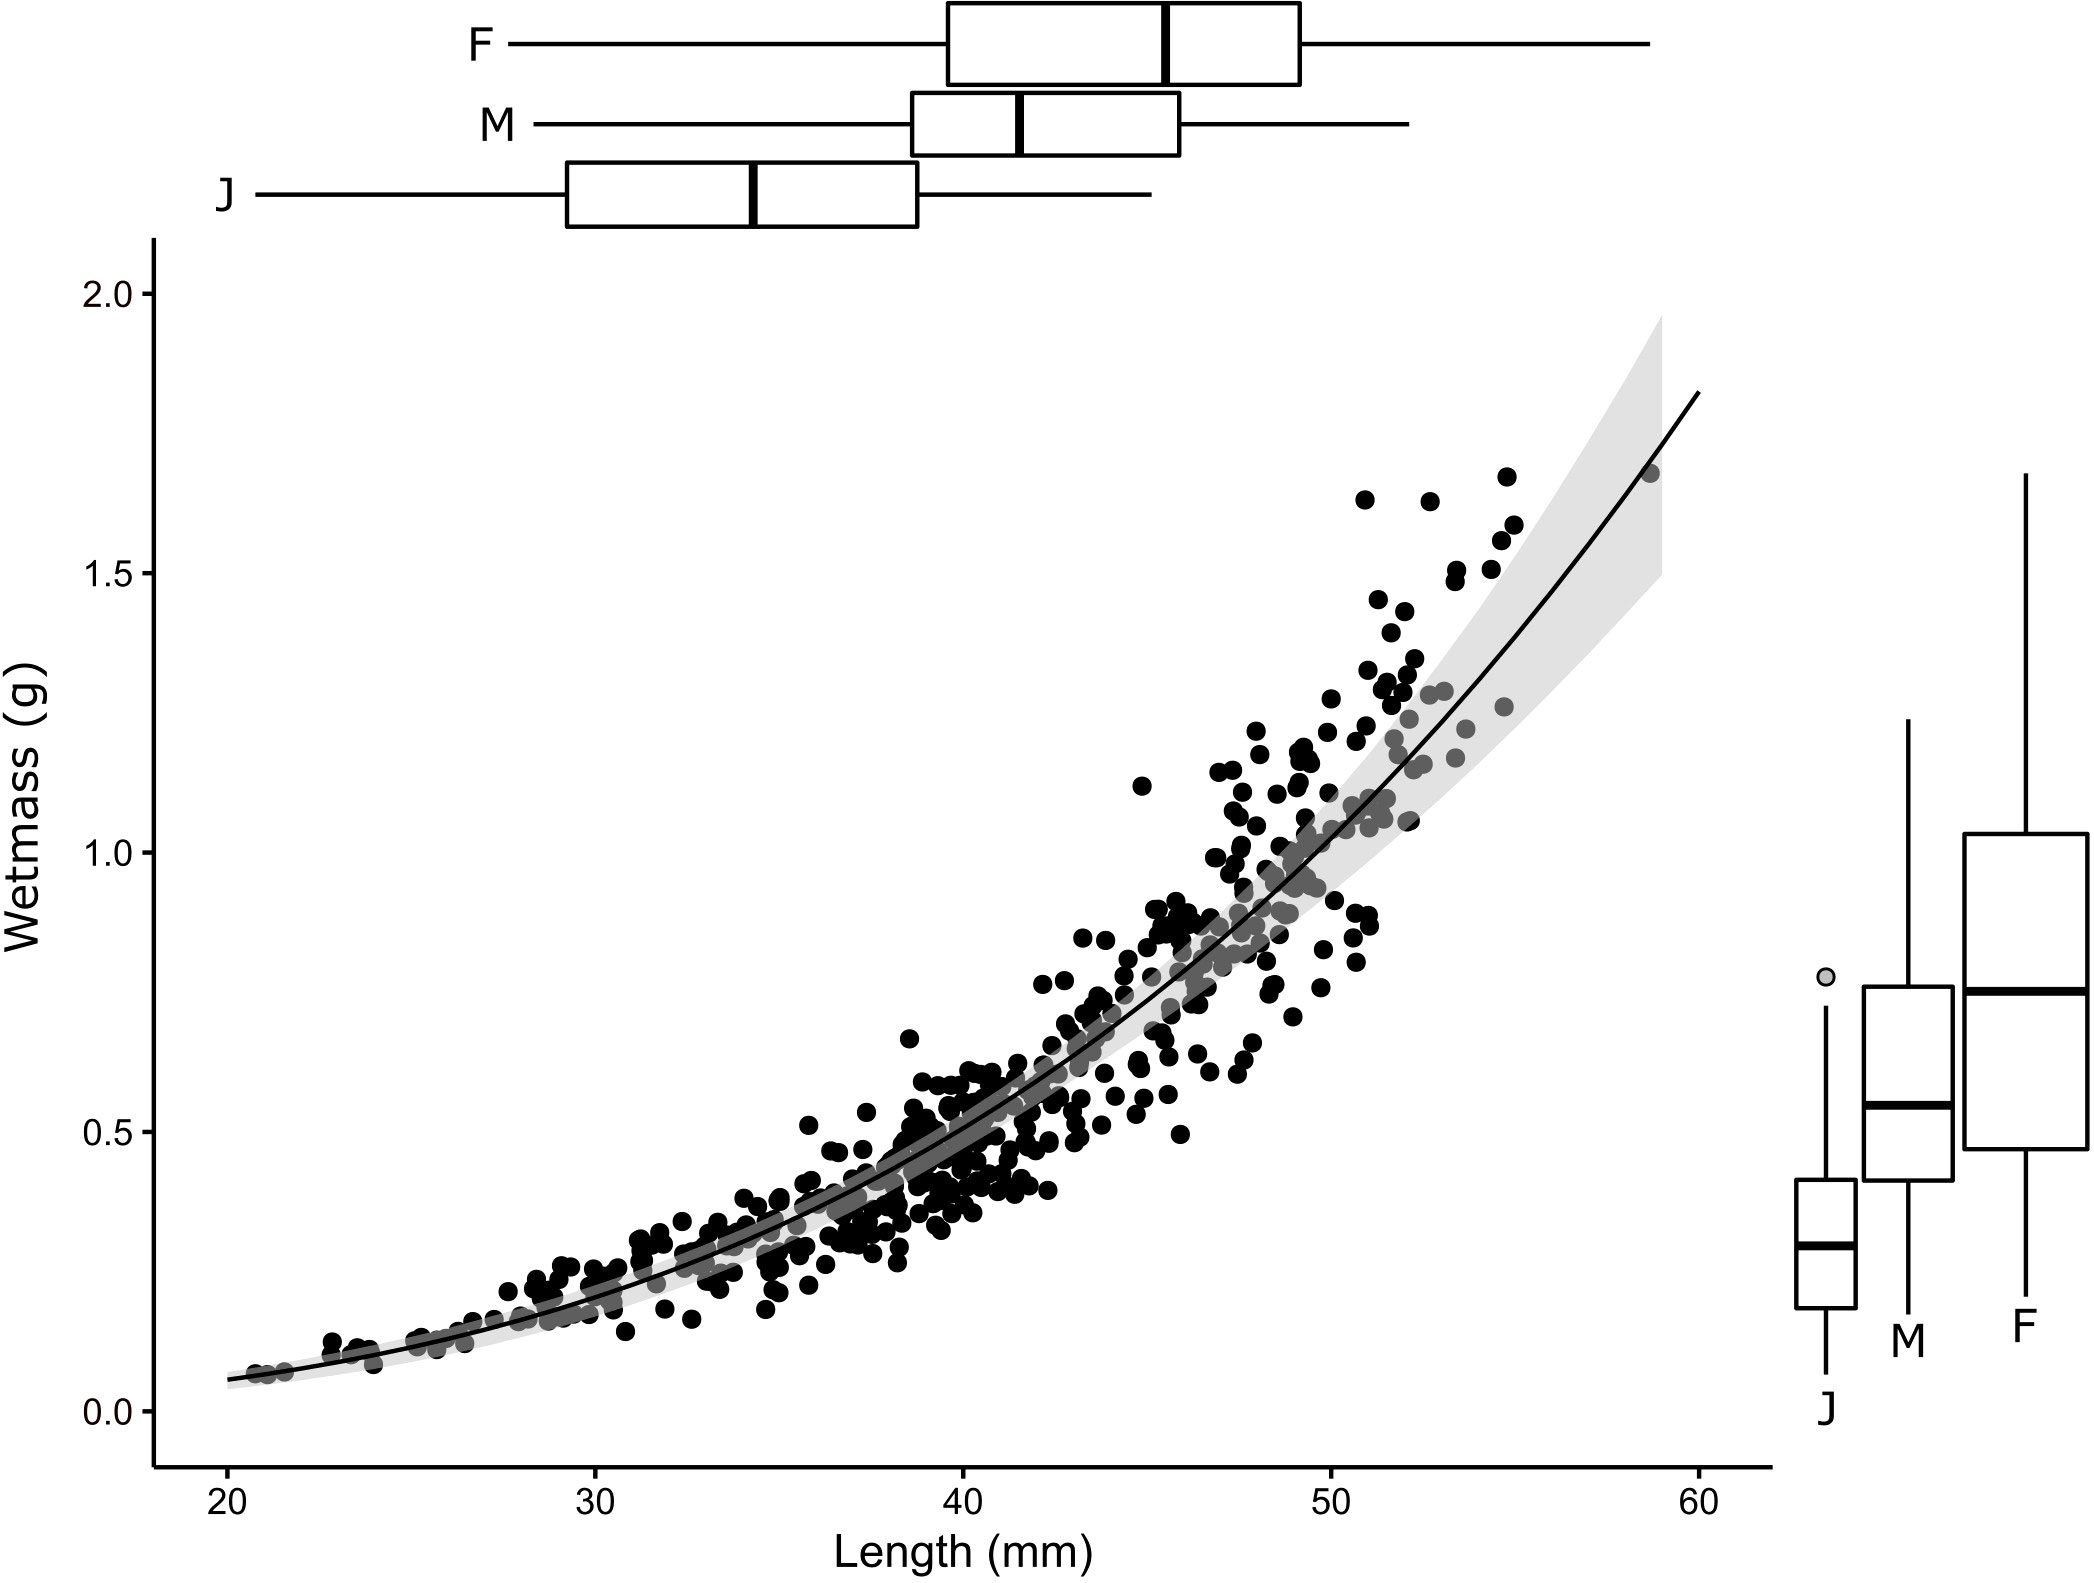
Figure 3 Length-wetmass relationship with 95% confidence intervals from bootstrapping (Section 2.2) overlayed in grey. Marginal boxplot quantiles for krill length (top) and weight (right) by sex are displayed for juveniles (J), adult and subadult males (M) and females (F).
3.3 Per-length conversion factors, biomass and uncertainty
With a survey-specific length-wetmass relationship (calculated here using generalized least squares) and length-target strength relationship provided by Krafft et al. (2021), conversion factors and biomass could be calculated for each 1 mm integer length of krill weighted by the frequency of occurrence at each length (from 10 – 65 mm, Figure 4).
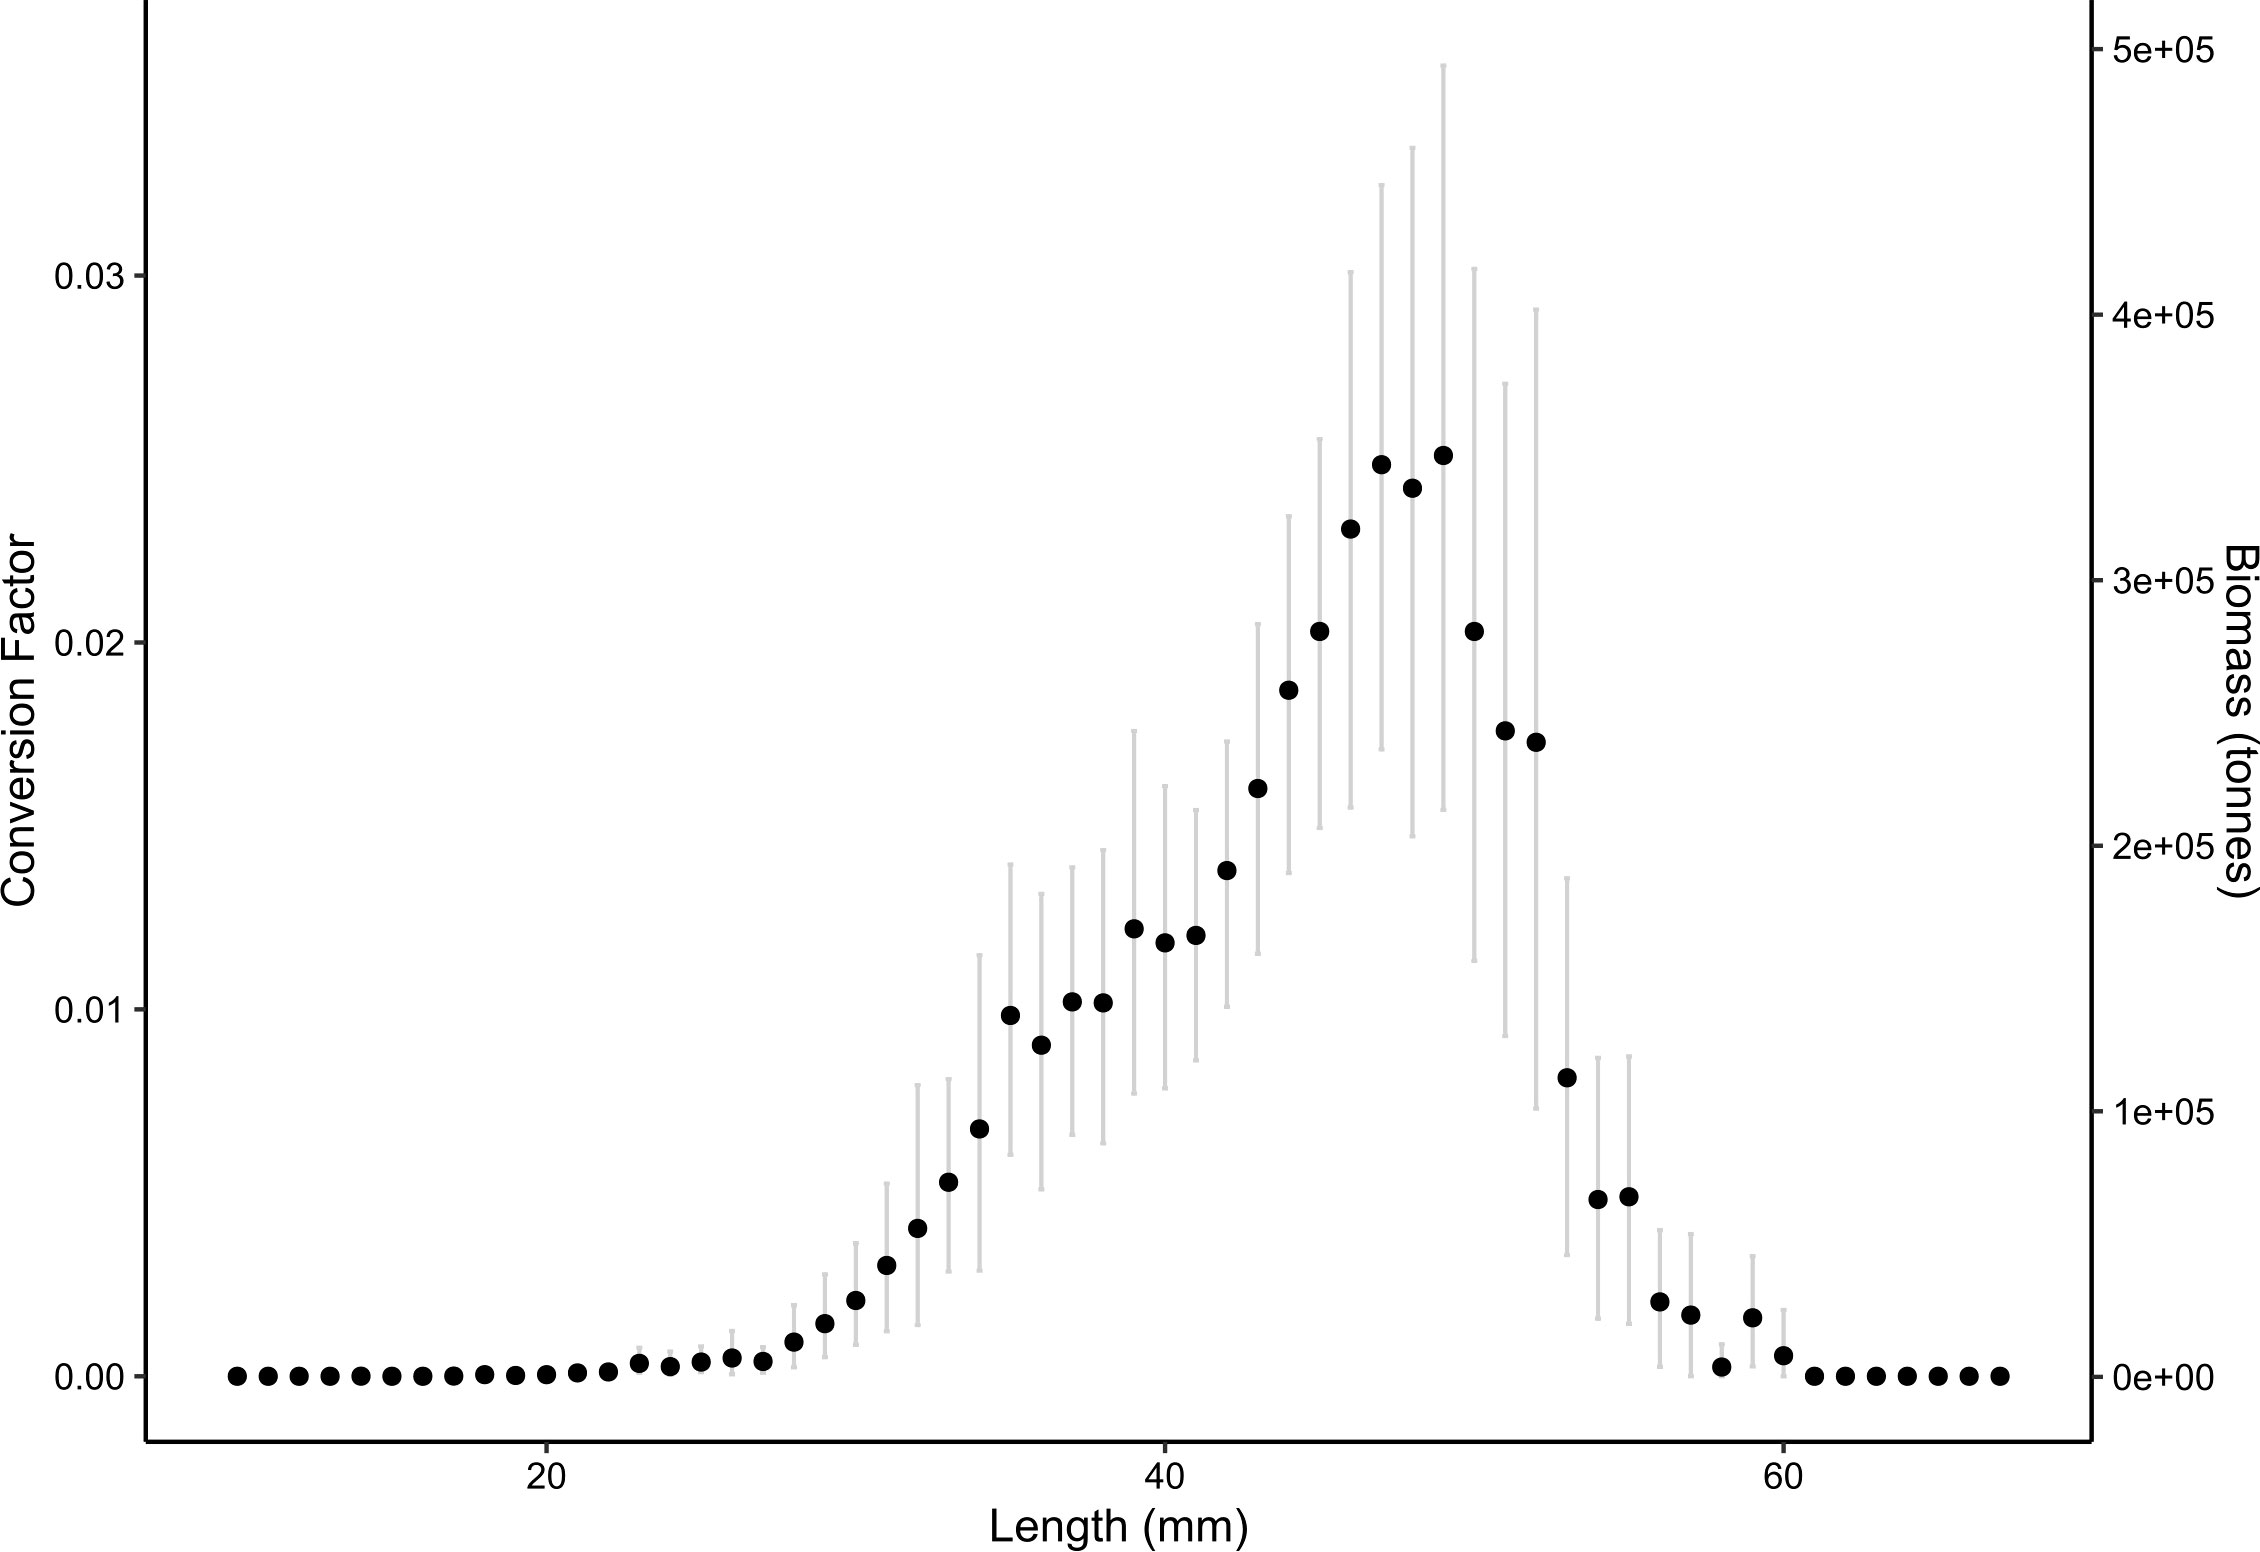
Figure 4 Mean per-length conversion factors (left axis) and biomass (right axis) with 95% confidence intervals (grey lines) determined from non-parametric bootstrap simulations.
Per-length conversion factors represent a fraction of the total survey conversion factor, ranging from 2.81 × 10⁻⁶ to 0.025. When applied to the largest Bi was observed for 49 mm krill at 346,847 t (95%: 217,638 – 490,742 t). The minimum Bi was 38.8 t (95%: 0 – 145.6 t) for 14 mm krill. Krill with lengths 14 – 49 mm contributed 77.1% of total biomass (Supplementary Figure S2). Length classes where conversion factors are equal to zero represent unobserved lengths from this dataset; here one may elect Bayesian bootstrapping approaches to weight the missing observations (see Section 4.1 for further detail).
By summing per-length conversion factors, the total survey conversion factor was 0.346 with 95% confidence intervals of 0.301 and 0.389 (Figure 5). This gave a total survey biomass estimate of 4.78 million t (95%: 4.12 – 5.31 million t). It should be noted that biomass variance presented here is derived from the krill length-frequency distribution and length-wetmass relationships. Whilst bootstrapping over trawl stations incorporates some element of spatial variability, the spatial coverage of net samples is low compared to the active acoustic transect effort; therefore, biomass confidence intervals presented here do not account for variability in sA from transects across the survey area (Jolly and Hampton, 1990).
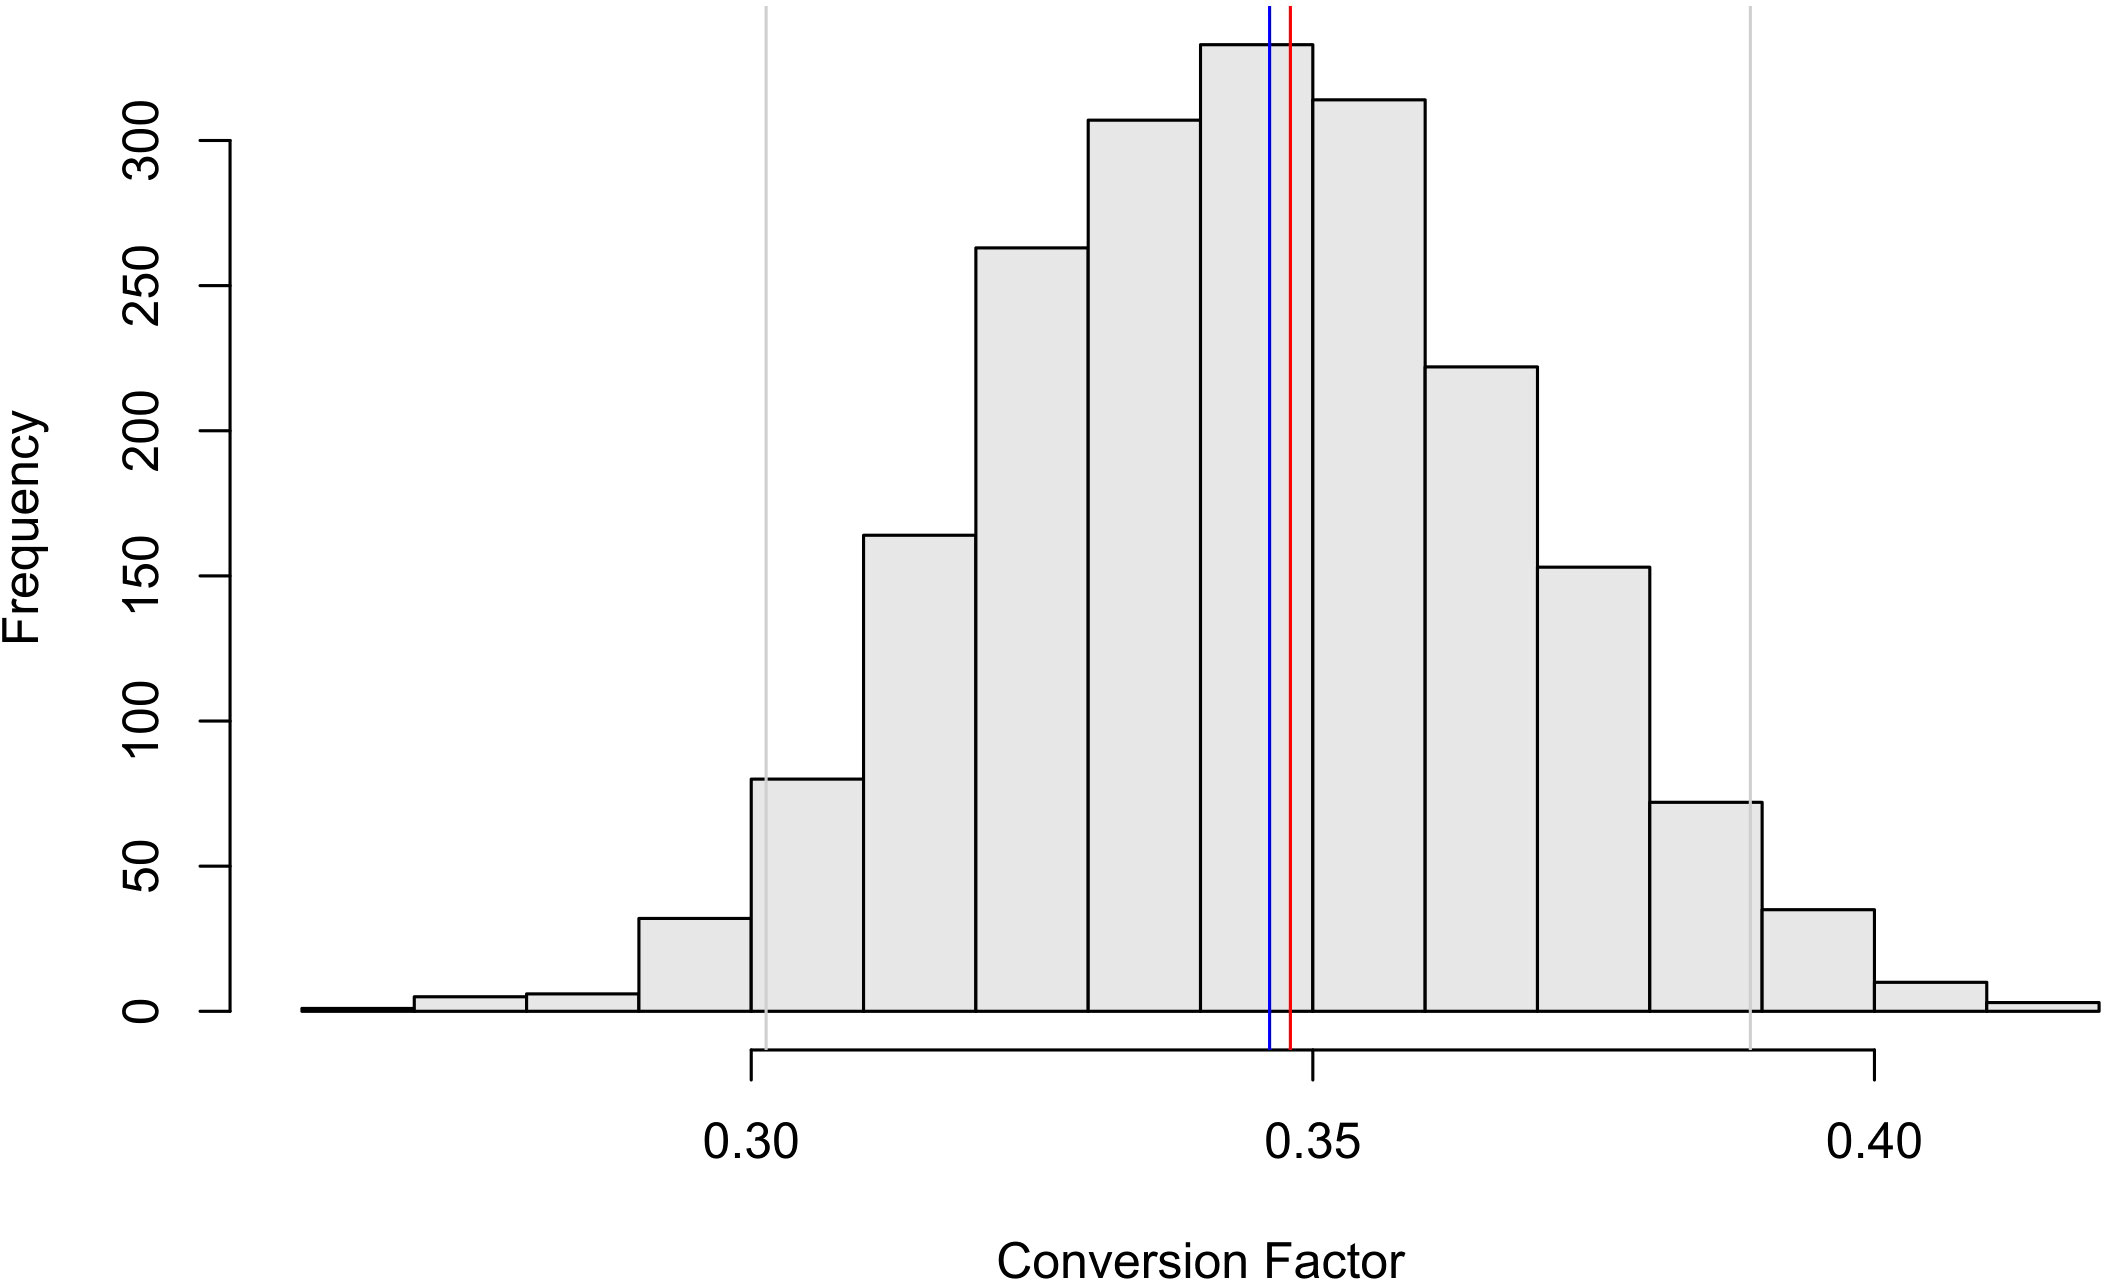
Figure 5 Histogram of bootstrapped conversion factors (n = 2000 replicates) for 1 mm krill length bins. Each realization was simply the sum of the length-specific conversion factors with the point sum of conversion factors (blue line), 95% confidence intervals (grey lines) and conversion factor for Cox et al. (2022, red line) displayed.
Discrepancies in the length-frequency distribution collected by differing trawl methods resulted in total survey biomass estimates of 4.68 million t (95%: 3.90 – 5.45 million t) from target trawls and 4.78 million t (95%: 3.95 – 5.53 million t) from routine trawls. Although length-frequency distributions varied, the final total survey biomass was not significantly different between the two net sampling methods (Kolmogorov-Smirnov test, D = 0.103, p-value = 0.883).
Using all net samples, the total survey conversion factors and biomass estimates calculated here were marginally smaller than those given by Cox et al. (2022) using traditional methods (Figure 5, C = 0.348, B = 4.8 million t). Although similar, differences between the two methods of estimating biomass are likely the result of applying generalized least squares fit to the length-wetmass relationship.
4 Discussion
Here we have successfully calculated per-length biomass estimates for Antarctic krill and their associated uncertainty due to net sampling. These methods are useful for models which require empirical data to incorporate krill size as a parameter of ecosystem processes. The uncertainty estimates enable researchers to assess the utility of the per-length biomass estimates for their particular purpose. Whilst we have provided biomass in 1 mm length bins, the bin width can be tailored to suit the question or data in hand. For example, length bins can be split into biologically relevant ranges to suit the study species, e.g., age class 0 (furcilia and juveniles): 8 – 24 mm (Siegel, 1987; Schaafsma et al., 2016; Schaafsma et al., 2022). Further, should a paucity of data lead to biomass confidence intervals too wide for the purpose in hand, larger length bins may reduce the confidence interval width.
4.1 Modeling length to wetmass relationships
Equality of variance is a key assumption of nonlinear least squares. Increasing variability if wetmass with length indicates standard nonlinear least squares may not be entirely appropriate for this data. Such variability at larger lengths may be due to spatial and temporal conditions or physiological behavior (Nahdi et al., 2016). The generalized least squares fit accounted for this heteroscedasticity and captured the nonlinear relationship between length and wetmass measurements. This explains the small deviations between the fit reported here and that of Cox et al. (2022).
Fitting linear mixed effects models to the log transformed data offers an alternative technique to determining a survey-specific power law length-wetmass relationships on a broad spatial scale. Trawl stations incorporated as a random effect would represent the trawl variability and spatial heterogeneity in length-wetmass relationships across the survey area. Noting also that linear mixed effects models will require manual correction of biases associated with log transforming data (Brodziak, 2012).
Nonparametric bootstraps are less robust when data contain a small number of strongly influential observations, which may be under- or over-represented in individual bootstrap samples (Efron, 2012). For net sample data containing trawls with highly variable total krill counts, Bayesian bootstrap procedures (Rubin, 1981) may be considered. The Bayesian bootstrap draws bootstrap samples by up-weighting or down-weighting observations, but no observation is ever entirely excluded from the sample and is therefore more robust to strongly influential observations.
4.2 Sampling variability on conversion factors
Because conversion factors are weighted by the length-frequency distribution, net sampling techniques which bias krill size will influence subsequent biomass calculations (Krag et al., 2014). Heterogeneity and sorting mechanisms in krill length, sex and stage have been observed amongst swarms, wherein swarms comprise a narrow array of total lengths (Watkins et al., 1992; Watkins, 1986; Watkins et al., 1990; Ricketts et al., 1992). While systematic sampling of pre-defined routine trawl stations reduces bias associated with swarm-sorting behaviors, net samples for biomass estimates are often collected from target trawls, especially when considering non-scientific surveys performed by fisheries vessels. Responsive target trawls sample densely aggregating swarms, whereas routine trawls may sample dispersed individuals or scattering layers. Such variability is akin to target classification methods using image cluster analysis such as the SHAPES algorithm (Coetzee, 2000) which identify schooling or swarming targets, compared to more generalized ‘dB-differencing’ techniques (Korneliussen, 2018). Although the two net sampling strategies produced variable length frequency distributions, differences were not apparent in conversion factors and mean biomass estimates from routine and target trawling in this study. However, the variability of krill biomass introduced by differing trawl methods and target classification techniques should be assessed across a wider collection of surveys in the future.
Measurements from approximately 100 krill across 3 – 80 sampling events (net hauls) have been suggested to represent the local population, with emphasis on maintaining a synoptic acoustic survey (Watkins et al., 1990). Additionally, seasonal variability may influence length-wetmass relationships. For example, gravid females in summer have been observed as smaller in total length than spent females (Watkins et al., 1992), which will bias a power law length-wetmass relationship that does not explicitly account for gravid krill. The application of this method is therefore dependent on collection of spatially and seasonally representative length-frequency datasets.
Uncertainty in per-length biomass estimates here are derived from variability in the length-wetmass relationship and length frequency distribution of krill collected through net sampling, yet other sources of variability may also influence biomass estimates. Krill total length is a key parameter in krill target strength models (Greene et al., 1991), however acoustic material properties, shape and orientation within the acoustic beam influence these estimates (Demer and Conti, 2005, Lawson et al., 2006; Bairstow et al., 2021). Conversion factors have demonstrated sensitivity to variability in target strength, specifically from orientation (Bairstow et al., 2021; Bairstow et al., 2022). Furthermore, net sampling has reduced spatial coverage compared to acoustic data. Geostatistical conditional simulations, whereby sA mean and standard deviation is determined through kriging, offer an opportunity to incorporate the spatial distribution of krill at the scale of an echo integration interval (Gastauer et al., 2017; Bairstow et al., 2022). Combining both the spatial variability of krill and variability in conversion factors (through target strength and net sampling) will further refine measures of uncertainty in per-length biomass estimates.
4.3 Applications and limitations
To our knowledge this is the first time krill biomass has been presented as estimates on a per-length class basis with associated estimates of uncertainty. Estimating biomass by length represents a valuable opportunity to model size-specific processes and how these relationships are expected to change under future environmental pressures. Importantly, this statistical approach provides a means of constraining size spectra model outputs by incorporating uncertainty from net sampling into biomass estimates. At the spatial scale of the krill biomass surveys this method could refine ecosystem model outputs to the same scale e.g., 100,000 km2 - >1 million km2 (Meyer et al., 2020; Krafft et al., 2021; Cox et al., 2022).
Biomass by size also allows valuable predictions of biogeochemical mechanisms such as carbon export and micronutrient recycling through krill life cycles and movement due to lateral advection (Veytia et al., 2021) and vertical migration (Schmidt et al., 2011). For example, the volume of nutrient-rich sinking fecal pellets (Pauli et al., 2021, Smith et al., submitted) and size of exoskeletal moults (Cavan et al., 2019) is dependent on krill size, therefore driving the concentration of nutrients and carbon released into seawater. The approaches used in this study, may provide population-level data towards models which explore the influence of krill on their environment.
The prevalence of small krill lengths may indicate the presence of juvenile krill (Fielding et al., 2014); this data is often used to infer krill recruitment success, fisheries stock dynamics and to identify key reproductive grounds (Kinzey et al., 2013, De la Mare, 1994; Hill et al., 2016). Although, caution should be exercised when differentiating sex and stage using size (as demonstrated by overlap in Figure 2), as metabolic processes such as regression or starvation may lead adults to shrink (Tarling et al., 2016).
Future surveys wishing to apply this technique should ensure their data is sufficient to represent length-frequency distributions across the entire survey area and minimize bias introduced by spatial variability and swarm size-sorting. Wetmass may be estimated from length data following relationships described by Morris et al. (1998) or Hewitt et al. (2004). However, where possible, studies should strive to obtain in situ measurements of wetmass and derive their own survey-specific relationships. Under these conditions, per-length biomass estimates, and associated reliability may be determined for past and future acoustic surveys.
5 Conclusion
This research presents a method to calculate conversion factors (and therefore biomass) for krill on a per-length basis with 95% confidence based on non-parametric bootstrapping and predictions of wetmass from net samples. The technique uses nonlinear generalized least squares to fit a length-wetmass relationship, from which a conversion factor may be estimated for each length. The methods presented here may be used on existing or future acoustic surveys with net data to quantify the reliability of sub-populations biomass estimates, providing empirical data to ecosystem/size spectrum models and helping inform management of the krill fishery.
Data availability statement
Publicly available datasets were analyzed in this study. This data can be found here: https://data.aad.gov.au/metadata/AAS_4512_TEMPO_bioacoustics.
Author contributions
AS, SW, and MC contributed to the conception and design of the study. SW performed statistical analysis. AS drafted the original manuscript. All authors contributed to the article and approved the submitted version.
Funding
Australian Antarctic Program Partnership (AAPP) ASCI000002, The Pew Charitable Trust (ID 00034287), Antarctic Science Foundation (ASF) T1F:115595.
Acknowledgments
We are grateful to the captain and crew of the RV Investigator and the Marine National Facility for making this research possible. We thank TEMPO voyage Chief Scientists So Kawaguchi and Rob King, and scientists Jess Melvin, Maddie Brasier, Olivia Johnson, Christine Weldrick, Alicia Burns, Dale Maschette and Gavin Macaulay for collecting this data. This project received grant funding from the Australian Government as part of the Antarctic Science Collaboration Initiative program.
Conflict of interest
The authors declare that the research was conducted in the absence of any commercial or financial relationships that could be construed as a potential conflict of interest.
Publisher’s note
All claims expressed in this article are solely those of the authors and do not necessarily represent those of their affiliated organizations, or those of the publisher, the editors and the reviewers. Any product that may be evaluated in this article, or claim that may be made by its manufacturer, is not guaranteed or endorsed by the publisher.
Supplementary material
The Supplementary Material for this article can be found online at: https://www.frontiersin.org/articles/10.3389/fmars.2023.1107567/full#supplementary-material
References
Atkinson A., Siegel V., Pakhomov E. A., Jessopp M. J., Loeb V. (2009). A re-appraisal of the total biomass and annual production of Antarctic krill. Deep Sea Res. Part I: Oceanographic Res. Papers 56, 727–740. doi: 10.1016/j.dsr.2008.12.007
Bairstow F., Gastauer S., Finley L., Edwards T., Brown C. T. A., Kawaguchi S., et al. (2021). Improving the accuracy of krill target strength using a shape catalog. Front. Mar. Sci. 290. doi: 10.3389/fmars.2021.658384
Bairstow F., Wotherspoon S., Brown C. T. A., Kawaguchi S., Edwards T., Cox M. J. (2022). Krill biomass estimation: sampling and measurement variability. Front. Mar. Sci. 9. doi: 10.3389/fmars.2022.903035
Bhattacharya C. G. (1967). A simple method of resolution of a distribution into Gaussian components. Biometrics 23, 115–135. doi: 10.2307/2528285
Blanchard J. L., Heneghan R. F., Everett J. D., Trebilco R., Richardson A. J. (2017). From bacteria to whales: using functional size spectra to model marine ecosystems. Trends Ecol. Evol. 32, 174–186. doi: 10.1016/j.tree.2016.12.003
Brodziak J. K. T. (2012). Fitting length-weight relationships with linear regression using the log-transformed allometric model with bias-correction. Pacific Islands Fish. Sci. 12-03, 1–4. Available at: https://repository.library.noaa.gov/view/noaa/4222
Bryndum-Buchholz A., Tittensor D. P., Blanchard J. L., Cheung W. W. L., Coll M., Galbraith E. D., et al. (2019). Twenty-first-century climate change impacts on marine animal biomass and ecosystem structure across ocean basins. Global Change Biol. 25, 459–472. doi: 10.1111/gcb.14512
Calise L., Skaret G. (2011). Sensitivity investigation of the SDWBA Antarctic krill target strength model to fatness, material contrasts and orientation. CCAMLR Sci. 18, 97–122.
Cavan E. L., Belcher A., Atkinson A., Hill S. L., Kawaguchi S., McCormack S., et al. (2019). The importance of antarctic krill in biogeochemical cycles. Nat. Commun. 10, 4742. doi: 10.1038/s41467-019-12668-7
CCAMLR (2017). Report of the thirty-sixth meeting of the scientific committee (SC-CAMLR-XXXVI). report no.: SC-CAMLR-XXXVI/06 (Hobart, Australia: CCAMLR). Available at: https://www.ccamlr.org/en/sc-camlrxxxvi.
CCAMLR (2019). Report of the thirty-eighth meeting of the scientific committee (SC-CAMLR-38) (Hobart, Australia: CCAMLR).
Clarke A., Morris D. J. (1983). Towards an energy budget for krill: The physiology and biochemistry of euphausia superba dana. Polar Biol. 2, 69–86. doi: 10.1007/BF00303172
Coetzee J. (2000). Use of a shoal analysis and patch estimation system (SHAPES) to characterise sardine schools. Aquat. Living Resour. 13, 1–10. doi: 10.1016/S0990-7440(00)00139-X
Constable A., de la Mare W. (1996). A generalised model for evaluating yield and the long-term status of fish stocks under conditions of uncertainty. CCAMLR Sci. 3, 31–54.
Cox M. J., Macaulay G., Brasier M. J., Burns A., Johnson O. J., King R., et al. (2022). Two scales of distribution and biomass of Antarctic krill (Euphausia superba) in the eastern sector of the CCAMLR division 58.4.2 (55°E to 80°E). PloS One 17, e0271078. doi: 10.1371/journal.pone.0271078
Cutter G. R., Reiss C. S., Nylund S., Watters G. M. (2022). Antarctic Krill biomass and flux measured using wideband echosounders and acoustic Doppler current profilers on submerged moorings. Front. Mar. Sci. 9. doi: 10.3389/fmars.2022.784469
Demer D. A., Conti S. G. (2005). New target-strength model indicates more krill in the southern ocean. ICES J. Mar. Sci. 62, 25–32. doi: 10.1016/j.icesjms.2004.07.027
Efron B. (2012). Bayesian Inference and the parametric bootstrap. Ann. Appl. Stat 6, 1971. doi: 10.1214/12-AOAS571
Fielding S., Watkins J. L., Trathan P. N., Enderlein P., Waluda C. M., Stowasser G., et al. (2014). Interannual variability in antarctic krill (Euphausia superba) density at south georgia, southern ocean: 1997–2013. ICES J. Mar. Sci. 71, 2578–2588. doi: 10.1093/icesjms/fsu104
Galaiduk R., Radford B. T., Harvey E. S. (2018). Utilizing individual fish biomass and relative abundance models to map environmental niche associations of adult and juvenile targeted fishes. Sci. Rep. 8, 9457. doi: 10.1038/s41598-018-27774-7
Gastauer S., Scoulding B., Parsons M. (2017). Towards acoustic monitoring of a mixed demersal fishery based on commercial data: the case of the northern demersal scalefish fishery (Western Australia). Fisheries Res. 195, 91–104. doi: 10.1016/j.fishres.2017.07.008
Greene C. H., Stanton T. K., Wiebe P. H., McClatchie S. A. M. (1991). Acoustic estimates of Antarctic krill. Nature 349, 110–110. doi: 10.1038/349110a0
Han I., Oh W., La H. S., Choi S.-G., Kang S., Yoon E., et al. (2020). Verification of the backscattering strength based on the swimming behavior of Antarctic krill. Ocean Sci. J. 55, 391–403. doi: 10.1007/s12601-020-0031-9
Hewitt R. P., Watkins J., Naganobu M., Sushin V., Brierley A. S., Demer D., et al. (2004). Biomass of Antarctic krill in the Scotia Sea in January/February 2000 and its use in revising an estimate of precautionary yield. Deep Sea Res. Part II: Topical Stud. Oceanogr. 51, 1215–1236. doi: 10.1016/S0967-0645(04)00076-1
Hill S. L., Atkinson A., Darby C., Fielding S., Krafft B. A., Godø O. R., et al. (2016). Is current management of the Antarctic krill fishery in the Atlantic sector of the southern ocean precautionary? CCAMLR Sci. 23, 31–51.
Jolly G. M., Hampton I. (1990). A stratified random transect design for acoustic surveys of fish stocks. Can. J. Fisheries Aquat. Sci. 47, 1282–1291. doi: 10.1139/f90-147
Kawaguchi S., Ishida A., King R., Raymond B., Waller N., Constable A., et al. (2013). Risk maps for Antarctic krill under projected southern ocean acidification. Nat. Climate Change 3, 843–847. doi: 10.1038/nclimate1937
Kawaguchi S., Kurihara H., King R., Hale L., Berli T., Robinson J. P., et al. (2011). Will krill fare well under southern ocean acidification? Biol. Lett. 7, 288–291. doi: 10.1098/rsbl.2010.0777
Kinzey D., Watters G. (2013). Effects of recruitment variability and natural mortality on generalised yield model projections and the CCAMLR decision rules for antarctic krill. CCAMLR Sci. 20, 81–96.
Krafft B. A., Macaulay G. J., Skaret G., Knutsen T., Bergstad O. A., Lowther A., et al. (2021). Standing stock of Antarctic krill (Euphausia superba Dana 1850) (Euphausiacea) in the southwest Atlantic sector of the southern ocean 2018–19. J. Crustacean Biol. 41, ruab046. doi: 10.1093/jcbiol/ruab071
Krag L. A., Herrmann B., Iversen S. A., Engås A., Nordrum S., Krafft B. A. (2014). Size selection of Antarctic krill (Euphausia superba) in trawls. PloS One 9, e102168. doi: 10.1371/journal.pone.0102168
Korneliussen R. J. (2018). “Acoustic target classification,” in ICES cooperative research report no. 344, vol. 104. doi: 10.17895/ices.pub.4567
Larkin P. A. (1978). Fisheries management - an essay for ecologists. Annu. Rev. Ecol. systematics 9, 57–73. doi: 10.1146/annurev.es.09.110178.000421
Lawson G. L., Wiebe P. H., Ashjian C. J., Chu D., Stanton T. K. (2006). Improved parametrization of Antarctic krill target strength models. J. Acoustical Soc. America 119, 232–242. doi: 10.1121/1.2141229
Lotze H. K., Tittensor D. P., Bryndum-Buchholz A., Eddy T. D., Cheung W. W. L., Galbraith E. D., et al. (2019). Global ensemble projections reveal trophic amplification of ocean biomass declines with climate change. Proc. Natl. Acad. Sci. 116, 12907–12912. doi: 10.1073/pnas.1900194116
Maclennan D. N., Fernandes P. G., Dalen J. (2002). A consistent approach to definitions and symbols in fisheries acoustics. ICES J. Mar. Sci. 59, 365–369. doi: 10.1006/jmsc.2001.1158
Meyer B., Atkinson A., Bernard K. S., Brierley A. S., Driscoll R., Hill S. L., et al. (2020). Successful ecosystem-based management of Antarctic krill should address uncertainties in krill recruitment, behaviour and ecological adaptation. Commun. Earth Environ. 1, 28. doi: 10.1038/s43247-020-00026-1
Moline M. A., Claustre H., Frazer T. K., Schofield O., Vernet M. (2004). Alteration of the food web along the Antarctic peninsula in response to a regional warming trend. Global Change Biol. 10, 1973–1980. doi: 10.1111/j.1365-2486.2004.00825.x
Morris D., Watkins J. L., Ricketts C., Buchholz F., Priddle J. (1988). An assessment of the merits of length and weight measurements of antarctic krill euphausia superba. Br. Antarctic Survey Bull., 27–50.
Nahdi A. A. L., Garcia de Leaniz C., King A. J. (2016). Spatio-temporal variation in length-weight relationships and condition of the ribbonfish Trichiurus lepturus (Linnaeus 1758): implications for fisheries management. PloS One 11, e0161989. doi: 10.1371/journal.pone.0161989
Pauli N.-C., Flintrop C. M., Konrad C., Pakhomov E. A., Swoboda S., Koch F., et al. (2021). Krill and salp fecal pellets contribute equally to the carbon flux at the Antarctic peninsula. Nat. Commun. 12, 7168. doi: 10.1038/s41467-021-27436-9
Pinheiro J., Bates D. (2000). Mixed-Effects Models in S and S-PLUS (New York: Springer). doi: 10.1007/b98882
Pinheiro J., Bates D. (2023). Nlme: linear and nonlinear mixed effects models. R package version 3.1-162, https://CRAN.R-project.org/package=nlme
Ratnarajah L. (2021). Regenerated iron: how important are different zooplankton groups to oceanic productivity? Curr. Biol. 31, R848–R850. doi: 10.1016/j.cub.2021.05.016
Reid K., Croxall J. P. (2001). Environmental response of upper trophic-level predators reveals a system change in an Antarctic marine ecosystem. Proc. R. Soc. London. Ser. B: Biol. Sci. 268, 377–384. doi: 10.1098/rspb.2000.1371
Ricketts C., Watkins J. L., Priddle J., Morris D. J., Buchholz F. (1992). An assessment of the biological and acoustic characteristics of swarms of Antarctic krill. Deep Sea Res. Part A. Oceanographic Res. Papers 39, 359–371. doi: 10.1016/0198-0149(92)90113-8
Roe H. S. J., Shale D. M. (1979). A new multiple rectangular midwater trawl (RMT 1 + 8M) and some modifications to the institute of oceanographic sciences’ RMT 1 + 8. Mar. Biol. 50, 283–288. doi: 10.1007/BF00394210
Schaafsma F. L., David C. L., Kohlbach D., Ehrlich J., Castellani G., Lange B. A., et al. (2022). Allometric relationships of ecologically important Antarctic and Arctic zooplankton and fish species. Polar Biol. 45, 203–224. doi: 10.1007/s00300-021-02984-4
Schaafsma F. L., David C., Pakhomov E. A., Hunt B. P. V., Lange B. A., Flores H., et al. (2016). Size and stage composition of age class 0 Antarctic krill (Euphausia superba) in the ice–water interface layer during winter/early spring. Polar Biol. 39, 1515–1526. doi: 10.1007/s00300-015-1877-7
Schmidt K., Atkinson A., Steigenberger S., Fielding S., Lindsay M. C., Pond D. W., et al. (2011). Seabed foraging by Antarctic krill: implications for stock assessment, bentho-pelagic coupling, and the vertical transfer of iron. Limnology Oceanogr. 56, 1411–1428. doi: 10.4319/lo.2011.56.4.1411
Siegel V. (1987). Age and growth of Antarctic euphausiacea (Crustacea) under natural conditions. Mar. Biol. 96, 483–495. doi: 10.1007/BF00397966
Tarling G. A., Hill S., Peat H., Fielding S., Reiss C., Atkinson A. (2016). Growth and shrinkage in Antarctic krill Euphausia superba is sex-dependent. Mar. Ecol. Prog. Ser. 547, 61–78. doi: 10.3354/meps11634
Tibshirani R. J., Efron B. (1993). An introduction to the bootstrap. Monogr. Stat Appl. probability 57, 1–436. doi: 10.1201/9780429246593
Veytia D., Bestley S., Kawaguchi S., Meiners K. M., Murphy E. J., Fraser A. D., et al. (2021). Overwinter sea-ice characteristics important for antarctic krill recruitment in the southwest atlantic. Ecol. Indic. 129, 107934. doi: 10.1016/j.ecolind.2021.107934
Watkins J. L. (1986). Variations in the size of antarctic krill, euphausia superba dana, in small swarms. Mar. Ecol. Prog. Ser. 31, 67–73. doi: 10.3354/meps031067
Watkins J. L., Buccholz F., Priddle J., Morris D. J., Ricketts C. (1992). Variation in reproductive status of Antarctic krill swarms; evidence for a size-related sorting mechanism? Mar. Ecol. Prog. Ser. 82, 163–174. doi: 10.3354/meps082163
Watkins J. L., Morris D. J., Ricketts C., Murray A. W. A. (1990). Sampling biological characteristics of krill: effect of heterogeneous nature of swarms. Mar. Biol. 107, 409–415. doi: 10.1007/BF01313422
Keywords: conversion factor, length-wetmass relationship, length-frequency, size distribution, net sampling
Citation: Smith AJR, Wotherspoon SJ and Cox MJ (2023) Per-length biomass estimates of Antarctic krill (Euphausia superba). Front. Mar. Sci. 10:1107567. doi: 10.3389/fmars.2023.1107567
Received: 25 November 2022; Accepted: 16 May 2023;
Published: 31 May 2023.
Edited by:
Kerrie M. Swadling, University of Tasmania, AustraliaReviewed by:
Robert McCauley, Curtin University, AustraliaDoug Kinzey, National Oceanic and Atmospheric Administration, United States
Copyright © 2023 Smith, Wotherspoon and Cox. This is an open-access article distributed under the terms of the Creative Commons Attribution License (CC BY). The use, distribution or reproduction in other forums is permitted, provided the original author(s) and the copyright owner(s) are credited and that the original publication in this journal is cited, in accordance with accepted academic practice. No use, distribution or reproduction is permitted which does not comply with these terms.
*Correspondence: Abigail J. R. Smith, Abigail.Smith@utas.edu.au