the Creative Commons Attribution 4.0 License.
the Creative Commons Attribution 4.0 License.
 | 31 May 2023
Quantifying greenhouse gas emissions from wood fuel use by households
Alessandro Flammini
Hanif Adzmir
Kevin Karl
Francesco Nicola Tubiello
The combustion of wood fuel for residential use is often not considered to be a source of greenhouse gas (GHG) emissions from households, as the emissions from wood fuel combustion can be offset by the CO2 absorbed by the growth of the forest (as a carbon sink) (IPCC, 2006). However, this only applies to wood that is harvested in a renewable way, i.e. at a rate not exceeding the regrowth rate of the forest from which it was harvested (Drigo et al., 2002). This paper estimates the share of GHG emissions attributable to non-renewable wood fuel harvesting for use in residential food activities, by country and with global coverage. It adds to a growing research base estimating GHG emissions from across the entire agri-food value chain, from the manufacture of farm inputs, through food supply chains, and finally to waste disposal (Tubiello et al., 2021). Country-level information is generated from United Nations Statistics Division (UNSD) and International Energy Agency (IEA) data on wood fuel use by households. We find that, in 2019, annual emissions from non-renewable wood fuel consumed for household food preparation were about 745×106 t (Mt CO2 eq. yr−1), with an uncertainty ranging from −63 % to +64 %. Overall, global trends were a result of counterbalancing effects: the emission increases were largely fuelled by countries in sub-Saharan Africa, southern Asia, and Latin America, whereas significant decreases were seen in countries in eastern Asia and South-East Asia. The Food and Agriculture Organization of the United Nations (FAO) has developed and regularly maintains a database covering GHG emissions from the various components of the agri-food sector, including pre- and post-production activities, by country and world regions. The dataset has been developed according to the International Panel on Climate Change guidelines (IPCC, 2006), which avoid overlaps between agriculture, forestry, and other land use (AFOLU) and energy components. The aforementioned dataset relies mainly on UNSD Energy Statistics data, which are used as activity data for the calculation of the GHG emissions (Tubiello et al., 2022). The information used in this work is available as open data at https://doi.org/10.5281/zenodo.7310932 (Flammini et al., 2022a).
- Article
(611 KB) - Full-text XML
- BibTeX
- EndNote


In 2019, about 27 % of the global population relied on traditional biomass (e.g. wood, crop residues, and animal dung) to meet household energy needs (IEA, 2020). The dependence on wood fuel is greatest in developing countries, where it provides about one-third of total energy and is commonly used for cooking and residential heating (FAO, 2010). Approximately 70 % of households in sub-Saharan Africa depend on wood-based biomass as their primary cooking fuel; that figure is roughly 44 % in South-East Asia (World Bank, 2011).
Wood fuel for domestic purposes is obtained from many supply sources, not only from forestlands. These sources include trees outside forests (e.g. scrubs, bush fallow, dead wood, dry branches, and twigs), trees planted with agricultural crops (e.g. agroforestry or forest plantations), residues of wood harvesting, by-products of land cover change, and salvage harvesting (FAO, 2010). Several studies have examined the impact of wood fuel use by households on deforestation and human health. For the former, extensive research was conducted as a response to the 1970s and 1980s “fuelwood crisis”, and the conclusion was reached that the harvesting of fuelwood for energy is not the primary source of forest depletion (Arnold et al., 2006; Dewees, 1989; World Bank, 2011).
In terms of the impact on human health, around 3.2 million premature deaths are caused due to the inhalation of polluted air in households, stemming mainly from the traditional use of biomass for heating and cooking. The pollution comes in the form of small particles that are absorbed into the lungs and enter the bloodstream. Air is considered polluted when the mean concentration of particulate matter (PM10 and PM2.5) and other combustion-derived indoor pollutants such as carbon monoxide are beyond the World Health Organization (WHO) air quality guideline values (WHO, 2014). Another study pointed at an estimation of 3 million deaths per year from indoor air pollution due to open fires and smoky stoves (IEA, 2021; WHO, 2021). However, very few studies have examined the climate impact of wood fuel consumption for residential use, except in the context of carbon offsets for carbon financing (e.g. using improved cookstoves). For example, one report estimated that the global potential for greenhouse gas (GHG) emission reductions due to improved cookstoves (ICS) is estimated at 1 Gt CO2 yr−1 (Lee et al., 2013).
This paper strives to quantify the GHG emissions, by country, attributable to the consumption of wood fuel by household food systems, including cooking, kitchen appliances, and food refrigeration. Previous reports have set the CO2 emissions associated with wood fuel consumption by households to zero, which is in line with the International Panel on Climate Change (IPCC) guidelines (IPCC, 2006). Such emissions are, in fact, covered by the “forestry” and “land use” components of the agriculture, forestry, and other land use (AFOLU) sector, while the limited emissions of CH4 and N2O from wood fuel burning are reported under the energy sector. This is based on two assumptions: (i) the combustion of biomass is considered renewable and has no net CO2 emission impact (the CO2 absorbed by the tree during its growth is equivalent to the amount released during burning or decomposition process) and (ii) all CO2 that is sequestered over the years by trees is released during burning. Therefore, the wood removed by land cover change (net forest conversion) or forestland degradation will eventuate, at some point, into a release of CO2. Following the IPCC approach, it is not possible to single out the amount of CO2 associated with wood fuel burning for cooking at the household level.
In a renewable biomass harvesting scenario, the expectation is that the wood removed will fully regrow. New trees take up the carbon that is produced by combustion, and the carbon balance in the atmosphere remains neutral. On the other hand, woody biomass is non-renewable if its extraction results in a long-term loss of carbon stocks, i.e. if the high extraction rate does not allow time for the biomass to regrow (Drigo et al., 2014). At the same time, to estimate the real emissions associated with wood fuel, it is not possible to simply apply an emission factor to the amount of wood fuel burned, as some part of the wood harvested as wood fuel can be considered sustainable. This is determined if the rate of extraction is at or below the annual regrowth rate.
In FAOSTAT, emissions associated with the “unsustainable” share of wood fuel burned are already covered under emissions from “forestland” (forest degradation) and “net forest conversion” (deforestation); therefore, adding emissions from wood fuel for cooking to the total agri-food emissions would result in double counting.
In this publication, we define wood harvested beyond the sustainable harvest level (i.e. the wood extraction flow that allows wood to regrow) as non-renewable biomass (NRB). Obtaining accurate information about NRB fractions has historically been a challenging exercise (Lee et al., 2013). A milestone approach on the assessment of the fractional NRB was via the use of a spatial model called Woodfuel Integrated Supply/Demand Overview Mapping (WISDOM), which was first applied by the Food and Agriculture Organization of the United Nations (FAO) in Mexico in 2002 (Drigo et al., 2002). Over the years, the WISDOM model has been subsequently applied to other countries and world regions. Bailis et al. (2015) presented the non-renewable biomass fraction (NRBf) by applying an evolution of the WISDOM model to a number of countries across Asia, Africa, and Latin America.
This paper presents a methodology to apply the NRBf to wood fuel consumption for household food preparation, based on data from the United Nations Statistics Division (UNSD) Energy Statistics database. Our methodology does not distinguish between wood fuel emissions associated with the deforestation component and those associated with the degradation component. However, previous research has estimated that emissions from forest degradation were one-fourth of those from deforestation in the period from 2001 to 2010 and that they have increased to one-third in more recent years (2011–2015) (Federici et al., 2015).
In an effort to further expand FAOSTAT work on disseminating data on GHG emissions from agri-food systems at the country level, the results are presented in a manner that is consistent with the FAOSTAT countries and regions. Accounting for GHG emissions across all agri-food system activities will help researchers, policymakers, and businesses uncover novel climate mitigation opportunities through food system interventions.
2.1 Gap filling
The UNSD fuelwood data used herein are gap filled to improve the quality of the available time series and to estimate data for missing countries. Notably, the original UNSD energy dataset had missing data for China for the entire time series, and this gap was filled by complementing it with International Energy Agency (IEA) energy data for primary solid biofuels (defined as any plant matter used directly as fuel or converted into other forms before combustion). The NRBf data were available for most countries in regions such as Africa, Asia, and Latin America. For countries with no data available on their NRBf values, subregional and regional NRBf averages were used and applied accordingly.
2.2 Emission estimates
With respect to the FAO, biofuel is defined as “any fuel produced directly or indirectly from biomass”, whereas wood fuel is described as all types of biofuels derived directly or indirectly from woody biomass (grown on either forested or non-forested land) (FAO, 2004). GHG emissions are calculated according to the IPCC guidelines, at Tier 1 (IPCC, 2006), by applying the following formula:
where E denotes the GHG emissions by gas (g) in a select country or region (i), for a select inventory year (y), in kilotonnes of CO2 equivalent per year (kt CO2 eq. yr−1); A is the volume of wood fuel consumed in the household (activity data) for a select country or territory i, for a select inventory year y, reported in cubic metres (m3); fw is the share of wood fuel used for cooking for a select country y; NRBf is the non-renewable biomass fraction for a select country y, based on FAO WISDOM; and EF is the emission factor of wood fuel, by gas, based on IPCC (2006) default values.
The volume of wood fuel consumed in a household is extracted from the UNSD Energy Statistics database (Flow 1231). Consumption by households is converted to energy by applying a representative calorific value of 11.2 GJ m−3. The calorific value is calculated by multiplying the average heating value of air-dried wood fuel and completely dry wood by its average density (Table 2). This heating value is estimated from the heating value of woods typically used as wood fuel (Table 1), as reported in the IEA Energy Statistics Manual (IEA, 2004). The average density of the wood fuel is estimated by taking the density of woods typically available in tropical countries (FAO, 2007). This assumes that most of the unsustainable wood harvesting for food preparation takes place in pan-tropical countries. Based on the FAO categorization, the regions that have one or more countries designated as pan-tropical are sub-Saharan Africa, southern Asia, eastern Asia, Latin America, South-East Asia, North Africa, and Melanesia. The share of wood fuel used for cooking is set to unity for all tropical countries concerned (Table 3) (i.e. all wood fuel used by households in tropical countries is for cooking); countries with little to no tropical coverage have their cooking shares set to 0.847, and the rest is allocated to heating (Daioglou et al., 2012; Morgan, 2011).
Table 1Typical heating values of woods used as fuelwood.
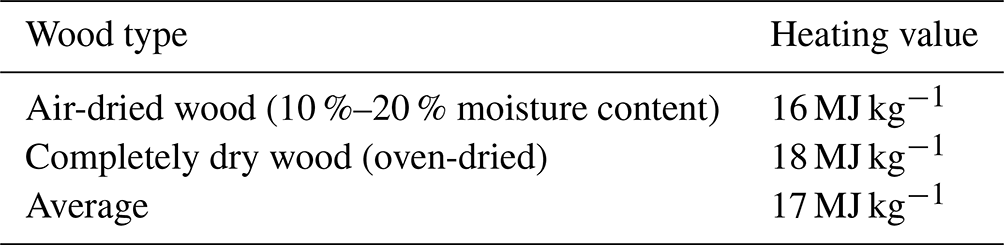
Source: IEA Energy Statistics Manual (IEA, 2004, p. 174).
Table 2Typical densities of woods used as fuelwood.
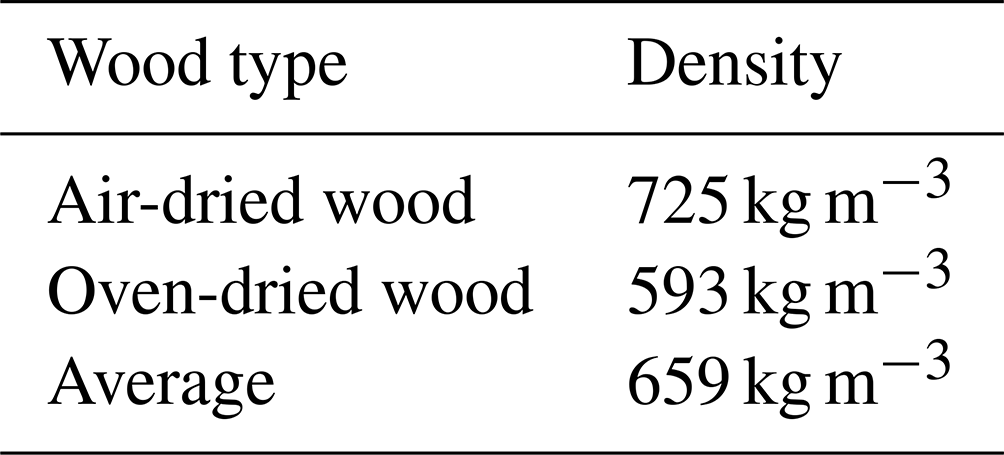
Source: Wood-energy supply/demand scenarios in the context of poverty mapping (FAO, 2007, their Table A2.4).
Table 3List of tropical countries.
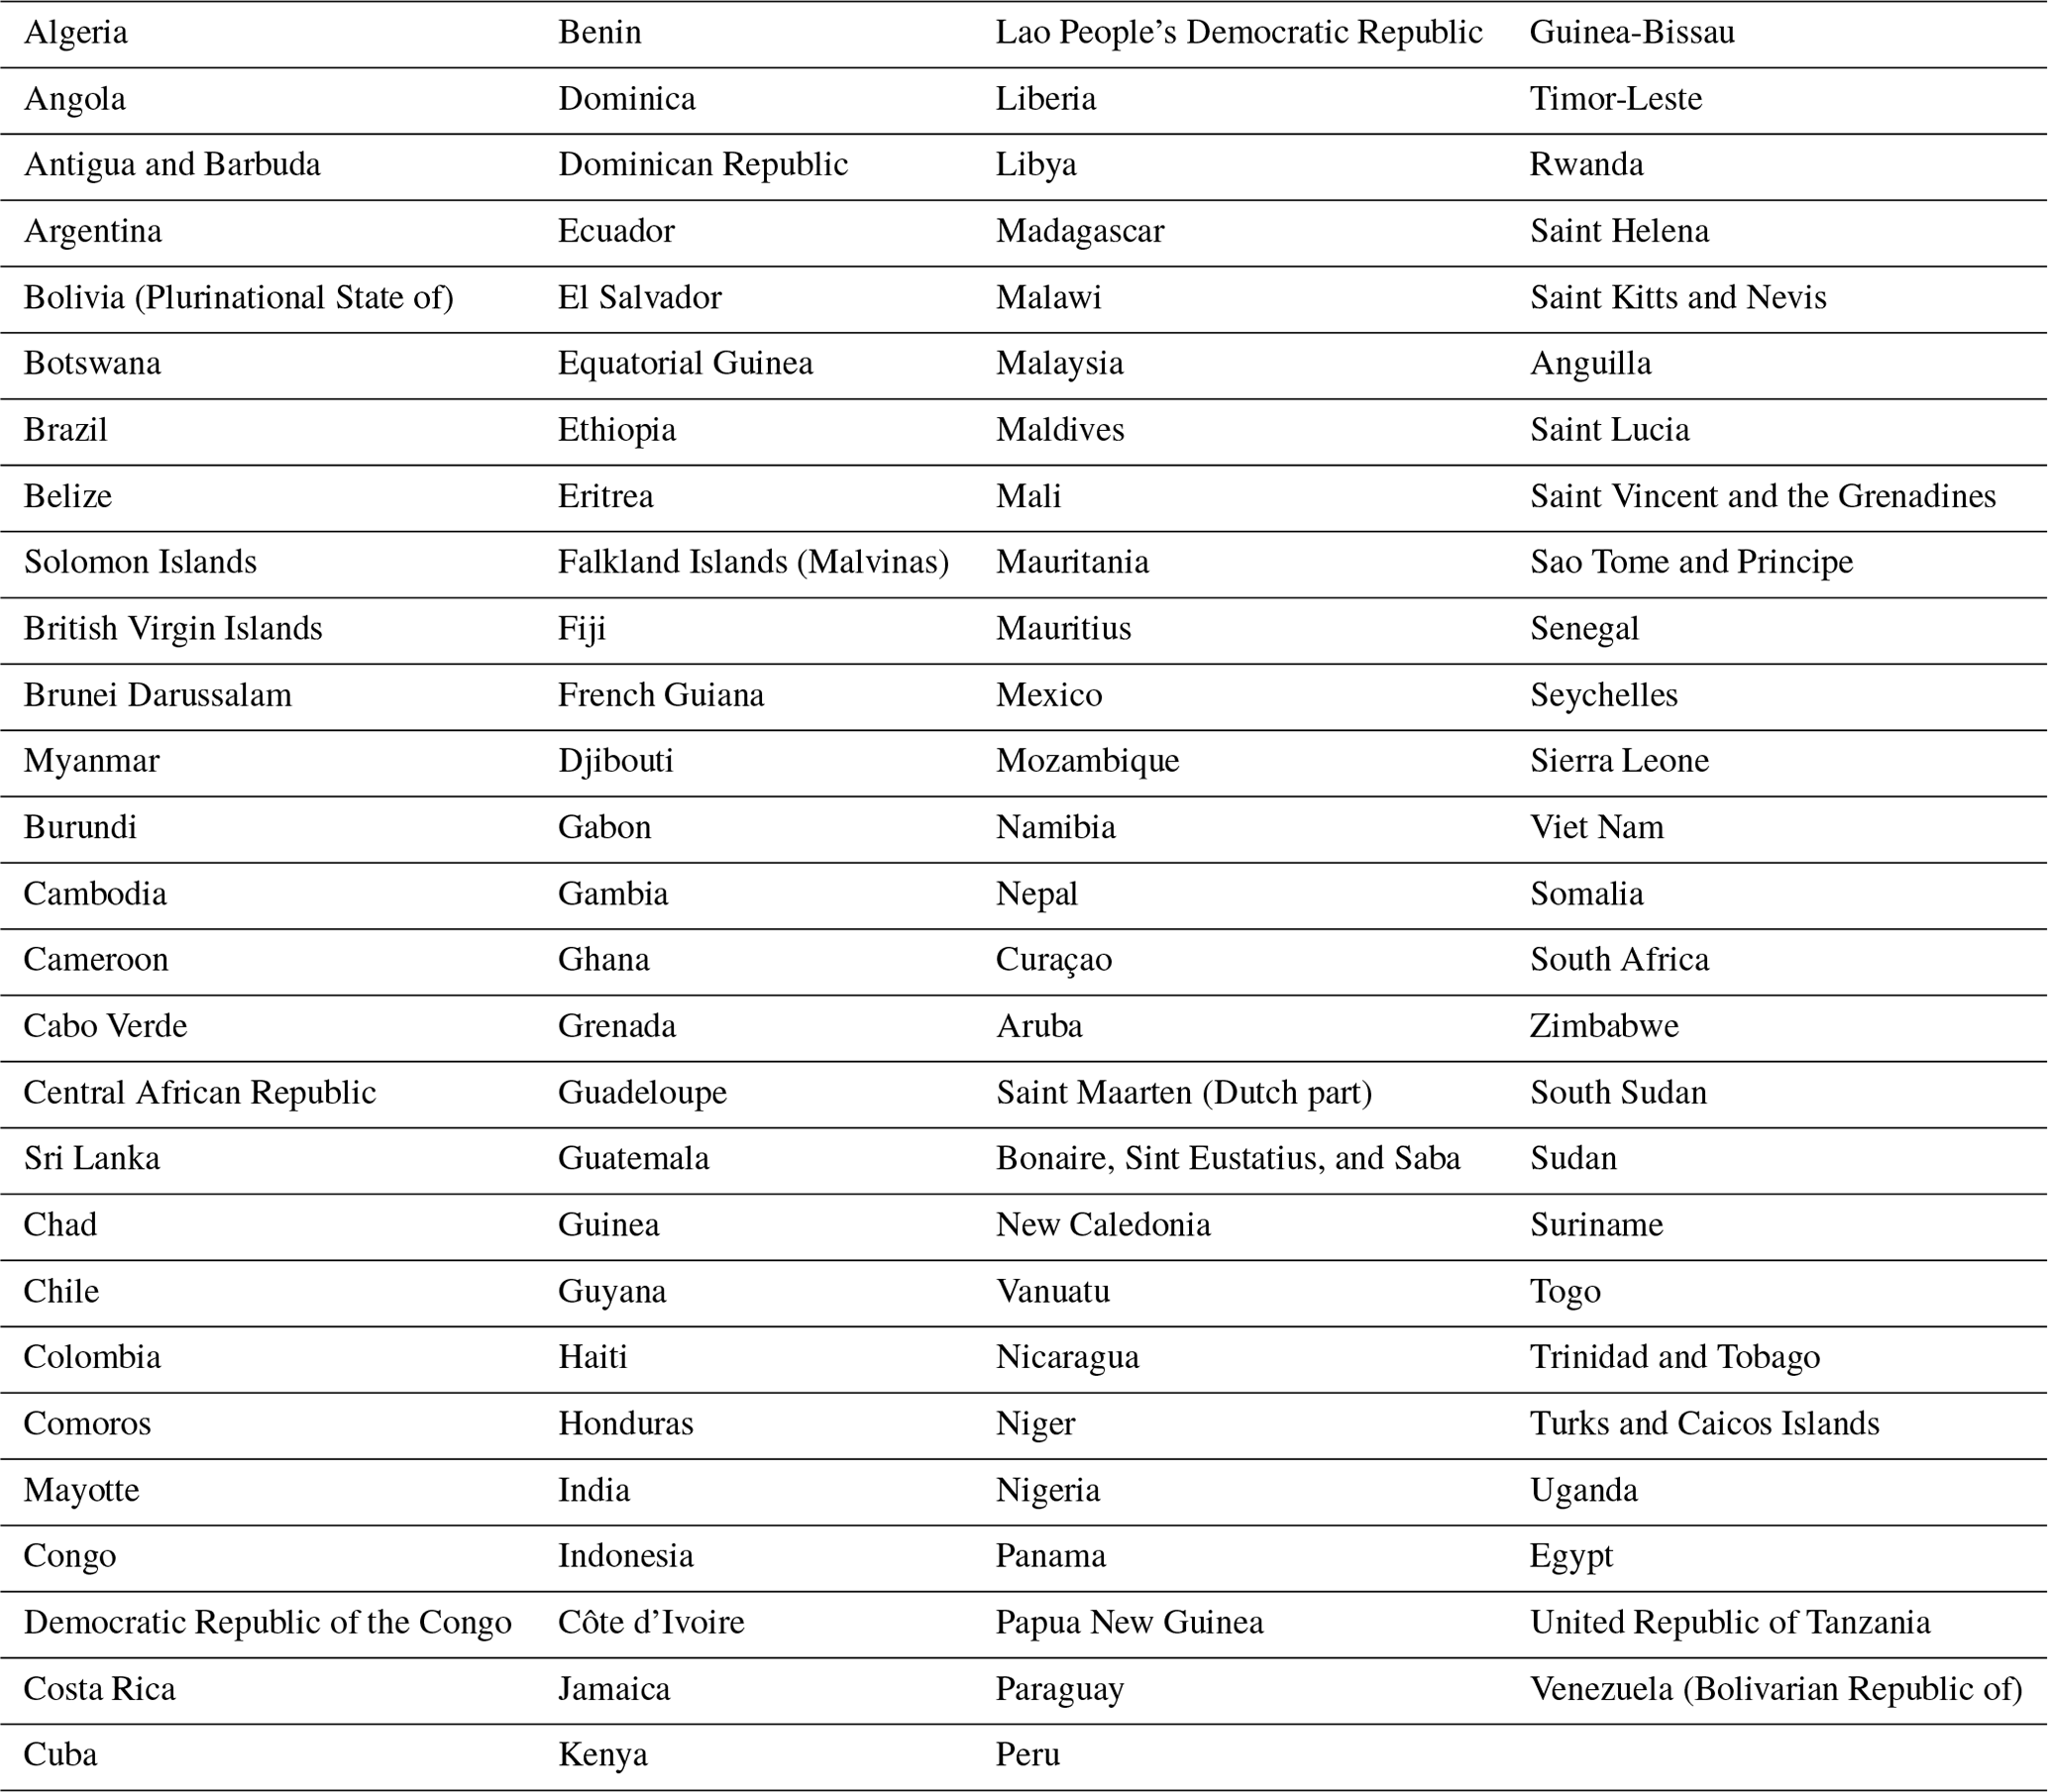
Source: Journal of Tropical Psychology, Volume 1 (Morgan, 2011).
The NRBf is obtained from the “expected” NRBf (for which suboptimal harvesting of wood fuel is assumed). The NRBf referenced is taken from the average of the low-plantation-productivity variant and the high-plantation-productivity variant of NRBB1+ NRBB2. The latter is generated under the assumption that wood fuel users can meet their wood fuel demand using both land cover change by-products and other sources (Bailis et al., 2015). For each country, a single NRBf is assumed for all years reported (Table 4).
Table 4Non-renewable biomass fraction (NRBf) based on country and region.
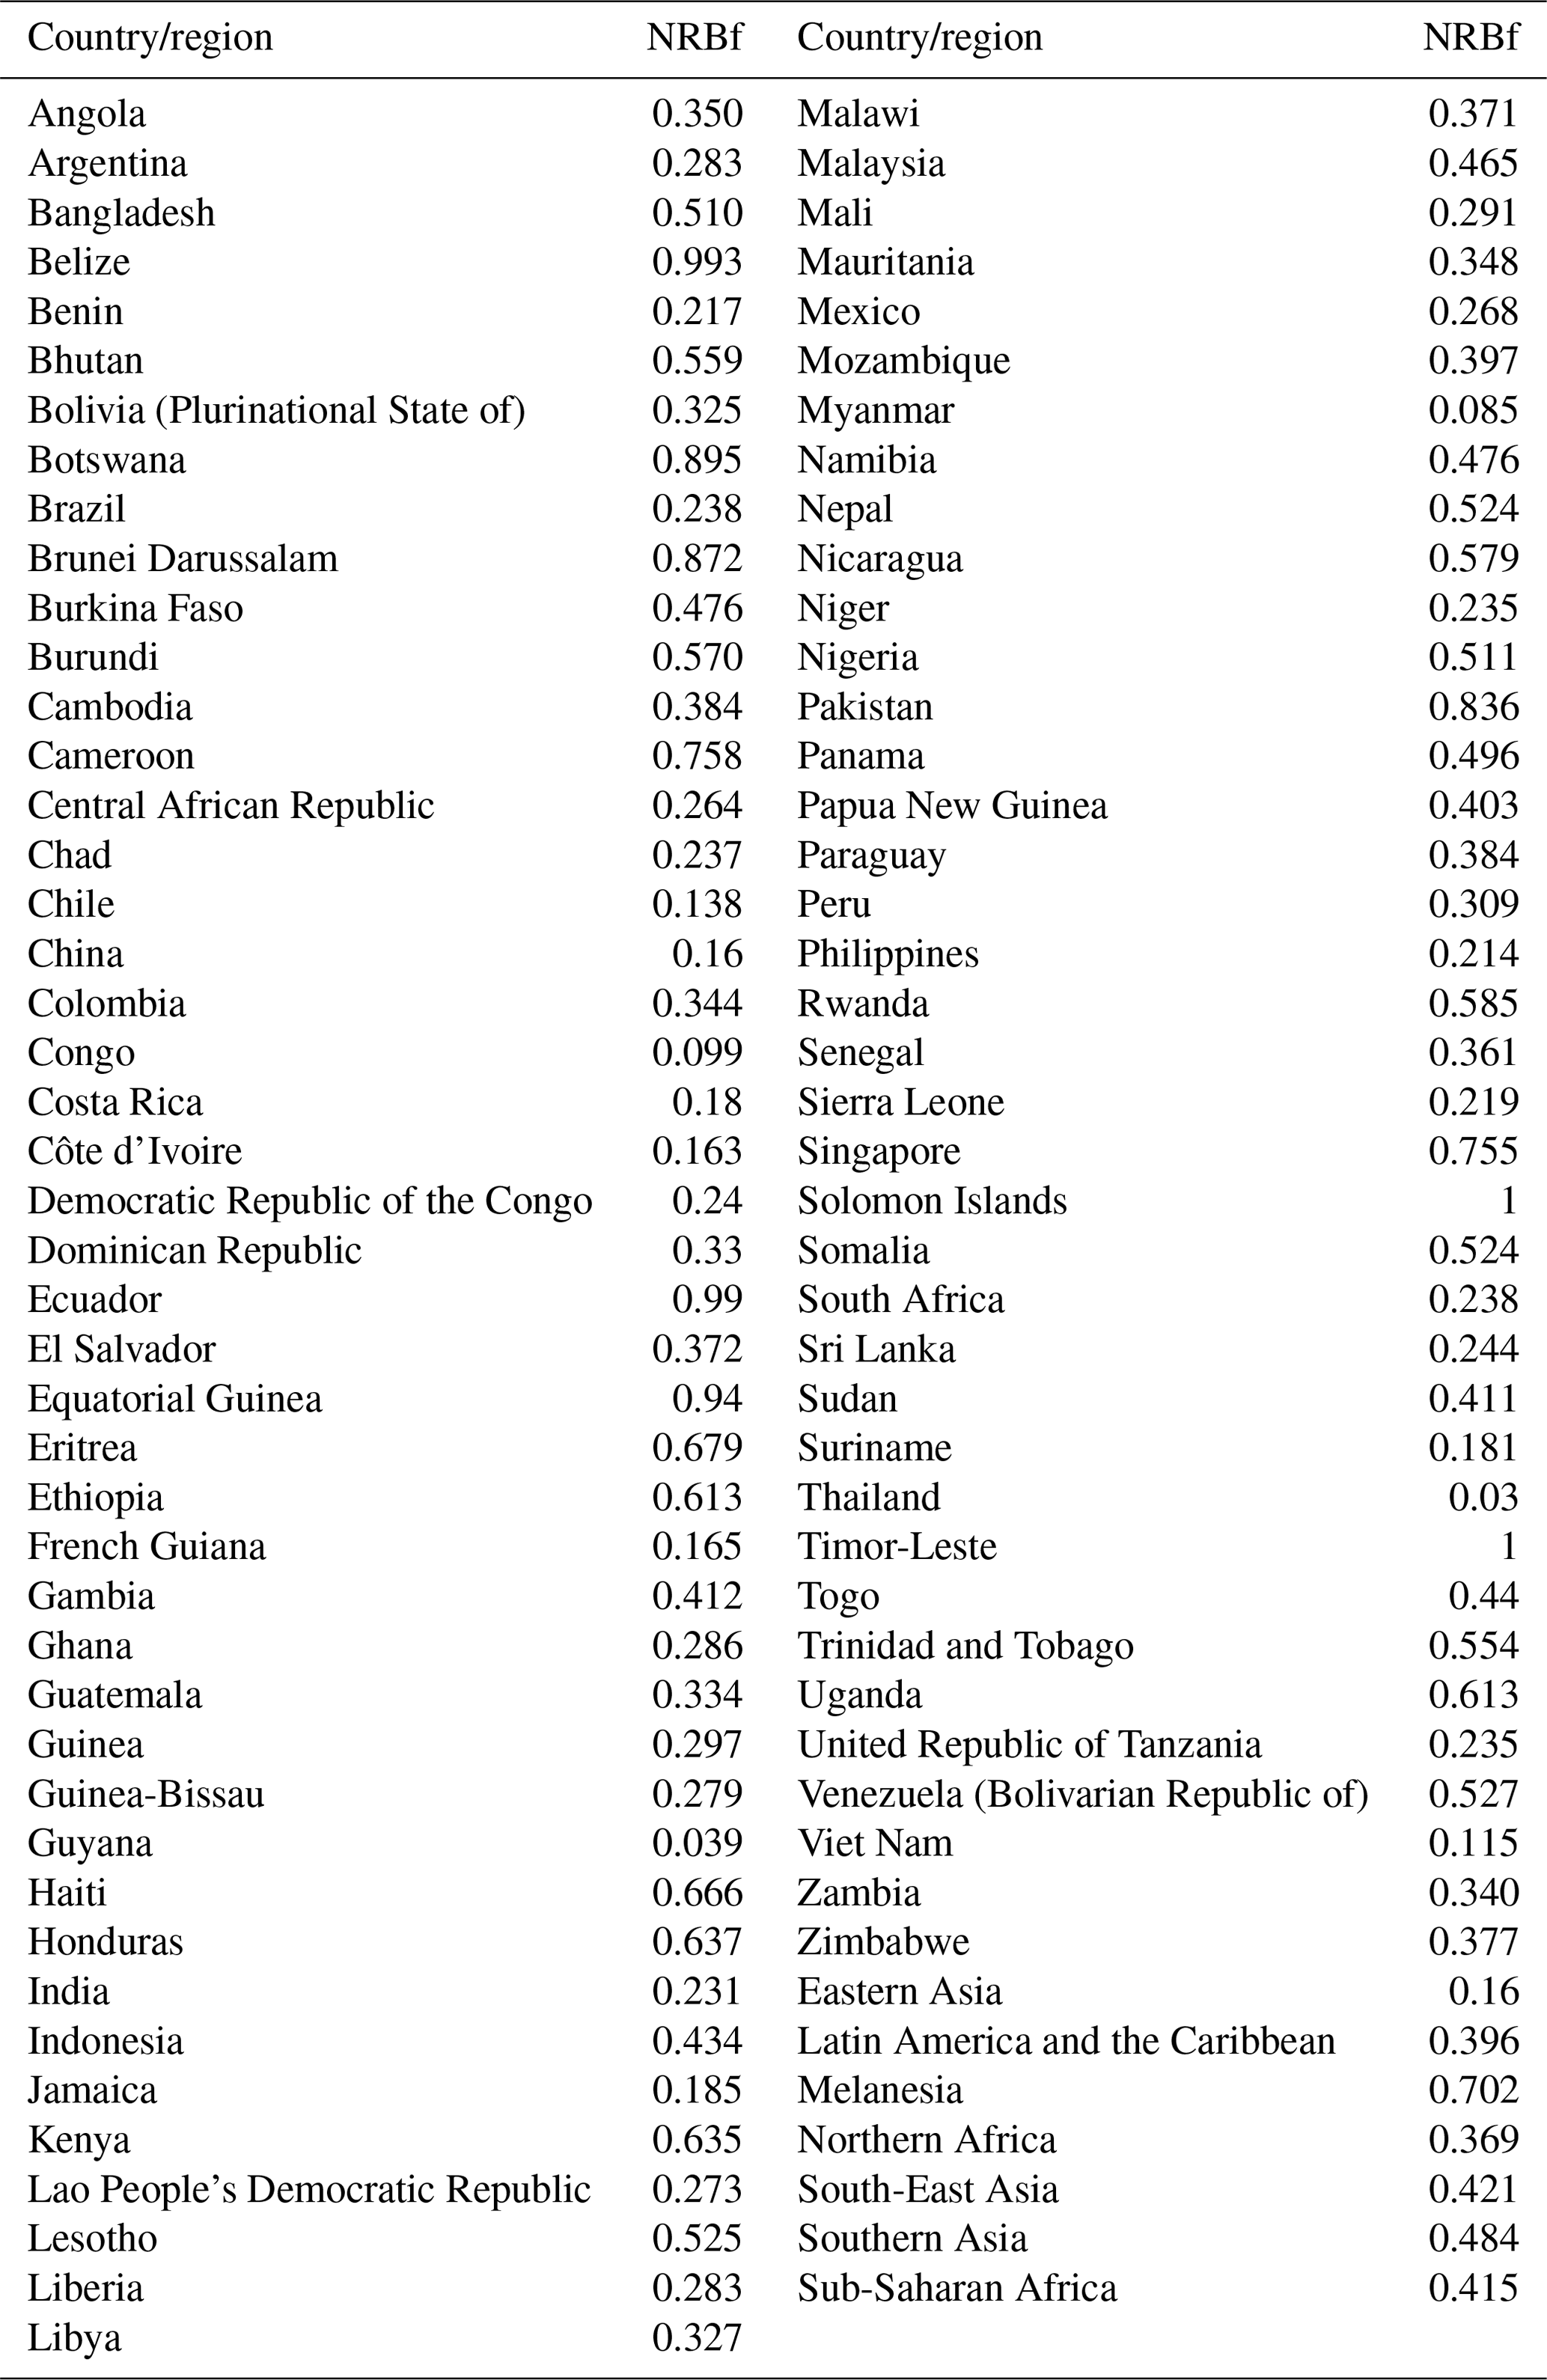
Source: authors' own elaboration.
The calculation was run using R software for all countries and world regions, mapping UNSD to FAOSTAT countries for the application of subregional and regional statistics.
2.3 Data uncertainty and limitations
There are limitations and uncertainties associated with the estimates presented herein. First, we note that, although we assume that all fuelwood in tropical households (and the vast majority in the non-tropical countries and regions concerned) is used for food preparation, the input data refer to fuelwood energy use by households without a further breakdown. Second, the underlying data on energy use have gaps, especially in China and Africa. For countries with no data, these were imputed from the IEA energy database instead. Thirdly, for the underlying NRB fractions, 6 of 90 countries and territories were imputed based on regional averages. The uncertainty in the original wood fuel consumption data is much smaller for some countries than for others, depending on whether the activity data are collected using specific surveys (where a sense of the uncertainty can be measured) or whether national statistical offices use proxies and/or assumptions. In our case, using the level of uncertainty for “biomass in small sources” and “less-developed statistical systems” (such as energy statistics), an uncertainty of ±60 % can be assumed for activity data (IPCC, 2006, Table 2.15). Fourthly, the NRB fractions also possess uncertainty with respect to their temporal bias due to a similar number used for all years attached. Uncertainty in activity data was then combined with uncertainty in fuel emission factors (−15 % to 18 %), computed by taking the IPCC lower and upper values of wood/wood waste emission factors. Uncertainty in the conversion factor is calculated as ±12 %. Lastly, the uncertainty for the NRBf values was computed to be ±1.3 %. The resulting overall uncertainty from the energy statistics and emission factors was obtained by applying the IPCC (IPCC, 2006) default error propagation method, resulting in the range of −63 % to +64 %.
An additional limitation of this methodology is that, although unsustainable wood fuel extraction could be associated with both deforestation and forest degradation, our methodology does not single out the emissions that are attributable to each of them.
Finally, this analysis relies on static information about the NRBf of countries, whereas this fraction can change over time. An assessment of country NRB fractions should be undertaken on a regular basis, in order to obtain more precise and realistic figures of wood fuel use emissions.
The results show that, globally, for the year 2019, the GHG emissions associated with the unsustainable (or non-renewable) fraction of wood fuel used by households were 741 652 kt for CO2, 1987 kt for CH4, and 26.5 kt for N2O. Therefore, the CO2 equivalent emissions were above 0.7 Gt in 2019, 6 % greater than in 1990 (Fig. 1). These emissions can be compared with the total 4.84 Gt CO2 yr−1 from deforestation (4.04 Gt CO2) and forest degradation (0.80 Gt CO2) estimated at the global level by Federici et al. (2015) over the period from 1991 to 2015. This emission value, associated with unsustainable wood fuel use by households, should be added to the 1.3 Gt CO2 eq. yr−1 associated with household food consumption (excluding bioenergy) in the year 2019 reported by FAOSTAT (Tubiello et al., 2022). Therefore, 2×10⁹ Gt CO2 eq. yr−1 is a more precise figure of the emissions associated with human activity at this important step of the agri-food chain.
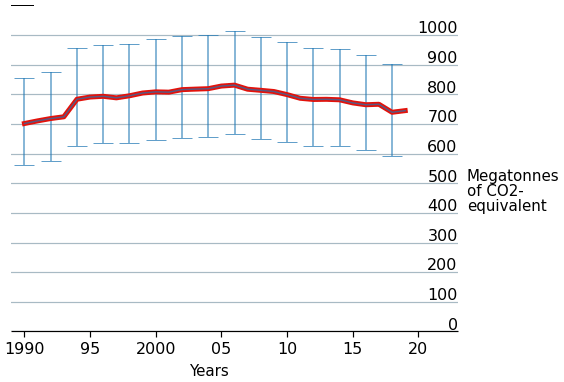
Figure 1Global GHG emissions from non-renewable wood fuel use by households for cooking from 1990 to 2019 (Mt CO2 eq.), including uncertainty ranges (source: authors, based on data from IEA and UNSD, 2022).
The top 10 countries (of the 90 countries covered by the dataset) are responsible for 69 % of the global GHG emissions attributable to wood fuel use for household food systems in 2019. No country from Latin America nor the Caribbean was among the top 10 GHG emitters. However, in terms of GHG emissions per person (based on population data from FAOSTAT), higher values can be seen in African countries: of the 10 top emitters, 5 are from sub-Saharan Africa, 3 are from southern Asia, 1 is from eastern Asia, and 1 is from South-East Asia.
Nigeria and India were the largest emitters in 2019 in absolute terms. It is of note that China saw the biggest reductions in CO2 emissions over the time frame from 1990 to 2019, and China was the highest emitter from 1990 to 2006 (Fig. 2).
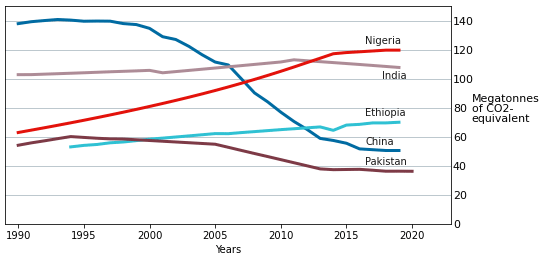
Figure 2GHG emission trends from the top five emitters of 2019 from 1990 to 2019 (Mt CO2 eq.) (source: authors).
Sub-Saharan Africa, South Asia, and eastern Asia were the largest emitters among subregions, although with different trends over the period from 2005 to 2019. Eastern Asia decreased over the whole period, from 138 Mt CO2 eq. yr−1 in 1990 to 135 Mt CO2 eq. yr−1 in 2000 and, further, to 51 Mt CO2 eq. yr−1 in 2019, whereas emissions in sub-Saharan Africa nearly doubled from 202 Mt CO2 eq. yr−1 in 1990 to 379 Mt CO2 eq. yr−1 in 2019. Southern Asia was a significant emission source in 2019 but has increased only slightly (around 3 % over a 19-year period) since 1990, from 197 to 203 Mt CO2 eq. yr−1 in 2019. Emissions increased only by 1 % in Latin America, and South-East Asia decreased by more than 60 % over the same period (Fig. 3).
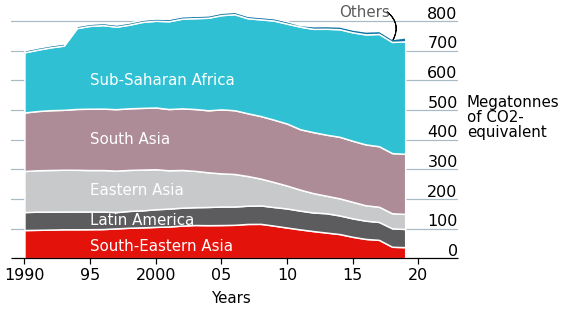
Figure 3Share of global GHG emissions from household wood fuel use in the food sector stratified according to subregion (source: authors).
We also compared estimates of emissions from wood fuel consumption by households for food preparation with the estimates from net forestland conversion in FAOSTAT. As discussed in Sect. 2, the FAO estimates of emissions from net forestland conversion are proxies for deforestation emission data. It is also important to note that there are various sources of wood fuel use for households, as described in Sect. 1, and net forestland conversion is just one of them. On a global scale, household wood fuel CO2 emissions related to food preparation were between 15 % and 23 % of the global net forest conversion CO2 emissions (Fig. 4).
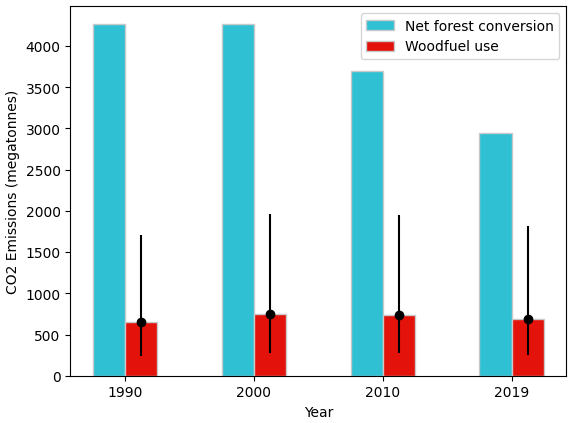
Figure 4Trends in CO2 emissions from net forestland conversion and wood fuel use consumption for household food preparation from 1990 to 2019 (source: FAOSTAT, 2022).
A total of 36.3 % of the overall household food emissions can be attributed to the unsustainable harvest of wood fuel used for residential cooking (0.7 Gt CO2 eq. in 2019). For comparison, the GHG emissions of the whole agri-food sector amount to 16 Gt CO2 eq. yr−1 and those of post-agricultural production activities alone (including food processing, transport, retail, and household consumption) to 6 Gt CO2 eq. yr−1. Household wood fuel emissions correspond to 4.7 % and 12.5 %, respectively.
Although these GHG emissions are covered in the AFOLU section, according to the IPCC guidelines, as part of the “deforestation” activity, these emissions are strictly related to cooking, which happens towards the end of the agri-food chain. This paper presents an estimation of the emissions from “unsustainable” wood fuel use for residential cooking. It is important to understand the magnitude of these emissions versus total deforestation emissions and total household emissions, as any mitigation action of these emissions cannot be enacted without addressing cooking systems. In other words, to reduce this important share of agri-food system emissions, any mitigation action should focus on, or at least consider, providing alternative and/or more efficient cookstoves to users of unsustainable wood fuel for cooking. An intervention aimed only at halting deforestation or reducing household emissions will be partial or ineffective.
The high proportion of non-renewable wood fuel consumption in regions such as sub-Saharan Africa is reflective of a population in which low-income households have a higher dependency on biomass for their energy needs (Dutschke et al., 2006) and in which energy use is less varied compared with their middle- and upper-income counterparts (the only two primary services are cooking and lighting) (Sovacool, 2011). The massive reduction in non-renewable wood fuel emissions from China over the period can be attributed to the exponential income of rural farmers and strong rural energy policies that have supported the development of other energy sources (most notably, electricity) (Yao et al., 2012).
The updated assessment of total agri-food system emissions, as supplemented by the data in this work, still reaffirms previous findings and works by the IPCC (2019), Crippa et al. (2021), Flammini et al. (2022b) and Tubiello et al. (2022). However, the most significant difference compared with previous work was observed in relation to emissions from food-related household consumption. Our updated value estimates of global food-related household consumption emissions (1.9 Gt CO2 eq.) were larger than our previous estimates of 1.2 Gt CO2 eq. (Tubiello et al., 2022), fuelled mostly by household wood fuel combustion for food preparation. FAOSTAT estimates in this work are more than 4 times those of EDGAR-FOOD (Crippa et al., 2021) (with reference to 2015, the last year for which EDGAR data were available), and they represent a significant share of total agri-food system emissions (Fig. 5).
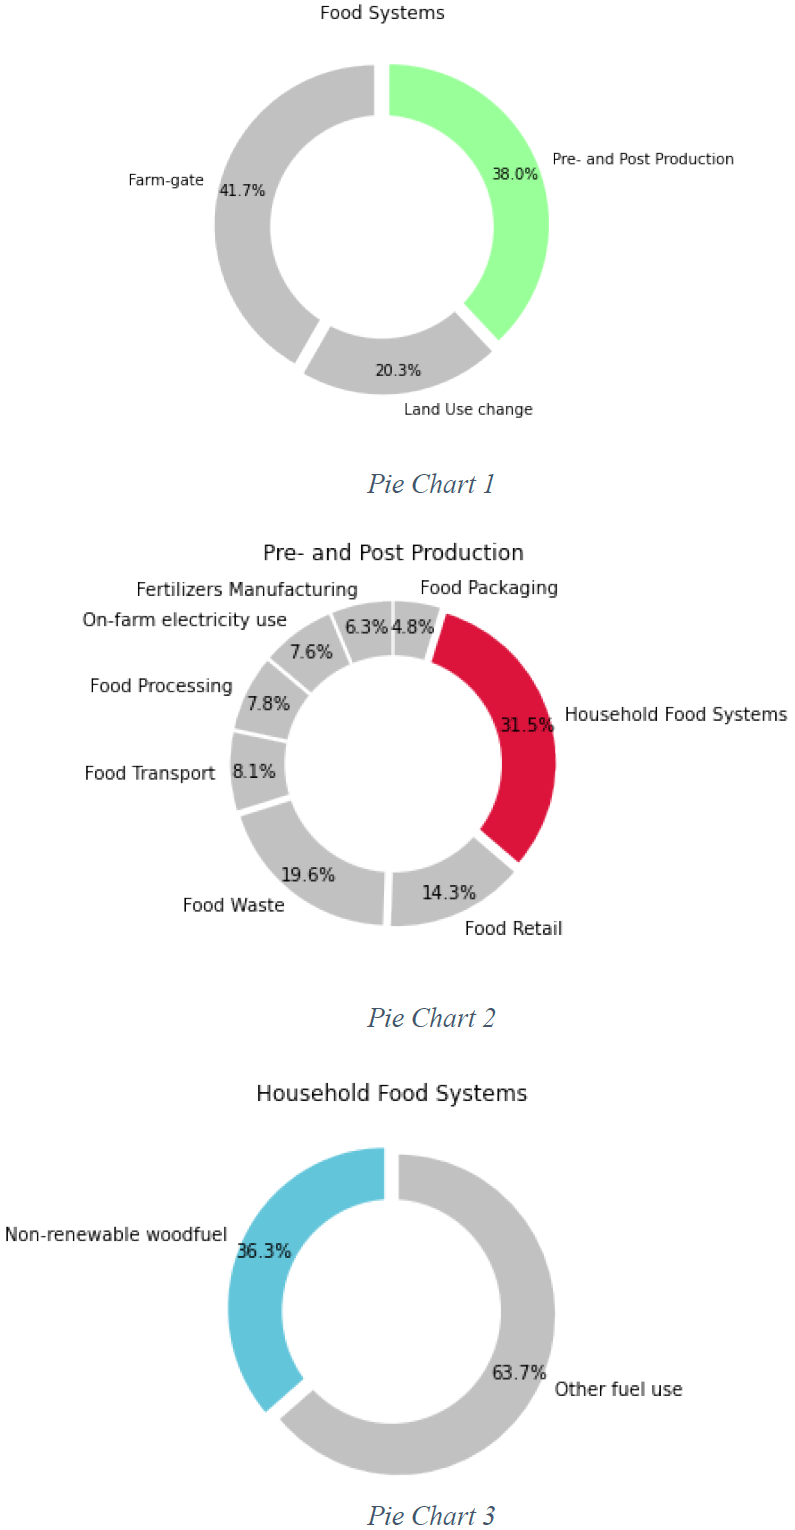
Figure 5Proportion of emissions for non-renewable wood fuel use by households for food preparation in comparison to (i) the overall food system (top), (ii) pre- and post-production (middle), and (iii) household food systems (bottom) for the year 2019 (source: FAOSTAT, 2022).
A notable trend in the incorporation of non-renewable wood fuel emissions into the overall household food system emissions is the amplification of country-level emissions in countries/territories with a high dependence on wood fuel as their source of energy (Schilmann et al., 2021; World Bank, 2011).
Our refined assessments of emission contributions highlight the importance of non-renewable wood fuel in the overall food system emissions. Referring to our previous work (used for FAOSTAT), the total food system emissions were 16.5 Gt CO2 eq. in 2019. Within the overall composition of the total food system emissions, the pre- and post-production sector emissions amount to 5.8 Gt CO2 eq. (38 %). Of the overall pre- and post-production sector, the non-renewable wood fuel combustion constitutes 0.75 Gt CO2 eq. of the total (Tubiello et al., 2022). Regarding the three major components of the food system (on-farm production, land use change, and pre- and post-agricultural production activities, as defined in Tubiello et al., 2021), our analysis highlights that, in 2019, household food systems comprised the largest share (31 %), while non-renewable wood fuel combustion was 36 % of household food systems (Fig. 5).
The GHG emission data presented herein cover the period from 1990 to 2019 at the country level. They are available as open data at https://doi.org/10.5281/zenodo.7310933 (Flammini et al., 2022a).
This paper provides updated details of the FAOSTAT database on GHG emissions along the entire agri-food systems chain (Tubiello et al., 2022), with a focus on improving the estimates of household consumption emissions.
The data are provided in an open-access format to users worldwide and are available by country over the period from 1990 to 2019, with plans for annual updates. The major trends in non-renewable wood fuel consumption within household food systems that were identified in this work can help locate emission hot spots in agri-food systems and inform the adoption/effectiveness of policies on cooking fuel switches at the country, regional, and global levels. This work also emphasizes the increasingly important role that pre- and post-production processes along supply chains play in the overall GHG footprint of agri-food systems, at a regional and global level.
Moreover, this paper helps to expand the impacts of wood fuel use beyond just health measures, as it also highlights the climate impact attached to using non-renewable wood fuel as a source of cooking fuel. Finally, the methodological work underlying these efforts complements and extends recent pioneering efforts by the FAO and other groups in characterizing technical coefficients to enable the quantification of the weight of agri-food systems within countries' emission profiles.
AF conceived and designed the paper; HA conducted the literature review and collected the data; AF, HA, and KK analysed and interpreted the results; HA and AF wrote the manuscript; FNT supervised the work; KK and FNT critically reviewed the manuscript.
At least one of the (co-)authors is a member of the editorial board of Earth System Science Data. The peer-review process was guided by an independent editor, and the authors also have no other competing interests to declare.
The views expressed in this information product are those of the author(s) and do not necessarily reflect those of FAO or the United Nations Industrial Development Organization (UNIDO).
Publisher’s note: Copernicus Publications remains neutral with regard to jurisdictional claims in published maps and institutional affiliations.
FAOSTAT is supported by the FAO regular budget, funded by its member countries. We acknowledge the efforts of the national experts who provide the statistics on energy use that are at the basis of this effort. All authors contributed critically to the drafts and gave final approval for publication. We are grateful for overall support from the Food Climate Partnership at Columbia University.
This paper was edited by David Carlson and reviewed by two anonymous referees.
Arnold, J. E. M., Kohlin, G., and Persson, R.: Woodfuels, livelihoods, and policy interventions: Changing perspectives, CIFOR, https://www.cifor.org/knowledge/publication/1945/ (last access: 24 April 2023, 2006.
Bailis, R., Drigo, R., Ghilardi, A., and Masera, O.: The carbon footprint of traditional woodfuels, Nat. Clim. Change, 5, 266–272, https://doi.org/10.1038/nclimate2491, 2015.
Crippa, M., Solazzo, E., Guizzardi, D., Monforti-Ferrario, F., Tubiello, F. N., and Leip, A.: Food Systems Are Responsible for a Third of Global Anthropogenic GHG Emissions, Nature Food, 2, 198–209, https://doi.org/10.1038/s43016-021-00225-9, 2021.
Daioglou, V., van Ruijven, B. J., and van Vuuren, D. P.: Model projections for household energy use in developing countries, Energy, 37, 601–615, https://doi.org/10.1016/j.energy.2011.10.044, 2012.
Dewees, P. A.: The woodfuel crisis reconsidered: Observations on the dynamics of abundance and scarcity, World Dev., 17, 1159–1172, https://doi.org/10.1016/0305-750X(89)90231-3, 1989.
Drigo, R., Masera, O., and Trossero, M. A.: Woodfuel integrated supply/demand overview mapping – WISDOM: A geographical representation of woodfuel priority areas, Unasylva, 53, 36–40, 2002.
Drigo, R., Bailis, R., Ghilardi, A., Masera, O., and Suber, M. : Pan-tropical analysis of woodfuel supply, demand and sustainability, Final Rep., https://doi.org/10.13140/RG.2.2.30620.49282, 2014.
Dutschke, M., Kapp, G., Lehmann, A., and Schaefer, V.: Risks and chances of combined forestry and biomass projects under the Clean Development Mechanism, https://www.osti.gov/etdeweb/biblio/946872 (last access: 24 April 2023), 2006.
FAO: Unified Bioenergy Terminology – UBET, 58, https://www.fao.org/3/j4504e/j4504e.pdf (last access: 25 May 2023), 2004.
FAO: Wood-energy supply/demand scenarios in the context of poverty mapping: A Wisdom case study in Southeast Asia for the years 2000 and 2015, https://www.fao.org/publications/card/en/c/a4336fdd-649c-5b72-9bf5-5bb5e7494d04/ (last access: 24 April 2023), 2007.
FAO: Criteria and indicators for sustainable woodfuels, https://www.fao.org/documents/card/en/c/acea8f95-2064-500e-a9a3-a04adaa4b5c1/ (last access: 24 April 2023), 2010.
FAO: FAOSTAT Emissions Shares, https://www.fao.org/faostat/en/#data/GT (last access: 25 October 2022), 2022.
Federici, S., Tubiello, F. N., Salvatore, M., Jacobs, H., and Schmidhuber, J.: New estimates of CO2 forest emissions and removals: 1990–2015, Forest Ecol. Manag., 352, 89–98, https://doi.org/10.1016/j.foreco.2015.04.022, 2015.
Flammini, A., Adzmir, H., Karl, K., and Tubiello, F.: Country greenhouse gas emissions from the non-renewable fraction of woodfuel used in households (1.0), Zenodo [data set], https://doi.org/10.5281/zenodo.7310933, 2022a.
Flammini, A., Pan, X., Tubiello, F. N., Qiu, S. Y., Rocha Souza, L., Quadrelli, R., Bracco, S., Benoit, P., and Sims, R.: Emissions of greenhouse gases from energy use in agriculture, forestry and fisheries: 1970–2019, Earth Syst. Sci. Data, 14, 811–821, https://doi.org/10.5194/essd-14-811-2022, 2022b.
IEA: Energy Statistics Manual – Analysis, https://www.iea.org/reports/energy-statistics-manual-2 (last access: 24 April 2023), 2004.
IEA.: World Energy Outlook 2020 – Analysis, https://www.iea.org/reports/world-energy-outlook-2020 (last access: 24 April 2023), 2020.
IEA.: World Energy Outlook 2021 – Analysis, https://www.iea.org/reports/world-energy-outlook-2021 (last access: 24 April 2023), 2021.
IPCC: IPCC Guidelines for National Greenhouse Gas Inventories, https://www.ipcc.ch/report/2006-ipcc-guidelines-for-national-greenhouse-gas-inventories/ (last access: 24 April 2023), 2006.
IPCC: Climate Change and Land: an IPCC special report on climate change, desertification, land degradation, sustainable land management, food security, and greenhouse gas fluxes in terrestrial ecosystems, https://www.ipcc.ch/srccl/ (last access: 24 April 2023), 2019.
Lee, C. M., Chandler, C., Lazarus, M., and Johnson, F. X: Assessing the Climate Impacts of Cookstove Projects: Issues in Emissions Accounting, Challenges in Sustainability, 1, 53–71, https://doi.org/10.12924/cis2013.01020053, 2013.
Morgan, R. F.: A New Journal for the Torrid Zone, Journal of Tropical Psychology, 1, p. 1, https://doi.org/10.1375/jtp.1.1.1, 2011.
Schilmann, A., Ruiz-García, V., Serrano-Medrano, M., de la Sierra de la Vega, L. A., Olaya-García, B., Estevez-García, J. A., Berrueta, V., Riojas-Rodríguez, H., and Masera, O.: Just and fair household energy transition in rural Latin American households: Are we moving forward?, Environ. Res. Lett., 16, 105012, https://doi.org/10.1088/1748-9326/ac28b2, 2021.
Sovacool, B. K.: Conceptualizing urban household energy use: Climbing the “Energy Services Ladder”, Energ. Policy, 39, 1659–1668, https://doi.org/10.1016/j.enpol.2010.12.041, 2011.
Tubiello, F. , Rosenzweig, C., Conchedda, G., Karl, K., Gütschow J., Pan, X., Griffiths Obli-Laryea, G., Qiu, S., De Barrios, J., Flammini, A., Mencos Contreras, E., Souza, L., Quadrelli, R., Heiðarsdóttir, H., Benoit, P., Hayek, M., and Sandalow D.: Greenhouse gas emissions from food systems: Building the evidence base, Environ. Res. Lett., 16, 065007, https://doi.org/10.1088/1748-9326/ac018e, 2021.
Tubiello, F. N., Karl, K., Flammini, A., Gütschow, J., Obli-Laryea, G., Conchedda, G., Pan, X., Qi, S. Y., Halldórudóttir Heiðarsdóttir, H., Wanner, N., Quadrelli, R., Rocha Souza, L., Benoit, P., Hayek, M., Sandalow, D., Mencos Contreras, E., Rosenzweig, C., Rosero Moncayo, J., Conforti, P., and Torero, M.: Pre- and post-production processes increasingly dominate greenhouse gas emissions from agri-food systems, Earth Syst. Sci. Data, 14, 1795–1809, https://doi.org/10.5194/essd-14-1795-2022, 2022.
WHO: WHO Guidelines for indoor air quality: Household fuel combustion, https://www.who.int/publications-detail-redirect/9789241548885 (last access: 24 April 2023), 2014.
WHO: Household air pollution and health, https://www.who.int/news-room/fact-sheets/detail/household-air-pollution-and-health (last access: 24 April 2023), 2021.
World Bank: Wood-Based Biomass Energy Development for Sub-Saharan Africa: Issues and Approaches, https://openknowledge.worldbank.org/handle/10986/26149 (last access: 24 April 2023), 2011.
Yao, C., Chen, C., and Li, M.: Analysis of rural residential energy consumption and corresponding carbon emissions in China, Energ. Policy, 41, 445–450, https://doi.org/10.1016/j.enpol.2011.11.005, 2012.