Sea level variation in the Arctic Ocean since 1979 based on ORAS5 data
 Ying Jin
 Meixiang Chen
 Han Yan1,2
 - 1Key Laboratory of Marine Hazards Forecasting, Ministry of Natural Resources, Hohai University, Nanjing, China
- 2College of Oceanography, Hohai University, Nanjing, China
- 3College of Harbor, Coastal and Offshore Engineering, Hohai University, Nanjing, China
The Arctic is currently experiencing unprecedented changes across all components of the climate system, primarily driven by global warming. As an important indicator of climate change in the Arctic, sea level reflects variations in both the atmosphere and ocean. This paper analyzes the sea level variation of the Arctic Ocean over the past four decades using ORAS5 data, which is the product of the latest reanalysis-analysis system produced by the European Centre for Medium-Range Weather Forecasts (ECMWF). ORAS5 accurately reproduces the main spatial features of the climatology and temporal evolution of sea surface height (SSH) in the Arctic Ocean, as observed by satellite altimeters, and reveals that seasonal variability is the most significant property of the sea level variation in this region. The seasonal cycle of SSH is closely linked to atmospheric circulation and sea ice formation. The first two dominant modes of the annual-mean SSH in the Arctic Ocean exhibit significant decadal variability. The first mode can be explained by the Ekman transport of wind related to the Arctic Oscillation (AO), which leads to antiphase changes in SSH on the continental shelves and in the deep basins. The second mode shows an antiphase oscillation of SSH between the Eurasian and Canadian Arctic Archipelago (CAA) sides and is driven by the wind anomaly associated with the Arctic dipole anomaly (DA). Due to the decadal variations associated with climate modes, particularly the AO, sea level in the Arctic Ocean has been continuously rising since the mid-1990s or early 2000s, with the most rapid sea level rise occurring in the Beaufort Sea.
1 Introduction
The Arctic has undergone unprecedented climate change over the past few decades, with surface temperatures increasing at twice the global mean rate (a phenomenon known as Arctic amplification; Serreze et al., 2009; Serreze and Barry, 2011). This has been accompanied by a rapid decline in sea ice (Kwok et al., 2009), ice mass loss from the Greenland ice sheet (Rignot et al., 2011), and changes in ocean temperature (Polyakov et al., 2005) and salinity (McPhee et al., 2009), which have altered both physical and biogeochemical conditions in the Arctic Ocean. The melting of the Greenland ice sheet is directly contributing to the overall sea level rise of the globe. The reduction in sea ice extent affects the reflection and absorption of heat at the ocean surface, altering the air-sea heat flux and potentially disrupting the regular pattern of atmospheric and thermohaline circulation, thereby influencing the global climate, including mid- and low-latitude regions, through large-scale circulation and climate variability such as the Arctic Oscillation (AO) and North Atlantic Oscillation (NAO, Thompson and Wallace, 1998; Vihma, 2014). Amplification in both the atmosphere and ocean highlights the vulnerability of the Arctic to climate change, making it crucial to closely monitor the region both presently and in the future (Shu et al., 2022).
Sea level variation is an important indicator of global and regional climate, as it integrates changes of almost all the components in the climate system, in response to both natural and anthropogenic forcing (Church et al., 2013; Stammer et al., 2013; Legeais et al., 2018). Regional sea level changes are associated with a variety of dynamical and thermodynamical processes in the ocean, such as sea surface heating and cooling, wind forcing, freshwater exchanges between the ocean and other components of the climate system, thermohaline circulation and interior mixing in the ocean (Wunsch et al., 2007; Stammer et al., 2013; Koldunov et al., 2014; Cazenave, 2020). These processes can alter the temperature, salinity, currents and mass of the ocean, and consequently contribute to sea level change through the change of seawater density or mass change. Given the dramatic changes occurring in the Arctic region due to global warming and its impact on global climate, it is critical to conduct research on sea level changes within the Arctic Ocean. Such research is essential for gaining a better understanding of how recent climate change is affecting this region.
The greatest limitation to the research of sea level changes in the Arctic Ocean lies in the scarcity of observational data. Most tide gauges with long sea level records are situated along the coast of Norway and Russia and only a small part of them are maintained after 1990 (Proshutinsky et al., 2001; Proshutinsky et al., 2004; Proshutinsky et al., 2007; Henry et al., 2012). Measurements of SSH by satellite altimeters since the 1990s cover most parts of the Arctic Ocean. However, due to the inclination of altimeters, there are still blank areas near the North Pole that have not been adequately measured (Prandi et al., 2012; Cheng et al., 2015). Furthermore, the conventional processing of satellite radar altimetry is not effective in the presence of sea ice. Consequently, sea level monitoring in a considerable portion of the Arctic Ocean is not sufficient due to the existence of seasonal or permanent sea ice (Cheng et al., 2015; Armitage et al., 2016). Observations of hydrographic profiles in the Arctic Ocean are also scarce, particularly in ice-covered areas, hindering our understanding of the steric change contributing to sea level variations (e.g., Dmitrenko et al., 2008; Rabe et al., 2014).
However, a significant amount of research has still been carried out and some useful results are obtained basing on the records of tide gauge, satellite altimetry-derived datasets and outputs from numerical models. Sea level in the Arctic has been found to have significant seasonal variability, partly due to the steric change of seawater and injection of river runoff from the land (e.g., Proshutinsky et al., 2004; Richter et al., 2012; Armitage et al., 2016). Interannual to decadal sea level variabilities in the Arctic Ocean have also been reported to be consistent with the pattern of atmospheric circulation around the Arctic, like AO, NAO and atmospheric dipole anomaly of the Arctic (DA, Proshutinsky and Johnson, 1997; Wu et al., 2006; Proshutinsky et al., 2009; Koldunov et al., 2014; Proshutinsky et al., 2015; Armitage et al., 2016; Armitage et al., 2018; Xiao et al., 2020; Wang et al., 2021). Additionally, trend of sea level in the Arctic Ocean has also been focused on in many studies (e.g., Proshutinsky et al., 2004; Henry et al., 2012; Prandi et al., 2012; Cheng et al., 2015; Xiao et al., 2020). According to recent research, positive trends have been observed across almost all areas of the Arctic Ocean, and a dramatic sea level rise has been found in the Beaufort Sea (Prandi et al., 2012; Cheng et al., 2015; Carret et al., 2017), which is thought to be a result of freshwater accumulation (Giles et al., 2012).
One issue with previous research is the limited availability of long time-series observational data on SSH that covers the entire Arctic Ocean. Numerical simulation results have been used instead, but the outputs of numerical models may have biases that do not reflect actual sea level changes. Furthermore, there are variety of discrepancies among the results of different models or even the same model with different resolutions (e.g., Koldunov et al., 2014; Wang et al., 2018b; Xiao et al., 2020; Lyu et al., 2022). From this point of view, reanalysis datasets that assimilate various observational data and cover the entire Arctic Ocean over a longer time span are a more reliable choice for studying sea level changes in this region. Among these, the ORAS5 dataset is currently the best option. This dataset is the product of ECMWF’s latest operational system, OCEAN5. OCEAN5 includes a sea ice model and assimilates more observational data of the Arctic Ocean, resulting in significantly improved simulation accuracy in the Arctic region compared to previous versions with no sea ice model included.
In this paper, we will use the SSH data of ORAS5 to analyze the sea level variation in the Arctic Ocean. Compared with altimeter data, ORAS5 provides a longer time period of 40 years (1979-2018) with significantly increased spatial coverage (with no blanks near the North Pole), enabling more accurate estimation of sea level changes especially low-frequency variabilities of sea level in the Arctic Ocean. Due to assimilation of observed data as more as possible in the simulation, the sea level data provided by ORAS5 is more realistic than the numerical model results. Two sets of satellite sea level data are used to validate the SSH data in the Arctic Ocean of ORAS5. One dataset is from the Centre for Polar Observation and Modelling (CPOM) at University College London, and the other is from the Technical University of Denmark (DTU). Both datasets cover the area with sea-ice but have shorter time spans. The following parts of the paper are structured as follows: Section 2 gives detailed introduction to the data used in this study and method to calculate climate variability indices, Section 3 validates the SSH data of ORAS5, Section 4 presents the sea level variation described by ORAS5 data, and we give a summary of this study in Section 5.
2 Data and methods
This paper utilizes three sets of sea level data to analyze the characteristics of sea level variation in the Arctic Ocean. The first is the SSH data of ORAS5, which is the latest reanalysis product of the OCEAN5 system operated by the ECMWF. OCEAN5 is developed from the new generation of operation system ORAP5. The ORAP5 system assimilates in-situ profiles of temperature and salinity data from the quality-controlled EN3 dataset and along-track altimeter-derived sea level anomaly (SLA) data from AVISO. The new OCEAN5 system includes a prognostic thermodynamic-dynamic sea-ice model (LIM2) and assimilates sea-ice concentration data in the high-latitude region for the first time. Compared to its predecessor, OCEAN4, OCEAN5 provides a more accurate estimate of the historical ocean state in the Arctic Ocean and has a higher ocean model resolution of 0.25 degrees in the horizontal direction and 75 levels in the vertical. Additionally, the system introduces a novel generic ensemble generation scheme that accounts for both observation and forcing errors and provides an estimate of the historical global ocean state from 1979 to present with a few days delay. The OCEAN5 system is now an important tool for climate research in the Arctic Ocean, and it provides the ocean and sea-ice initial conditions for all ECMWF coupled forecasting systems. The monthly SSH data used in this paper is the mean values of outputs from five ensemble members that are opa0 to opa4.
Two additional sets of SSH data are utilized to validate the ORAS5 data. The first set is the monthly dynamic ocean topography (DOT) data based on satellite altimeter observations, provided by CPOM of University College London (Armitage et al., 2016). This dataset provides the DOT data south of 81.5° N on a longitude-latitude grid of 0.75° × 0.25° for the period spanning from 2003 to 2014. This satellite-derived monthly product combines observations from two altimeters, Envisat data for 2003-2011 and CryoSat-2 data for 2012-2014. It has been used for various Arctic Ocean studies (Armitage et al., 2016; Armitage et al., 2017; Armitage et al., 2018; Regan et al., 2019). The second set of data is the mean dynamic topography (MDT13) data provided by DTU, which covers the entire globe with a spatial resolution of 1 minute. MDT13 is derived from 20-year (1993-2012) satellite data, including altimetry data and Gravity Field and Steady-State Ocean Circulation Explorer (GOCE) data.
The monthly mean sea ice concentration data in the Arctic region (64.5° N to 90° N, 0-360° E) for the period of 1979-2018 is obtained from the National Snow and Ice Data Center (NSIDC). The dataset has a horizontal resolution of approximately 0.25°.
The monthly sea level pressure (SLP) data from ERA5 reanalysis dataset is used to calculate the AO and DA index. This dataset has a spatial resolution of 0.25 degrees and covers the time period from 1959 to present.
Conventionally, AO is the leading mode of wintertime (November–April) SLP variability for regions north of 20°N (Thompson and Wallace, 1998), and DA corresponds to the second-leading mode of SLP north of 70°N during the winter season (October–March) (Wu et al., 2006). In this paper, we used the SLP data with a spatial coverage of 64.5° N-90° N and 0°-360°E (Figure 1), and a temporal coverage of the entire year, as opposed to just wintertime, to calculate the AO and DA index. The index calculated by this unconventional approach better captures the sea level variability studied in this paper. Additionally, our findings show that the effects of both AO and DA on sea level variation in the Arctic Ocean can accumulate over time, consistent with previous studies by Xiao et al. (2020) and Wang et al. (2021). We used the cumulative AO and DA index when we discussed the relation between sea level variation in the Arctic Ocean with AO and DA. Specifically, we define the cumulative AO/DA index for a given year as the sum of the annual mean AO/DA index from 1959 to the current year, where the annual mean AO/DA index is the average value of the 12 monthly AO/DA index for that year.
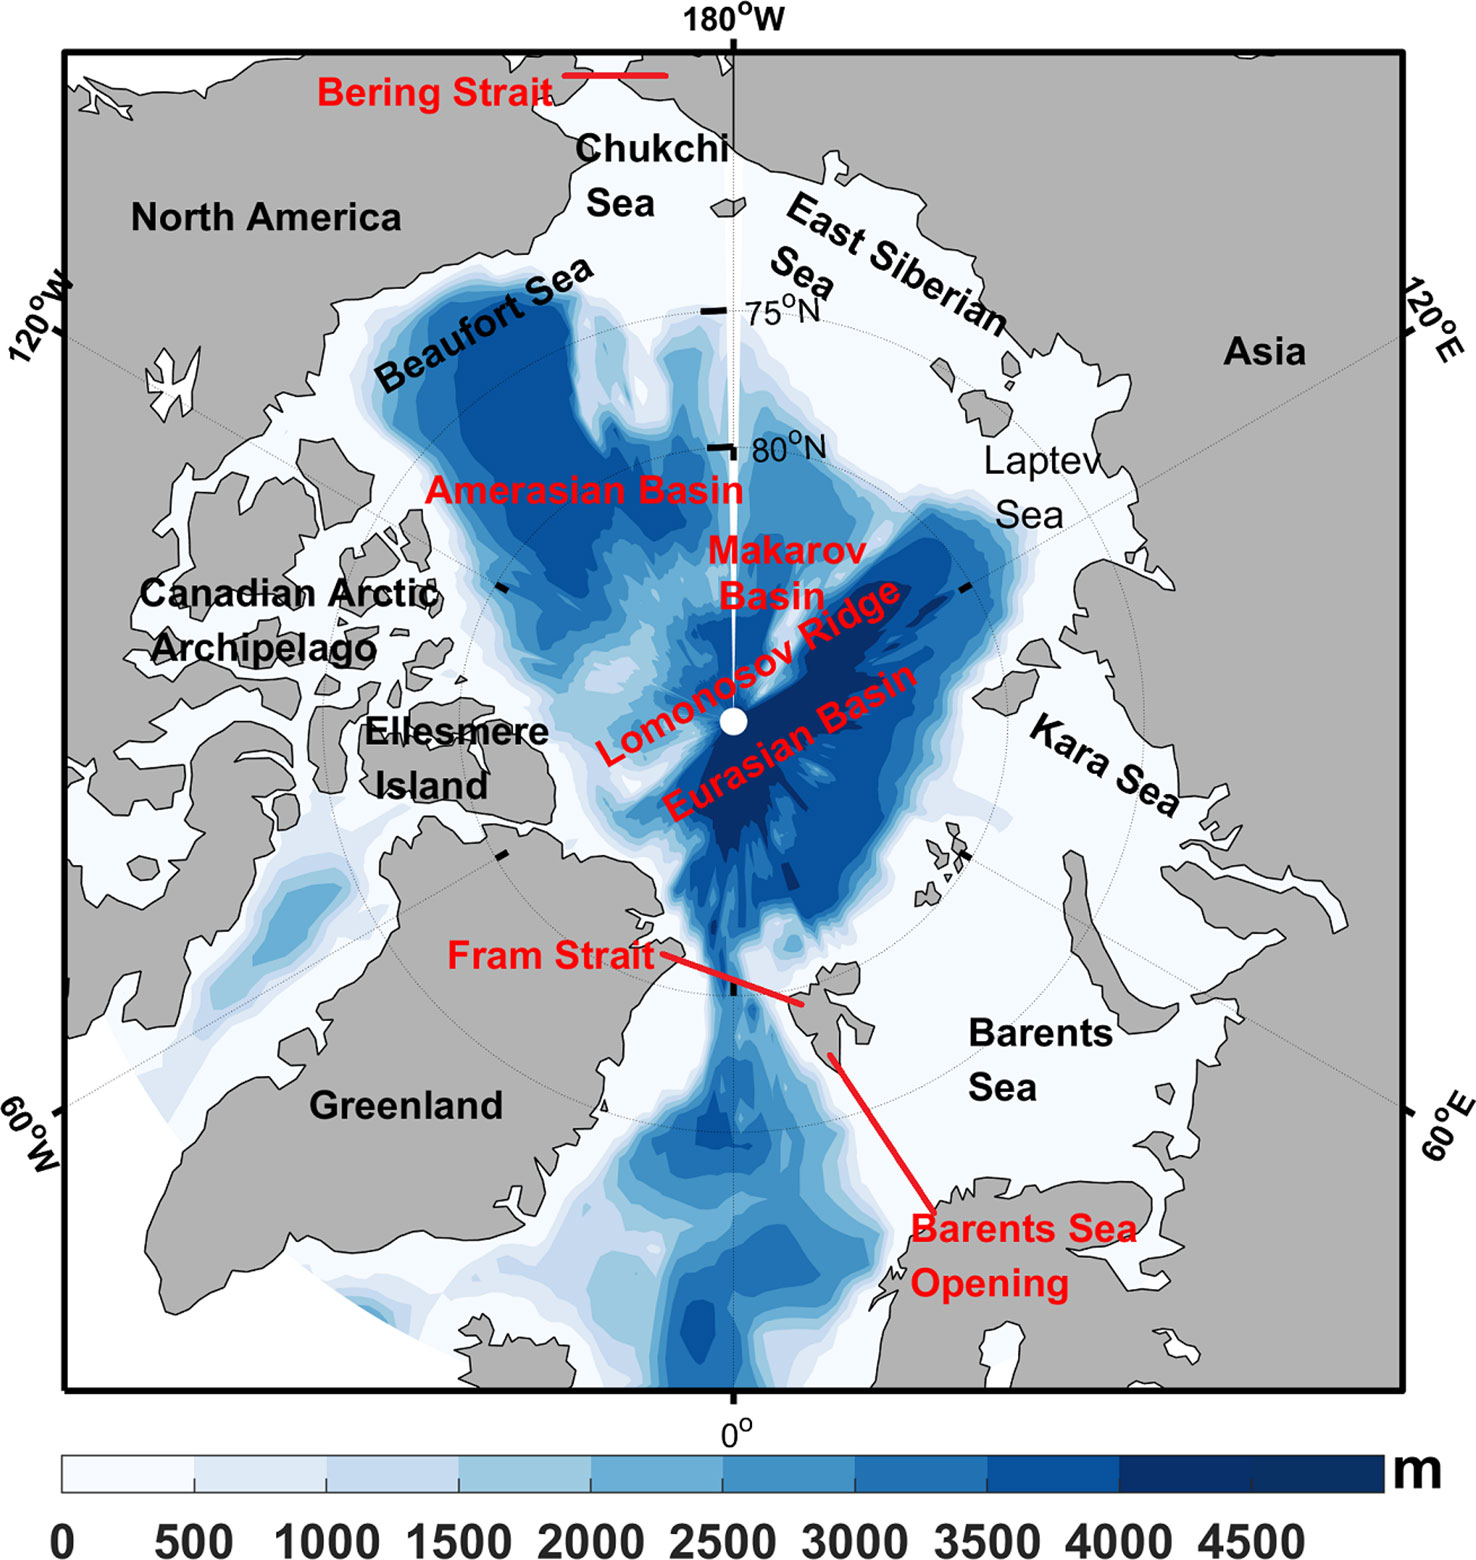
Figure 1 Ocean bathymetry of the Arctic Ocean (depth in meters), the studied domain in this paper is enclosed by the CAA, Fram Strait, Barents Sea Opening, and Bering Strait (red lines).
3 Validation of ORAS5 SSH data
The CPOM DOT data is obtained by radar altimeters but processed using specialized method that differs from conventional techniques for the areas with sea-ice. As a result, it provides meaningful SSH values for both sea-ice free and sea-ice covered areas. In the study of Armitage et al. (2016), the CPOM data has been compared with the tide gauge data along the coast of the Arctic Ocean, revealing a strong agreement in regions with seasonal ice cover (R=0.65) and permanently ice-free areas (R=0.89).
For data validation, we compared the time-mean SSH of ORAS5 with CPOM (2003-2014) and DTU (1993-2013) during different time periods (Figure 2). It is revealed that ORAS5 closely agrees with the observational data. The highest SSH is located in the Canadian Basin with a center in the Beaufort Sea, which is associated with the anticyclonic Beaufort Gyre. High sea levels are also present along the coast of marginal seas. Low sea levels occur in the Eurasian Basin and the Nordic seas, which is related to the cyclonic circulation of ocean. The significant SSH gradients between the two deep basins correspond to the transpolar drift. However, there are some biases in the ORAS5 data. The difference between ORAS5 and CPOM/DTU data is within ±0.1m, and ORAS5 overestimates the SSH in the Nordic Seas and East Siberian Sea while underestimating it in the Canadian Basin, the Canadian Arctic Archipelago, and north of Greenland (Figures 2C, F).
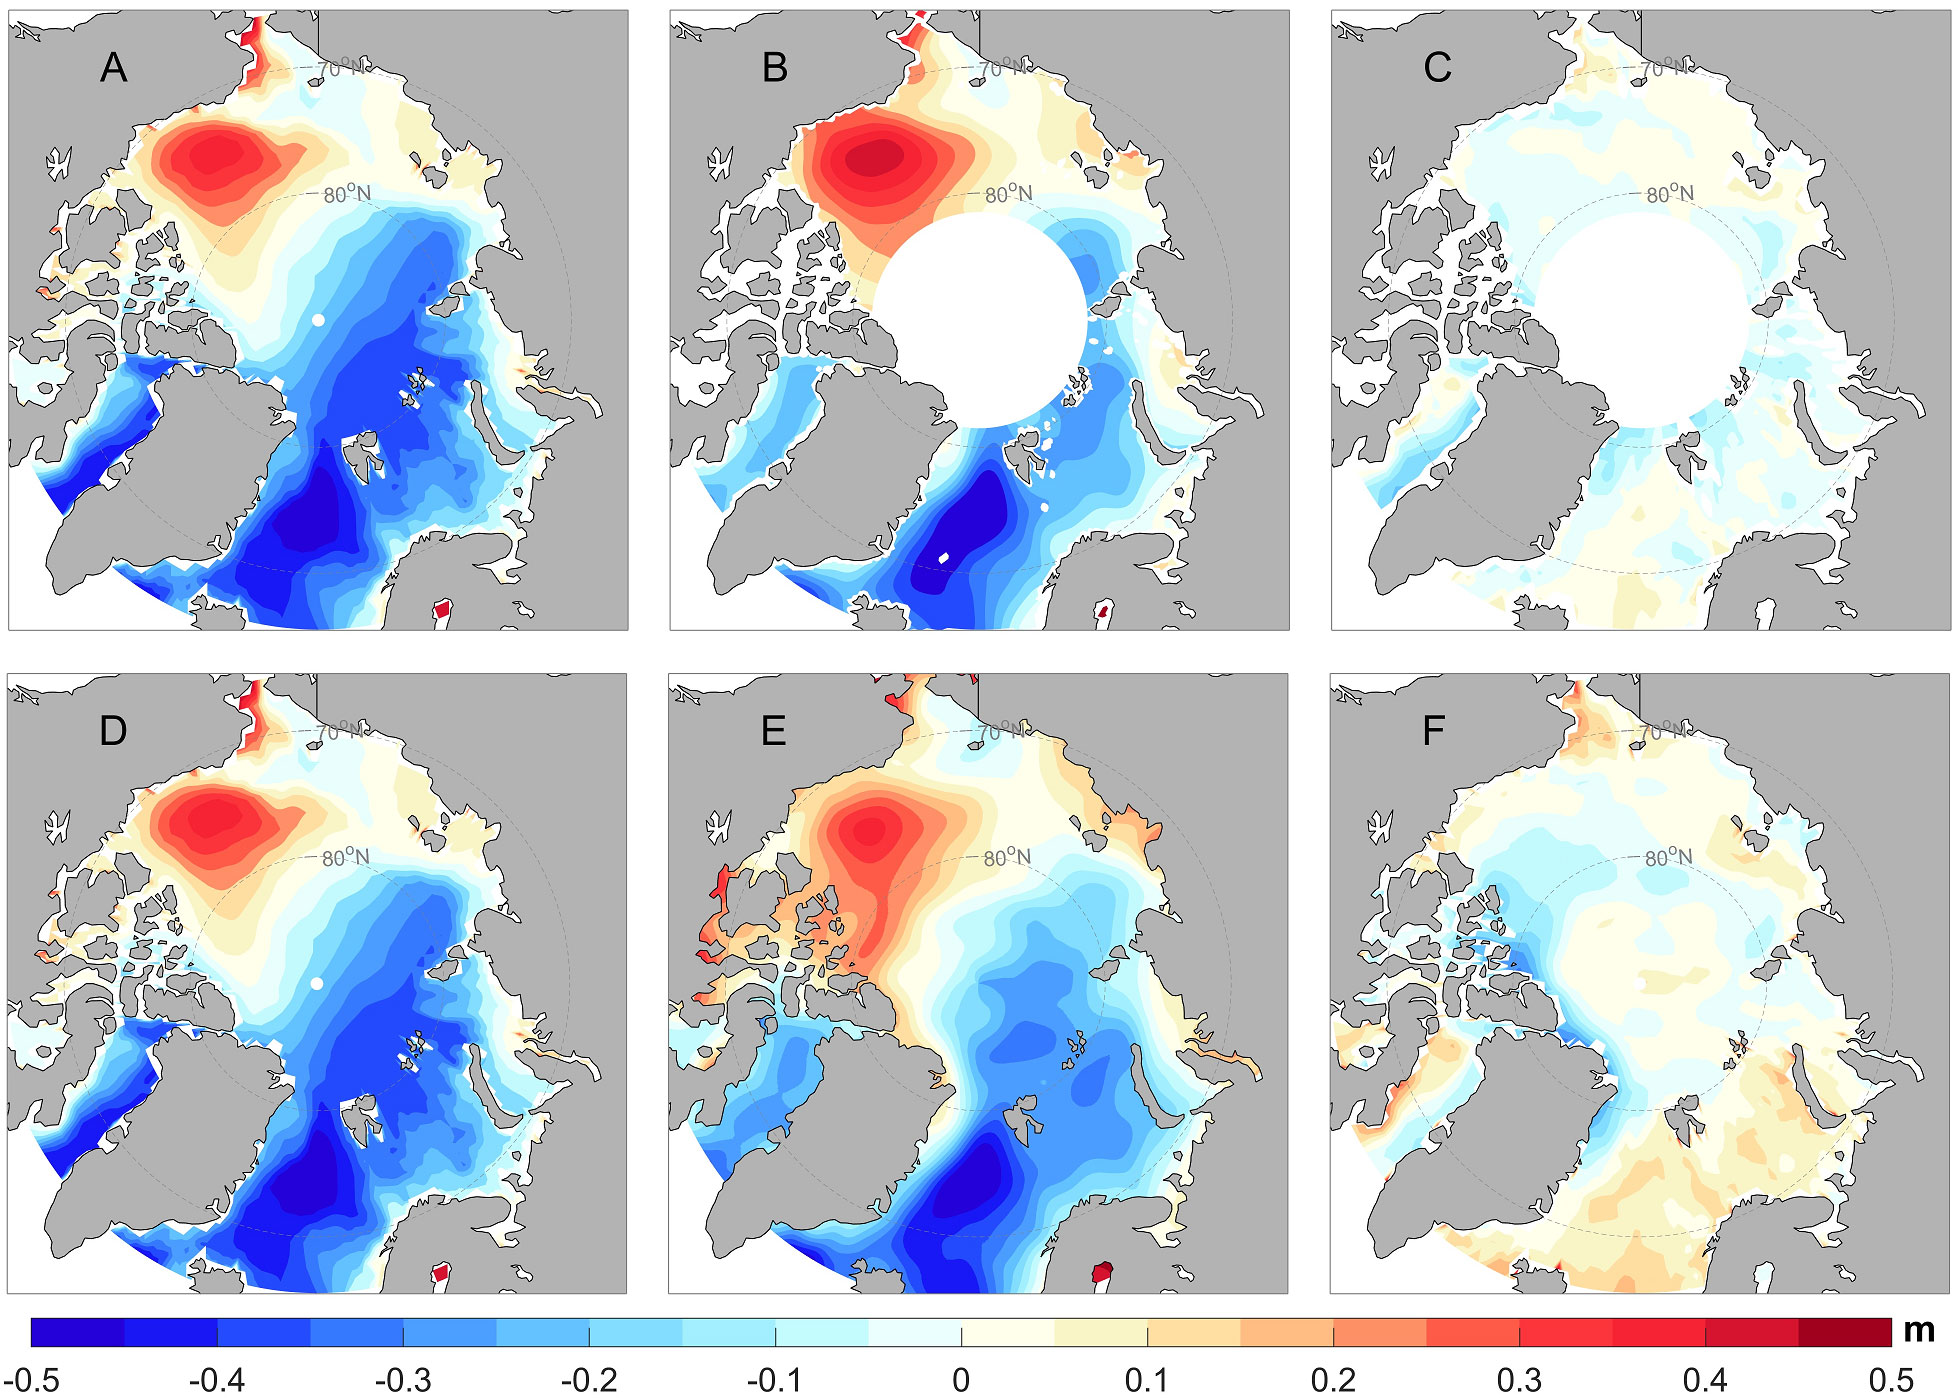
Figure 2 Time-mean SSH for the period 2003–2014 (A, B) and 1993–2013 (D, E). From left to right are ORAS5 (A, D), CPOM (B) and DTU (E). (C) (A, B) and (F) (D, E) are the residuals between ORAS5 and observations.
The time series of average SSH of the Arctic Ocean from ORAS5 data strongly correlates with CPOM altimeter data, with a correlation coefficient of 0.81 at a 0.01 significance level (Figure 3A). The standard deviation of the time series is 0.345cm for ORAS5 and 0.350cm for CPOM, respectively, which are very close. Meanwhile, we used the predictive skill S for point-to-point comparison of SSH time series (Figure 3B). Here, S is defined as S=1 − < (h0 − hp)2 >/< h02 > (Qiu, 2002). In this paper, h0 and hp are the values of CPOM and ORAS5, respectively, and the angle brackets denote time averaging. A value of S closer to 1 indicates greater precision of the ORAS5 data. The values of S show that ORAS5 effectively reproduces the SSH evolution in most areas of the Arctic Ocean. Overall, ORAS5 accurately reproduces the temporal and spatial variation of sea level observed by satellites in the Arctic Ocean.
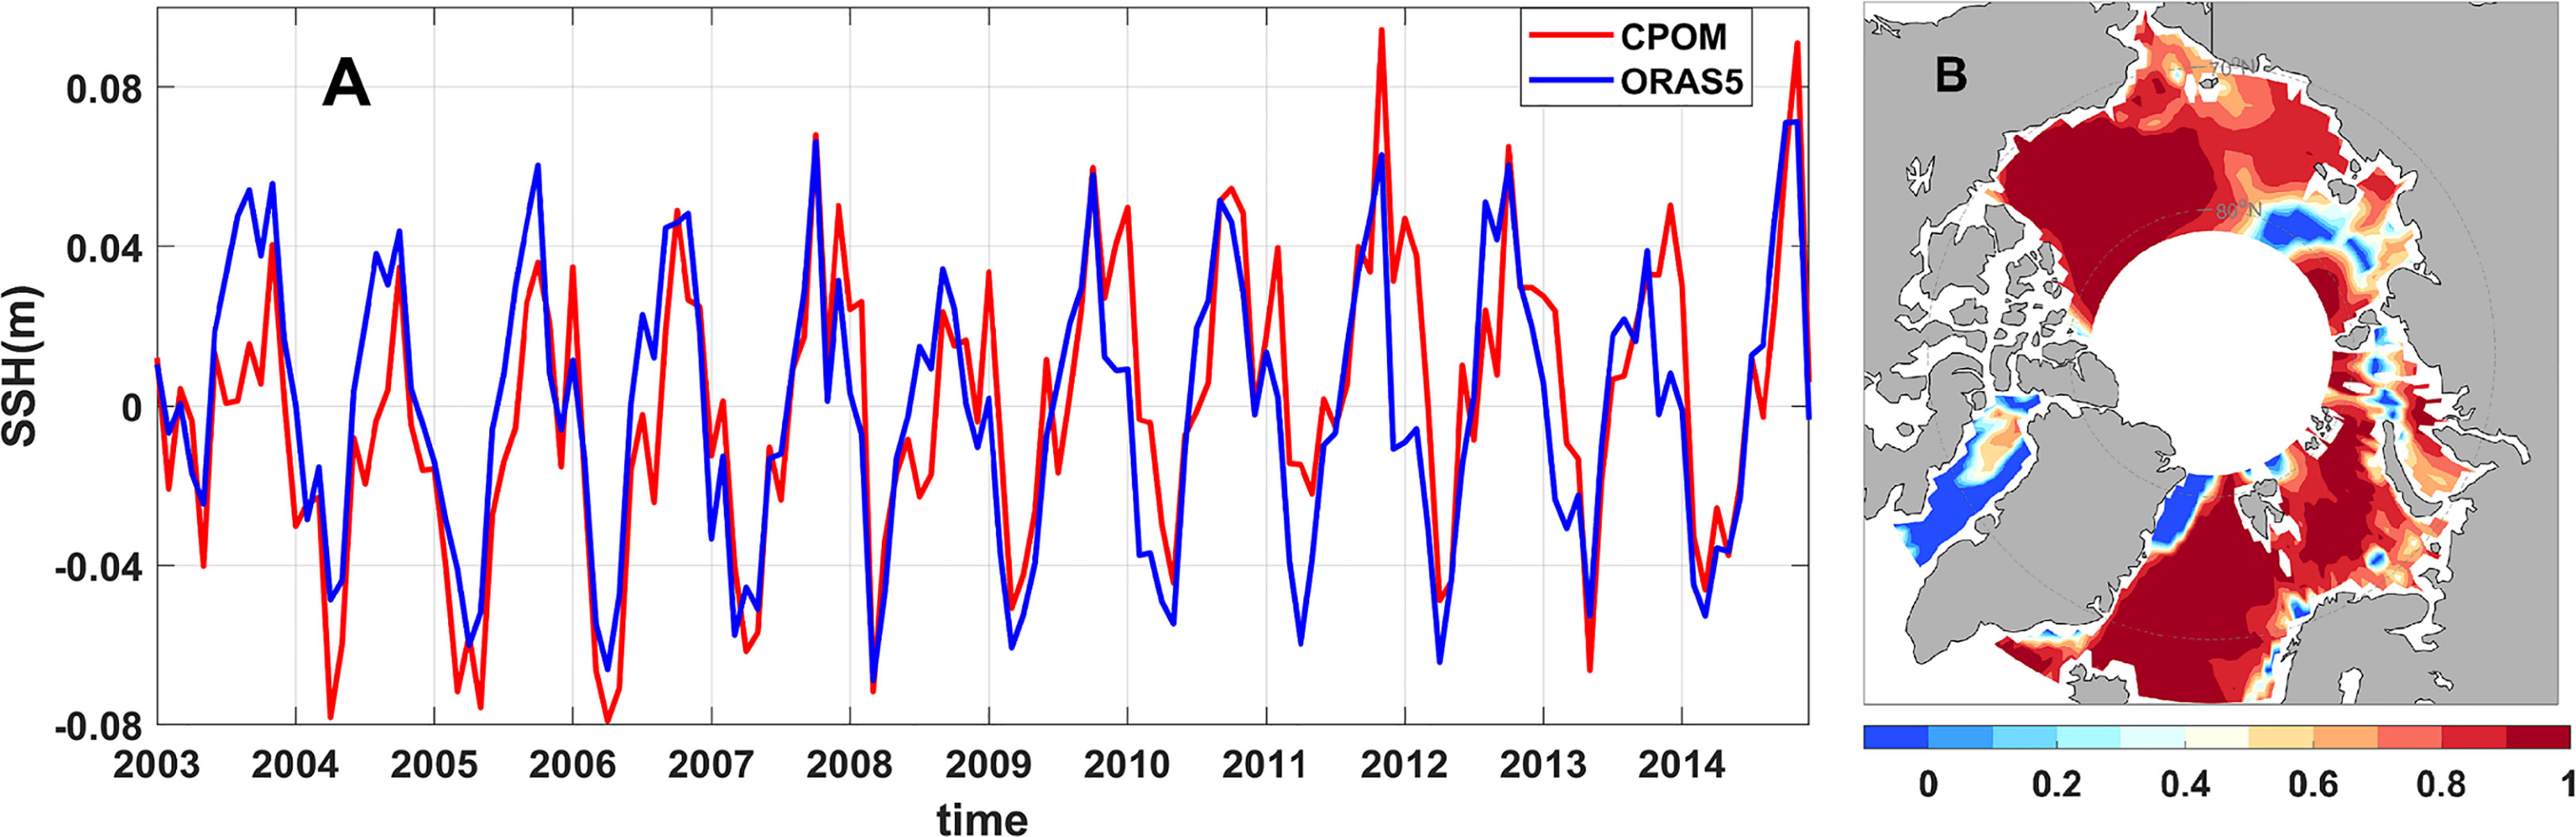
Figure 3 (A) Time series of the Arctic average SSH for the period 2003–2014 from ORAS5 (blue curve) and CPOM (red curve). (B) The predictive skills of SSH by ORAS5 to CPOM.
4 Sea level variation in the Arctic Ocean
In this paper, the domain of the Arctic Ocean refers to the regions studied by Armitage et al. (2016) and Xiao et al. (2020), which are separated by the CAA, Fram Strait, Barents Sea Opening, and Bering Strait from the Atlantic Ocean and the Pacific Ocean (Figure 1). The spatial pattern of climatological SSH in the Arctic Ocean from 1979-2018 (Figure 4A) is similar to that of 2003-2014 (Figure 2A), with the only notable difference being slightly weaker SSH gradients between the Canadian and Eurasian Basins. This suggests that both the anticyclonic gyre in the Beaufort Sea and the cyclonic circulation in the Nordic Seas during 1979-2018 were weaker compared to the recent two decades.
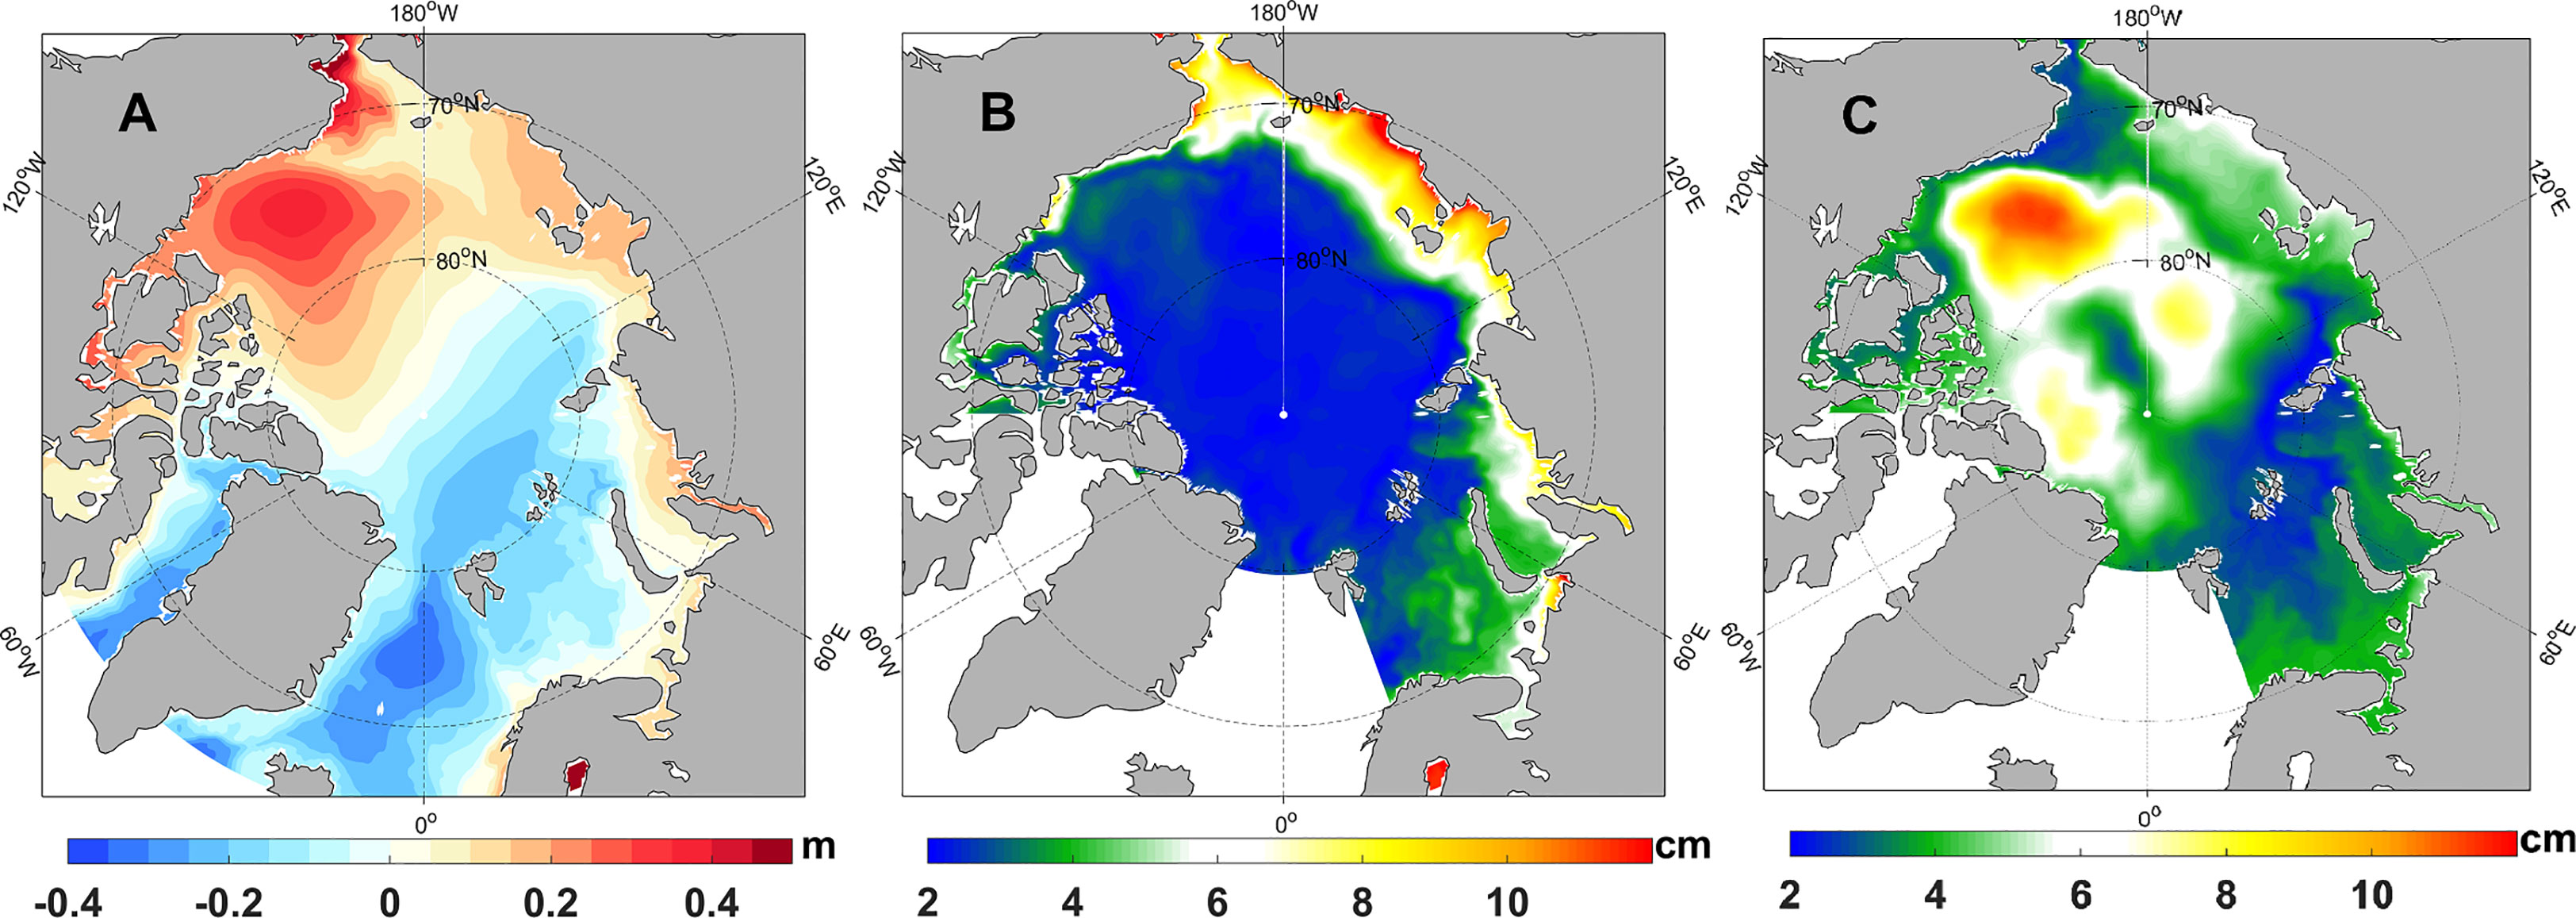
Figure 4 (A) Time-mean SSH of 1979-2018. STD of (B) monthly mean SSH (with 12 months high-pass filtering) and (C) annual mean SSH.
4.1 Seasonal SSH Variability in the Arctic Ocean
The standard deviation (STD) of SSH after 12 months high-pass filtering provides a good representation of the amplitude of seasonal variation in sea level (Figure 4B). In the Arctic Ocean, large seasonal amplitudes (exceeding 8 cm) can be found on the continental shelves, especially on the Eurasian side in the Chukchi Sea, East Siberian Sea, and Laptev Sea, while the deep basins have relatively weak seasonal variability of SSH (with amplitude less than 3 cm). The largest amplitude with values up to 13 cm occurs on the coast of East Siberian Sea and Laptev Sea, possibly related to the seasonal cycle of both sea-ice and river runoff (Armitage et al., 2016). Empirical Orthogonal Function (EOF) analysis of the monthly SSH indicates that the most significant mode (EOF1) of sea level variability in the Arctic Ocean is seasonal. EOF1 shows a consistent phase in SSH anomaly across the entire region, with a spatial pattern similar to Figure 4B and a significant period of 12 months in the time series (the figure is not given).
We found that the seasonal cycle of average SSH of the Arctic Ocean is closely related to the seasonal cycles of atmospheric circulation and sea-ice (Figure 5). Specifically, the average SSH of the Arctic Ocean reaches its lowest level in April, while SLP reaches its peak at the same time, one month after the maximum sea ice extent. This low sea level is attributed to salinization during sea ice formation and sea water divergence caused by SLP. The SSH then rises from April until it reaches its peak in September, which is accompanied by sea ice melting and SLP dropping until both of them reach their minimums in August. The rise in sea level during this period is attributed to desalination and convergence strengthening of sea water. There is a strong correlation between SSH and sea ice concentration, with the maximum correlation coefficient of -0.94 when SSH lags sea ice by one month, and a strong correlation between SSH and SLP, with the maximum correlation coefficient of -0.83 when SSH lags SLP by two months. The result reveals that seasonal changes in atmospheric circulation drive changes in ocean circulation and sea ice, which in turn contribute to changes in sea level in the Arctic Ocean.
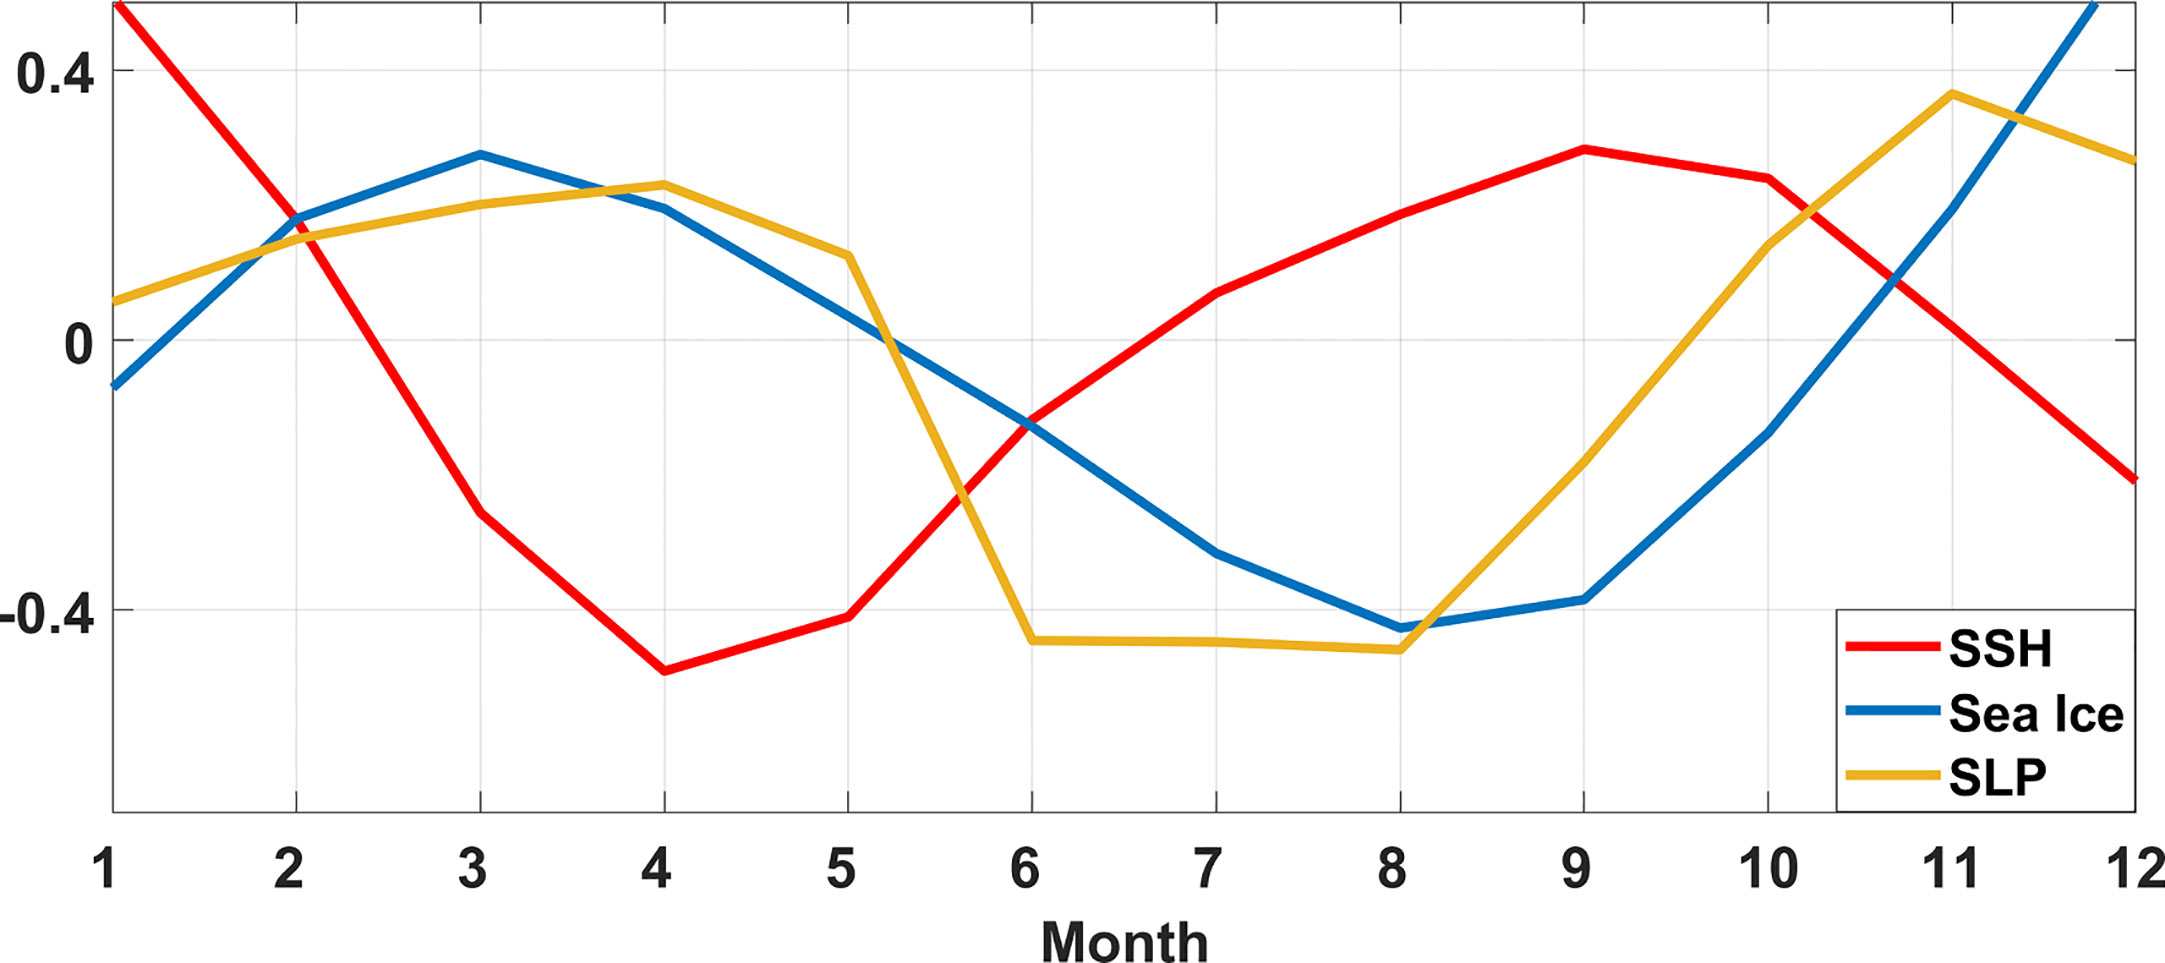
Figure 5 Seasonal cycles of average SSH (red curve), sea ice concentration (blue curve), and SLP (yellow curve) of the Arctic Ocean from 1979 to 2018. All data are normalized.
4.2 Interannual to decadal SSH Variability in the Arctic Ocean
Although the SSH in the Arctic Ocean is dominated by seasonal variability, low-frequency variability is more closely related to climate change. In this paper, we investigated the interannual-to-decadal SSH variabilities using ORAS5 data. The STD of annual mean SSH indicates the strength of low-frequency SSH variations in the Arctic Ocean (Figure 4C). The largest STD (about 11.4 cm) is observed in the Beaufort Sea of the Canadian Basin, while the Makarov Basin and area north of Ellesmere Island also show significant values (7-8 cm). The East Siberian Sea has moderately larger values (5-6 cm) in the coastal areas. The most significant inter-annual SSH variability mainly occurs in the deep basins, while the most significant seasonal variability of SSH happens mainly in the continental shelf seas. The largest amplitude of inter-annual SSH variability is almost of the same magnitude as seasonal variability (about 10 cm), as shown in Figures 4B, C.
We conducted an EOF decomposition on the annual mean SSH in the Arctic Ocean for the period 1979-2018, after removing the linear trend. The most principal mode (EOF1) is presented in Figure 6, which explains 39% of the annual mean SSH variance. This mode displays an antiphase sea level oscillation between deep basins and marginal seas. The timeseries of the annual mean SSH of the deep basins (depth > 500 m) and shallow waters (depth< 500 m) well support this antiphase pattern, particularly since the mid-1980s. Moreover, there is an obvious decadal oscillation in the antiphase change between the two areas, with two phase shifts occurring in the end of 1980s and in the mid-2000s (Figure 7). The time series of EOF1 (PC1, Figure 6B) also shows a decadal oscillation with two phase turning points at almost the same time as Figure 7. Additionally, there is a shift of the decadal trend of SSH in PC1 in 1995, which has also been noted by Xiao et al. (2020), based on a high-resolution numerical simulation of the Arctic Ocean. The low-frequency mode of SSH in the Arctic Ocean has only been found in the results of high-resolution numerical simulations (e.g., Proshutinsky and Kowalik, 2007; Koldunov et al., 2014; Xiao et al., 2020) due to the limited data length of observation, but the ORAS5 reanalysis data successfully captures this mode, even after assimilating the observed data.
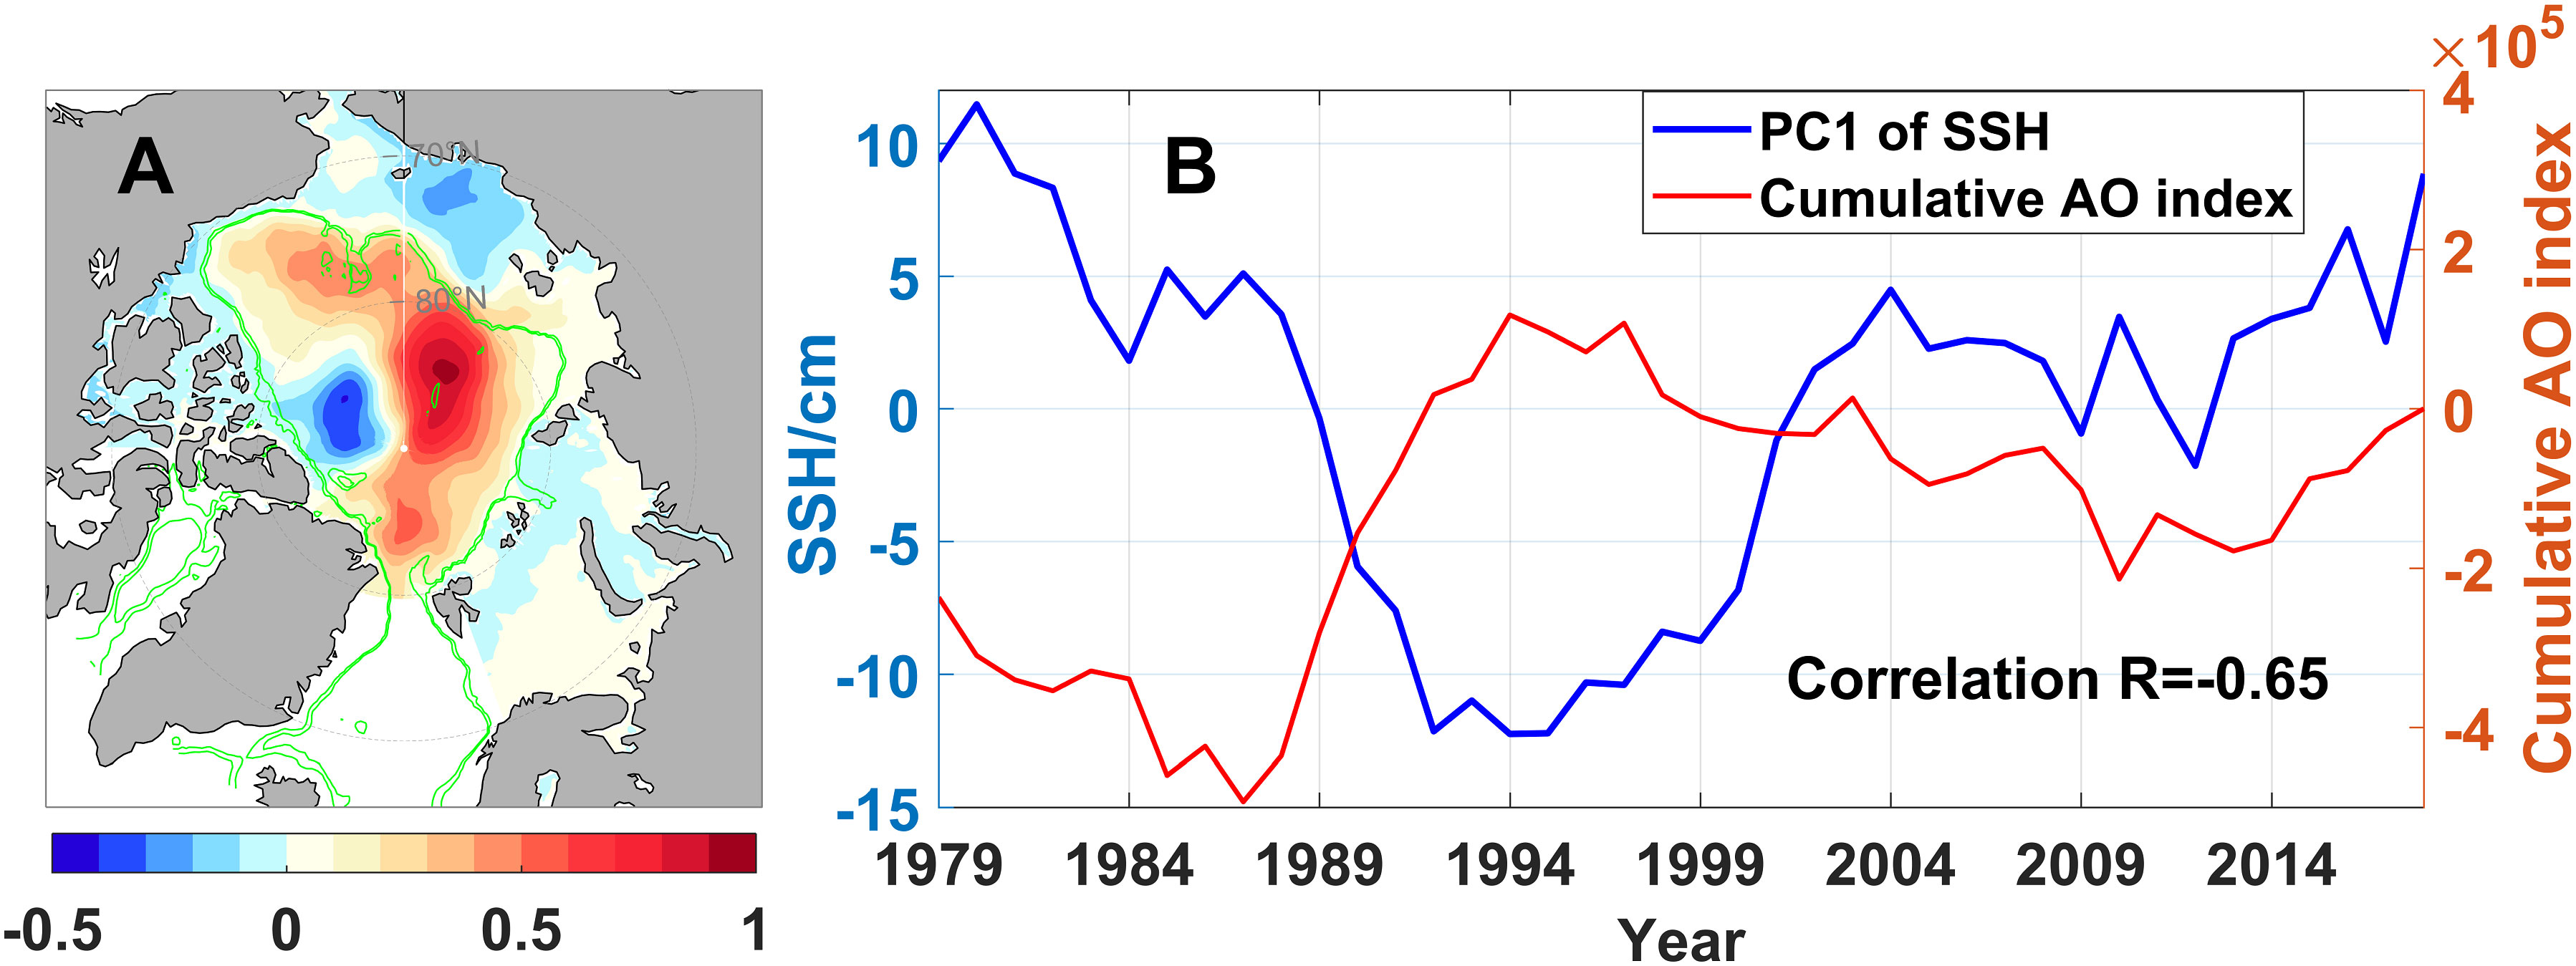
Figure 6 (A) EOF1 of the detrended annual-mean SSH. The green lines indicate the 500-m isobaths. (B) Time series of PC1 (blue curve) and cumulative AO index (red curve) for the period 1979–2018.
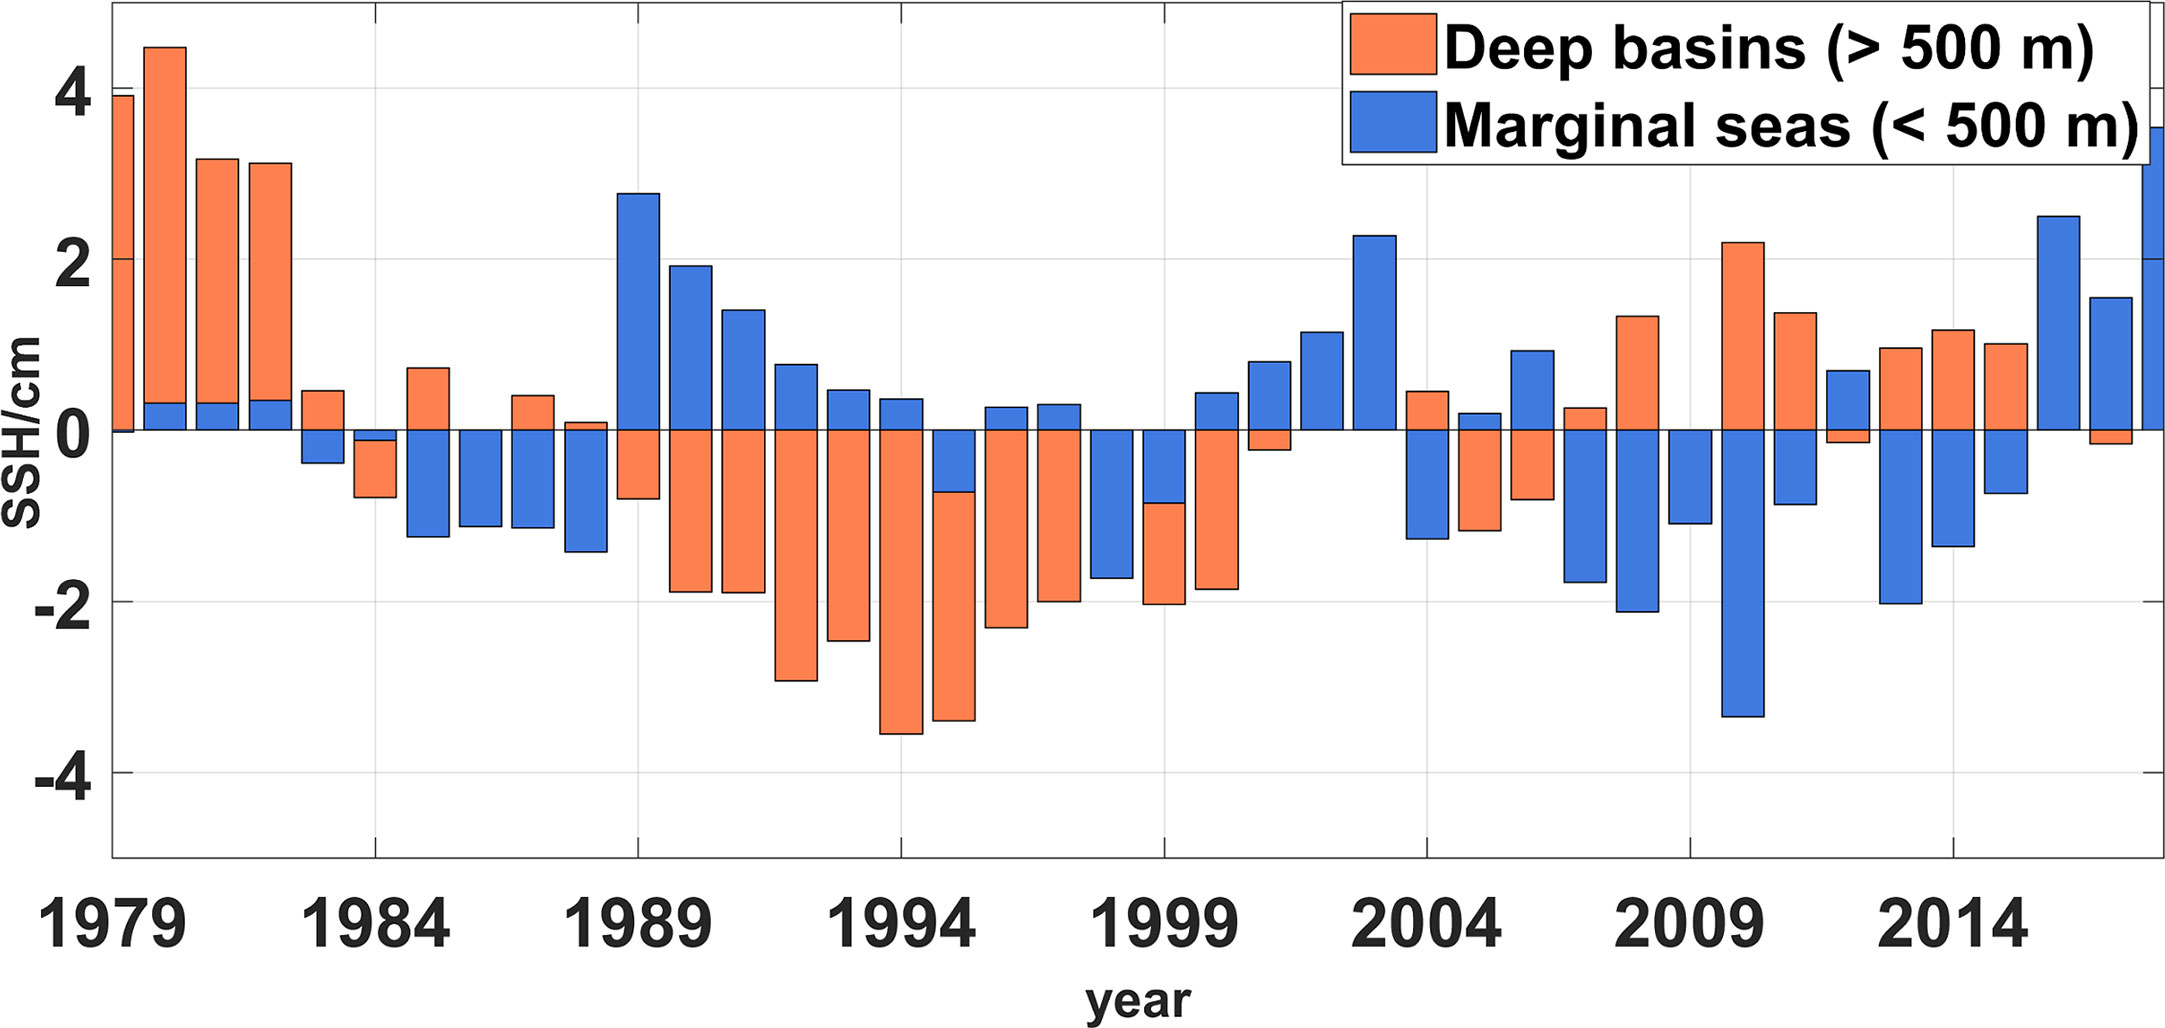
Figure 7 Annual-mean SSH of deep basins (> 500 m, orange bar) and marginal seas (< 500 m, blue bar) of the Arctic Ocean.
We confirmed the dominant influence of AO, the primary mode of SLP variability in the extra-tropical Northern Hemisphere (Thompson and Wallace, 1998), on the first mode of annual mean SSH in the Arctic Ocean, which has been pointed out by Xiao et al. (2020). The AO-related wind anomaly changes the sea ice drift and cross-shelf Ekman transport, leading to the opposite sea level anomalies between the Arctic continental shelves and deep basins (Volkov and Landerer, 2013; Koldunov et al., 2014; Fukumori et al., 2015; Armitage et al., 2018; Xiao et al., 2020). In this paper, we calculated the correlations of PC1 of SSH with both the annual mean AO index and cumulative AO index and found that PC1 is better correlated with the cumulative AO index, with a correlation coefficient of -0.65 (significant at the 0.01 level, Figure 6B; the correlation of PC1 of SSH to annual mean AO index is -0.29). This proves that the ocean has a long memory in response to external forcing, leading to the effect of AO-related wind forcing on SSH accumulated over time (Xiao et al., 2020; Wang et al., 2021). The result is consistent with the high-resolution numerical simulation of Xiao et al. (2020), who explains the influence of AO on the EOF1 of annual SSH in the Arctic Ocean by wind-forced freshwater release/accumulation. However, the correlation obtained from ORAS5 is weaker than Xiao et al. (2020) (-0.65 Vs. -0.77), which may be due to the assimilation of observed data in ORAS5, leading to more processes included in the dataset compared with pure numerical models. Additionally, the coarser resolution of ORAS5 and spatial coverage of SLP used to calculate AO index may also affect the correlation coefficient.
The second-leading mode (EOF2) of annual mean SSH accounts for 22% of the variance, exhibiting a strong antiphase SSH anomaly between the Eurasian and CAA to Greenland sides of the ocean (Figure 8A). The corresponding PC2 displays significant decadal variability with a period shorter than that of PC1 (Figure 8B). The spatial pattern of EOF2 is similar to DA in the Arctic Ocean (Figure 8C), the second-leading mode of SLP in the region with two antiphase anomalous centers located on the Eurasia continent and CAA to Greenland, respectively (Figure 8C; Wu et al., 2006; Wang et al., 2009). The PC2 of annual mean SSH is well-correlated with the cumulative DA index, with a correlation coefficient of 0.67 at the 0.01 significance level. When DA is in positive phase, the pressure gradient between Eurasia and CAA drives wind anomaly towards the Fram Strait, causing a water mass transport from the Eurasian side to the Canadian side, resulting in SSH rising in the Canadian Basin and north of CAA and Greenland, and SSH descending in the Eurasian Basin and adjacent continental shelf seas. After removing the signals of EOF1 in Figure 6, the time series of residual SSH strongly correlates with the cumulative DA index (Figure 8D), with a pattern quite similar to EOF2 in Figure 8A. Compared with the results based on a high-resolution numerical simulation of Xiao et al. (2020), the dipole pattern of SSH obtained from ORAS5 is much closer to the SLP pattern of DA (Figure 8C) and the correlation between PC2 of SSH and cumulative DA index is higher, as Xiao et al. (2020) obtained a dipole pattern of SSH more focusing on the antiphase between the Canadian Basin and Eurasian Basin with a lower correlation to the cumulative DA index as well (0.56 at the 0.01 significance level). Instead of using cumulative values, we computed the correlation between PC2 of SSH with annual mean DA index. Our findings indicate a much weaker correlation coefficient (0.21 for annual mean DA index), providing further evidence for the long-lasting memory of the ocean to wind forcing.
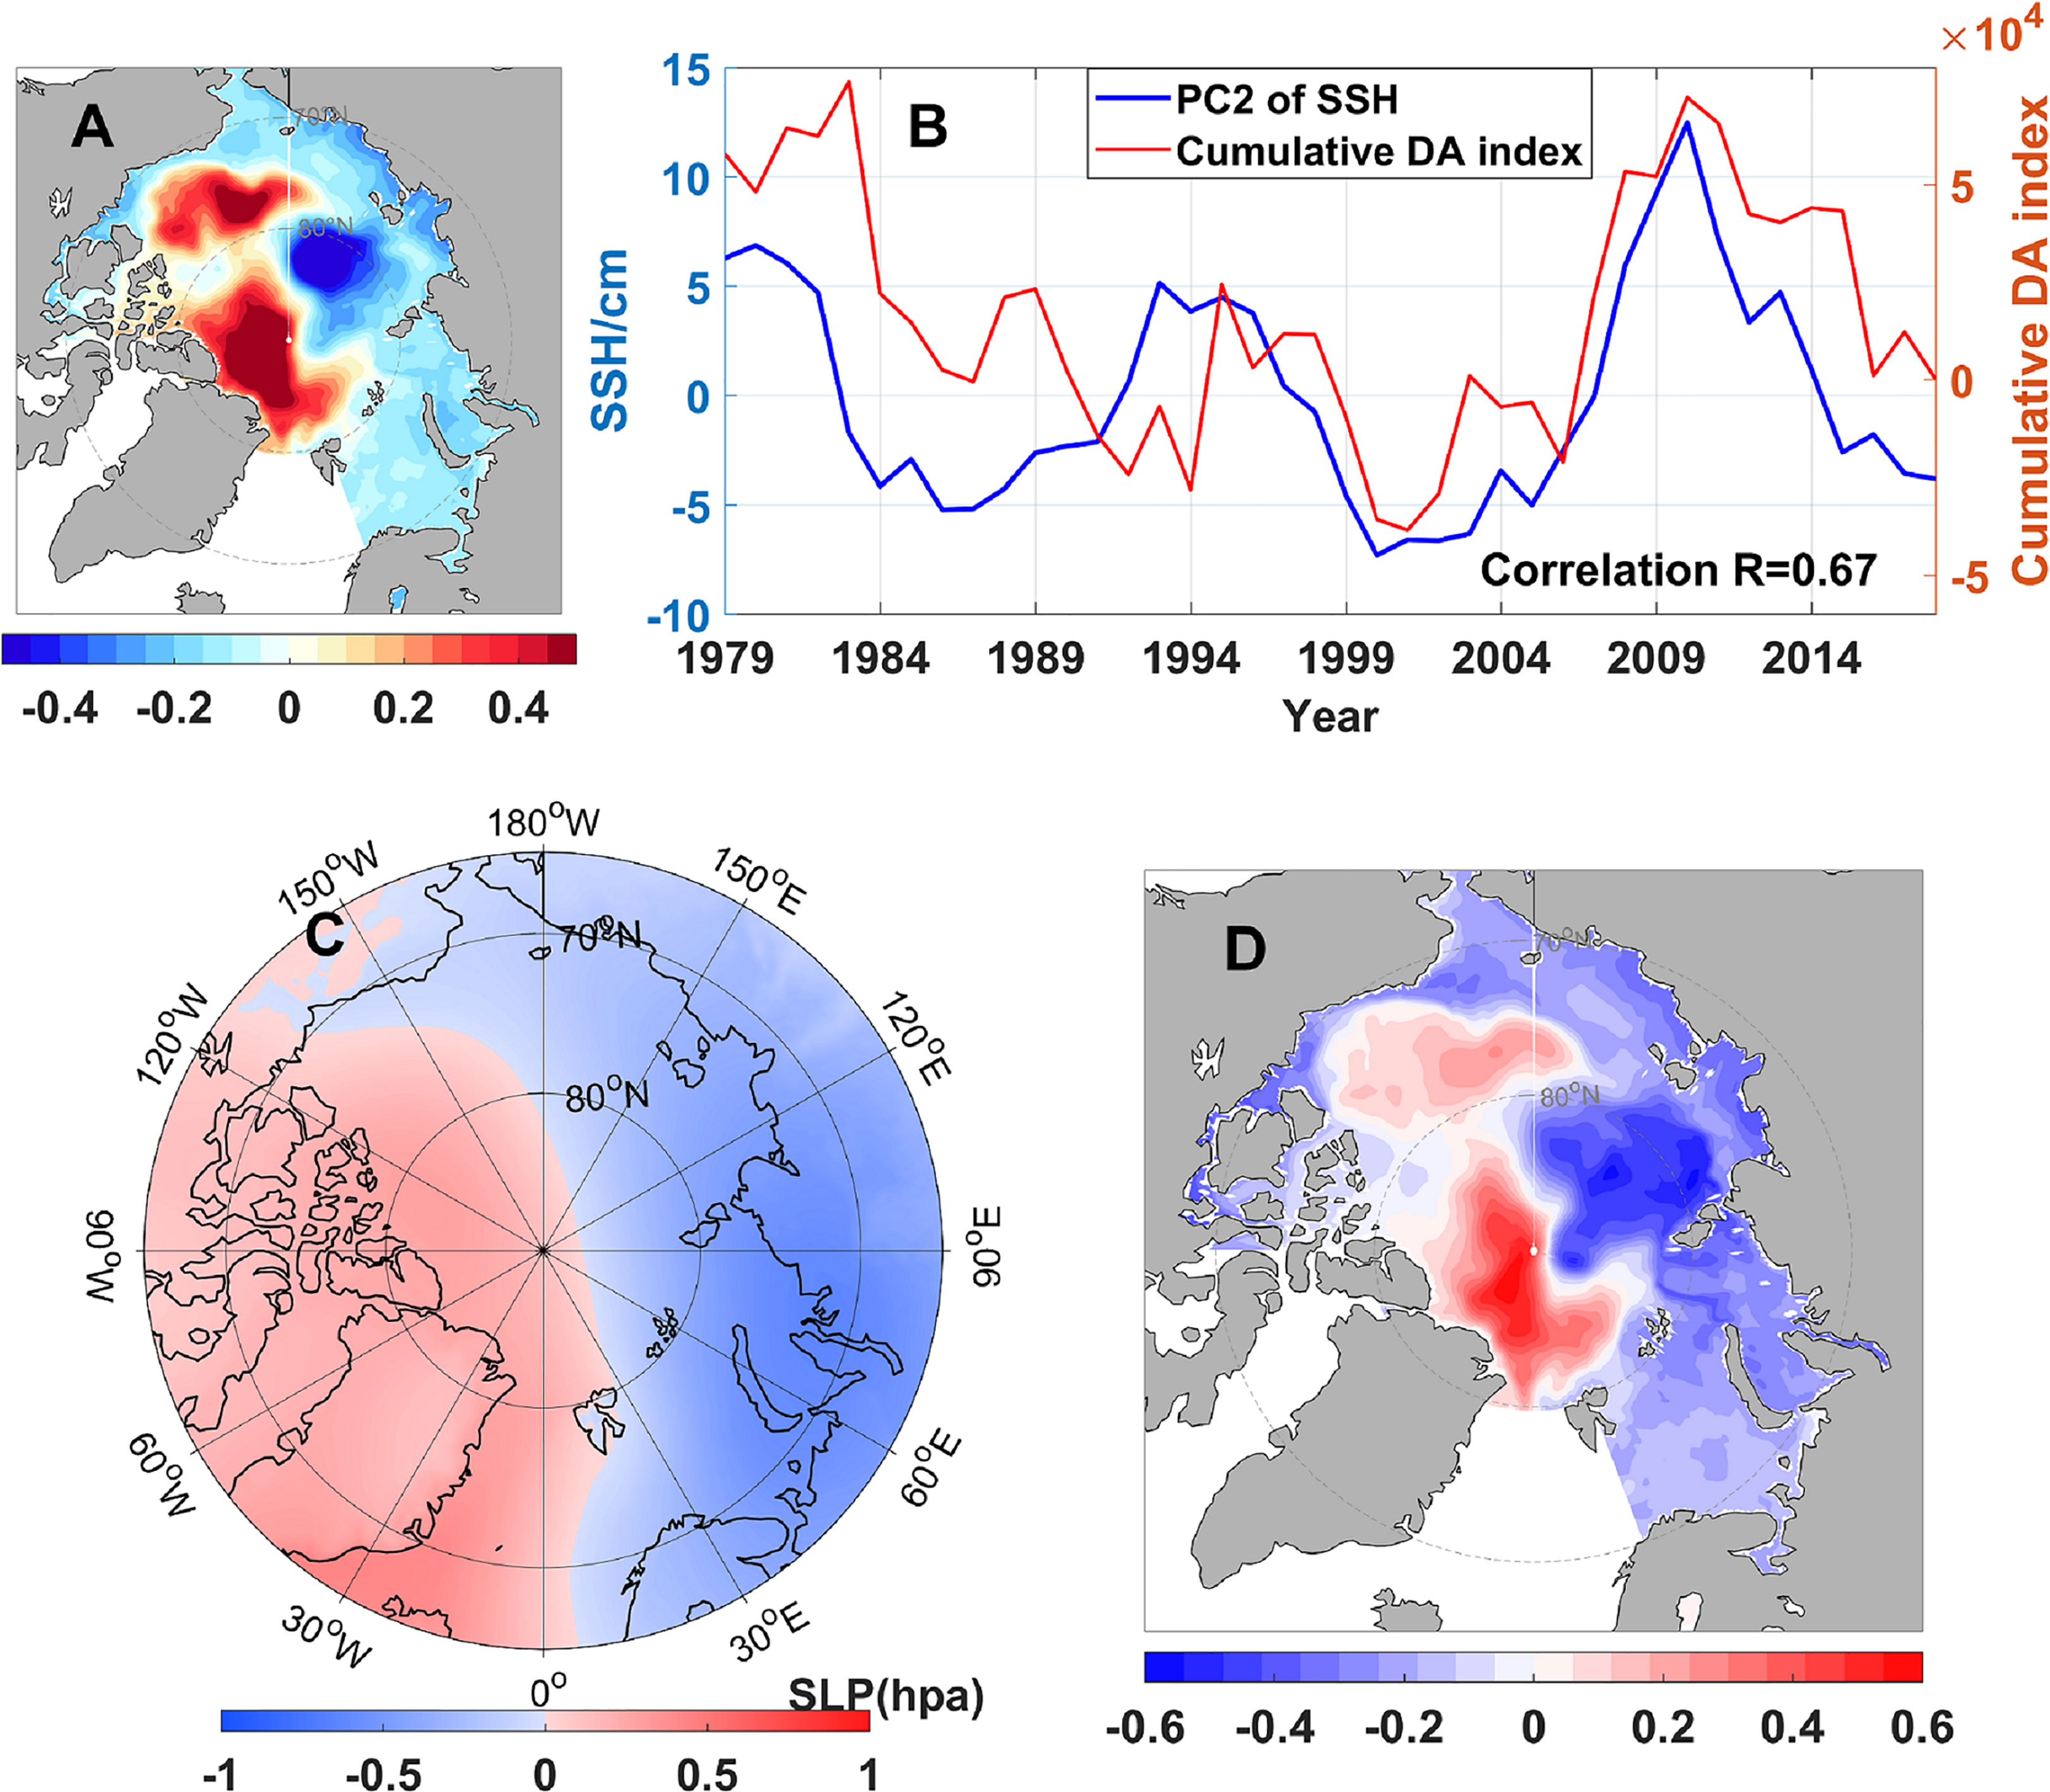
Figure 8 (A) EOF2 of the detrended annual-mean SSH in the Arctic Ocean. (B) Time series of PC2 (blue curve) and the cumulative DA index (red curve). (C) EOF2 of SLP in the Arctic Ocean. (D) The correlation between the cumulative DA index and SSH with EOF1 removed for the period 1979-2018.
The leading modes of annual mean SSH in the Arctic Ocean are generally strongly correlated with SLP modes, suggesting that atmospheric forcing is the primary driver of low-frequency sea level variability in this region. Previous studies have shown that anomalous atmospheric circulation associated with AO or DA can lead to changes in Ekman transport by sea surface winds, which can redistribute surface freshwater within the Arctic Ocean and alter water exchange between the Arctic Ocean and the Pacific and Atlantic Oceans (Wang et al., 2018a; Xiao et al., 2020). These changes ultimately cause fluctuations in SSH in the Arctic Ocean.
4.3 Decadal sea level trend in the Arctic Ocean
The radar altimeter observations suggest a significant sea level rise in the Canadian Basin of the Arctic Ocean since 1993, with the highest rate of up to 10-15 mm/yr occurring in the Beaufort Sea (Cheng et al., 2015; Carret et al., 2017). This sea level rise is attributed to liquid freshwater accumulation resulting from wind forcing, particularly when the AO shifts to negative phase in the early 2000s, as reported in previous studies (Giles et al., 2012; Wang et al., 2018a; Wang et al., 2019). Numerical simulations reveal that sea ice decline in the last two decades has significantly contributed to the liquid freshwater accumulation in the Beaufort Sea (Wang et al., 2018a; Xiao et al., 2020).
According to ORAS5 data, positive sea level trends occurred in almost all parts of the Arctic Ocean from 1979 to 2018 (Figure 9A). The Canadian Basin, extending to north of the CAA, experienced the fastest sea level rise, with the center of rise located in the Beaufort Sea, where the SSH rate can reach 9 mm/yr. In contrast, the Eurasian Basin had a weak sea level drop, with the largest drop occurring north of the Laptev Sea, where the rate of SSH is about -1.4 mm/yr. These sea level changes throughout the Arctic Ocean are consistent with AO-related atmospheric forcing. In most time of the 1979-2018 period, the cumulative AO index is negative, indicating that negative AO phase dominates in this period (Figure 6B). Previous studies have found that when AO is in negative phase, anomalous anticyclonic wind over the Arctic lead to more water flowing into the Arctic Ocean from the Pacific and Atlantic Oceans (Arthun et al., 2012; Woodgate et al., 2012; Asbjørnsen et al., 2020; Xiao et al., 2020), and this increasing of inflow will make the sea level of the Arctic Ocean rise. The rate of average SSH of the Arctic Ocean during this period is approximately 2.3 mm/yr, about 0.5 mm/yr larger than the rate of global mean sea level in the same period. This means that recent sea level trend in the Arctic Ocean also shows an effect of amplification. Due to the shallow water effect, it is expected that the Arctic sea level will continue to rise at a faster rate than the global mean sea level in the future (Griffies et al., 2014; Chen et al., 2021).
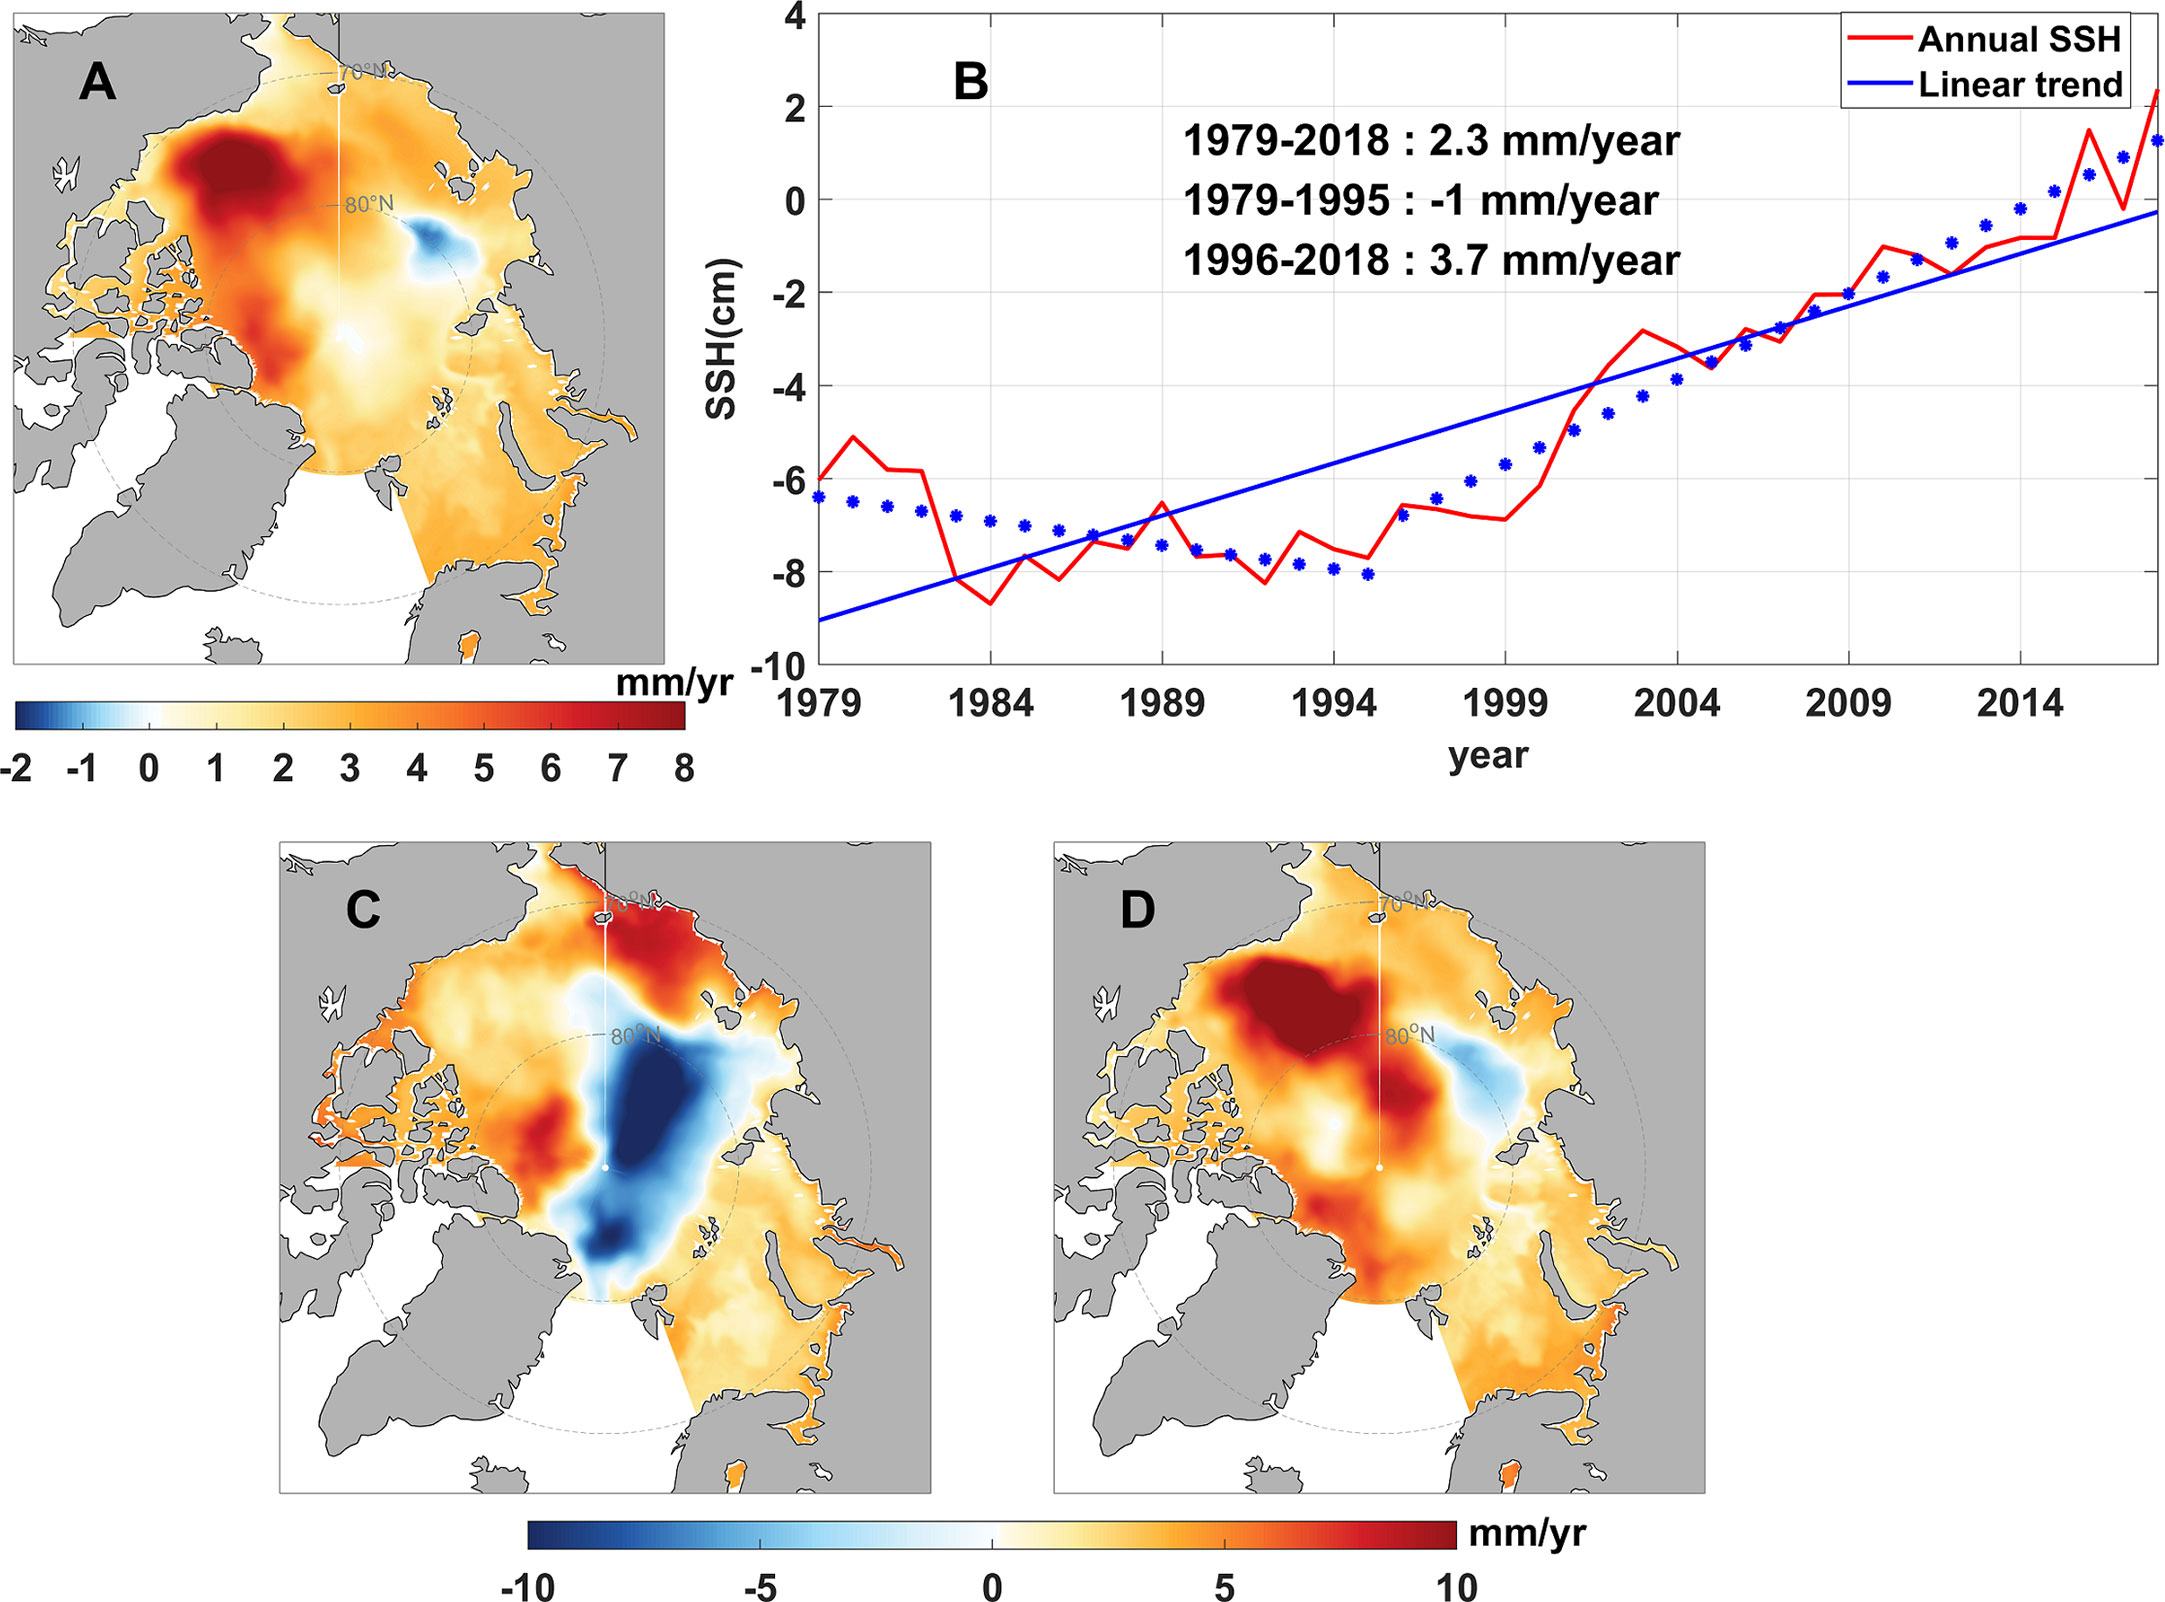
Figure 9 (A) Rate of SSH for 1979-2018 (mm/yr.). (B) Time series of annual mean (red curve) and linear trend (dashed and solid blue lines) of SSH averaged across the Arctic Ocean for 1979-2018. Rate of SSH for different periods (C) 1979-1995 and (D) 1996-2018.
The time series of average SSH of the Arctic Ocean indicates that the sea level began to rise in 1995 after reaching its lowest level with a rate of -1mm/yr since 1979. The rate of sea level rise since 1995 was 3.7 mm/yr, and 1995 is the turning point in the time series of PC1 (Figure 6B). The sea level trends in the Arctic Ocean display different spatial patterns before and after 1995. From 1979 to 1995, there was a significant sea level drop in the Eurasian Basin and Makarov Basin with the maximum rate approaching -12.2 mm/yr, while almost all other areas of the ocean experienced sea level rise, with the largest rise occurring in the East Siberian Sea and north of Ellesmere Island (Figure 9C). From 1996 to 2018, the spatial pattern of sea level trends was similar to that of 1979-2018, but with higher rate in sea level rise. The fastest sea level rise occurred in the Beaufort Gyre, with a rate of 15.9 mm/yr, providing significant evidence of rapid climate changes in the Arctic over the past three decades (Figure 9D). Figure 9B also shows that decadal variability dominated in the Arctic sea level change before the 2000s, whereas the trend of sea level rise became the most important feature afterwards. Similar characteristics have been found in the air temperature, sea ice extent and volume, liquid freshwater content, and other thermodynamic factors in the Arctic in previous studies (Kwok et al., 2009; Rabe et al., 2011; Giles et al., 2012; Stroeve et al., 2012; Laxon et al., 2013; Polyakov et al., 2013; Rabe et al., 2014; Haine et al., 2015; Proshutinsky et al., 2015; Armitage et al., 2016; Wang et al., 2019). These findings highlight the importance of sea level as an indicator of ocean climate in the Arctic region.
5 Conclusions
This study investigates the sea level variations of the Arctic Ocean from 1979 to 2018 using the latest ORAS5 reanalysis data with a spatial resolution of 0.25° on monthly intervals. The results demonstrate that the ORAS5 data effectively reproduces the spatial pattern and temporal evolution of SSH in the Arctic Ocean during the period of 2003-2014 when compared with validated satellite altimeter data.
The Arctic Ocean’s most striking feature in sea level variations is its seasonality, with large amplitude occurring along the coast of the Eurasian continent and the largest amplitude of 13 cm located on the coast of East Siberian Sea. EOF analysis reveals that the seasonal SSH variation has no phase difference across the entire Arctic Ocean, with the lowest SSH occurring in April and the highest SSH occurring in September. The seasonal cycle of SSH is consistent with changes in SLP and sea ice, with lags of one or two months due to the slow response of the ocean to external forcings.
Significant inter-annual variability of sea level is observed in the deep basins and some marginal seas of the Arctic Ocean, with the largest amplitude exceeding 10 cm located in the Beaufort Sea, comparable to the largest amplitude of seasonal variability along the coast of East Siberian Sea. The leading mode of low-frequency SSH variability shows a clear decadal antiphase oscillation of SSH between the deep basins and marginal seas, with a trend turning point in 1995. This mode is linked to the anomalous atmospheric forcing of AO, which alters the sea surface wind and drives anomalous cross-shelf Ekman transport, leading to opposing sea level anomalies between the Arctic shelf seas and deeper basins. Previous studies indicate that the Ekman transport anomaly leads to redistribution of liquid freshwater in the Arctic Ocean, causing regional SSH variations through halosteric changes. The second leading mode of low-frequency SSH variability exhibits antiphase SSH changes between the areas on the Eurasian side and CAA side of the Arctic Ocean on decadal timescales, which can be explained by the trans-basin mass transport caused by DA related surface wind forcing. The antiphase SSH pattern of this mode is not limited to the deep basins but displays opposite signals between the two parts of the Arctic Ocean under the forcing of anomalous atmospheric circulation of DA, which differs slightly from the conclusion of Xiao et al. (2020) based on the results of a high-resolution ocean-sea ice model.
Over the past four decades, sea levels have risen in almost every part of the Arctic Ocean, with a mean rise rate of 2.3 mm/yr between 1979 and 2018, slightly higher than the global average. The fastest sea level rise occurred in the Beaufort Sea, where satellite altimeters observed the most dramatic increase since the 1990s. The spatial pattern of sea level trends changed around 1995, a turning point found in the time series of the leading mode of low-frequency SSH variability. This suggests that decadal variability plays a crucial role in sea level trends for a limited time length. Prior to 1995, the Eurasian Basin experienced a dramatic drop in sea levels, with the largest rate reaching -12.2 mm/yr. However, other areas of the Arctic Ocean experienced sea level rise at varying rates. The spatial pattern of SSH trends since 1995 resembles the whole period of 1979-2018, except that the rates of sea level rise since 1995 are higher. This implies that sea level rise of the recent two decades dominates the sea level trend in the past four decades.
Using ORAS5 data of 1° resolution, we obtained slightly different EOF modes of annual mean SSH and significantly different correlations between the sea level PCs and climate variability indices. Meanwhile, we found differences between our results and those of Xiao et al. (2020), who studied low-frequency SSH changes using a high-resolution sea ice-ocean model in the Arctic Ocean. This suggests that the spatial resolution of data impacts the results. Additionally, the calculated AO and DA index may vary depending on whether winter, summer, or the whole year’s data is used, as well as the spatial domain. In this paper, we used SLP data for the whole year and selected the domain north of 64.5° N to calculate the AO and DA index, resulting in the best correlation between the changes of sea level and climate variability indices.
Data availability statement
The original contributions presented in the study are included in the article/supplementary material, further inquiries can be directed to the corresponding author.
Author contributions
YJ conducted the analysis of characteristics of the sea level variation in the Arctic Ocean, while MC performed the associated mechanism analyses. HY and TW assisted with data downloading, preprocessing and figure drawing. JY provided revision suggestions to the manuscript. MC and YJ co-wrote the manuscript. All authors contributed to the article and approved the final version.
Funding
The study is financially supported by the National Natural Science Foundation of China (Nos. 42076233 and 52271273).
Acknowledgments
We are very thankful to the European Centre for Medium-Range Weather Forecasts (ECMWF) for providing the ORAS5 reanalysis data and sea level pressure data of ERA5. The absolute dynamic topography data is provided by the Centre for Polar Observation and Modelling, University College London and the mean dynamic topography data is provided by Technical University of Denmark. Sea ice concentration data are from the National Snow and Ice Data Center. We thank the editor and two reviewers for their useful suggestions.
Conflict of interest
The authors declare that the research was conducted in the absence of any commercial or financial relationships that could be construed as a potential conflict of interest.
Publisher’s note
All claims expressed in this article are solely those of the authors and do not necessarily represent those of their affiliated organizations, or those of the publisher, the editors and the reviewers. Any product that may be evaluated in this article, or claim that may be made by its manufacturer, is not guaranteed or endorsed by the publisher.
References
Armitage T. W. K., Bacon S., Kwok R. (2018). Arctic Sea Level and surface circulation response to the Arctic oscillation. Geophys. Res. Lett. 45 (13), 6576–6584. doi: 10.1029/2018gl078386
Armitage T. W. K., Bacon S., Ridout A. L., Petty A. A., Wolbach S., Tsamados M. (2017). Arctic Ocean surface geostrophic circulation 2003–2014. Cryosphere 11 (4), 1767–1780. doi: 10.5194/tc-11-1767-2017
Armitage T. W. K., Bacon S., Ridout A. L., Thomas S. F., Aksenov Y., Wingham D. J. (2016). Arctic Sea surface height variability and change from satellite radar altimetry and GRACE 2003-2014. J. Geophys. Res.: Oceans 121 (6), 4303–4322. doi: 10.1002/2015jc011579
Arthun M., Eldevik T., Smedsrud L. H., Skagseth O., Ingvaldsen R. B. (2012). Quantifying the influence of Atlantic heat on barents Sea ice variability and retreat. J. Climate 25 (13), 4736–4743. doi: 10.1175/JCLI-D-11-00466.1
Asbjørnsen H., Årthun M., Skagseth Ø., Eldevik T. (2020). Mechanisms underlying recent Arctic atlantification. Geophys. Res. Lett. 47 (15), e2020GL088036. doi: 10.1029/2020gl088036
Carret A., Johannessen J. A., Andersen O. B., Ablain M., Prandi P., Blazquez A., et al. (2017). Arctic Sea Level during the satellite altimetry era. Surveys Geophys. 38 (1), 251–275. doi: 10.1007/s10712-016-9390-2
Cazenave A. (2020). Sea Level rise, from global to local. J. Geol. Soc. India 96 (1), 3–8. doi: 10.1007/s12594-020-1500-6
Chen C., Wang G., Yan Y., Luo F. (2021). Projected sea level rise on the continental shelves of the China seas and the dominance of mass contribution. Environ. Res. Lett. 16 (6), 064040. doi: 10.1088/1748-9326/abfdea
Cheng Y., Andersen O., Knudsen P. (2015). An improved 20-year Arctic ocean altimetric Sea level data record. Mar. Geodesy 38 (2), 146–162. doi: 10.1080/01490419.2014.954087
Church J., Clark P., Cazenave A., Gregory J., Unnikrishnan A. J. C. G. (2013). “Climate change 2013: the physical science basis,” in Contribution of working group I to the fifth assessment report of the intergovernmental panel on climate change. (New York: Cambridge University Press).
Dmitrenko I. A., Kirillov S. A., Tremblay L. B. (2008). The long-term and interannual variability of summer fresh water storage over the eastern Siberian shelf: implication for climatic change. J. Geophys. Res. 113 (C3), C03007. doi: 10.1029/2007jc004304
Fukumori I., Wang O., Llovel W., Fenty I., Forget G. (2015). A near-uniform fluctuation of ocean bottom pressure and sea level across the deep ocean basins of the Arctic ocean and the Nordic seas. Prog. Oceanogr. 134, 152–172. doi: 10.1016/j.pocean.2015.01.013
Giles K. A., Laxon S. W., Ridout A. L., Wingham D. J., Bacon S. (2012). Western Arctic Ocean freshwater storage increased by wind-driven spin-up of the Beaufort gyre. Nat. Geosci. 5 (3), 194–197. doi: 10.1038/NGEO1379
Griffies S. M., Yin J., Durack P. J., Goddard P., Bates S. C., Behrens E., et al. (2014). An assessment of global and regional sea level for years 1993-2007 in a suite of interannual CORE-II simulations. Ocean Model. 78, 35–89. doi: 10.1016/j.ocemod.2014.03.004
Haine T. W. N., Curry B., Gerdes R., Hansen E., Karcher M., Lee C., et al. (2015). Arctic Freshwater export: status, mechanisms, and prospects. Global Planetary Change 125, 13–35. doi: 10.1016/j.gloplacha.2014.11.013
Henry O., Prandi P., Llovel W., Cazenave A., Jevrejeva S., Stammer D., et al. (2012). Tide gauge-based sea level variations since 1950 along the Norwegian and Russian coasts of the Arctic ocean: contribution of the steric and mass components. J. Geophys. Res.: Oceans 117 (C6), n/a–n/a. doi: 10.1029/2011jc007706
Koldunov N. V., Serra N., Koehl A., Stammer D., Henry O., Cazenave A., et al. (2014). Multimodel simulations of Arctic ocean sea surface height variability in the period 1970-2009. J. Geophys. Research-Oceans 119 (12), 8936–8954. doi: 10.1002/2014JC010170
Kwok R., Cunningham G. F., Wensnahan M., Rigor I., Zwally H. J., Yi D. (2009). Thinning and volume loss of the Arctic ocean sea ice cover: 2003-2008. J. Geophys. Research-Oceans 114, C07005. doi: 10.1029/2009JC005312
Laxon S. W., Giles K. A., Ridout A. L., Wingham D. J., Willatt R., Cullen R., et al. (2013). CryoSat-2 estimates of Arctic sea ice thickness and volume. Geophys. Res. Lett. 40 (4), 732–737. doi: 10.1002/grl.50193
Legeais J.-F., Ablain M., Zawadzki L., Zuo H., Johannessen J. A., Scharffenberg M. G., et al. (2018). An improved and homogeneous altimeter sea level record from the ESA climate change initiative. Earth System Sci. Data 10 (1), 281–301. doi: 10.5194/essd-10-281-2018
Lyu G. K., Serra N., Zhou M., Stammer D. (2022). Arctic Sea level variability from high-resolution model simulations and implications for the Arctic observing system. Ocean Sci. 18 (1), 51–66. doi: 10.5194/os-18-51-2022
McPhee M. G., Proshutinsky A., Morison J. H., Steele M., Alkire M. B. (2009). Rapid change in freshwater content of the Arctic ocean. Geophys. Res. Lett. 36, L10602. doi: 10.1029/2009GL037525
Polyakov I. V., Beszczynska A., Carmack E. C., Dmitrenko I. A., Fahrbach E., Frolov I. E., et al. (2005). One more step toward a warmer Arctic. Geophys. Res. Lett. 32 (17), L17605. doi: 10.1029/2005GL023740
Polyakov I. V., Bhatt U. S., Walsh J. E., Abrahamsen E. P., Pnyushkov A. V., Wassmann P. F. (2013). Recent oceanic changes in the Arctic in the context of long-term observations. Ecol. Appl. 23 (8), 1745–1764. doi: 10.1890/11-0902.1
Prandi P., Ablain M., Cazenave A., Picot N. (2012). Sea Level variability in the Arctic ocean observed by satellite altimetry. Ocean Sci. Discuss. 9, 2375–2401. doi: 10.5194/osd-9-2375-2012
Proshutinsky A., Ashik I. M., Dvorkin E. N., Hakkinen S., Krishfield R. A., Peltier W. R. (2004). Secular sea level change in the Russian sector of the Arctic ocean. J. Geophys. Research-Oceans 109 (C3), C03042. doi: 10.1029/2003JC002007
Proshutinsky A., Ashik I., Haekkinen S., Hunke E., Krishfield R., Maltrud M., et al. (2007). Sea Level variability in the Arctic ocean from AOMIP models. J. Geophys. Research-Oceans 112 (C4), C04S08. doi: 10.1029/2006JC003916
Proshutinsky A., Dukhovskoy D., Timmermans M.-L., Krishfield R., Bamber J. L. (2015). Arctic Circulation regimes. Philos. Trans. R. Soc. A-Mathemat. Phys. Eng. Sci. 373 (2052), 20140160. doi: 10.1098/rsta.2014.0160
Proshutinsky A. Y., Johnson M. A. (1997). Two circulation regimes of the wind driven Arctic ocean. J. Geophys. Research-Oceans 102 (C6), 12493–12514. doi: 10.1029/97JC00738
Proshutinsky A., Kowalik Z. (2007). Preface to special section on Arctic ocean model intercomparison project (AOMIP) studies and results. J. Geophys. Research-Oceans 112 (C4), C04S01. doi: 10.1029/2006JC004017
Proshutinsky A., Krishfield R., Timmermans M.-L., Toole J., Carmack E., McLaughlin F., et al. (2009). Beaufort Gyre freshwater reservoir: state and variability from observations. J. Geophys. Research-Oceans 114, C00A10. doi: 10.1029/2008JC005104
Proshutinsky A., Pavlov V., Bourke R. H. (2001). Sea Level rise in the Arctic ocean. Geophys. Res. Lett. 28 (11), 2237–2240. doi: 10.1029/2000gl012760
Qiu B. (2002). Large-Scale variability in the midlatitude subtropical and subpolar north pacific ocean: observations and causes. J. Phys. Oceanogr. 32 (1), 353–375. doi: 10.1175/1520-0485(2002)032<0353:LSVITM>2.0.CO;2
Rabe B., Karcher M., Schauer U., Toole J.M., Krishfield R.A., Pisarev S., et al. (2011). An assessment of Arctic Ocean freshwater content changes from the 1990s to the 2006-2008 period. Deep-sea Research Part I: Oceanographic Research Papers 58(2), 173–185. doi: 10.1016/j.dsr.2010.12.002
Rabe B., Karcher M., Kauker F., Schauer U., Toole J. M., Krishfield R. A., et al. (2014). Arctic Ocean basin liquid freshwater storage trend 1992-2012. Geophys. Res. Lett. 41 (3), 961–968. doi: 10.1002/2013gl058121
Regan H. C., Lique C., Armitage T. W. K. (2019). The Beaufort gyre extent, shape, and location between 2003 and 2014 from satellite observations. J. Geophys. Research-Oceans 124 (2), 844–862. doi: 10.1029/2018JC014379
Richter K., Nilsen J. E. O., Drange H. (2012). Contributions to sea level variability along the Norwegian coast for 1960-2010. J. Geophys. Research-Oceans 117, C05038. doi: 10.1029/2011JC007826
Rignot E., Velicogna I., van den Broeke M. R., Monaghan A., Lenaerts J. (2011). Acceleration of the contribution of the Greenland and Antarctic ice sheets to sea level rise. Geophys. Res. Lett. 38, L05503. doi: 10.1029/2011GL046583
Serreze M. C., Barrett A. P., Stroeve J. C., Kindig D. N., Holland M. M. (2009). The emergence of surface-based Arctic amplification. Cryosphere 3 (1), 11–19. doi: 10.5194/tc-3-11-2009
Serreze M. C., Barry R. G. (2011). Processes and impacts of Arctic amplification: a research synthesis. Global Planetary Change 77 (1-2), 85–96. doi: 10.1016/j.gloplacha.2011.03.004
Shu Q., Wang Q., Arthun M., Wang S., Song Z., Zhang M., et al. (2022). Arctic Ocean amplification in a warming climate in CMIP6 models. Sci. Adv. 8 (30), eabn9755. doi: 10.1126/sciadv.abn9755
Stammer D., Cazenave A., Ponte R. M., Tamisiea M. E. (2013). Causes for contemporary regional Sea level changes. Ann. Rev. Mar. Sci. 5 (1), 21–46. doi: 10.1146/annurev-marine-121211-172406
Stroeve J. C., Kattsov V., Barrett A., Serreze M., Pavlova T., Holland M., et al. (2012). Trends in Arctic sea ice extent from CMIP5, CMIP3 and observations. Geophys. Res. Lett. 39, L16502. doi: 10.1029/2012GL052676
Thompson D. W. J., Wallace J. M. (1998). The Arctic oscillation signature in the wintertime geopotential height and temperature fields. Geophys. Res. Lett. 25 (9), 1297–1300. doi: 10.1029/98GL00950
Vihma T. (2014). Effects of Arctic Sea ice decline on weather and climate: a review. Surveys Geophys. 35 (5), 1175–1214. doi: 10.1007/s10712-014-9284-0
Volkov D. L., Landerer F. W. (2013). Nonseasonal fluctuations of the Arctic ocean mass observed by the GRACE satellites. J. Geophys. Research-Oceans 118 (12), 6451–6460. doi: 10.1002/2013JC009341
Wang Q., Danilov S., Mu L., Sidorenko D., Wekerle C. (2021). Lasting impact of winds on Arctic sea ice through the ocean’s memory. Cryosphere 15 (10), 4703–4725. doi: 10.5194/tc-15-4703-2021
Wang Q., Wekerle C., Danilov S., Koldunov N., Sidorenko D., Sein D., et al. (2018a). Arctic Sea Ice decline significantly contributed to the unprecedented liquid freshwater accumulation in the Beaufort gyre of the Arctic ocean. Geophys. Res. Lett. 45 (10), 4956–4964. doi: 10.1029/2018gl077901
Wang Q., Wekerle C., Danilov S., Sidorenko D., Koldunov N., Sein D., et al. (2019). Recent Sea ice decline did not significantly increase the total liquid freshwater content of the Arctic ocean. J. Climate 32 (1), 15–32. doi: 10.1175/jcli-d-18-0237.1
Wang Q., Wekerle C., Danilov S., Wang X., Jung T. (2018b). A 4.5 km resolution Arctic ocean simulation with the global multi-resolution model FESOM 1.4. Geoscientific Model. Dev. 11 (4), 1229–1255. doi: 10.5194/gmd-11-1229-2018
Wang J., Zhang J., Watanabe E., Ikeda M., Mizobata K., Walsh J. E., et al. (2009). Is the dipole anomaly a major driver to record lows in Arctic summer sea ice extent? Geophys. Res. Lett. 36 (5). doi: 10.1029/2008gl036706
Woodgate R. A., Weingartner T. J., Lindsay R. (2012). Observed increases in Bering strait oceanic fluxes from the pacific to the Arctic from 2001 to 2011 and their impacts on the Arctic ocean water column. Geophys. Res. Lett. 39. doi: 10.1029/2012GL054092
Wu B. Y., Wang J., Walsh J. E. (2006). Dipole anomaly in the winter Arctic atmosphere and its association with sea ice motion. J. Climate 19 (2), 210–225. doi: 10.1175/JCLI3619.1
Wunsch C., Ponte R. M., Heimbach P. (2007). Decadal trends in Sea level patterns: 1993–2004. J. Climate 20 (24), 5889–5911. doi: 10.1175/2007jcli1840.1
Keywords: Arctic Ocean, sea surface height, ORAS5, seasonal and low-frequency variability, decadal sea level trend
Citation: Jin Y, Chen M, Yan H, Wang T and Yang J (2023) Sea level variation in the Arctic Ocean since 1979 based on ORAS5 data. Front. Mar. Sci. 10:1197456. doi: 10.3389/fmars.2023.1197456
Received: 31 March 2023; Accepted: 08 May 2023;
Published: 25 May 2023.
Edited by:
Qing Xu, Ocean University of China, ChinaCopyright © 2023 Jin, Chen, Yan, Wang and Yang. This is an open-access article distributed under the terms of the Creative Commons Attribution License (CC BY). The use, distribution or reproduction in other forums is permitted, provided the original author(s) and the copyright owner(s) are credited and that the original publication in this journal is cited, in accordance with accepted academic practice. No use, distribution or reproduction is permitted which does not comply with these terms.
*Correspondence: Meixiang Chen, chenmeixiang@hhu.edu.cn