the Creative Commons Attribution 4.0 License.
the Creative Commons Attribution 4.0 License.
 | 23 May 2023
Annual emissions of carbon from land use, land-use change, and forestry from 1850 to 2020
Richard A. Houghton
Andrea Castanho
Estimates of the annual emissions of carbon from land use, land-use change, and forestry (LULUCF) are important for constructing global, regional, and national carbon budgets, which in turn help predict future rates of climate change and define potential strategies for mitigation. Here, we update a long-term (1850–2020) series of annual national carbon emissions resulting from LULUCF (https://doi.org/10.7910/DVN/U7GHRH, Houghton and Castanho, 2023), based largely, after 1960, on statistics of land use from the Food and Agriculture Organization (FAO) of the United Nations (http://www.fao.org/faostat/en/#data/, FAO, 2021). Those data suggest that rates of deforestation in the tropics (and thus net emissions of carbon) have decreased over the last 10 years (2011–2020). The data also indicate that the net loss of tropical forest area was greater than the net gain in agricultural lands, and we explore four alternative explanations for this apparent forest conversion, one of which is shifting cultivation. We also discuss how opposing trends in recent estimates of tropical deforestation (and emissions) might be reconciled. The calculated emissions of carbon attributable to LULUCF approximate the anthropogenic component of terrestrial carbon emissions, but limiting national carbon accounting to the anthropogenic component may also limit the potential for managing carbon on land.
- Article
(5127 KB) - Full-text XML
- BibTeX
- EndNote


The annual net exchanges of carbon between land and atmosphere are represented by two terms in the global carbon budget: one term for direct anthropogenic effects (i.e., management) and a second term for natural effects and indirect anthropogenic effects (e.g., the response of terrestrial ecosystems to environmental change) (Grassi et al., 2018; Friedlingstein et al., 2022). Quantifying the emissions for these two processes and separating them are important for determining whether indirect effects are changing, perhaps as a result of feedbacks between climate change and terrestrial carbon storage. Estimates of the emissions of carbon from both of these two processes, however, are variable and uncertain.
One surrogate for the emissions of carbon attributable to management is based on land use, land-use change, and forestry (LULUCF) (Watson et al., 2000). However, there are at least two different approaches for determining these emissions. The original approach was based on bookkeeping models (e.g., Houghton and Nassikas, 2017; Hansis et al., 2015; Gasser et al., 2020), which calculated the emissions resulting from the conversion of native ecosystems to agriculture (croplands and pastures) and from the harvest of wood from forests. They did not include all of the effects of management because they generally neglected the emissions from different management practices within agriculture (e.g., no-till cultivation, irrigation, erosion and redeposition of sediments; Naipal et al., 2018; Wang et al., 2017) and forestry (e.g., tree breeding, fertilizer use, and non-timber use of forests; Erb et al., 2013). The results from these bookkeeping models have been used to define the role of land management (ELUC) in the global carbon budget (Friedlingstein et al., 2022).
A second approach for estimating the emissions from LULUCF is the approach used by countries to define their national greenhouse gas inventories (NGHGIs) (Grassi et al., 2022). The approach was developed because of the difficulty of separating direct anthropogenic effects (e.g., land use) from indirect and natural effects (i.e., environmental effects). The method is based on the so-called “managed land proxy” (MLP). With this approach, countries count all of the emissions from land defined as managed, whereas they count none of the emissions from unmanaged lands. Thus, instead of separating processes (direct and indirect effects), the method separates areas (managed and unmanaged lands). Unfortunately, while there are no direct anthropogenic effects on unmanaged lands (by definition), there are indirect effects on managed lands. That is, environmental factors affect both managed and unmanaged lands. Thus, because indirect effects are currently responsible for a net removal of carbon from the atmosphere, the NGHGI technique produces lower estimates of emissions from LULUCF than the first, or original, approach.
The analysis described here is based on the first of these approaches. We update and improve an earlier analysis of emissions attributable to LULUCF (Houghton and Nassikas, 2017). It is important to note that the “improvements” described in this work have no objective benchmark against which they can be verified. There are no large-scale independent observations of the effects of direct anthropogenic management. We have improved the bookkeeping model (to be more consistent with harvesting practices, for example) and used more recent data for the calculations, but the true effects of management are not known.
The update and improvements consist of four steps. First, we improved the bookkeeping model's simulation of fuelwood and industrial wood harvest. We then extended the period of analysis to 2020, based largely on national data on land use from FAO (2021). Incorporating the recent data required more than adding the most recent 5 years (2016–2020), as FAOSTAT (FAO, 2021) incorporated data from the latest Global Forest Resources Assessment (FAO, 2020), which included revisions back to 1990. Third, we explicitly accounted for the apparent conversion of tropical forests to nonagricultural lands (i.e., lands that were neither croplands nor meadows and permanent pastures), as reported by FAOSTAT (FAO, 2021). This apparent conversion represents an error in land-use statistics, a real change in land use, or both. Possibilities of real change include temporary deforestation, increases in degraded (low-carbon) lands, and shifting cultivation, none of which are explicitly recognized as a land use by FAOSTAT (FAO, 2021). We calculated the emissions for all four of these alternative interpretations. Finally, we included newly published and updated estimates of the carbon emissions from peatlands in the Northern Hemisphere (Qiu et al., 2021) and in Southeast Asia (Randerson, 2013; Hooijer et al., 2010; Randerson et al., 2018).
Annual emissions of carbon from LULUCF were calculated with a bookkeeping model based on two types of data: activity data (rates of wood harvest and rates of land-use change) (Sect. 2.2) and per hectare effects of land-use change and harvest on carbon stocks () (Sect. 2.3).
2.1 Bookkeeping model
We used a bookkeeping model (Houghton and Nassikas, 2017) to calculate the annual net and gross emissions of carbon to and from the atmosphere as a result of LULUCF. Note that land use includes forestry and, to a limited extent, fire management. It does not include changes in agricultural management practices, except when new croplands and pastures are converted from native ecosystems. Land-use change includes the conversion of native ecosystems to croplands, pastures, and other non-forest lands, and the reversion of these land uses back to native ecosystems following abandonment.
The model is nonspatial. It uses national LULUCF data and calculates emissions for individual countries, but it does not use gridded data. Rather, the input data are annual rates of land-use change per country and cubic meters of wood harvested per country.
The overall purpose of the bookkeeping model is to track changes in carbon on every hectare of land affected by land use, land-use change, and forestry. Only lands experiencing LULUCF are included in the calculations. The effects of environmental change on lands either managed or unmanaged are excluded to the extent possible.
Each year a new age class of hectares is created in the model for each type of land use or land-use change in each type of ecosystem. Age classes either lose carbon annually (cropland newly converted from forest) or gain carbon annually (growing forest) until they reach a minimum soil carbon (croplands) or a maximum biomass carbon (mature forest) value (Fig. 1).
The changes in carbon stocks that take place as a result of land use and land-use change are prescribed in the model using response curves (Fig. 1; Sect. 2.3) for each type of ecosystem and each type of land use and land-use change. The prescribed, or fixed, nature of these per-hectare changes is what distinguishes this bookkeeping model from models based on physiological or ecological processes. Four pools of carbon are tracked: biomass (above- and belowground), slash (debris left on site at the time of management, such as twigs, branches, stumps, and roots), wood products (fuelwood, paper, pulp, and lumber), and soil organic carbon. Not all of the carbon lost to the atmosphere as a result of deforestation is lost in the year of deforestation; rather, this occurs over decades as a result of decay. Likewise, growing forests accumulate carbon for a century or more (see Sect. 2.3). Net and gross emissions of carbon to the atmosphere (and removals from the atmosphere) were calculated annually by summing the emissions from each hectare of each age class.
Burning and decay of organic matter as a result of LULUCF accounted for annual gross emissions of carbon, while growing forests recovering from harvest or agricultural abandonment removed carbon from the atmosphere. The model simulated annual age classes until an age class reached a new equilibrium, at which point no further loss of carbon occurred (e.g., in cultivated land) or no further gain of carbon occurred (e.g., in a mature forest).
The bookkeeping model was developed to calculate only direct anthropogenic effects, ignoring the effects of environmental change on stocks of carbon. That is, rates of forest growth and rates of decay () varied for different types of land use and land-use change and for different ecosystem types (the model included 20 ecosystem types), but they did not vary through time. The same rates of growth and decay applied in 1850 and 2020. Thus, the model calculated emissions from LULUCF as though the environment was constant. The approach could not completely eliminate the effects of environmental change because field data used to define changes in vegetation and soil (Sect. 2.3) were collected at different times during the last 50 years or so and, thus, included indirect effects. For example, increased rates of growth as a result of CO2 fertilization led the model to overestimate rates of forest growth in the past and to underestimate them in recent years.
Emissions of carbon from organic soils (burning and decay of peatlands as a result of management) were not explicitly included in the bookkeeping model, but they were added to the results based on independent studies (Randerson et al., 2018; Qiu et al., 2021).
We ran the model starting in 1700 but report emissions only after 1850 to avoid artificial emissions resulting from the model spin-up. For example, it took several decades for the pools of carbon in wood products and slash to reach equilibrium (inputs equal outputs). Similarly, it took approximately 150 years for the pools of carbon in age classes of growing forests to reach equilibrium. Rather than initializing the model with pool sizes and age classes specified in 1850, we spun up the model from 1700 so that these pools were in existence and approximately of the appropriate magnitude by 1850.
2.2 Changes in land use (rates of conversion, ha yr−1, and rates of wood harvest, m3 yr−1)
We considered the four major types of land use that FAOSTAT (FAO, 2021) reports: croplands, permanent meadows and pastures (hereafter referred to as pastures), forest land, and “other land”. The latter land-use type, other land, includes all lands that are neither agricultural nor forest land, such as urban lands, settlements, grasslands that were not grazed, rock, ice, and lands denuded by mining. The sum of areas in all four categories is equal to the total land area of a country, and other land is calculated as a residual to reach that total. We assumed that changes in these land uses from one year to the next are directly anthropogenic (i.e., a consequence of management decisions). Below, we discuss the possible exceptions to and implications of that general assumption.
We also considered forest management as a land use (i.e., the annual harvest of industrial wood and fuel wood; FAO, 2021). In the US, we included fire exclusion as an aspect of forest management that affects the carbon stocks of forests. Areas burned by wildfires were not obtained from the FAO but rather from the United States Department of Agriculture (USDA; 1926–1990). Fire management has been and is practiced elsewhere, but quantitative data detailing changes through time were not available for other countries, with the exception of peatland burning in Southeast Asian countries and Northern Hemisphere countries.
We reconstructed historical changes in land use for each country starting with the most recent information and working backwards in time. From 1990 to 2020, we used data from FAO (2021) for national areas comprising forest land, croplands, pastures, and other land. From 1961 to 1990, we used the same data for croplands and pastures, but data on forest area were not available from that source. Before 1961 (for croplands and pastures) and before 1990 (for forests), we used national statistics or the literature, where available, to quantify areas under different types of land use regimes. In the absence of such information, we extrapolated rates of change into the past in proportion to population growth. Thus, uncertainties in rates of LULUCF were greater before 1990 and greater still before 1961. Ironically, the variation among emissions estimates appears to be lower in the past compared with recent years, in part because rates of land-use change were lower in the past and in part because different studies presumably used similar assumptions in the absence of data (Houghton and Nassikas, 2017; Houghton, 2010).
Calculating rates of land-use change from FAOSTAT (FAO, 2021) data on land use was not a trivial exercise. We used changes in land area from one year to the next to determine rates of conversion among categories. For example, if forest area decreased by 1 ha and crop area increased by 1 ha, then we assigned 1 ha as converted from forest to crop. It is possible, however, that 2 ha was deforested and 1 ha was converted from crop to forest, thus yielding the same net change: 1 ha from forest to cropland. We underestimated the gross emissions and removals of carbon that would have resulted from gross changes in land use. The effect on net emissions is unclear, but some effect is likely as the emissions and removals associated with gross changes in land use are not necessarily symmetrical in time. For example, the rate of emissions from a hectare burned at the time of forest clearing is higher than the rate of carbon removal due to forest growth.
The relationship between annual changes in land-use categories (FAOSTAT; FAO, 2021) and rates of conversion between one category and another (land-use change) becomes more complex when net changes in area are reported for more than two categories. For example, if both forest and other land each decreased by 1 ha while cropland and pasture each increased by 1 ha, it was unclear how much forest area was converted to crop as opposed to pasture and how much other land was converted to either. Thus, we developed a series of rules to determine the translation of FAOSTAT data to annual rates of land-use change.
With these rules, a loss of forest was preferentially converted to cropland, then to pasture, and finally to other land to the extent that these categories increased in area. We explore the apparent conversion of forest to other land in more detail below (Sect. 2.4.3). We also smoothed annual rates with a 5-year running average to avoid large year-to-year variations in rates of land-use change. For example, large back-and-forth shifts between croplands and pastures were assumed to be artifacts of reporting.
The areas under cropland regimes are better documented through history than other land uses. Areas under permanent meadow and pasture regimes are less consistently defined, in large part because many lands that are grazed (rangelands) are neither meadows nor pastures.
With few exceptions (the USA, Europe, and South and Southeast Asia), national accounting of forest areas is not well documented historically. Thus, we generally reconstructed or extrapolated historical changes in forest areas backwards from the oldest available data into the past. Because the areas of different land uses are least well known for years before 1961, we adjusted the starting areas (1700) so as to end in 2020 with the areas of land use reported by FAOSTAT.
2.3 Changes in carbon per hectare as a result of LULUCF (response curves)
The stocks of carbon in vegetation and soils of different types of natural ecosystems were initially compiled from ecological and forestry literature. These values were assigned to modeled ecosystems in 1700. Houghton and Nassikas (2017) then adjusted those starting values of biomass so that the average forest biomass simulated in 2015 matched the estimates of average forest biomass per country reported by FAO (2015). We did not change those starting values. Median values of biomass by ecosystem type are shown in Appendix A.
Average soil carbon densities for the top meter of soil were assigned to natural ecosystem types so as to give regional averages that were consistent with regional variation as described by Schlesinger (1984) and Zinke et al. (1986) for major types of vegetation (Appendix A).
The changes in carbon stocks that took place as a result of land use and land-use change were prescribed in the model for each type of ecosystem and each type of land use and land-use change (Fig. 1). Rates of forest growth included a fast initial rate, followed by a slower rate that continued until the biomass “recovered” to its original level, after which growth stopped. These response curves of two linear rates were meant to approximate the declining rate of biomass accumulation during forest growth. The lower rate applied until about 75 % of the original biomass had recovered. Forests in the model were preferentially harvested at this 75 % recovery.
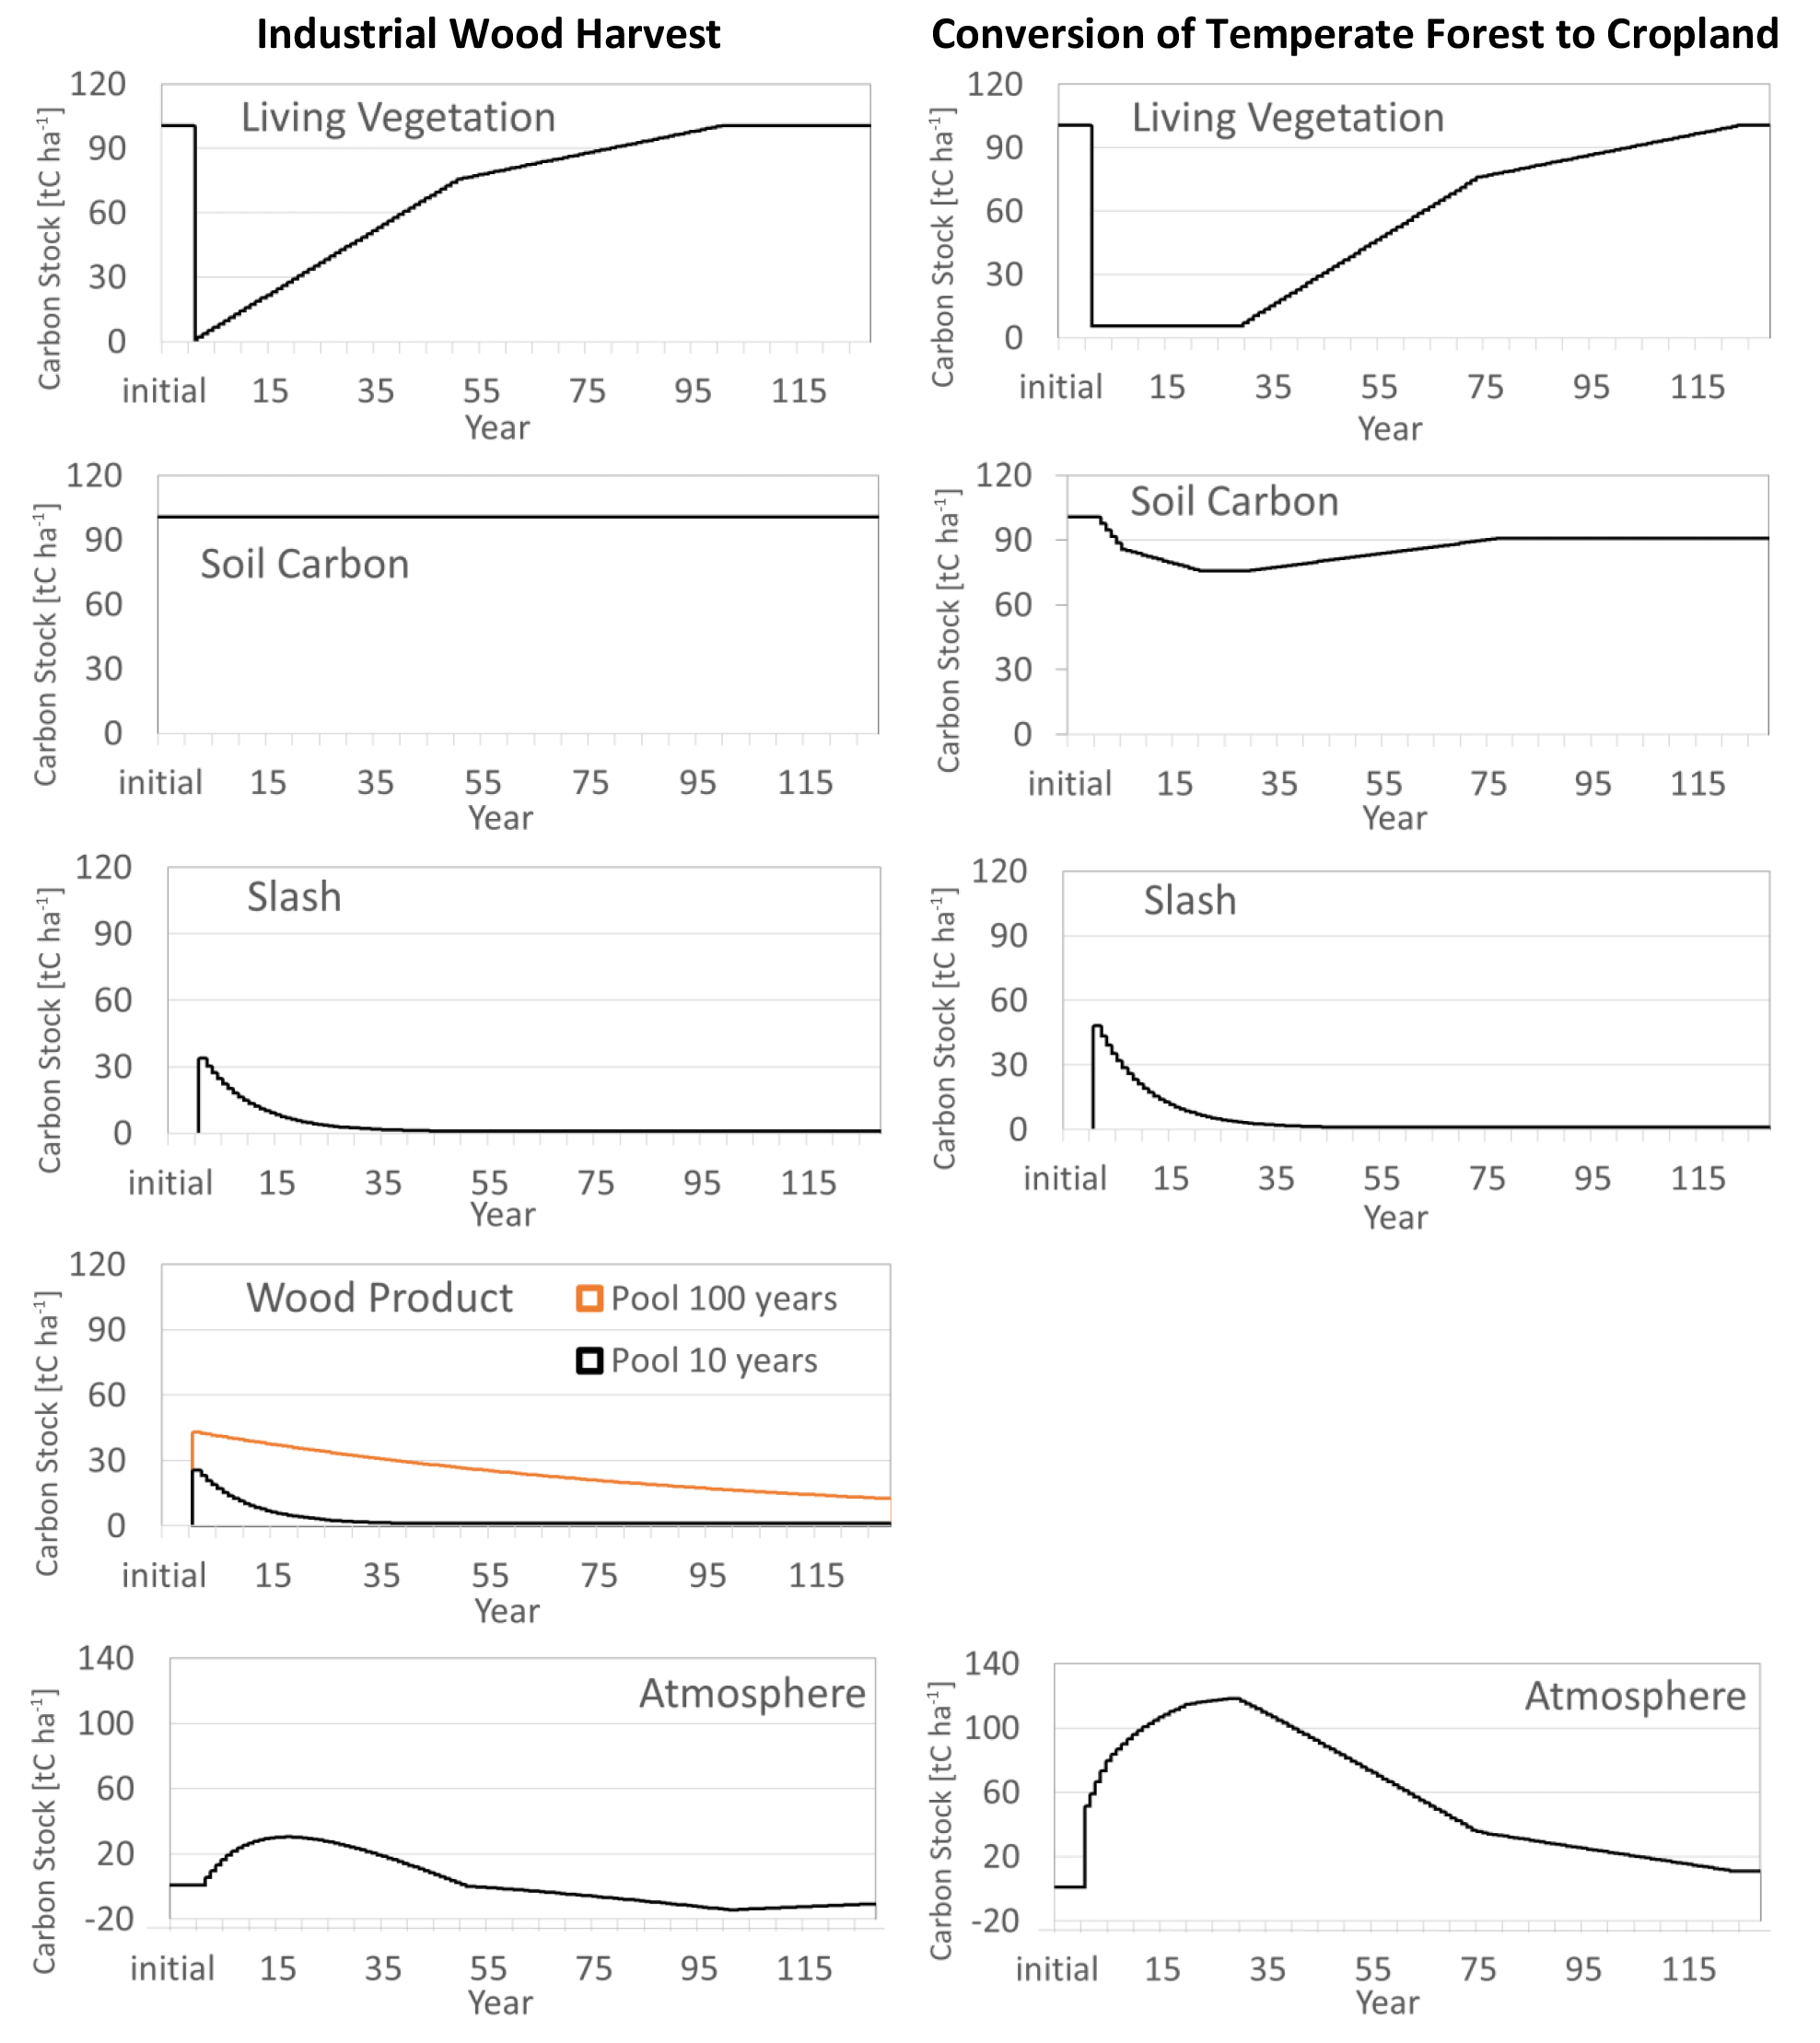
Figure 1Response curves showing the per-hectare changes in vegetation, soils, slash, and wood products as a result of management, in this case industrial wood harvest (left) and conversion of temperate forest to cropland (right), followed by abandonment. Change in soil carbon was not included in the harvest response curves because direct measurements are too variable to assign a reliable or consistent change. The bottom panels show the net emissions of carbon to the atmosphere as a result of annual changes in the four pools.
Similar response curves were used to define the rates of loss and accumulation of soil organic carbon following the cultivation of native soils and the abandonment of agriculture, respectively. Approximately 25 % of the organic carbon in the top meter of soil is lost with cultivation in a two-stage process approximating exponential decay (Detwiler, 1986; Schlesinger, 1986; Davidson and Ackerman, 1993; Post and Kwon, 2000; Johnson and Curtis, 2001; Guo and Gifford, 2002; Murty et al., 2002).
In addition to changing the carbon in vegetation and soil, management also generates slash (branches, twigs, leaves, stumps, and roots left on site after harvest and forest conversion) and wood products. Slash was assigned exponential decay rates in the model that varied with ecosystem type, and wood products were assigned to pools that decayed at rates of 1, 0.1, or 0.01 yr−1, corresponding roughly to fuelwood, paper and pulp, and lumber, respectively, which were obtained from FAOSTAT (FAO, 2021).
A set of four response curves defined the annual changes in carbon for each hectare cultivated, abandoned, or harvested. A different set of response curves was assigned for each type of land use and land-use change on each type of ecosystem. A total of 20 ecosystem types were included.
2.4 Updates included in this work
We incorporated the changes to Houghton and Nassikas (2017) into the four following steps:
-
In step 1, we improved the calculation of carbon emissions from wood harvest, using data from FAOSTAT (FAO, 2015) (Houghton and Nassikas, 2017).
-
In step 2, we updated and revised input to accommodate new data from FAOSTAT (FAO, 2021); this step included some historical adjustments as well.
-
In step 3, we treated the apparent conversion of forests to other land with four alternative assumptions. We also estimated the historical trajectory of this conversion before 1990 so that there was not an abrupt change when the FAO data on forest area first became available (FAO, 1993).
-
In step 4, we included other effects of management (peat drainage and burning in Southeast Asia and peatland use in the Northern Hemisphere)
Each of these steps is elaborated below.
2.4.1 Adjustments to the bookkeeping model for wood harvest – step 1
Two adjustments were made to the original code used by Houghton and Nassikas (2017). First, the code did not deliver the appropriate volume of wood products (from FAOSTAT; FAO, 2021) because some of the annual production had been assigned to slash. In the improved version, the total amount of wood products harvested was the amount specified by the FAO, and an additional amount of carbon was converted from biomass to slash.
The second adjustment reduced harvest intensity (Mg C ha−1) for secondary forests to account for the lower biomass in these forests. Thus, harvests were more representative of harvest practices. The improvement increased the areas of secondary forests harvested, thereby increasing the annual gross uptake of carbon in recovering forests.
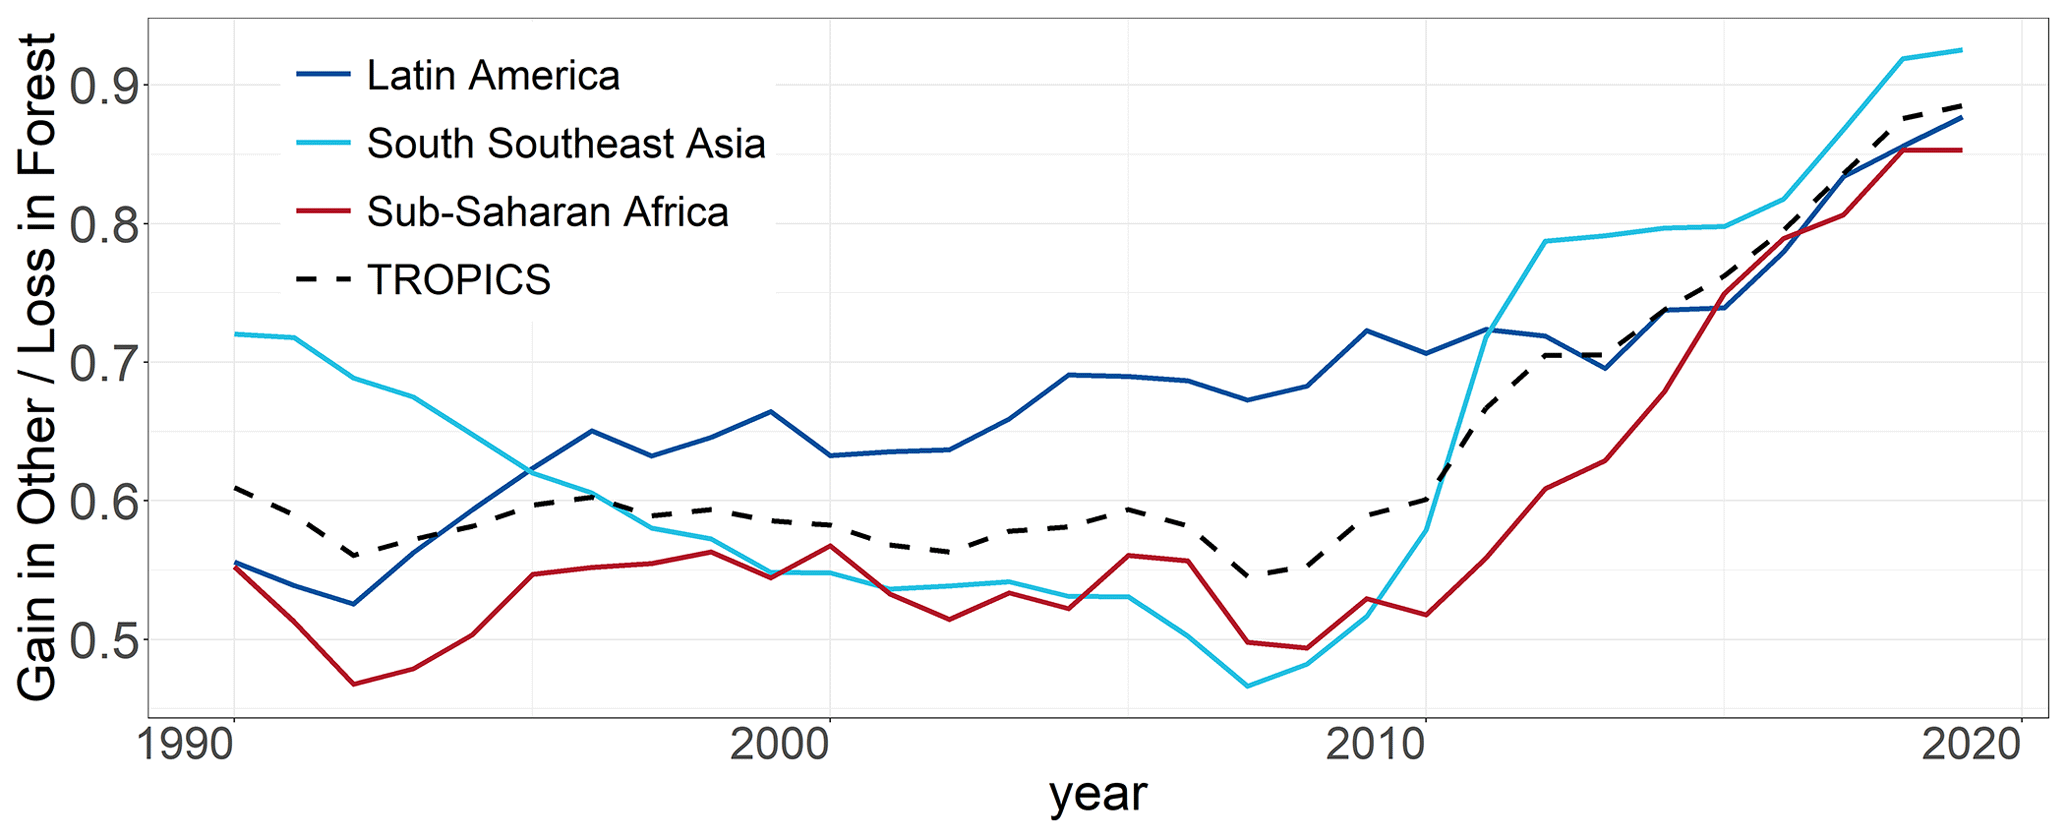
Figure 2The fraction of tropical deforestation that was apparently a forest conversion to other land (FCO). Data shown are 5-year running averages.
2.4.2 Incorporation of new data from the FAO – step 2
We used two data sources from the FAO to update the analyses to 2020. Every 5 years since 1990, the FAO has published a Global Forest Resources Assessment (FRA), with the latest being FRA 2020 (FAO, 2020). The FRA publications report the areas and biomass/carbon stocks of forests, country by country. Every year since 1960, FAOSTAT has reported the national areas of croplands and pastures. It also reports annual rates of harvest of industrial wood and fuelwood. We used the most recent FAOSTAT data (FAO, 2021), thereby accounting not only for additional years but also for revisions to earlier estimates. Table A1 provides more specific references for the FAO data that we used. Revised data from FRA 2020 and FAOSTAT (FAO, 2021) sometimes required that we revise pre-1990 estimates in order to avoid abrupt changes. Areas in forest land have been reported every 5 years since 1990, and we used 5-year running averages to smooth rates of land-use change reported by the FAO (2021). We also assumed that the rates for the 2015–2019 period continued in 2020.
For a few countries, we used sources of data other than from the FAO. For example, we used cropland areas from Liu and Tian (2010) from 1961 to 1995 for China, after which we used data from the FAO. Appendix B shows the differences between the two sources of data. For Russia, Ukraine, and Belarus, we used arable land from Schierhorn et al. (2013) to simulate a much larger abandonment of cropland after 1990 than reported by FAOSTAT (FAO, 2021). Then, after 2007, we expanded the area under a cropland regime as reported by Bartalev et al. (2016) and Prishchepov et al. (2012). For Kazakhstan, we used arable land from Kraemer et al. (2015), increasing it after 2000 until it matched data reported in FAOSTAT (FAO, 2021) (see Appendix B). These departures from FAOSTAT were the same as those used by Houghton and Nassikas (2017).
2.4.3 Alternative interpretations of forest conversion to other land – step 3
As discussed above (Sect. 2.2), FAOSTAT (FAO, 2021) has reported national areas under cropland, permanent meadow and pasture, and forest land regimes annually since 1990. However, the three classes of land use do not account for all land areas; therefore, a fourth class, other land, has been used by the FAO to account for other land uses and to ensure that the total area of all four classes sums to a country's total land area. Other land includes any lands that are not classified as cropland, permanent meadows and pasture, or forest. It can include un-grazed grasslands, shrublands, and deserts as well as anthropogenic lands, such as settlements and urban lands, lands affected by mining and energy extraction, and anything else that does not match the definitions of the first three categories. The problem with other land, from a carbon perspective, is that, without further information, its carbon density is unknown. This ambiguity creates a problem for carbon accounting when forests are converted to other land or when other land is converted to croplands. Actually, it is a potential problem even if the area of other land does not change. If shrublands were converted to urban areas, for example, the area reported to be in other land would not change, yet the carbon stocks would. We did not deal with this potential problem.
Here, we were particularly concerned with the observation that net losses of forest area exceeded net gains in agricultural area in many tropical countries. Forests were declining while other land was increasing. We explored the effects of four different interpretations of this apparent forest conversion to other land (FCO). Note that FCO is not a term reported in FAOSTAT (FAO, 2021); rather, it was inferred from the rules that we applied to the FAO data on land use to calculate annual rates of land-use change. This investigation of FCO became a major focus of this analysis.
The first interpretation of FCO was that the apparent loss of forest to other land was a statistical or accounting error. The data reported by countries are total areas of croplands, permanent meadows and pastures, forests, and other land. It is quite possible that areas were revised in one category without adjusting the others. There are two possibilities for error. The first likelihood is that the loss of forest might be overestimated and that, in reality, no forests were converted to other land. This error seems unlikely because FAOSTAT incorporates forest data from the latest FRA publication, which is systematically carried out and up to date. The second possibility is that the error might be in assigning deforestation to other land when, in reality, it was for agricultural land. For this interpretation, we implemented the reported deforestation rates but assigned deforestation to cropland rather than to other land.
However, what if FCO, or at least some fraction of it, represented a real change in land use? FCO has accounted for more tropical deforestation than agriculture, about 90 % of it after 2010 (Fig. 2). Furthermore, our estimate of FCO is minimal because our rules for handling the FAO data on land use assumed that forests were converted to croplands and pastures before they were converted to other land. Could errors really be that large and that biased (nearly always in the same direction)?
We explored the effect of three alternative interpretations of FCO in addition to error. The rationale for considering that the reported change might be real was based not only on its relative magnitude (Fig. 2) but also on the observation that changes in the areas under shifting cultivation, country by country (Heinimann et al., 2017), were (qualitatively) correlated with our calculation of FCO (as inferred from FAOSTAT; FAO, 2021). Tropical countries with increasing areas of shifting cultivation in the years from 2000 to 2015 matched those countries with high FCO values, whereas countries with less change or negative changes in the area of shifting cultivation matched countries with low or negative FCO values. Only 21 countries were evaluated by Heinimann et al. (2017), but the changes in shifting cultivation were consistent with the sign of FCO. Thus, the match seemed worth exploring.
Thus, the first interpretation of FCO as real was that forests apparently converted to other land were converted to shifting cultivation. FAO (2021) does not recognize shifting cultivation in its classifications of land; rather, it is included in cropland. Here, we considered it a particular type of cropland. We have used the interpretation previously (Houghton and Nassikas, 2018; Houghton and Hackler, 2006).
Traditional shifting cultivation is a special case for cropland. In this regime, the fallow period is longer than the period used for crops, and some tree cover persists. Typical fallow lengths are 2 to 25 years (Snedaker and Gamble, 1969; Harris, 1972; Betts et al., 2004; Turner et al., 1977), long enough for trees to recover, at least partially, and to accumulate carbon before the land is cleared again for cropping. We used fallow lengths of between 2 and 15 years, including the cropping that occurs in the first few years of each cycle.
Our definition of shifting cultivation is broad and includes more than traditional shifting cultivation. It refers to the repeated use of forests for temporary agriculture. Shifting cultivation, or swidden, was the most prevalent type of agriculture in the tropics “… well into the second half of the 20th century” (Van Vliet et al., 2012). It remains widespread today and was observed (around 2015) in 62 % of the 1∘ × 1∘ cells investigated with high-resolution satellite imagery in the humid and subhumid tropics (Heinimann et al., 2017). Most of it (nearly 80 %) was observed in the Americas and Africa. At present, the area of shifting cultivation is increasing in some regions, while it is decreasing or remaining stable in others (Van Vliet et al., 2012). Changes in both directions may occur within a single country (Heinimann et al., 2017).
For this shifting cultivation interpretation, we estimated areas and changes in areas as follows. First, we compared each country's area of other land in 1980 (based on our extrapolation of FAOSTAT data) with that country's area of forest fallow (shifting cultivation) in 1980 as reported by FAO/UNEP (1981). FAO/UNEP (1981) was an earlier Global Forest Resources Assessment but is not consistent with recent (1990–2020) assessments and, thus, is of greater uncertainty. The latest FRA publications no longer report changes in forest area before 1990. Nevertheless, these estimates of forest fallow represent one of the only tropics-wide estimates of shifting cultivation in existence. In our comparison of other land with forest fallows in 1980, many countries had areas classified as other land that were large enough to accommodate the fallow areas, and thus we were able to assign a land area to shifting cultivation. In other tropical countries, the 1980 estimate of fallow area was larger than the area classified as other land. In these cases, we lowered the fallow area given by FAO/UNEP (1981) to match the area of other land. The area classified as other land was constrained by changes in forests, croplands, and pastures, and, thus, could not be increased. With this approach, we obtained a fallow area of 277 × 106 ha in 1980, somewhat more than half of the FAO/UNEP (1981) estimate of 456 × 106 ha but within the range of previous studies (260 × 106 to 450 × 106 ha (Silva et al., 2011; Van Vliet et al., 2012; Heinimann et al., 2017; FAO/UNEP, 1981; Lanly, 1982).
Annual increases (or decreases) in shifting cultivation were based on FCO between 1990 and 2020 and were estimated to remain a constant fraction of other land for prior years (1700 to 1980). A less uncertain reconstruction is difficult because the areas are not well known. A greater number of people might be supported by either a larger area under a shifting cultivation regime or a shortened length of fallow; however, neither of these variables is known for most regions (Ickowitz, 2006). We used the qualitative estimates of experts (in Heinimann et al., 2017) to help define where shifting cultivation was increasing or decreasing before 1970. Negative values of FCO indicated an abandonment of shifting cultivation to forest.
For the second interpretation of FCO as real, we assumed that it represented the conversion of forests to new croplands, and, at the same time, the abandonment of an equivalent area of croplands to other land (in this case unproductive or degraded croplands). The abandoned croplands had low amounts of carbon in vegetation and soils, and they did not accumulate more after they were abandoned. In this interpretation, labeled degraded, there was a net loss of forest area, no change in cropland area, and an increase in other land. The increase in other land could just as well include mining or energy extraction activities as well as the degradation of croplands. Note that degraded cropland is not a term used by FAOSTAT (FAO, 2021); it is simply our label for identifying a possible interpretation of FCO, which we inferred from the FAO data (FAOSTAT; FAO, 2021). Note also that this interpretation has effectively the same effect on carbon storage as attributing FCO to an error in the reported area of croplands.
In a third interpretation, labeled recovering, we again assumed that forests were converted to croplands and that an equivalent area of croplands was abandoned; however, in this case, the abandoned croplands began growing back to forests after an interval of 15 years. The value of 15 was arbitrarily chosen to represent a long fallow. This recovering scenario was the one used by Houghton and Nassikas (2017) instead of shifting cultivation. We note that it is inconsistent with data from FAOSTAT because the area of forests increases after 15 years of abandonment.
To summarize, the degraded, shifting cultivation, and recovering interpretations of FCO may be described as alternatives leading to high, medium, and low emissions, respectively, based on their long-term effects on biomass (Fig. 3). As mentioned above, the possibility that FCO is a statistical error is essentially the same as the degraded interpretation, i.e., forest converted to cropland. Thus, there are four interpretations, yet only three estimates are reported here.
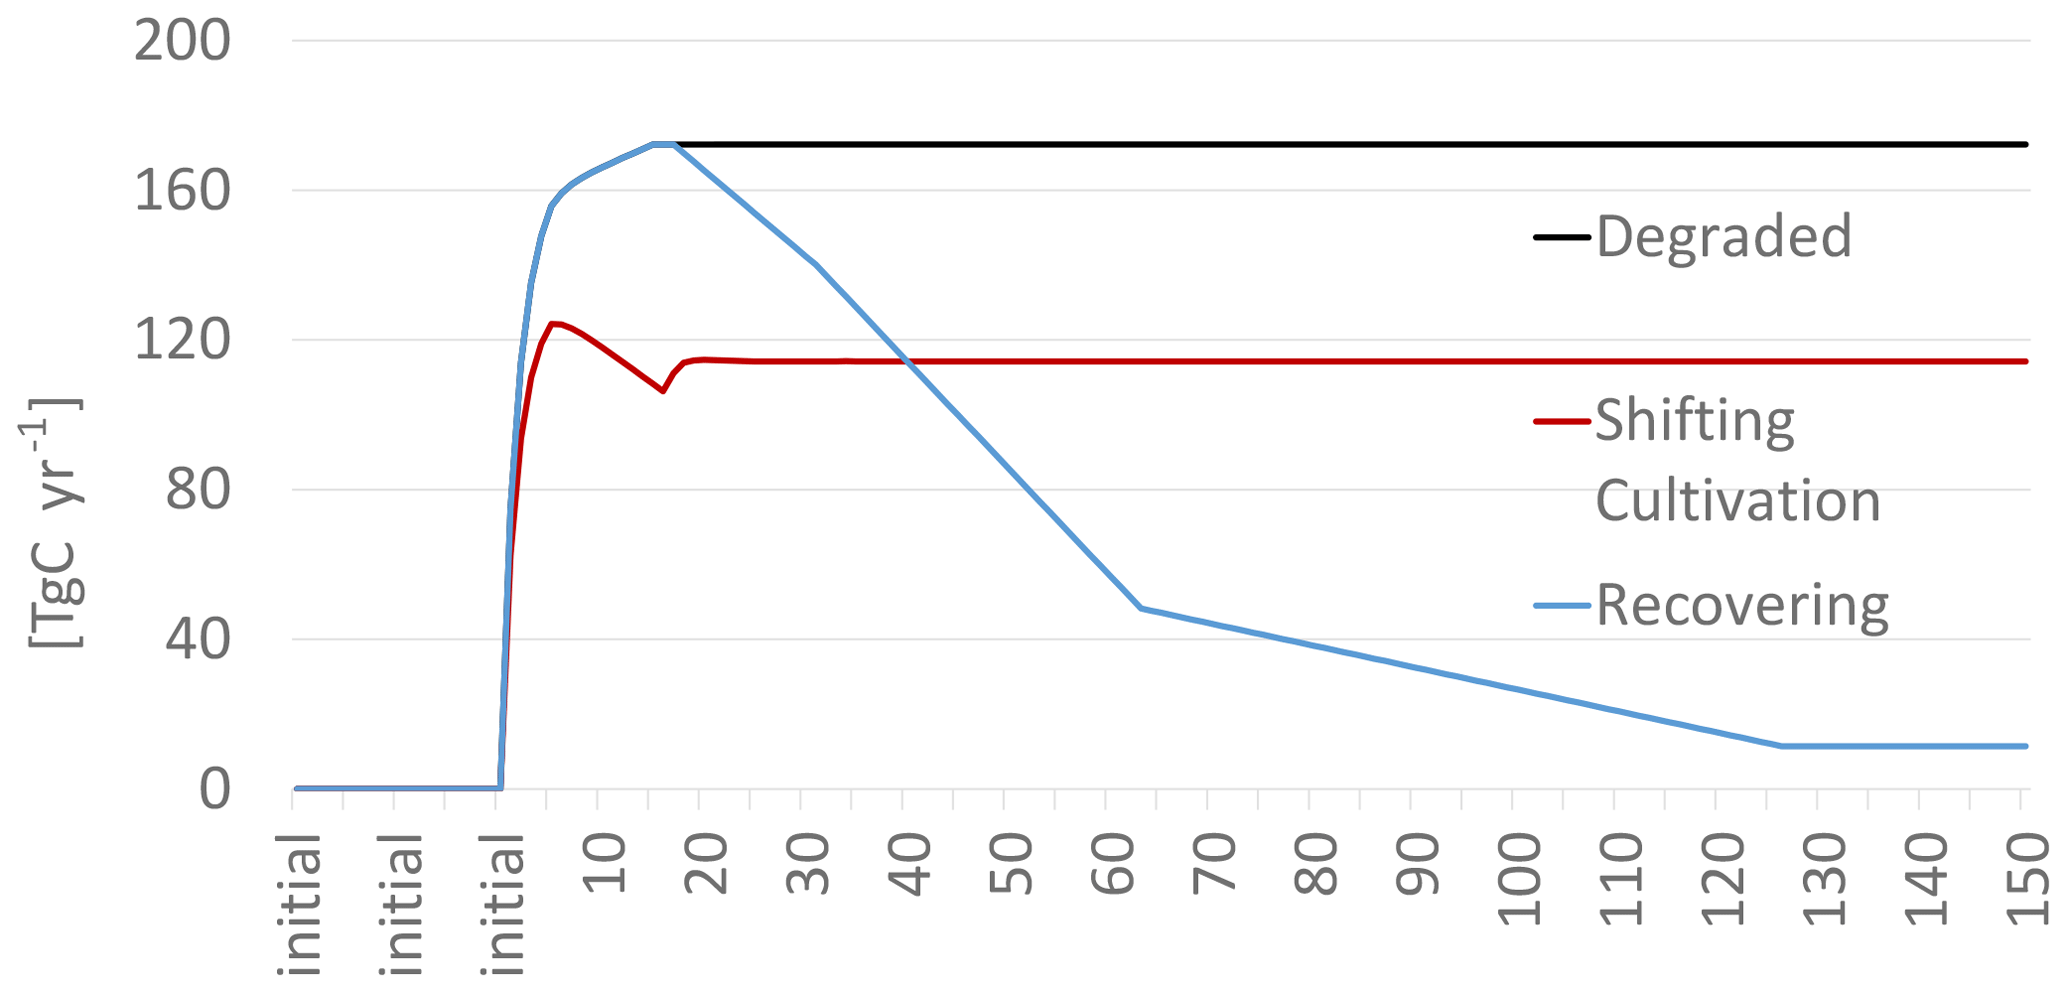
Figure 3Cumulative net emissions of carbon on a hectare of land under three different changes in land use: forest converted to degraded cropland (degraded), forest converted to shifting cultivation (shifting cultivation), and forest converted to cropland for 15 years and then allowed to recover (recovering).
2.4.4 The draining and burning of peatlands – step 4
Because our bookkeeping model did not calculate the changes in peatland soils from the use, draining, and burning of peat, we used published estimates to supplement the fluxes calculated here. In the tropics, we used the emissions from burning peatlands reported in version 4 of the Global Fire Emissions Database (GFED4) (Randerson, 2013; Randerson et al., 2018) and the emissions from draining peatlands reported by Hooijer et al. (2010); we then extrapolated these emissions to the present. The approach was the same as that reported by Houghton and Nassikas (2017). The draining and burning of peatlands was not significant before 1980 and has increased in importance since then (Hooijer et al., 2010; Hooijer et al., 2012; Field et al., 2009). Outside the tropics, we used the estimates of carbon loss from peatland use and draining reported recently by Qiu et al. (2021).
We note that the FAO also reports national emissions of carbon from drained and burned peatlands (Conchedda and Tubiello, 2020; Rossi et al., 2016). We did not use these estimates because they begin only in 1990 and because they differed so much, country by country, from the estimates by Qiu et al. (2021). It is beyond the scope of this study to explore reasons for this variability, but these emissions are clearly a major uncertainty in emissions from LULUCF.
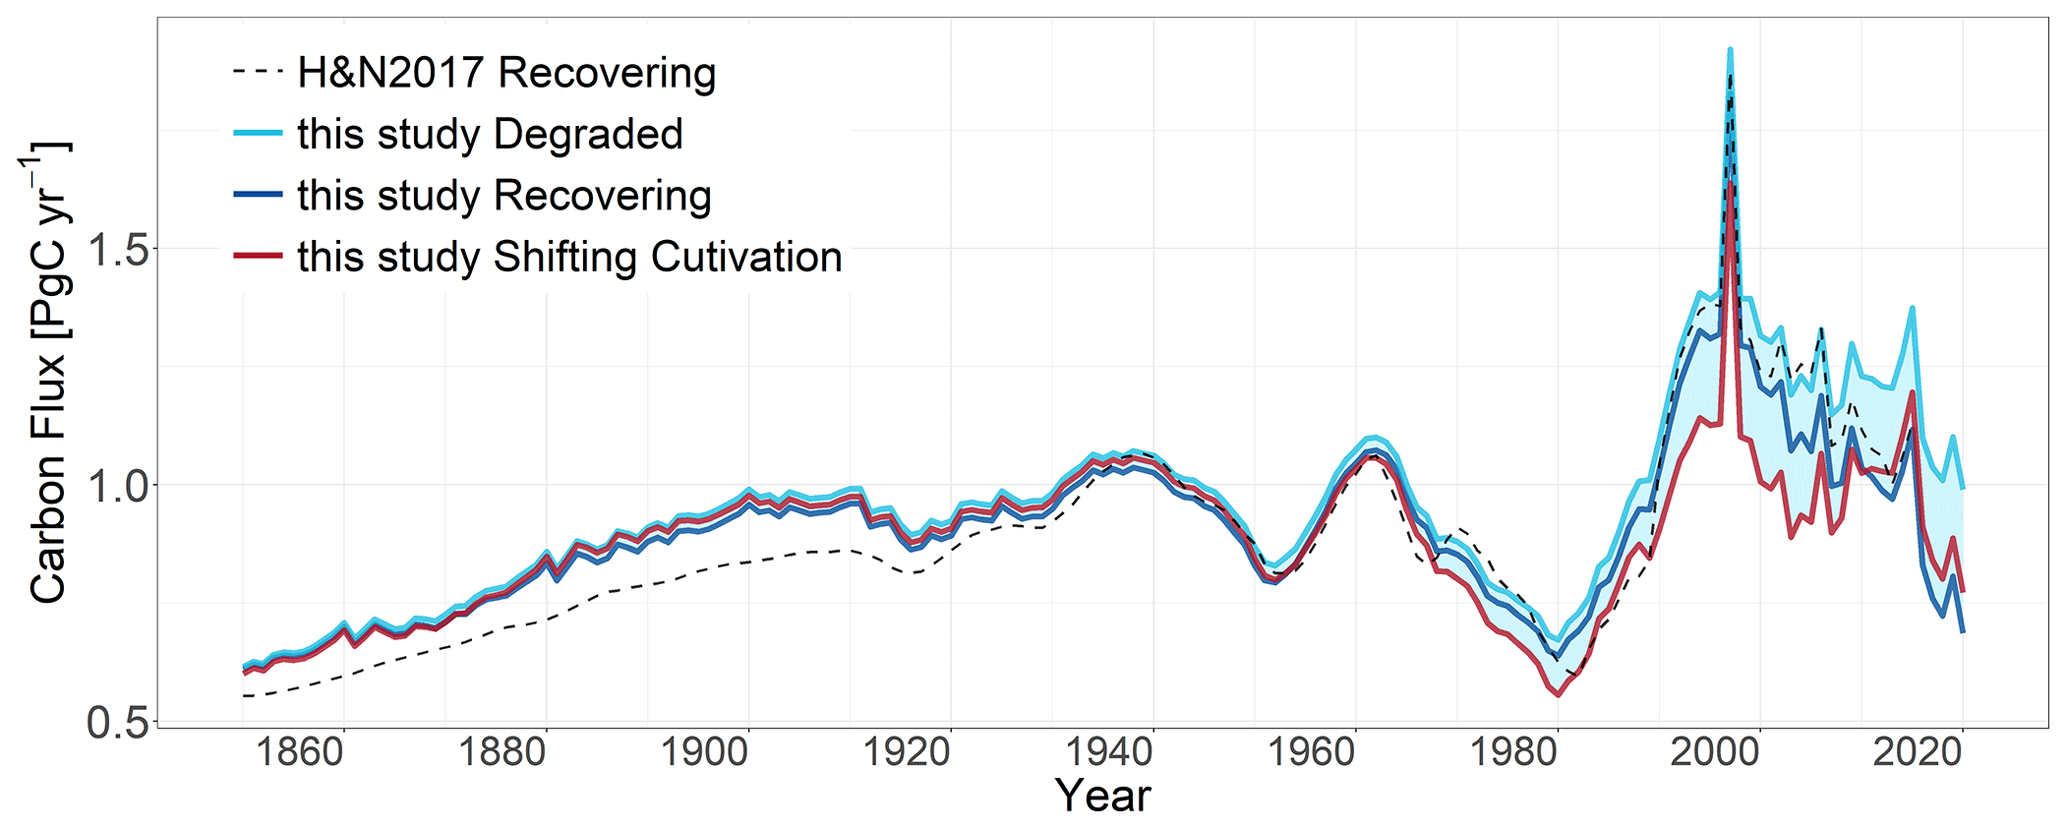
Figure 4Annual net emissions of carbon from LULUCF including emissions from peatlands. The red line refers to the analysis including shifting cultivation. The shaded area indicates the range of emissions from alternative interpretations of forest loss to other land in the tropics (see Sect. 3.3). The dashed black line refers to Houghton and Nassikas (2017), denoted using H&N2017. This figure incorporates the results from all four steps or revisions, using the shifting cultivation interpretation of FCO.
Table 1Total net emissions from LULUCF for the globe, the non-tropics, and the tropics for the period from 1850 to 2020 (or to 2015 for comparison with Houghton and Nassikas, 2017). Note that Houghton and Nassikas (2017), denoted using H&N2017 in the table, did not include shifting cultivation, but they did include what is here called “recovering”.

SSEA refers to South and Southeast Asia.
The four steps to revising the model and input data produced estimates of global emissions from LULUCF over the period from 1850 to 2015 that were surprisingly similar to the results reported 5 years ago (Fig. 4, Table 1; Houghton and Nassikas, 2017). The similarity, however, resulted from offsetting differences from the revisions. Below, we present the effects of the four respective steps outlined in Sect. 2. We do this cumulatively, such that the results from each step are incorporated into subsequent steps.
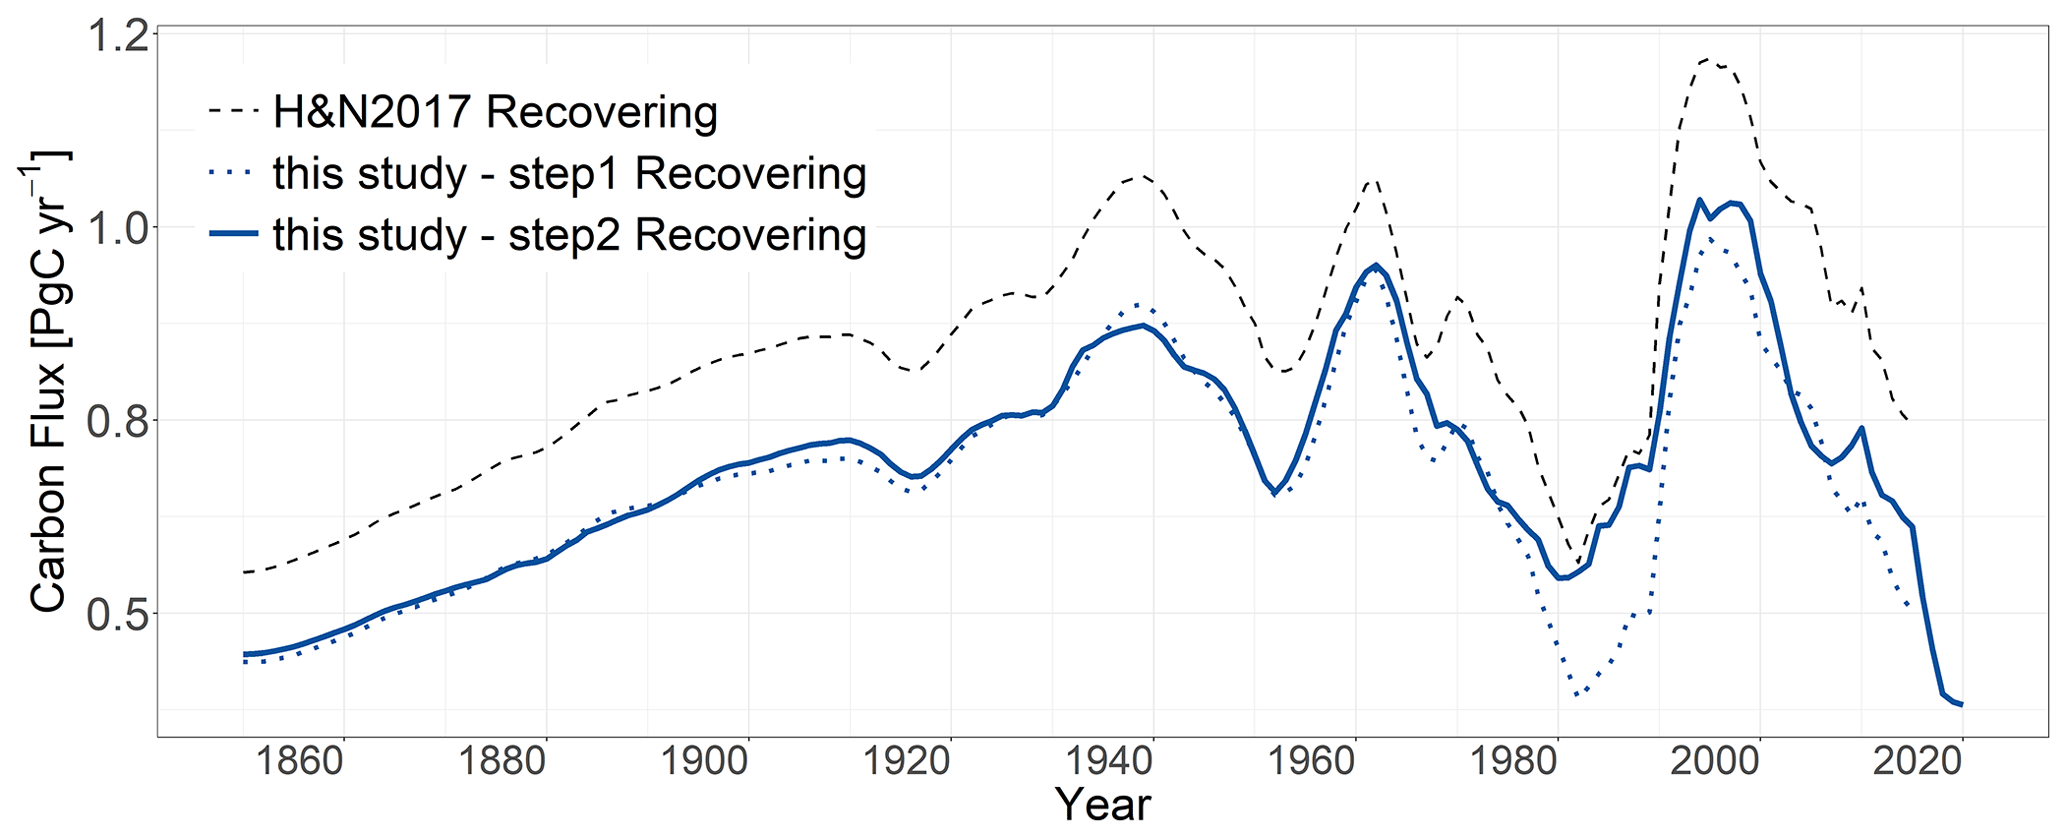
Figure 5Annual net emissions of carbon from LULUCF, excluding emissions from peatlands. Improvements to the model (step 1; dotted line) lowered estimated emissions from those reported by Houghton and Nassikas (2017), denoted using H&N2017. Updated data from FAOSTAT (FAO, 2021) (step 2; solid line) increased emissions slightly. All analyses were based on the recovering interpretation of FCO for comparison with Houghton and Nassikas (2017).
3.1 Adjustments to the bookkeeping model for wood harvest
Adjustments to the code to account for (1) the fraction of harvest that becomes slash instead of wood product and (2) the larger area required for secondary forests to provide the same volume of harvested wood as primary forests had offsetting effects; however, together, the adjustments led to lower emissions (Fig. 5). Accounting for slash increased the emissions from harvest, but harvesting a greater area of secondary forests had a greater effect on increasing the area of secondary forests and, thus, the gross sinks. The adjustments lowered the net flux throughout the period from 1850 to 2015: 112 Pg C after adjustment, compared with the original total of 139 Pg C (not counting peat emissions) (Table 1; Houghton and Nassikas, 2017).
3.2 Incorporation of new data from FAOSTAT (FAO, 2021)
The “new” data from FAOSTAT (FAO, 2021) were largely land-use data for the last 5 years (2016–2020), but they included some revisions before 2016. Furthermore, we included revisions that we made to estimated areas of land use before 1990 in order to avoid abrupt transitions in rates of land-use change. Use of these new and revised data increased the cumulative net emissions little: from 112 to 116 Pg C for the period from 1850 to 2015 (Table 1). The addition of the last 5 years added another 2 Pg C to this total (118 Pg C for 1850–2020, not counting emissions from peatlands). The greatest effect of incorporating new data from FAOSTAT (FAO, 2021) occurred in the tropics, increasing net emissions during the 1980s to the 1990s (Fig. 5).
3.3 Alternative interpretations of the conversion of forest to other land
As discussed above, the annual loss of forest area in many tropical countries exceeded the gain in agricultural lands and resulted in a gain in other land (FAO, 2021). We called this apparent conversion forests converted to other land (FCO). We calculated the emissions for four alternative interpretations of this new other land: (1) error in reported cropland area; (2) shifting cultivation, including fallow; (3) degraded land; and (4) recovering forest.
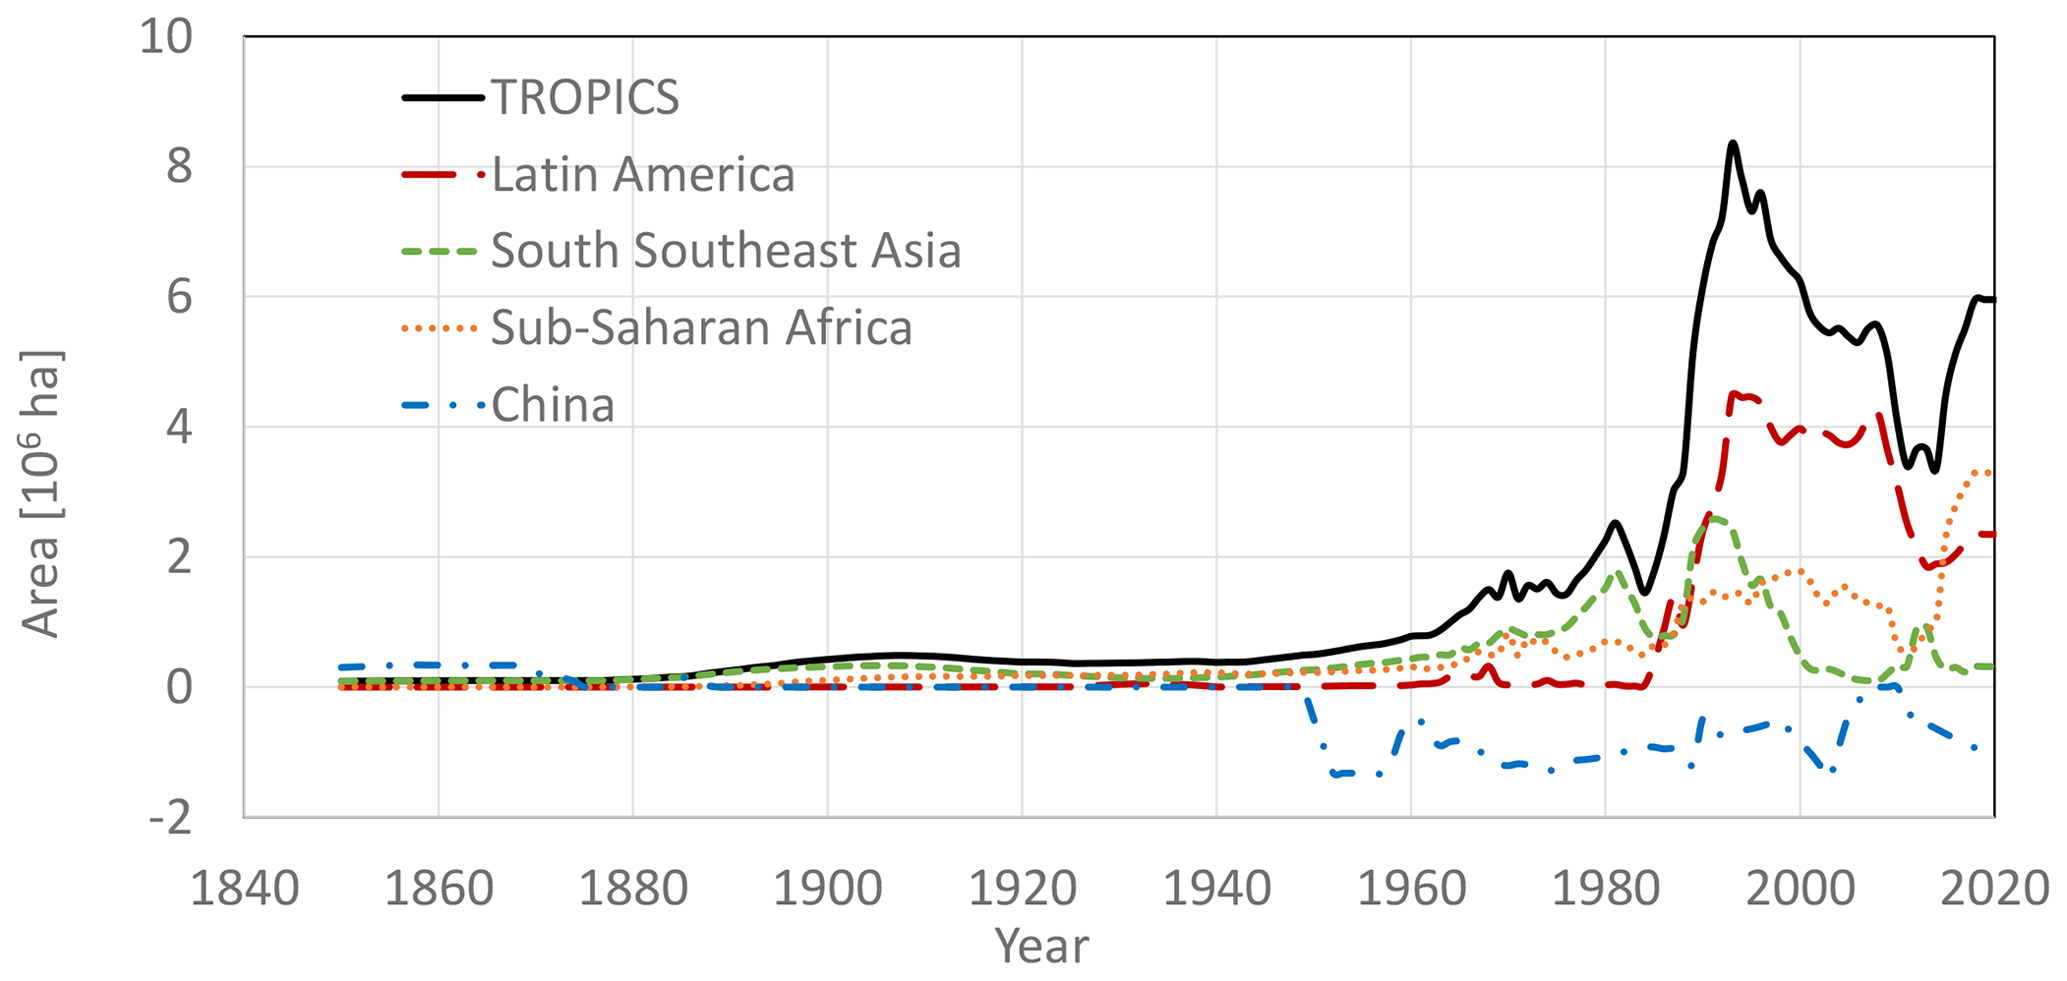
Figure 6Rates at which forests appeared to be converted to other land (FCO), defined by forest area loss exceeding agricultural gain (FAO, 2021). Negative values indicate the conversion of other land to forest land.
The cumulative area in this FCO category was large. If all conversions of tropical forests to other land were assumed to be for shifting cultivation, the area was 450×106 ha in 2020, up from 239×106 ha in 1850 according to our assumptions. The highest rates of conversion to other land were in the 1990s (Fig. 6).
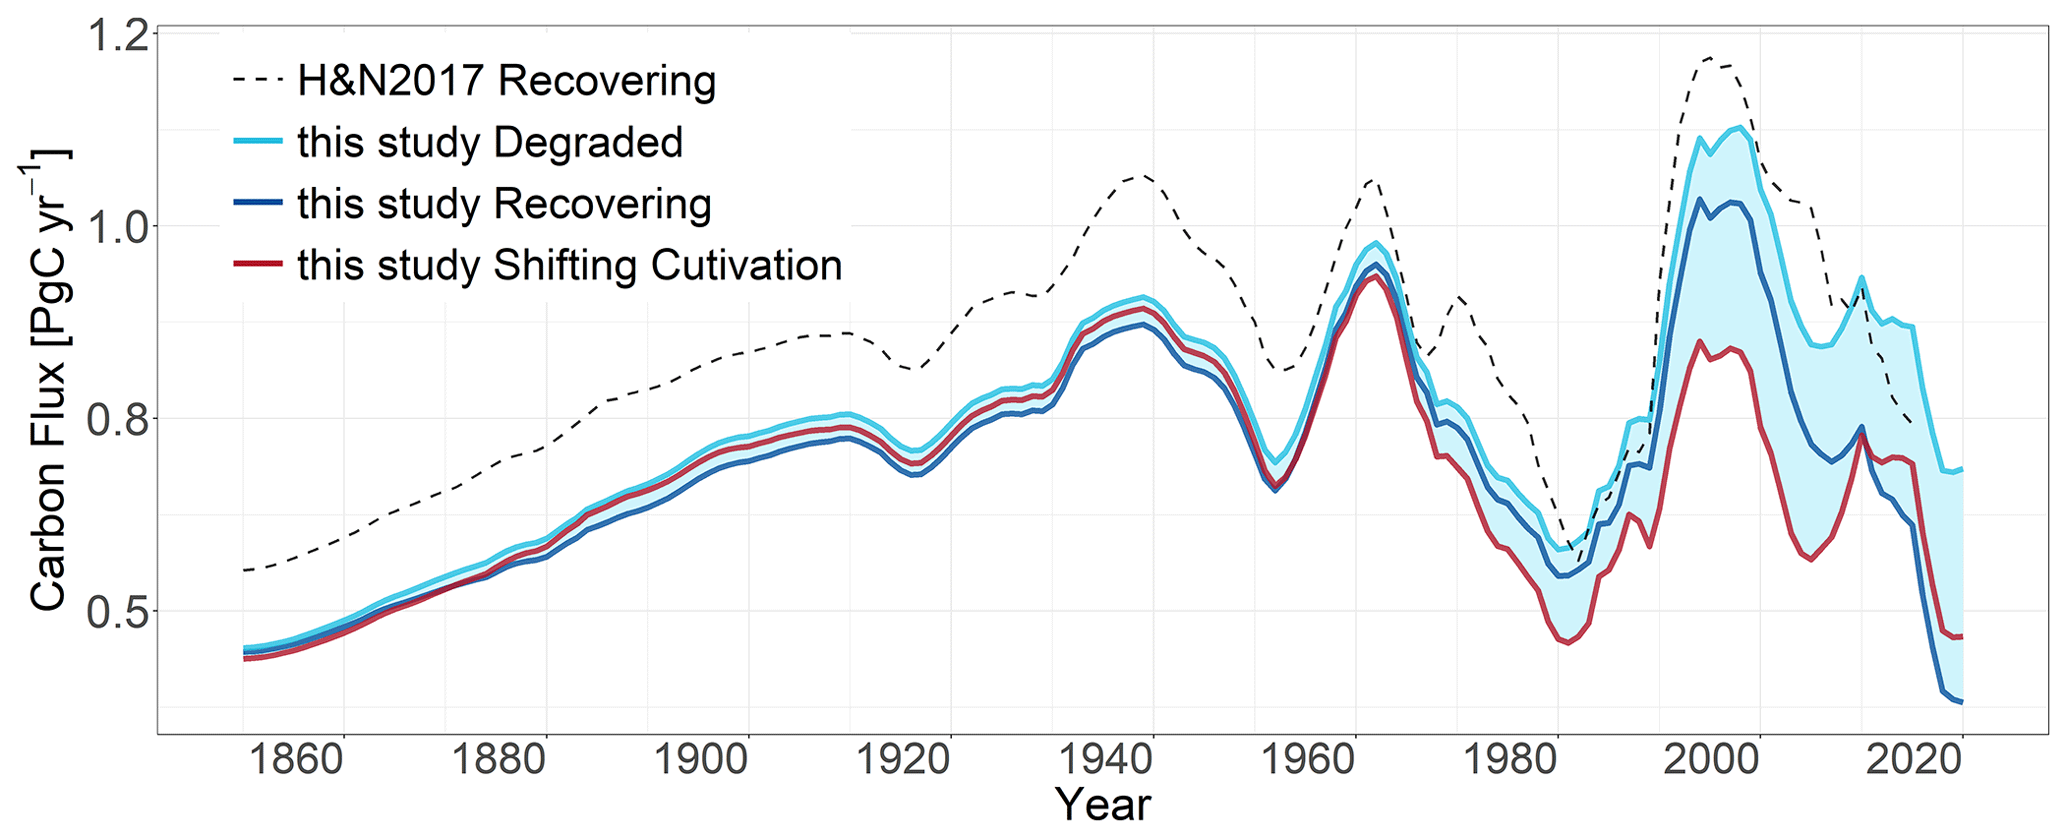
Figure 7Annual net emissions of carbon from LULUCF (peatland emissions excluded). The red line includes shifting cultivation. The shaded area represents range of FCO interpretations. The dashed black line represents Houghton and Nassikas (2017), denoted using H&N2017. This figure incorporates the results from steps 1 through 3, as described in Sect. 2.4.
Because grown forests have the highest carbon densities in biomass, croplands have the lowest densities, and shifting cultivation is intermediate, emissions would be expected to be highest for the degraded interpretation, intermediate for shifting cultivation, and lowest for the recovering interpretation (Fig. 3). However, because forest growth was delayed for 15 years in the recovering interpretation, whereas regrowth of fallow began after 1 year in the shifting cultivation interpretation, the emissions from the recovering and shifting cultivation interpretations were not always as predicted from their respective end states (Fig. 3, Table 1). Over the period from 1850 to 2015, total emissions were 123, 116, and 113 Pg C for the degraded, recovering, and shifting cultivation interpretations, respectively (Table 1), and it was only in the last decade or so that the shifting cultivation interpretation was intermediate (Fig. 7).
The uncertainty in emissions is large, but the range is undoubtedly an overestimate because each interpretation is treated as if it explained all of FCO. In reality, the true explanation for FCO is likely to include a mixture of these interpretations (and more). Furthermore, the uncertainty is higher than a more detailed analysis might find because expertise within the FAO would likely provide the appropriate explanation for FCO for any country and time. Those details were not used in this analysis.
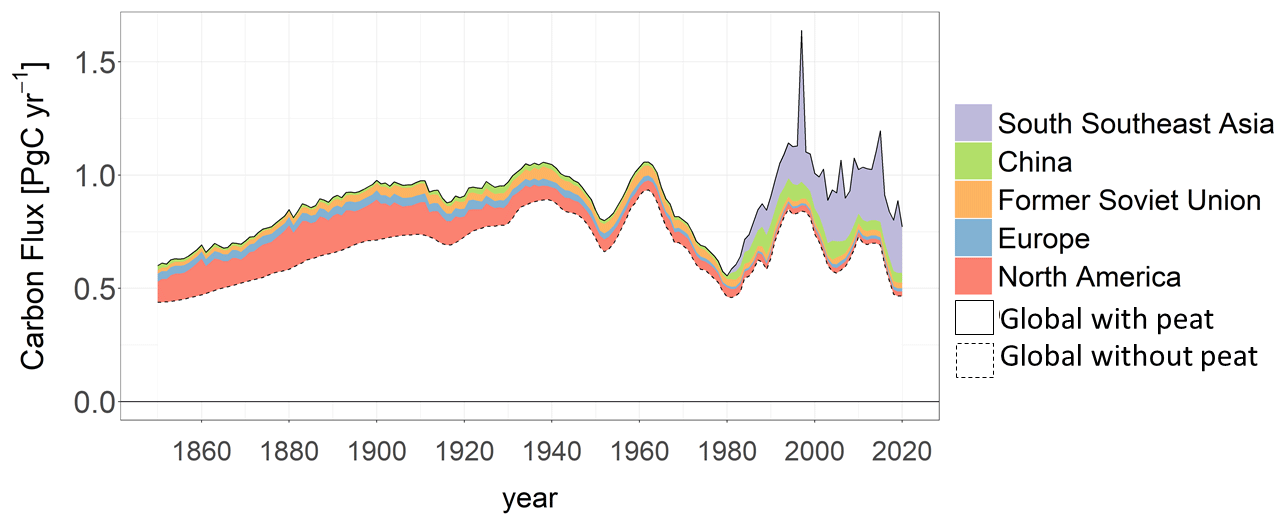
Figure 8Annual emissions of carbon from use of peatlands, shown here above the global annual net emissions from the shifting cultivation alternative. An explanation of the abbreviations used in the legend and a list of the countries in each region are given in Table A2.
3.4 The draining and burning of peatlands
Over the 170-year period from 1850 to 2020, the emissions from use of peatlands added 8 Pg C to emissions from countries in Southeast Asia and 29 Pg C to countries in the Northern Hemisphere midlatitudes (Fig. 8, Table 1; Qiu et al., 2021). The emissions from Northern Hemisphere peatlands were not included in Houghton and Nassikas (2017), and including them here largely offset the lowered emissions that resulted from improvements in the model's simulation of wood harvest (Fig. 5, Table 1).
3.5 Overall results from the revised analysis
The results presented above sequentially addressed the four revisions to the model and input data. Below, we report the results of the complete update (all four steps included). Unless otherwise specified, the estimates given below refer to the shifting cultivation interpretation of FCO.

Figure 9Net annual emissions of carbon from LULUCF for major world regions. The black line represents the global net annual emissions. Net negative emissions are removals of carbon from the atmosphere (sinks). An explanation of the abbreviations used in the legend and a list of the countries in each region are given in Table A2.
3.5.1 Net and gross emissions
Global net emissions of carbon from LULUCF increased from about 0.6 Pg C yr−1 in 1850 to about 1 Pg C yr−1 in the 1930s and never got much higher (except in 1997 as a result of unusually high emissions from peatlands in Southeast Asia) (Fig. 9). However, the emissions were far from constant after 1930. Rather, emissions peaked around 1960, in the 1990s, and around 2015, with declines during the 1940s, the 1970s and 1980s, and after 2015.
Table 2Average annual net emissions from LULUCF for the globe and major regions for the period from 2011 to 2020.
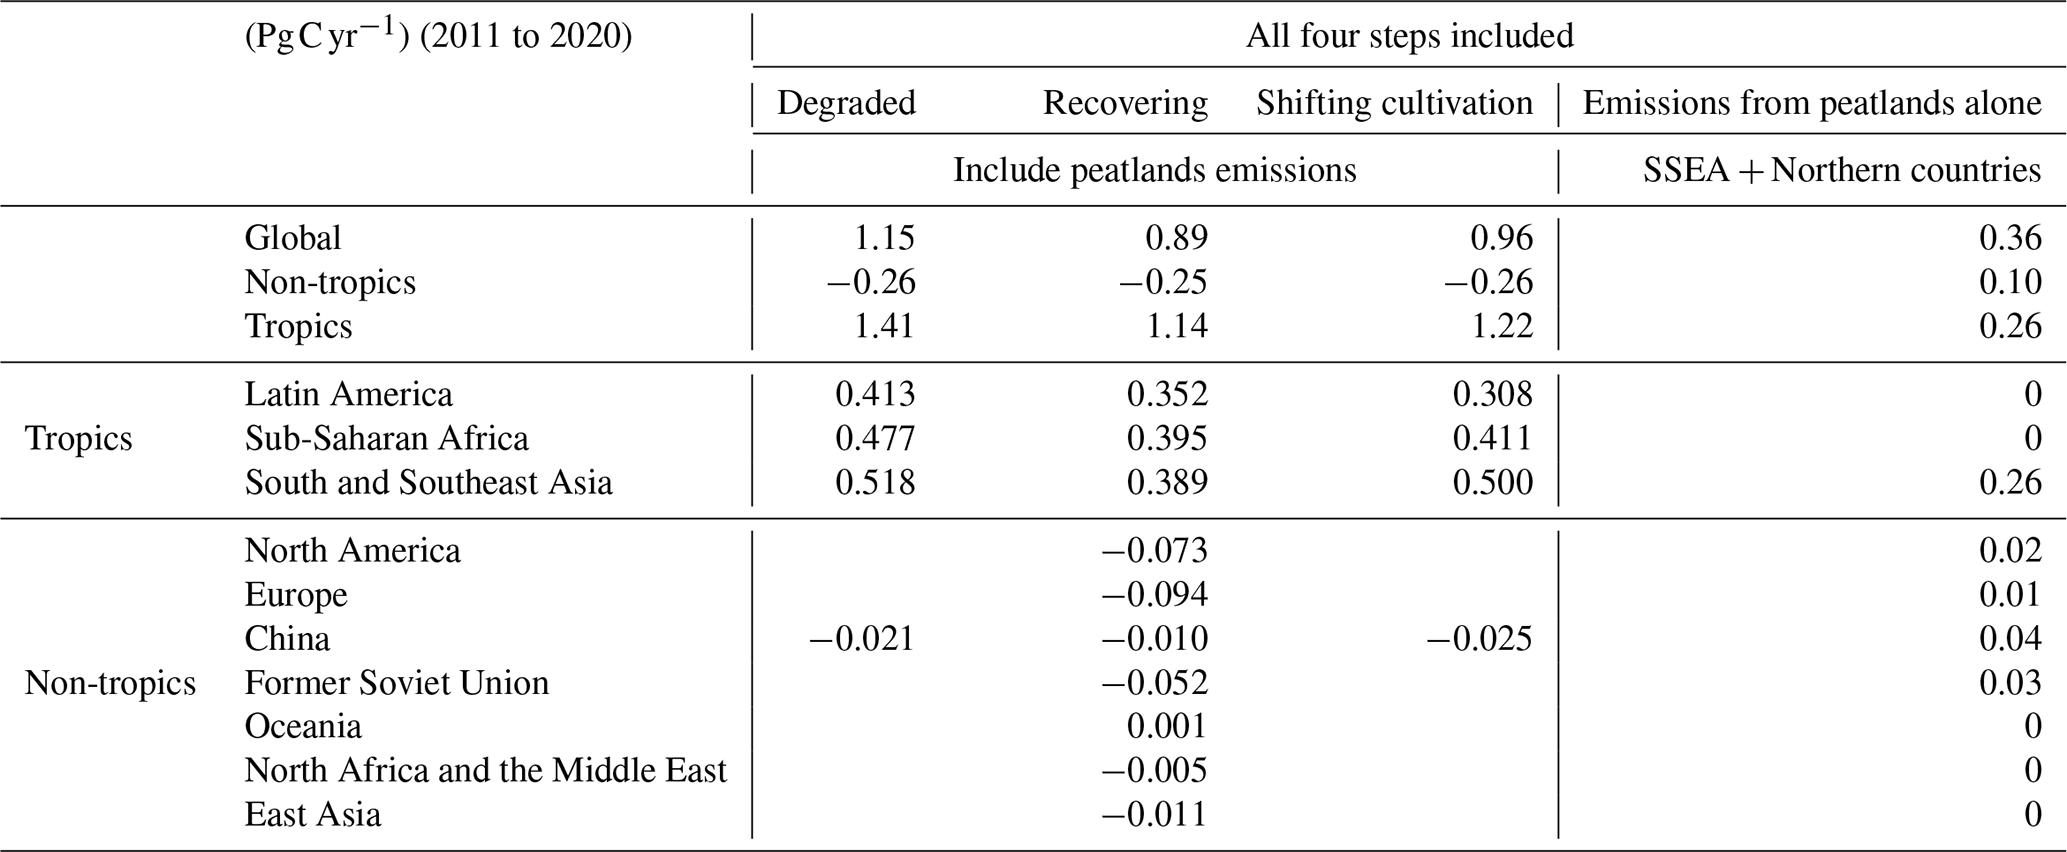
The largest net emissions in the last 10 years (2011–2020) were from the three tropical regions (a mean of 0.500, 0.411, 0.308 Pg C yr−1 for South and Southeast Asia, sub-Saharan Africa, and Latin America, respectively) (Table 2), while four regions (Europe, North America, the former Soviet Union – FSU, and China) showed net sinks of about −0.094, −0.073, −0.052, −0.025 Pg C yr−1, respectively. The net negative emissions (carbon sinks) for individual regions first appeared in the 1920s (Fig. 9), reached about −0.3 Pg C yr−1 in the 1970s, and remained nearly constant thereafter, although the sink seems to have declined slightly since 2005. Interestingly, the four regions that presently have the largest net negative emissions had the highest net positive emissions in the 19th and early 20th centuries.
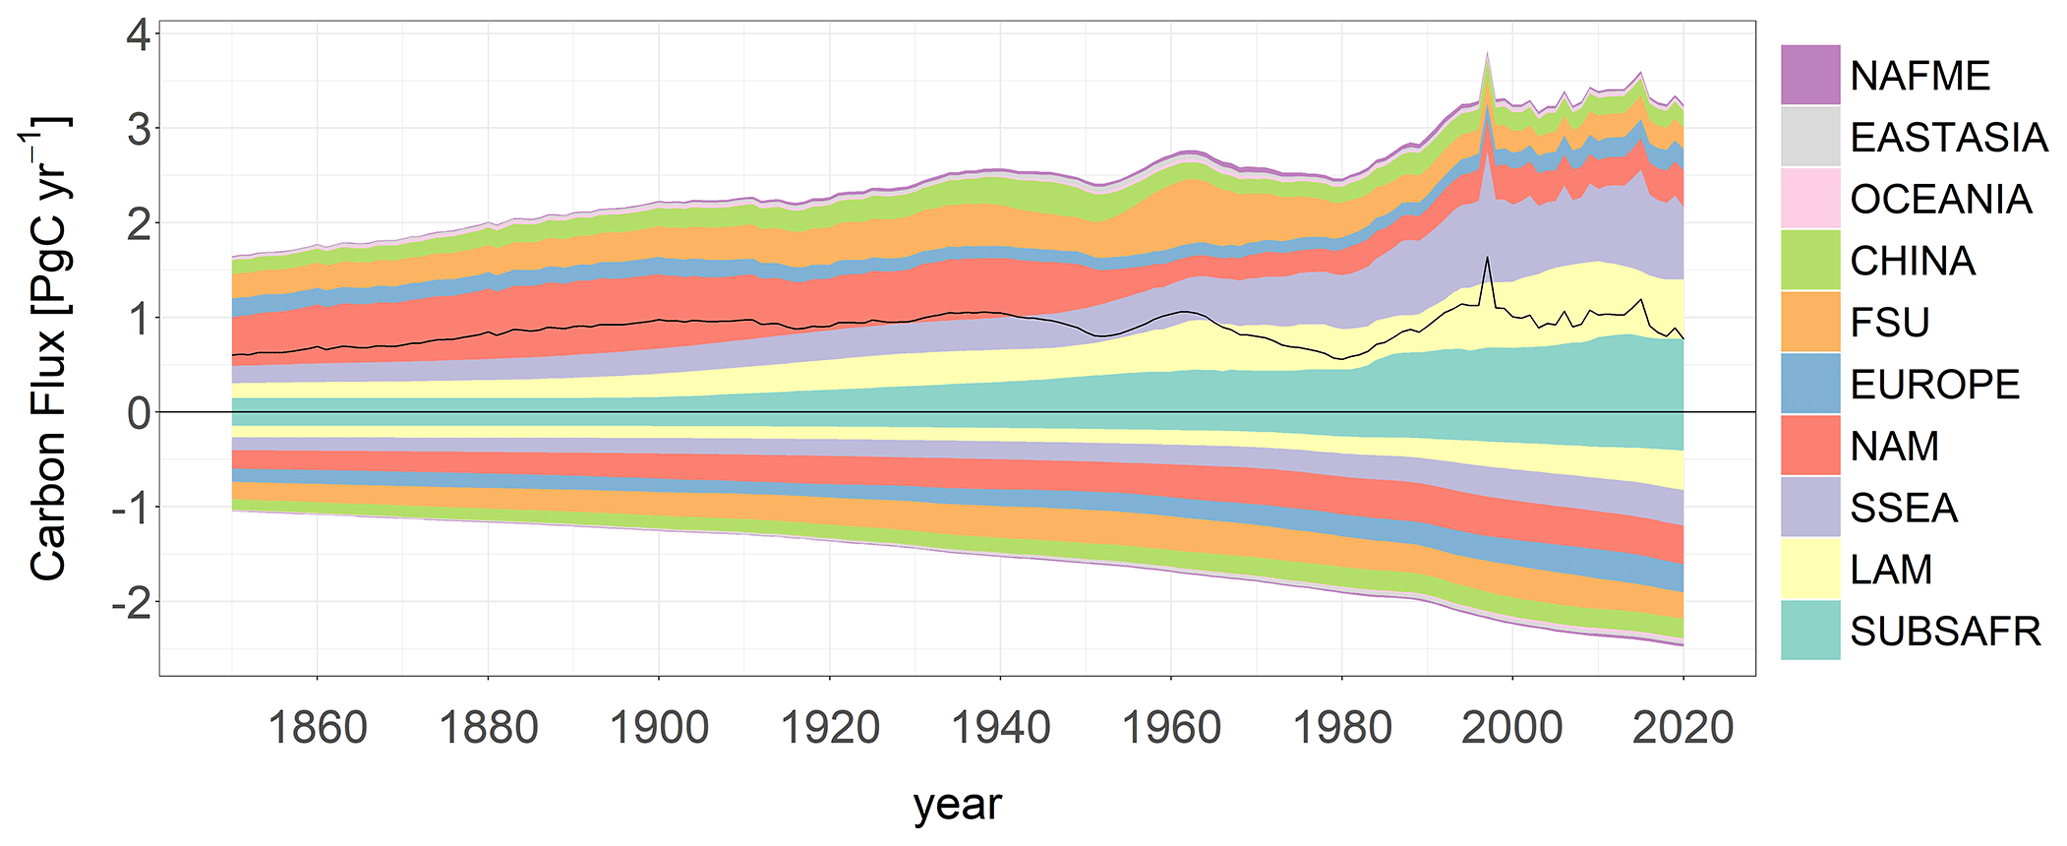
Figure 10Annual gross emissions and removals of carbon from LULUCF by region. The black line represents global net emissions. An explanation of the abbreviations used in the legend and a list of the countries in each region are given in Table A2.
Table 3Average net and gross emissions of carbon from LULUCF by region for the period from 2011 to 2020. Emissions from burning and draining of peatlands are included.
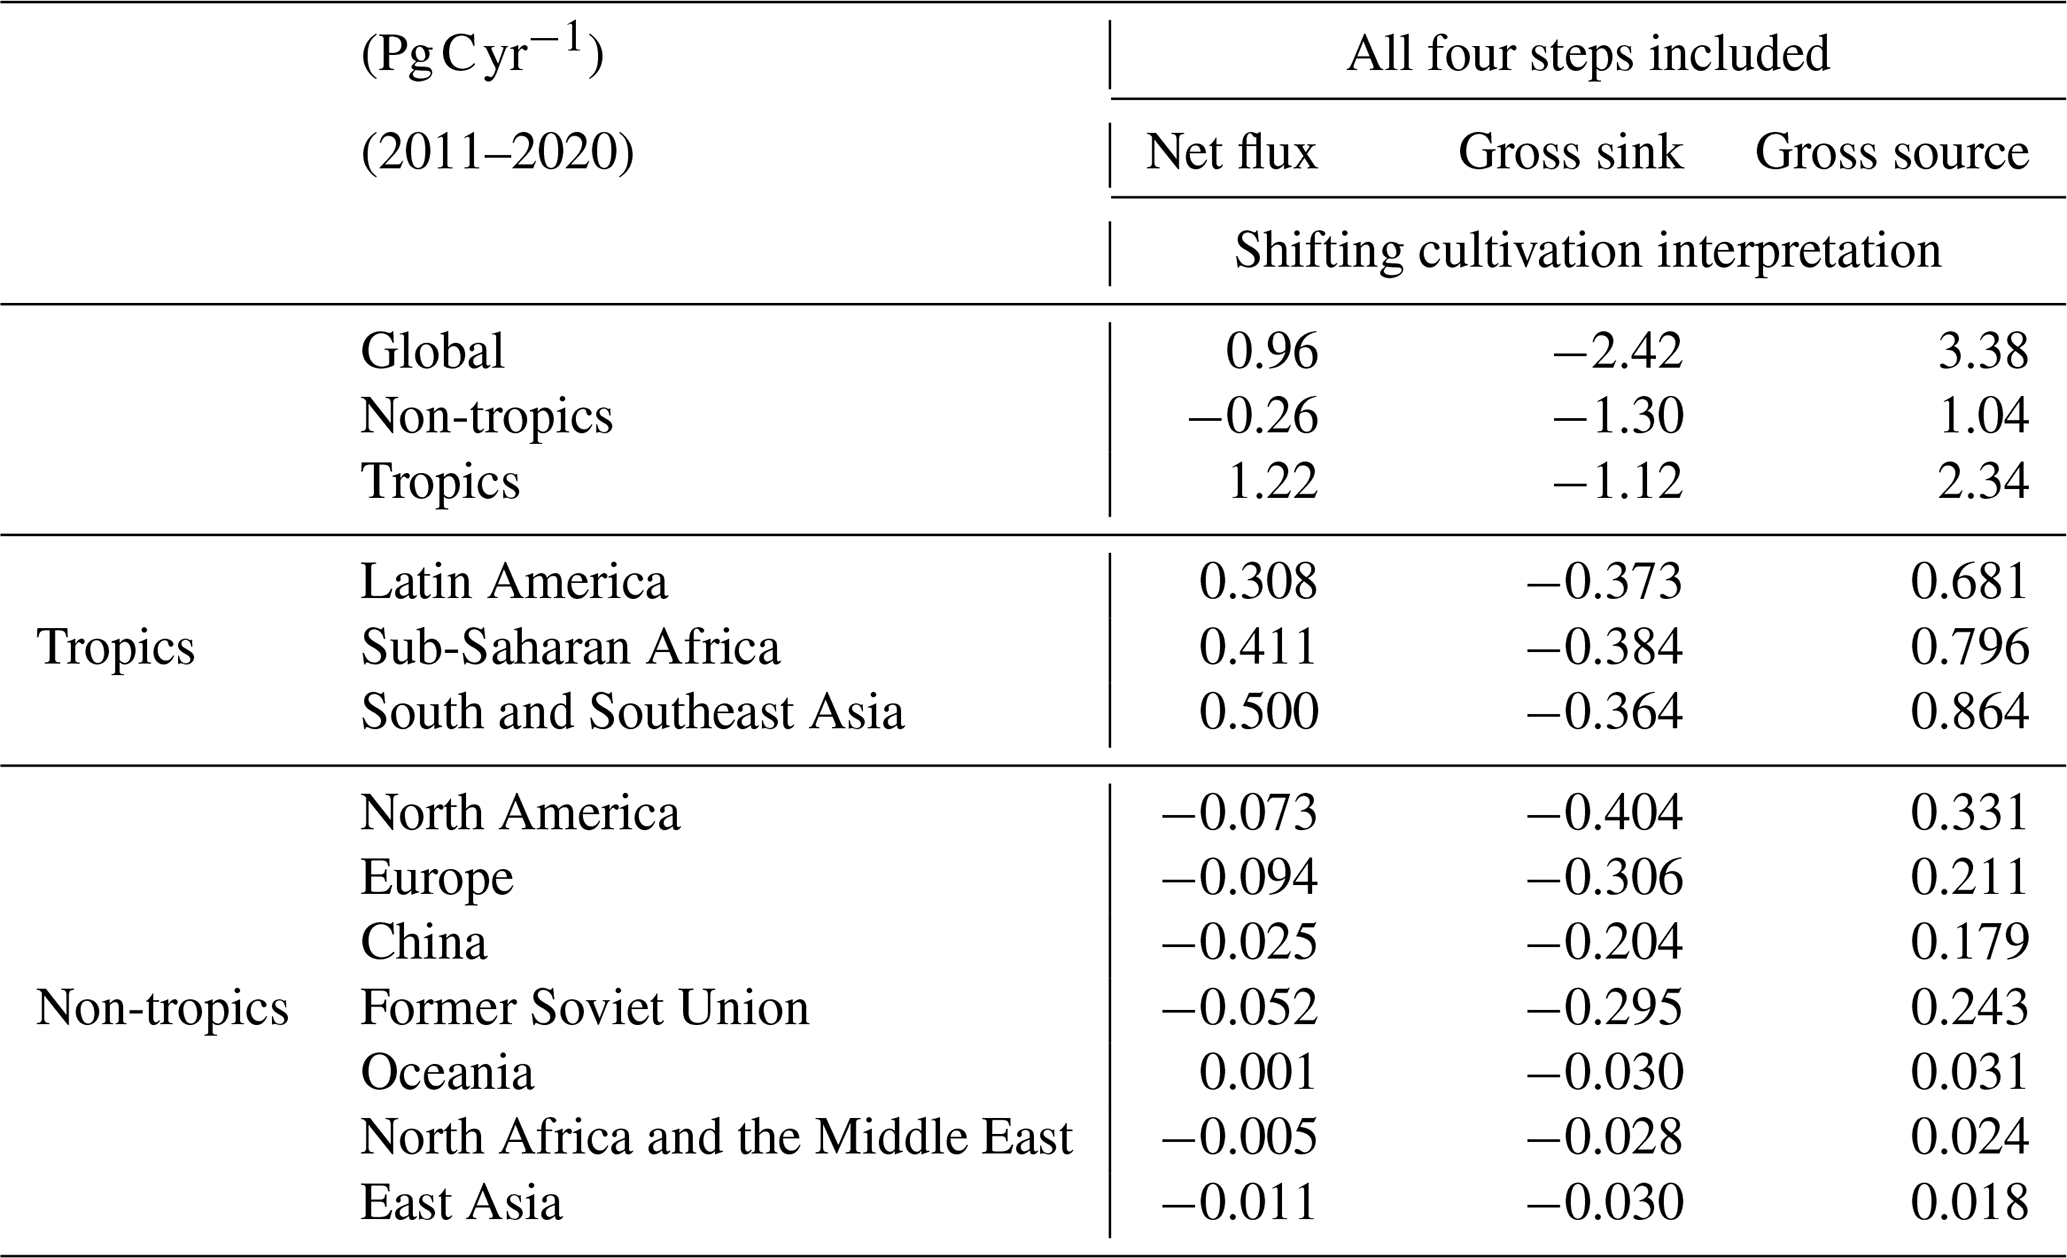
In the period from 2011 to 2020, global gross emissions (3.38 Pg C yr−1) were more than 3 times higher than net emissions (0.96 Pg C yr−1), while gross removals averaged 2.42 Pg C yr−1 (Fig. 10, Table 3). High gross emissions and removals result from rotational uses of land, such as harvest of wood and shifting cultivation, where the emissions are largely offset by the removals in forest recovery or fallows.
Gross emissions were predominantly (69 %) found in the three tropical regions (Latin America, tropical Africa, and South and Southeast Asia), while the gross sink was distributed nearly equally between tropical (46 %) and nontropical (54 %) regions. The higher net emissions from the tropics were attributable to the higher rates of deforestation there.
The offset of gross emissions and gross removals is not simultaneous and has implications for mitigation. Because most gross emissions happen rapidly, whereas most gross removals occur over a longer time, a reduction in shifting cultivation would result in a rapid reduction in (gross) emissions, whereas the (gross) removals (in regrowing forests) would continue for decades. Hence, gross fluxes are more indicative of the potential for mitigation than net fluxes. Furthermore, our estimates of gross fluxes are underestimated because rates of land-use change were based on net changes in area as reported by FAOSTAT.
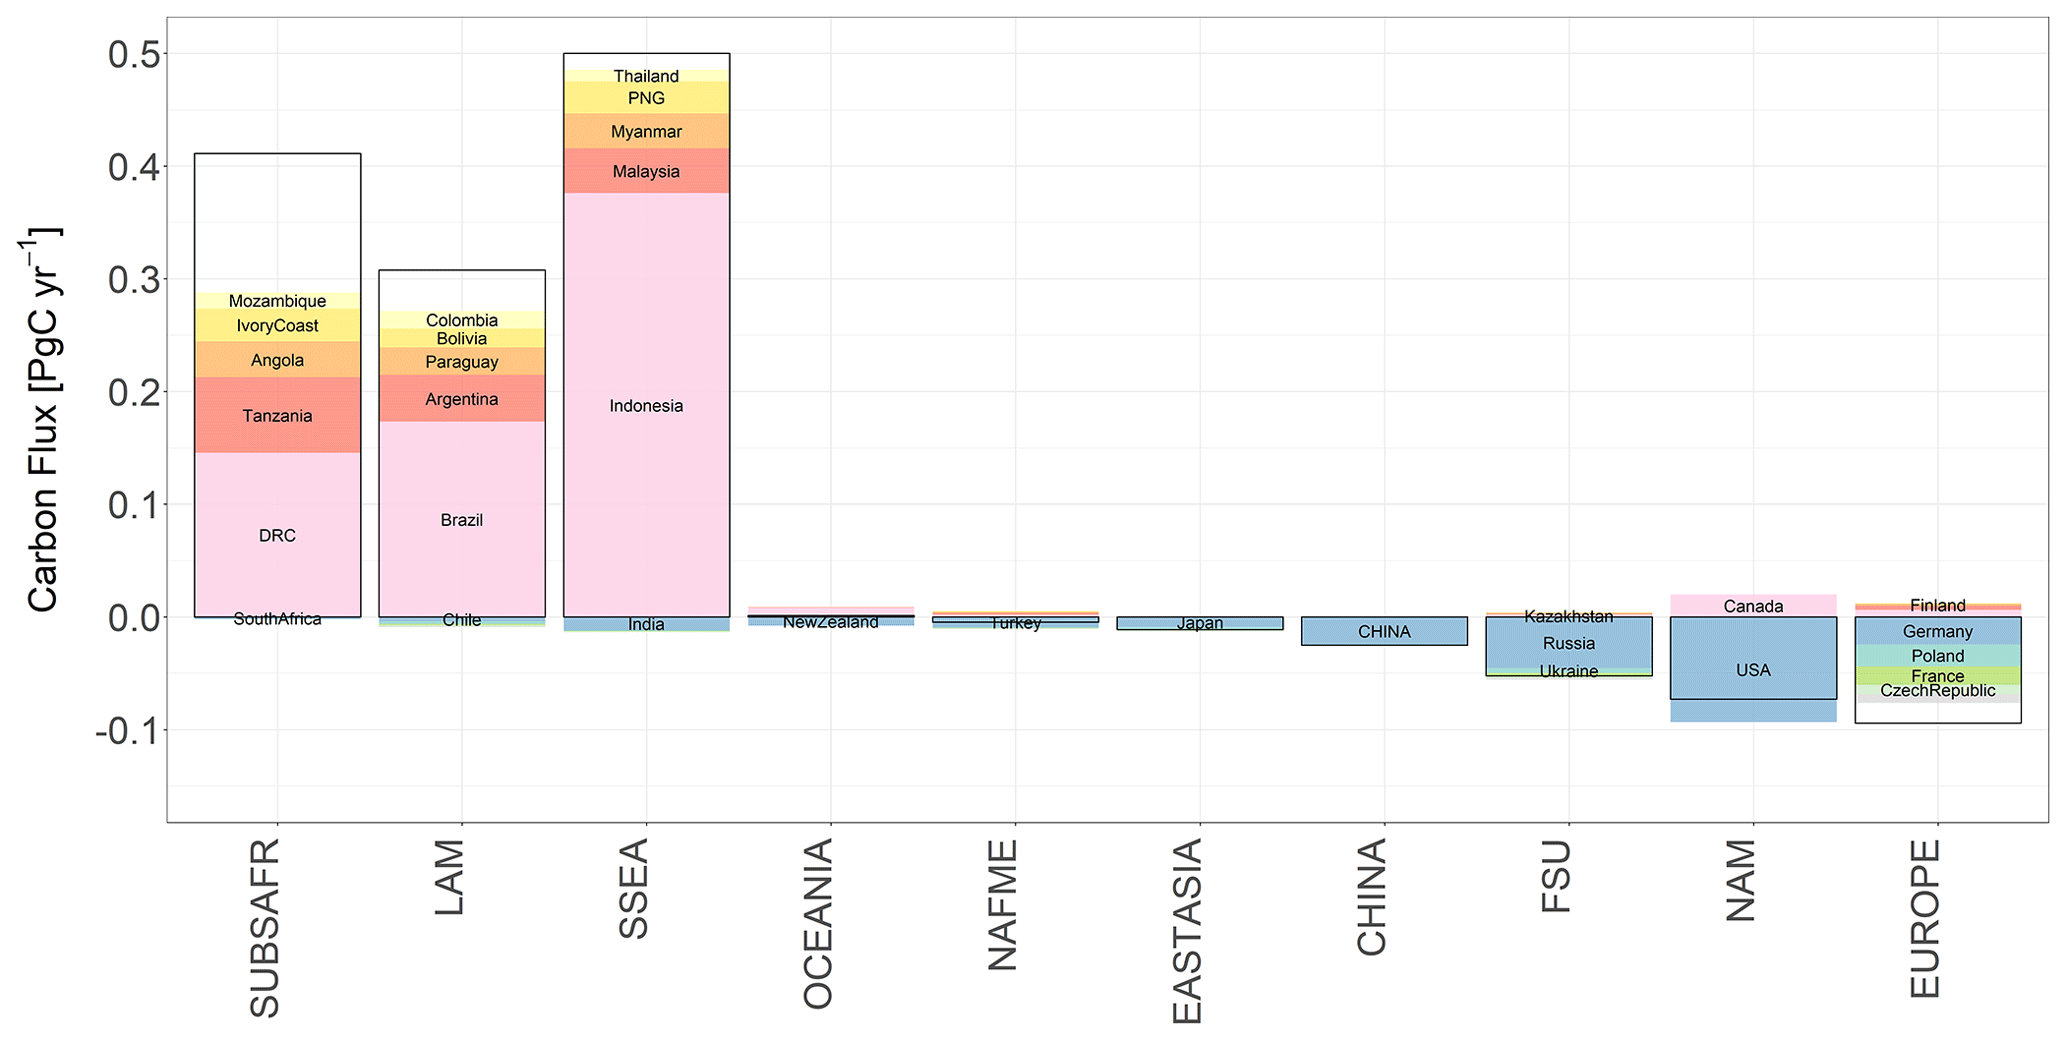
Figure 11Regions and countries with the largest net annual emissions and removals, including emissions from use of peatlands (average for 2011–2020). The white portions of the columns represent the contribution of all other countries in the corresponding regions. (Please note that “Ivory Coast” is used to represent Côte D'Ivoire in this figure.)
3.5.2 Emissions by country
Over the last decade (2011–2020), according to the analysis based on the shifting cultivation interpretation of FCO, three countries (Indonesia, Brazil, and the Democratic Republic of the Congo) accounted for 54 % of the global net emissions, and 20 countries accounted for 86 % (Fig. 11). A total of 7 countries offset 18 % of the total emissions, while about 80 countries with negative emissions offset 26 % of total net emissions from LULUCF. The total net removal (0.34 Pg C yr−1; sum of all net removal countries) was less than the emissions from Indonesia (0.38 Pg C yr−1). Indonesia alone accounted for 30 % of all emissions from LULUCF in this last 10 years, with 56 % of those emissions from the burning and draining of peatlands.
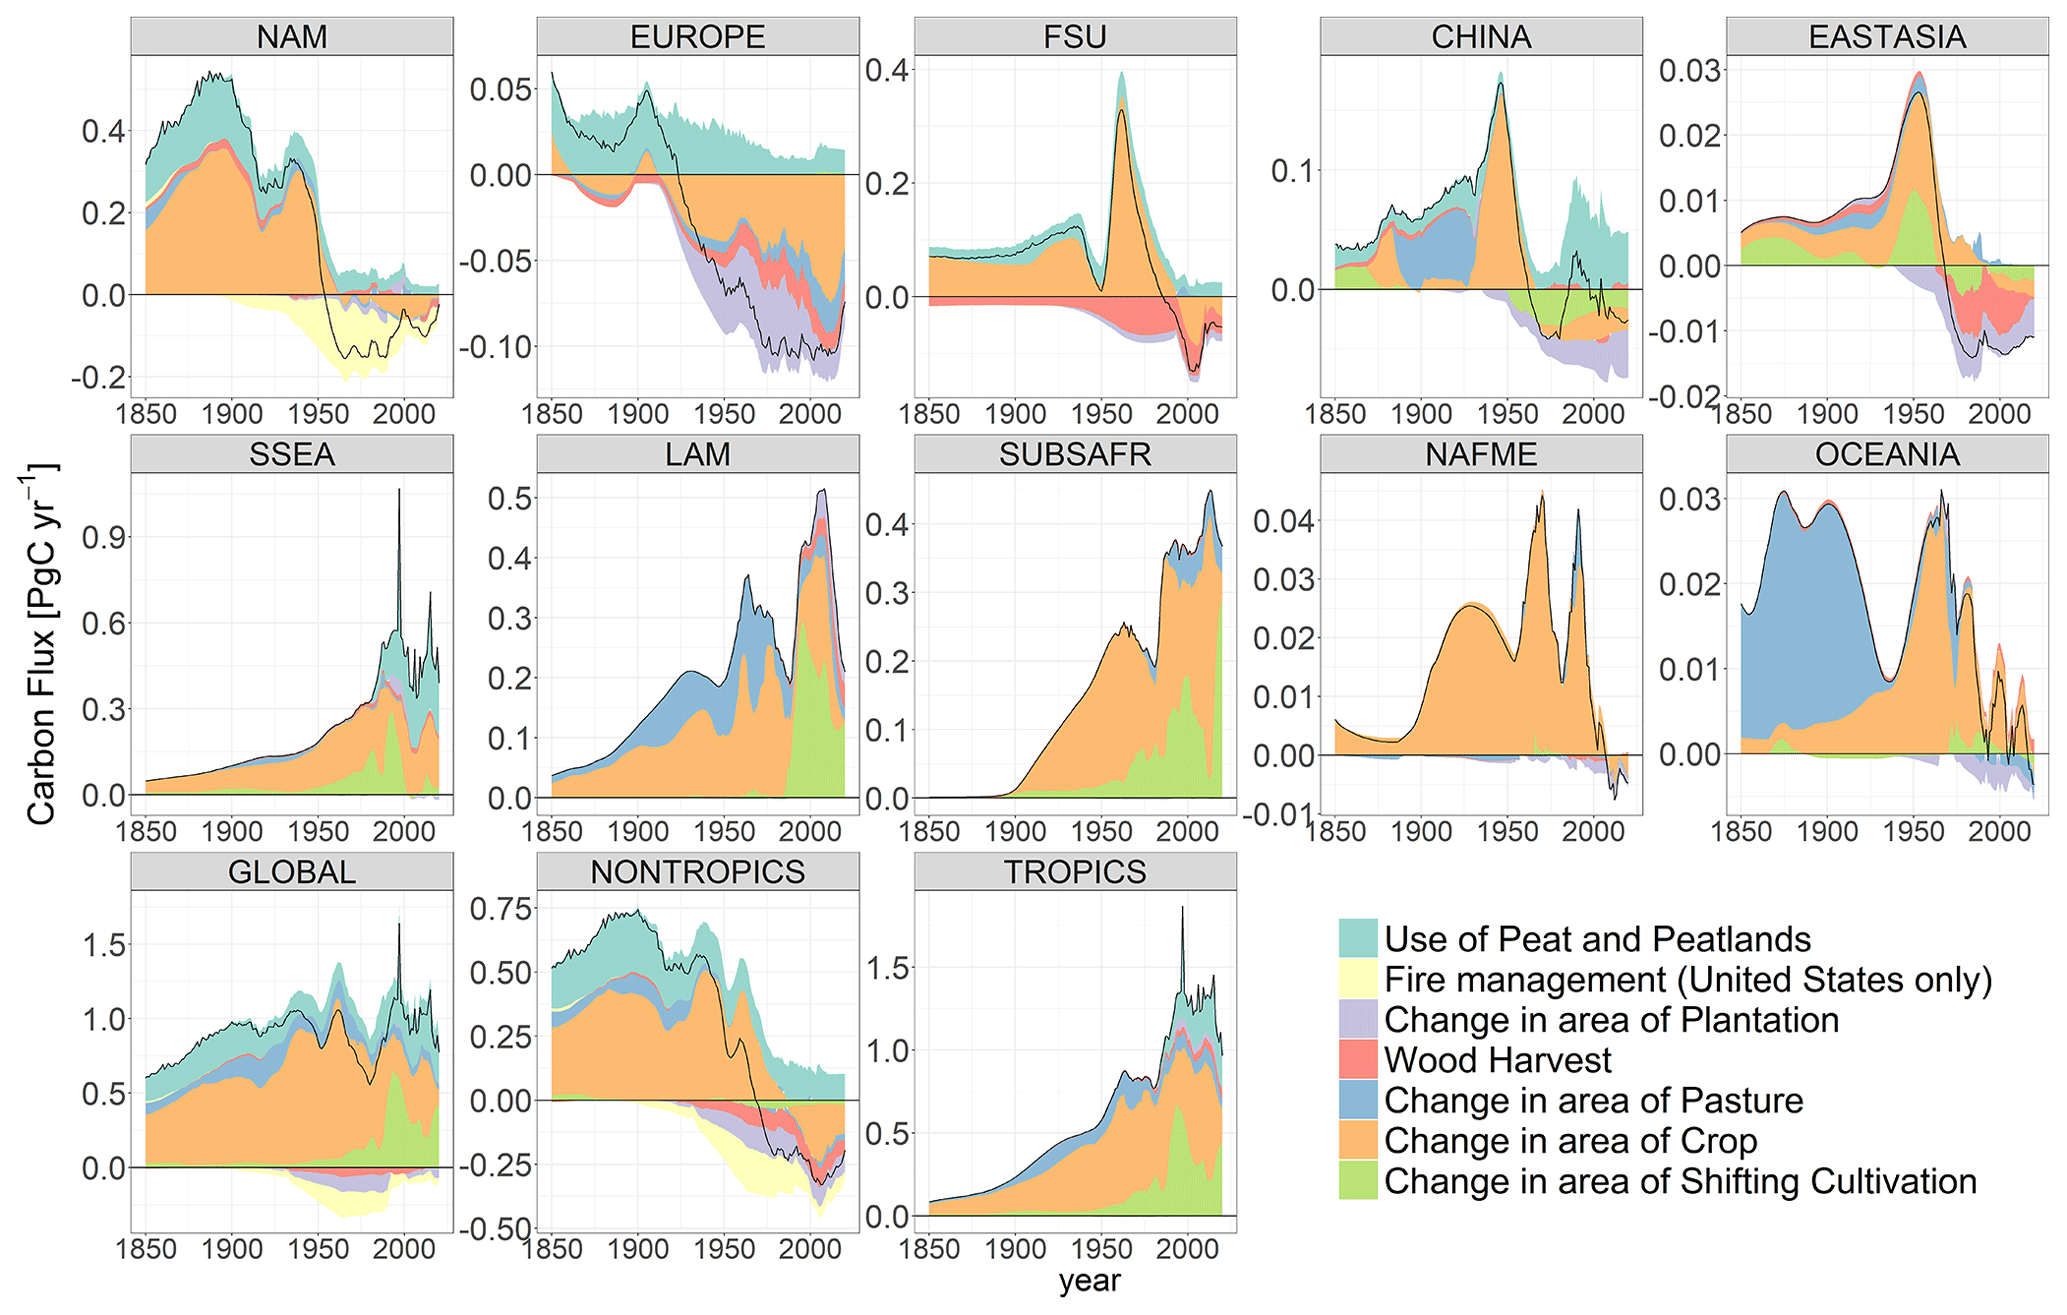
Figure 12Net emissions from LULUCF attributed to different types of land use and land-use change. The emissions attributed to pasture, crop, and shifting cultivation result from changes in area (land-use change), not to management practices.
Table 4Annual net emissions of carbon attributable to different land uses and land-use changes by region, averaged over the last decade (2011–2020). The emissions attributed to pasture, crop, and shifting cultivation result from changes in area (land-use change), not to management practices.
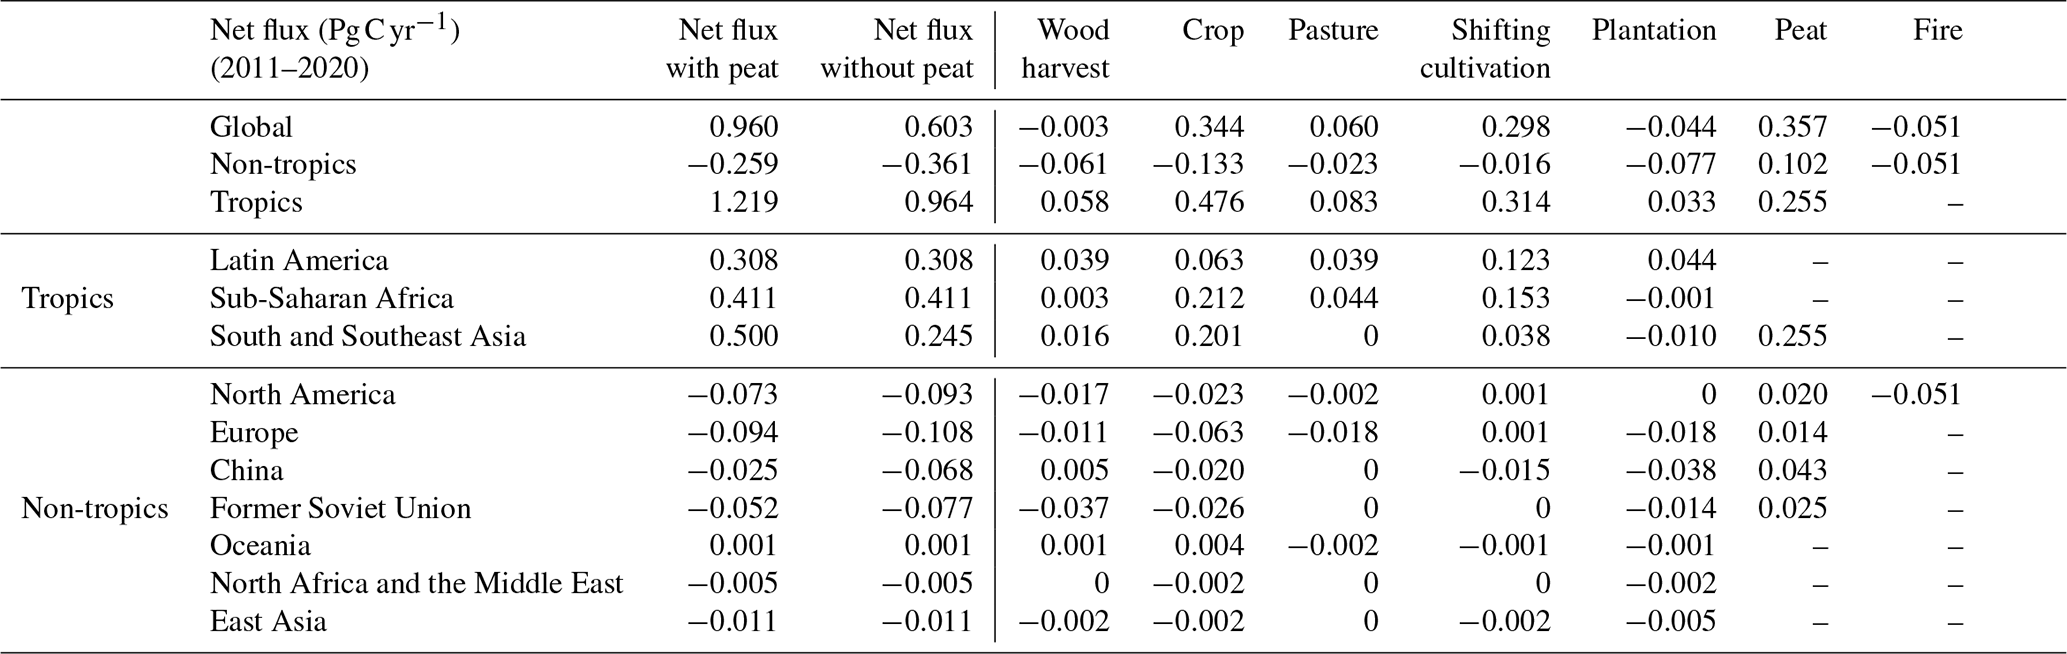
3.5.3 Emissions by type of land use or land-use change
Land uses with the greatest emissions or removals of carbon varied among regions and over time (Fig. 12). The expansion of croplands generally accounted for the greatest emissions everywhere except in Oceania, where pastures were the dominant source of carbon before 1950. Shifting cultivation was important in the three largely tropical regions. Emissions from the use of peatlands were most noticeable, historically, in North America and Europe as well as, more recently, in South and Southeast Asia and China. Removals of carbon resulting from agricultural abandonment, the establishment of tree plantations, and declining rates of harvest were dominant in Europe, the FSU, China, and North America (−0.108, −0.077, −0.068, −0.093 Pg C yr−1, respectively, in the last 10 years) (Table 4).
The net US sink was −0.109 Pg C yr−1 when the history of fire suppression was included. We included wildfires in the US because fire management (fire suppression or exclusion) was a part of forest management. According to the wildfire statistics, the area burned nationally was greatly reduced after the 1930s, and this reduction led to a significant sink in regrowing forests. Other countries have also practiced fire management and might be expected to have larger sinks than calculated here, but data were not available for this study.
3.5.4 Emissions by carbon pool
The annual global net flux of 0.96 Pg C yr−1 to the atmosphere for the period from 2011 to 2020 was composed of gross emissions of 3.38 Pg C yr−1 from the burning of live vegetation, the decay of dead vegetation (slash), the oxidation of wood products, and the oxidation of soil carbon as a result of cultivation, including peatland emissions. Annual global gross removals were −2.42 Pg C yr−1 as a result of vegetation and soil recovering from wood harvest and agricultural abandonment (Table 5).
Table 5Annual emissions (+) and removals (−) of carbon by ecosystem component from 2011 to 2020 (in Pg C yr−1).
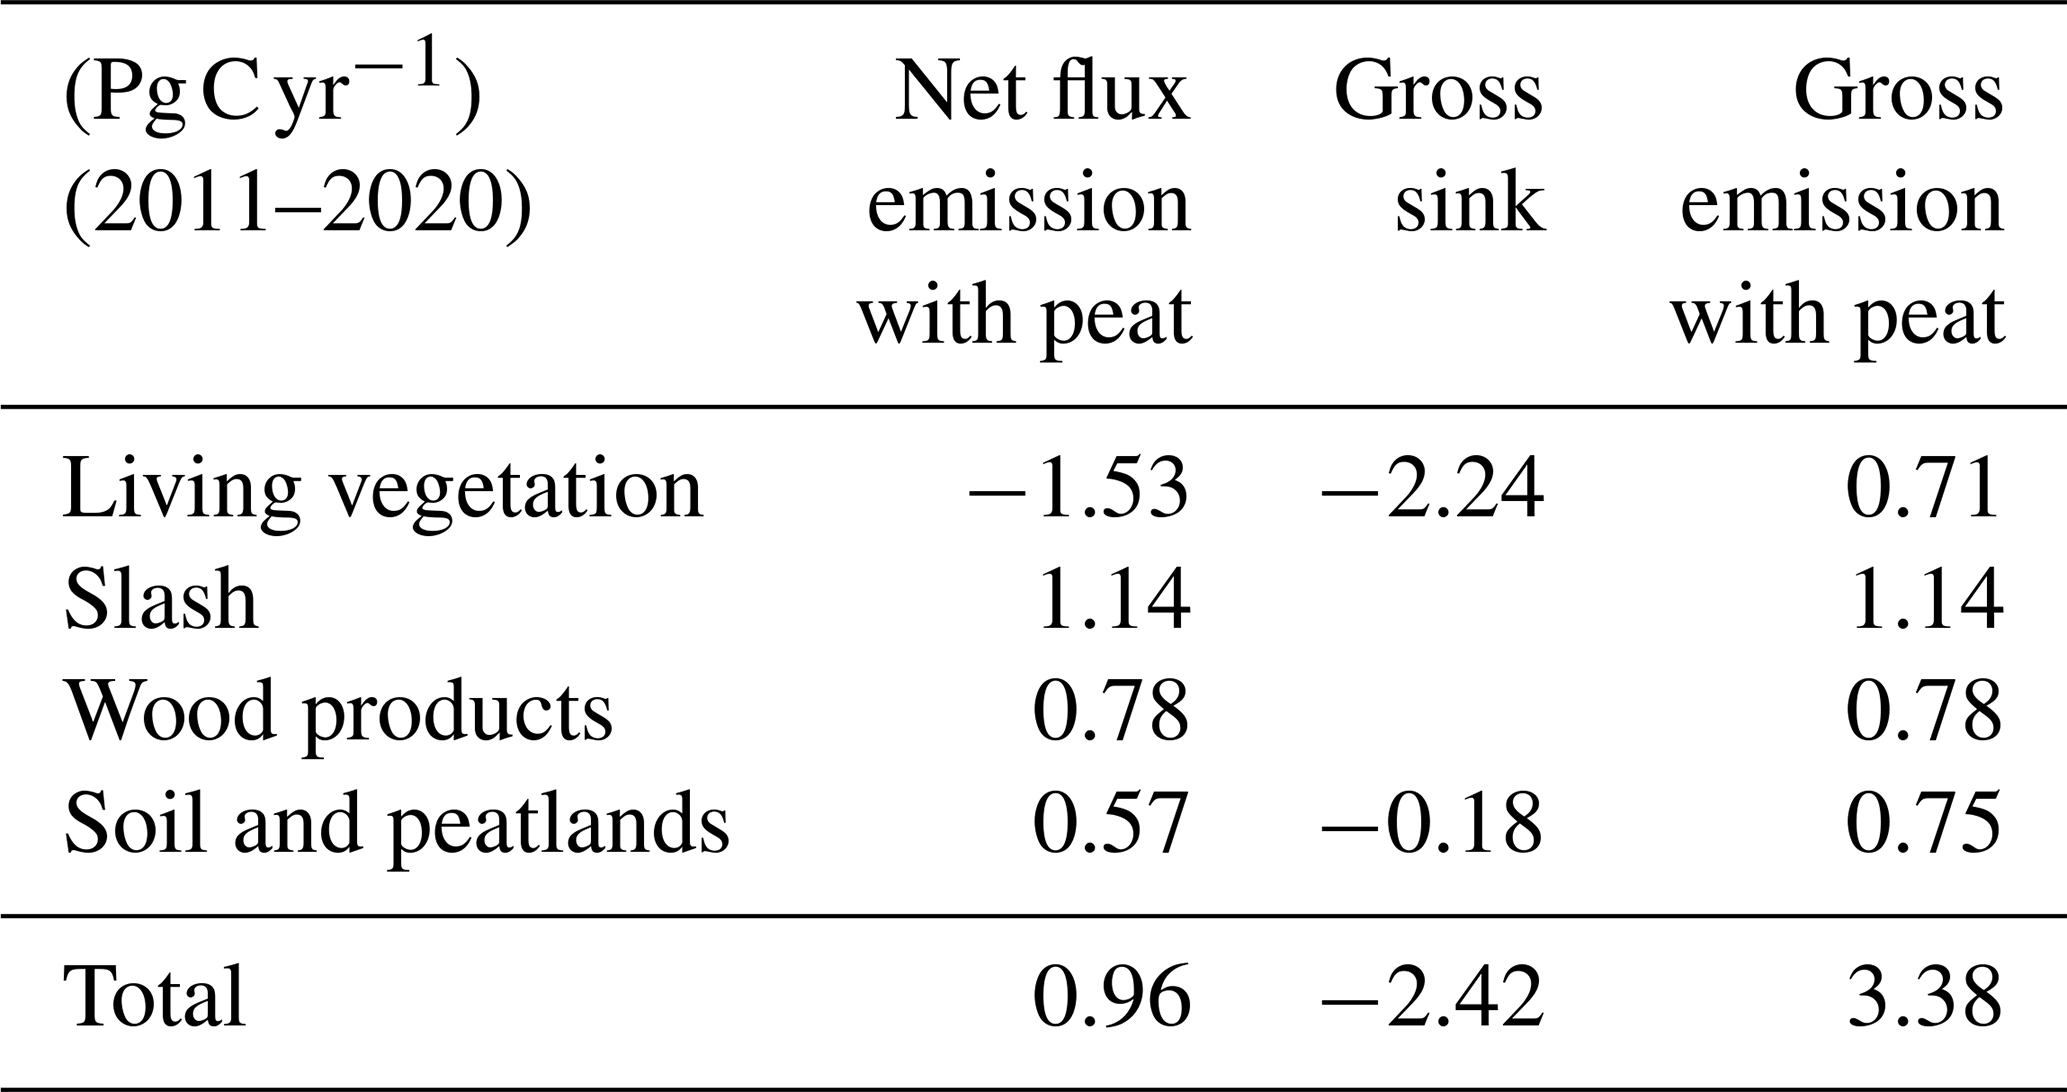
The annual transfers of carbon among pools for the period from 2011 to 2020 are shown in Fig. 13. By far the largest flux was from the atmosphere to growing vegetation (2.24 Pg C yr−1). As discussed above, this gross removal of carbon by growing forests would continue for many decades, even if emissions were reduced by stopping deforestation and forest degradation. Hence, the potential for mitigation is significant as long as changes in climate do not affect rates of regrowth. Fluxes half that magnitude were noted into and out of slash each year, and the flows into and out of wood products were even smaller.

Figure 13Global transfers of carbon (Pg C yr−1) among components of the terrestrial carbon cycle during the last 10 years (2011–2020) and average annual changes in pool sizes in the same decade.
Wood products accumulated carbon over this decade (Fig. 13), but whether that accumulation is considered a sink or not depends on definition (i.e., changes in pool size or exchanges with the atmosphere). The sum of all exchanges with the atmosphere (0.96 Pg C yr−1) is equivalent to the sum of all annual changes in pools (0.96 Pg C yr−1) when peatlands are included (Fig. 13).
Forests accounted for nearly all emissions (99 %) for the decade from 2011 to 2020 if emissions from peatlands were excluded. It is unclear whether the emissions from peatlands in Northern Hemisphere regions were from forests or not. Emissions from peatlands (0.36 Pg C yr−1) were 37 % of the total global net flux in this decade, while emissions from mineral soils were 22 % (0.22 Pg C yr−1).
We limit the discussion below to three general topics. First, we explore the likely explanation for forest converted to other land (FCO). Second, we examine how these new estimates of emissions compare with other recent studies, including recent estimates of forest degradation. Finally, we discuss how we can reconcile reduced emissions of carbon from LULUCF in the tropics with increased rates of deforestation reported in the literature (Wiltshire et al., 2022; Van Marle et al., 2022; Feng et al., 2022; Prodes, 2021).
4.1 Forests converted to other land
Four interpretations were initially proposed to explain the apparent conversion of tropical forests to other land. “Apparent” is used here because the conversion is inferred from the areas of land reported by the FAO (2021) between 1990 and 2020. When the loss of forest area exceeded the gain in agricultural areas, the excess forest loss appeared as other land.
If FCO is an error in assigning newly deforested land to other land rather than to agricultural land, the emissions would be essentially the same as from the degradation interpretation. Both of them increase the area of cropland, rather than other land. The recovering interpretation is the least consistent with the FAO data, as it leads to a greater area of forest than reported by the FAO and is inconsistent with FRA 2020. Thus, either shifting cultivation or degradation seems more likely if FCO is a real change in land use.
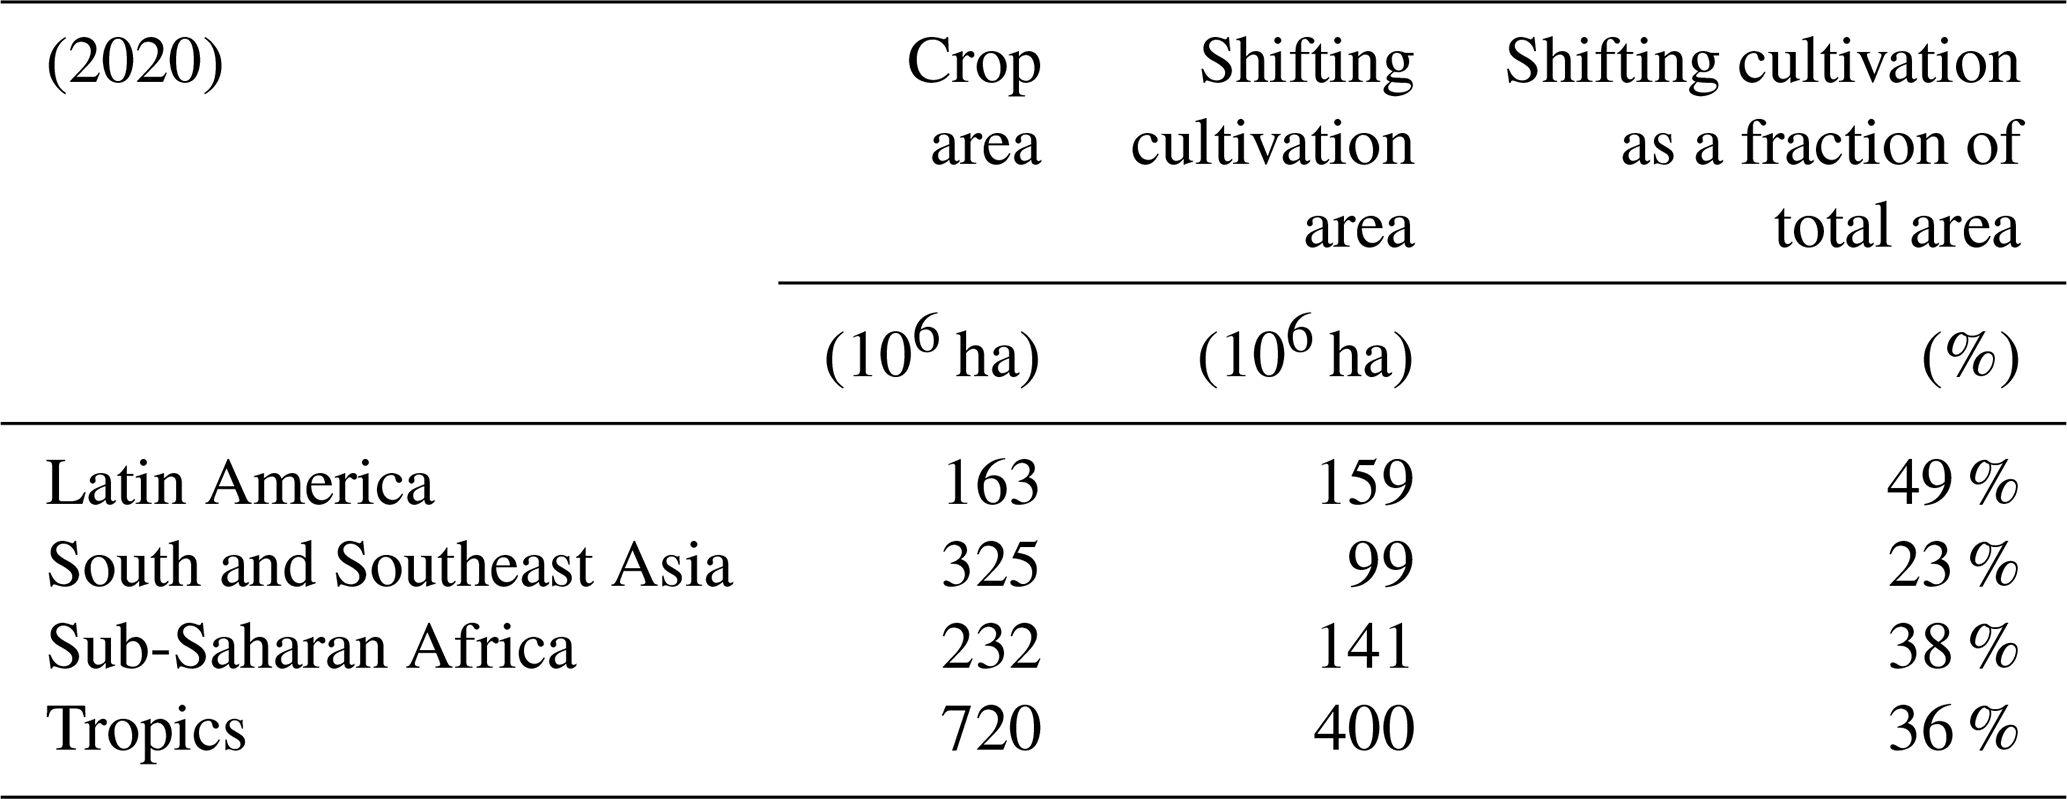
According to the FAO, shifting cultivation is included in cropland. Thus, this poses the following question: are the areas assigned to croplands (FAO, 2021) large enough to include the areas under shifting cultivation calculated here? The answer seems to be yes for tropical Asia and sub-Saharan Africa, where shifting cultivation might account for as much as 23 % and 38 % of total cropland area (Table 6). For Latin America, however, where the area calculated here as being under a shifting cultivation regime is nearly as large as the total area assigned to croplands, either our estimate for shifting cultivation is too large or the total cropland area is not large enough. Clearly, Latin America has large areas under croplands that are not under a shifting cultivation regime. In any case, if shifting cultivation (and fallows) was included in croplands, we are left with the question of what changes in other land represent.
Table 6Total areas assigned to croplands (from FAOSTAT; FAO, 2021) and under shifting cultivation (calculated here).
Based on these arguments, the most reasonable interpretations for FCO seem to be the conversion of forest either to shifting cultivation or to new agricultural land, mistakenly called other land or offset by the abandonment of old agricultural land that does not return to forest. By comparison, the recovering interpretation departs from FAOSTAT (FAO, 2021) because it results in a larger area of forest than reported.
It is important to recognize that these interpretations include more than their labels suggest. For example, the degradation interpretation applies to more than the conversion of forest to croplands and the simultaneous abandonment of croplands. It includes the conversion of forest to any low-carbon ecosystems (e.g., urban lands, settlements, roads, mining and energy extraction operations). It also includes the emissions that would result from an error in classification if the deforestation had been for new agricultural land instead of other land. The shifting cultivation interpretation includes the conversion of forest to ecosystems of intermediate carbon stocks. The recovering interpretation represents temporary deforestation followed by forest recovery (Fig. 3).
Note that the more reasonable interpretations (shifting cultivation and degradation) are those with higher emissions. We use the shifting cultivation interpretation as our preferred estimate. It has the advantage of including shifting cultivation explicitly, although it is likely an overestimate. In the discussion below, we compare our estimates of area under shifting cultivation with other estimates. We also discuss the importance of shifting cultivation for gross emissions of carbon and, finally, whether shifting cultivation accounts for much of the uncertainty associated with emissions from forest degradation.
Trends in the area of shifting cultivation are uncertain (Van Vliet et al., 2012; Heinimann et al., 2017). Van Vliet et al. (2012) found that the area of shifting cultivation was declining in 55 % of their case studies, while the other 45 % showed either an increase or no change in area. Where the areas of shifting cultivation were declining, they were most often being converted to more permanent croplands (no longer including fallows) rather than being allowed to return to forest. Curtis et al. (2018) found that shifting agriculture accounted for as much temporary loss of forest cover, globally, as fire and logging. Regionally, it was sometimes a dominant cause of forest cover loss. For example, Samndong et al. (2018) found that shifting cultivation was the main cause of deforestation in the Democratic Republic of the Congo. In contrast, De Sy et al. (2015) found that shifting cultivation was a minor contributor to deforestation in South America, and Fantini et al. (2017) reported the end of swidden–fallow agriculture within the Brazilian Atlantic rainforest.
We evaluated changes in shifting cultivation using an independent approach inferred from land-use data from FAOSTAT (FAO, 2021). We acknowledge that this approach is hypothetical, but it is broadly consistent and yet independent of other estimates of shifting cultivation; moreover, it offers one explanation for FCO (Sect. 2.2). The rate at which forests were converted to other land (FCO) increased in Latin America and Africa but declined in tropical Asia (Fig. 6). In China, the area assigned to other land actually declined.
If we assume that FCO was driven entirely by the expansion of shifting cultivation and that fallows are counted as other land, then we calculate the total area under shifting cultivation to have been 277 × 106 ha in 1980 and 450 × 106 ha in 2020. These estimates are probably high because we assumed that all of the increase in other land was attributable to shifting cultivation rather than to other land uses in this calculation. For example, a recent analysis and review by Heinimann et al. (2017), based in part on satellite data for the period from 2000 to 2014, estimated an area of 260 × 106 ha under shifting cultivation. As the aforementioned authors acknowledge, however, the area is uncertain. Previous estimates have ranged between 260×106 and 450×106 ha (Silva et al., 2011; Van Vliet et al., 2012; Heinimann et al., 2017; FAO/UNEP, 1981; Lanly, 1982).
Overall, the uncertainty remains, affecting both rates of land-use change and emissions of carbon. For example, in the last 10 years the degradation interpretation emitted about 0.260 Pg C yr−1 more than the recovery interpretation, a difference that was greater than the annual emissions from any country except Indonesia. The unknown fate of FCO lands (degraded, recovering, or shifting cultivation) contributed an uncertainty of about 13 % to global net emissions from LULUCF. If the emissions from peatlands are ignored, the uncertainty for FCO accounted for about 20 % of these global net emissions.
All of these interpretations make the implicit assumption that FCO is anthropogenic. Another possible interpretation for FCO is that the loss of forest to other land might not be directly anthropogenic but, instead, the result of increasing droughts, fires, or storms (see Sect. 4.3.4). The loss of forest area to such indirect effects is not thought to be important (Tyukavina et al., 2022) because forests generally recover from such disturbances. However, indirect effects are responsible for carbon losses through forest degradation, which may rival the losses from deforestation (Lapola et al., 2023). Furthermore, “savannization” in Africa and in Amazonia, which would reduce the area of forest, is a distinct possibility with further changes in climate (Cochrane et al., 1999; Beckett et al., 2022), and increasing droughts in the tropics may already be changing the dynamics of fires and forests (Brando et al., 2019; Uribe et al., 2023). To the extent that FCO is driven by indirect effects, the emissions from LULUCF reported here are overestimates. Some of those emissions should be attributed to environmental effects instead.
4.1.1 Gross emissions and removals
The greatest difference between shifting cultivation and the two other interpretations of tropical forest loss is the effect that they have on gross fluxes of carbon. Aside from wood harvest and agricultural abandonment, both of which include forest recovery, there are few other land uses that generate gross fluxes of carbon. Shifting cultivation accounted for 30 % of the global gross emissions of carbon over the period from 2011 to 2020 in our analysis. Gross emissions and removals for shifting cultivation alone were 1.02 and −0.72 Pg C yr−1, respectively, in comparison with total gross emissions and removals of 3.38 and −2.42 Pg C yr−1, respectively (Table 3). Furthermore, these gross fluxes are probably conservative because, as mentioned above, the changes in land use reported by FAOSTAT are net changes within a country. If data on gross changes in land use were available, they would presumably yield higher gross fluxes. The higher gross fluxes resulting from LULUCF in other bookkeeping models, such as BLUE (Hansis et al., 2015) and OSCAR (Gasser et al., 2020), for example, reflect the fact that those models use gross rates of land-use change (Chini et al., 2021).
4.1.2 Is shifting cultivation deforestation or forest degradation?
Carbon may be lost to the atmosphere through either deforestation (a change in the area of forests) or forest degradation (a reduction in forest carbon stocks without a change in forest area). Estimates of the carbon emitted from forest degradation vary widely, from nearly zero to greater than the emissions from deforestation (Baccini et al., 2017; Lapola et al., 2023; Federici et al., 2015). We suggest that the relative contributions of deforestation and degradation to carbon emissions may depend on whether shifting cultivation is identified as degraded forest or agriculture and that that identification may depend on the measurement resolution. As discussed above, the FAO does not have a specific classification for shifting cultivation and, instead, includes it as agricultural land. However, analyses of changes in aboveground biomass based on satellite data (e.g., Baccini et al., 2017) may interpret the effects of shifting cultivation as forest degradation. Furthermore, at an intermediate resolution (∼ 1 km), degradation and deforestation may be inseparable (Baccini et al., 2017).
In this analysis, the relative contributions of deforestation and degradation to the net carbon emissions from the tropics were 69 % and 5 %, respectively, for the period from 2011 to 2020 (Fig. 14). Another 21 % resulted from burning and draining of peatlands, and 5 % resulted from non-forest land uses. However, if we include shifting cultivation as forest degradation, the relative contributions are more nearly equal (42 % and 32 % for deforestation and degradation, respectively), and the emissions from degradation were more than 50 % in some years (Fig. 14). Thus, the dynamic nature of shifting cultivation as well as how it is measured may account for some of the variation in estimates of forest degradation.
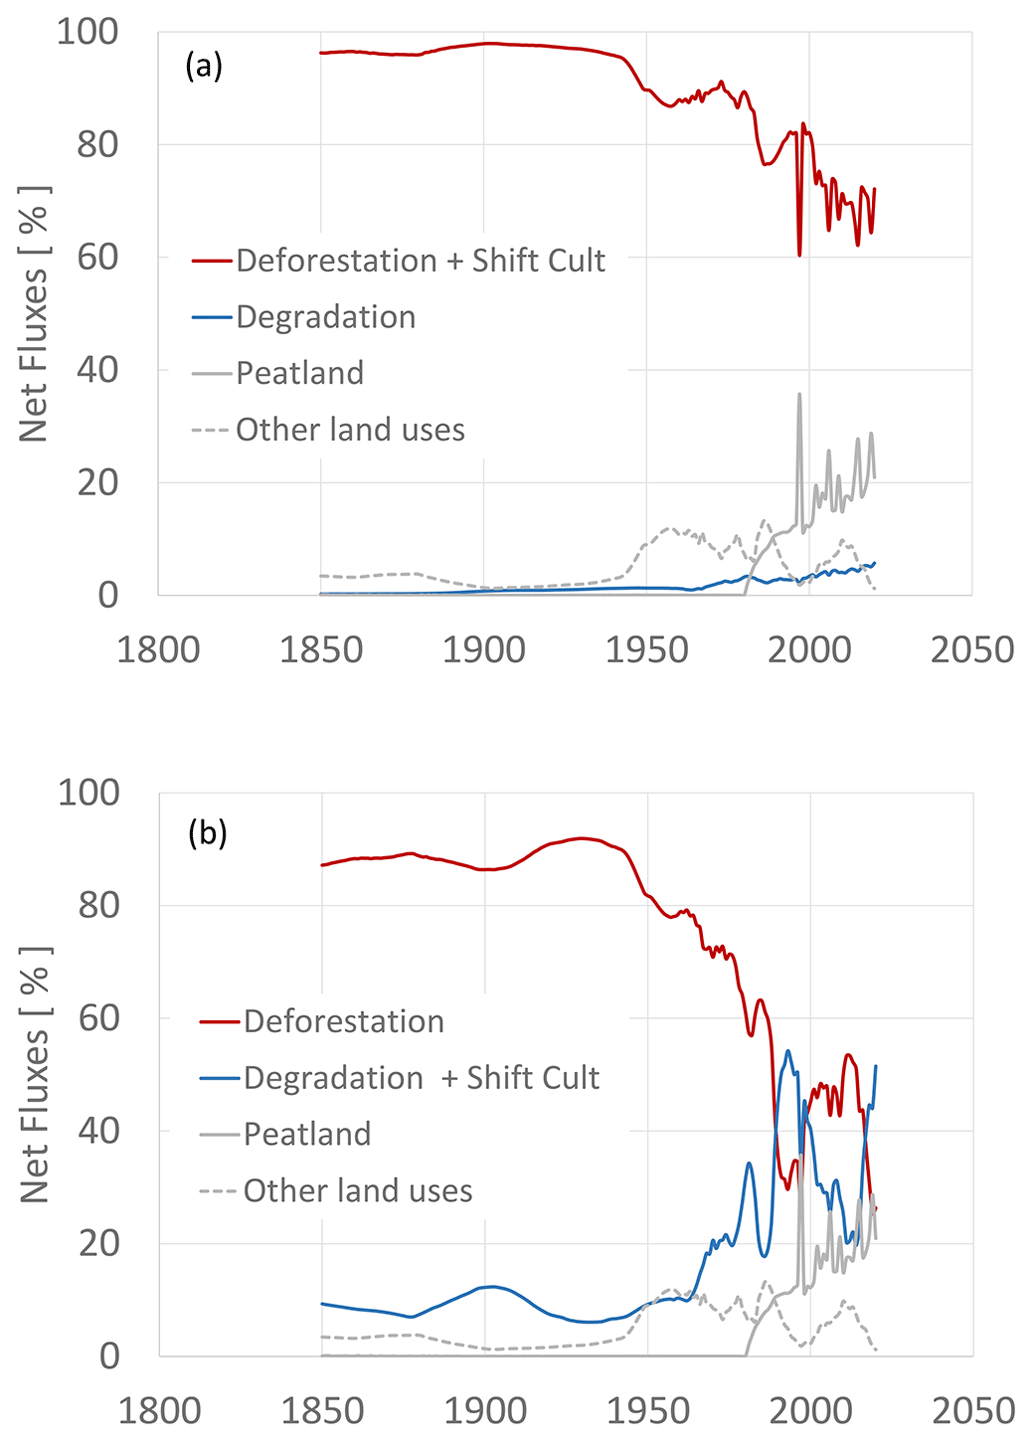
Figure 14Emissions from deforestation and forest degradation (a) if conversion of forests to shifting cultivation is deforestation and (b) if conversion of forests to shifting cultivation is degradation of forests. In the latter case, the emissions from degradation and deforestation are comparable in recent decades.
Table 7Average global annual emissions of carbon from deforestation.
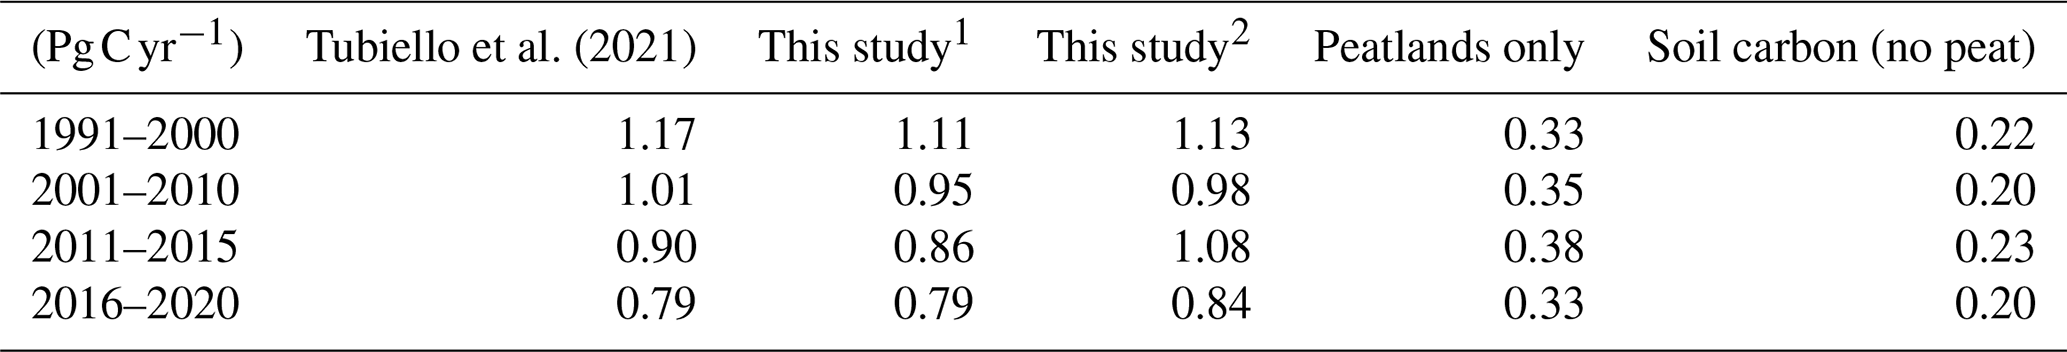
1 To make our estimates comparable with the estimates from Tubiello et al. (2021), we report the emissions from the degradation interpretation, excluding non-forests, the effects of wood harvest, and soils and peatlands. 2 For comparison, we report here the results of the shifting cultivation interpretation, including emissions from non-forests, wood harvest, soils, and peatlands.
4.2 How do these estimates of emissions compare with other recent studies?
Given that most of the data used in this analysis came from the FAO, one might expect the calculated emissions to agree with those reported by the FAO (Tubiello et al., 2021), or at least with their estimates for deforestation (Table 7). When we exclude the emissions from soils, peatlands, non-forest conversions, and wood harvests, our estimates for deforestation alone (column 3 in Table 7) are nearly identical to those reported by Tubiello et al. (2021). When we include all emissions (column 4 in Table 7), the results of the two studies are also close; however, in that case, the similarity is misleading, as net sinks in regions without deforestation (Fig. 9) are offset by emissions from peatlands.
It is perhaps worth noting that the different methods used for computing emissions had little effect on the estimates (Table 7). The bookkeeping model tracked the delayed emissions of carbon from deforested biomass left on site (slash), whereas Tubiello et al. (2021) reported all of the (committed) emissions in the year of deforestation. The nearly constant differences from one period to the next suggest that accounting for time lags in emissions from deforestation had negligible effects over this period.
As noted earlier, the emissions calculated here were not very different (1850–2015) from those reported by Houghton and Nassikas (2017), although the similarity was more the result of offsetting differences than of identical data and assumptions. Houghton and Nassikas (2017) did not include shifting cultivation explicitly, but they did include the conversion of forest to other land by using the recovering interpretation described here. More importantly, Houghton and Nassikas (2017) considered this conversion of forest to other land only in the years following 1990, when the FAO began their consistent reporting of changes in forest area. In the analysis reported here, we extrapolated FCO into the past based on earlier FAO estimates in FAOSTAT (FAO, 2021) and qualitative expert opinion reported in Heinimann et al. (2017). Thus, although the results of the two studies are similar, those reported here are more comprehensive and up to date.
The net and gross emissions reported here are lower than the emissions calculated by BLUE (Hansis et al., 2015) and OSCAR (Gasser et al., 2020), two other bookkeeping models used by the Global Carbon Project (GCP) (Friedlingstein et al., 2022). The difference may be explained by lower values of biomass in the model of Houghton and Nassikas (2017) (Bastos et al., 2021). Other differences may be attributed to different definitions of land use (Pongratz et al., 2014), different data sets (Gasser et al., 2020), as well as different model parameters and assumptions (Bastos et al., 2021).
Overall, the variation in estimates among bookkeeping models is small in comparison with other recent estimates of terrestrial carbon emissions (Harris et al., 2021; Xu et al., 2021; Tubiello et al., 2021). The reason for this is largely understood (Grassi et al., 2018; Grassi et al., 2022; Schwingshackl et al., 2022). Bookkeeping models calculate higher emissions because they exclude the indirect effects of environmental change on carbon emissions (Friedlingstein et al., 2022). Thus, we could compare our results with the deforestation emissions of Tubiello et al. (2021) but not with their emissions from forest land. For the same reasons, emissions calculated by bookkeeping models are higher than those reported for managed lands in national greenhouse gas inventories (Grassi et al., 2018, 2022).
Finally, we consider our estimates relative to two recent studies that have documented forest degradation (Kan et al., 2023; Lapola et al., 2023). We explicitly considered wood harvest as contributing to forest degradation (lower carbon stocks), and we considered the consequences of attributing shifting cultivation to forest degradation. However, there are other factors leading to forest degradation that are not considered by FAOSTAT (FAO, 2021) nor in this analysis. For example, Kan et al. (2023) attributed most of the loss (degradation or fragmentation) of intact forest landscapes to nonagricultural activities (forestry as well as mining and energy extraction, including the associated road networks). These losses were attributed to degradation, not deforestation, and thus the work does not help explain FCO, but it does suggest that forest degradation is important and directly anthropogenic. In contrast, degradation of the Amazon forest, attributed to fire, edge effects, timber extraction, and/or extreme drought (Lapola et al., 2023), is a mixture of both direct and indirect anthropogenic effects. If these two studies are accurate and representative, our estimates are likely biased toward the low end because we failed to account for a host of anthropogenic processes degrading forests. On the other hand, forest inventories suggest that the world's forests are gaining biomass, not losing it (Pan et al., 2011; Tubiello et al., 2021). Clearly, the issue of forest degradation needs more attention, and separating direct and indirect effects on forest land is likely to be more challenging than it is for deforestation.
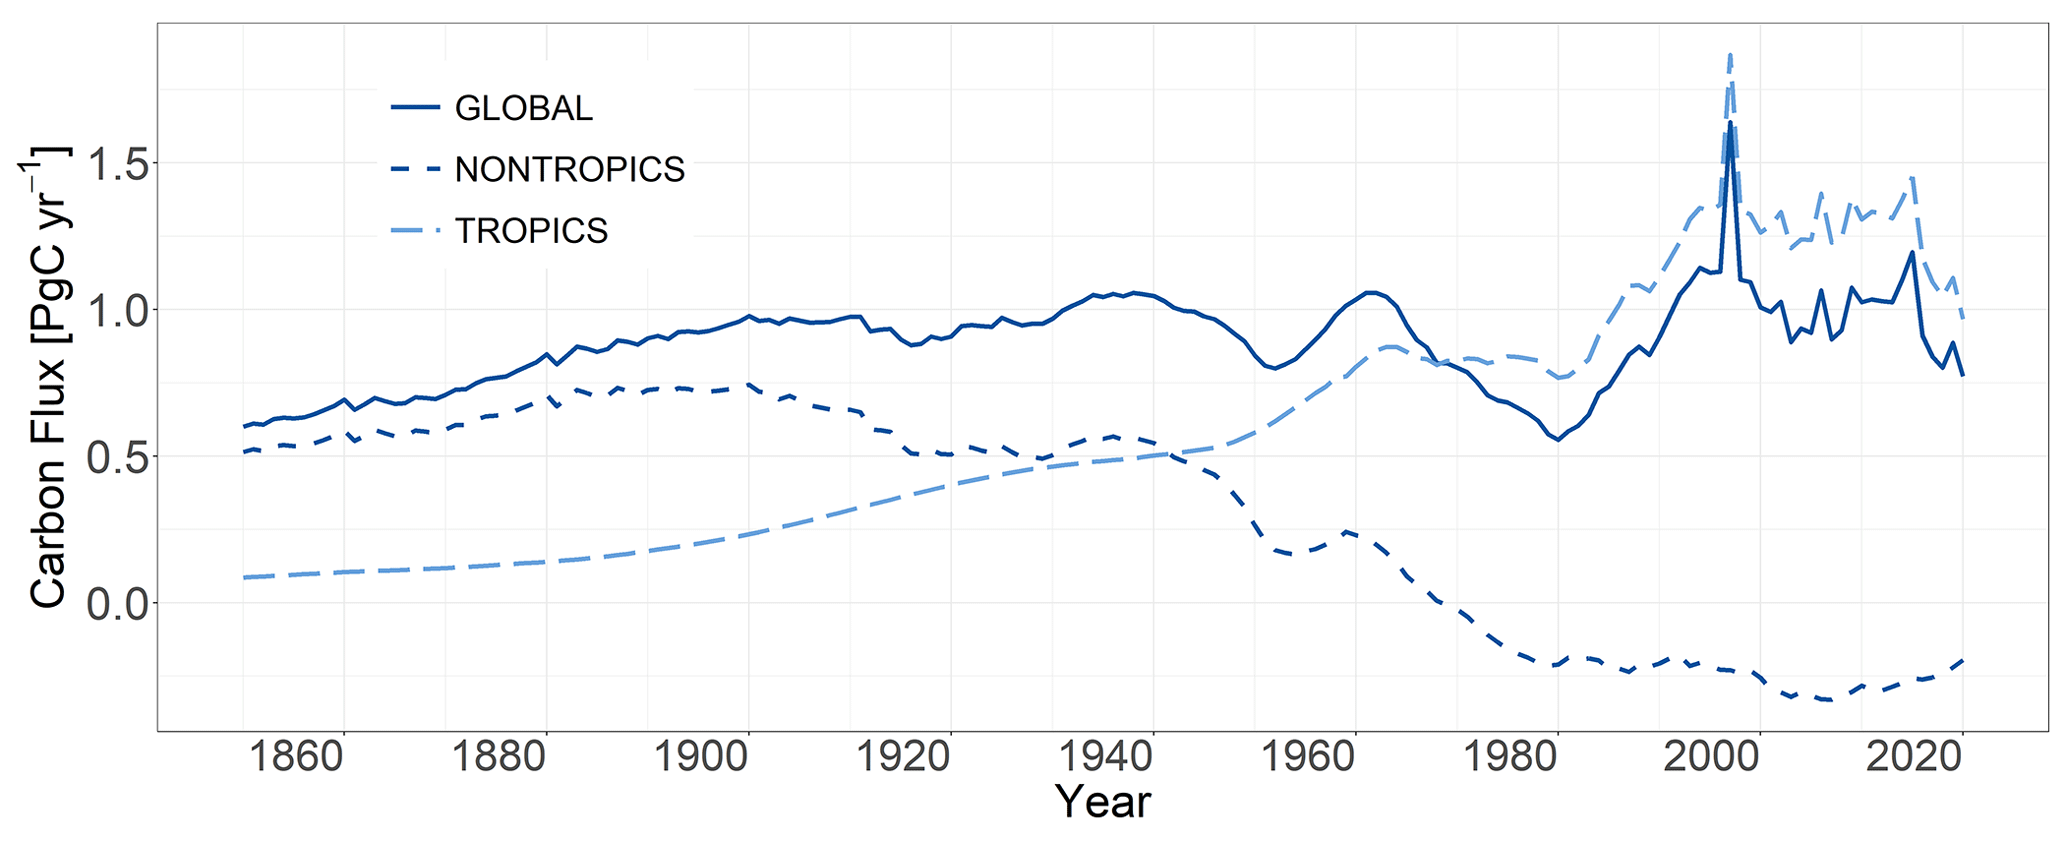
Figure 15Net annual emissions of carbon from LULUCF for the globe, tropical regions, and nontropical regions. The estimates are based on the shifting cultivation interpretation, including peatlands.
4.3 Are emissions from LULUCF declining?
The recent decline in LULUCF emissions reported here (Fig. 15) was documented earlier by the FAO's Global Forest Resources Assessment report (FAO, 2020) (Tubiello et al., 2021). The decline is consistent with the two other bookkeeping models (BLUE and OSCAR) used by the GCP (Friedlingstein et al., 2022), although more precipitous. The decline in tropical emissions was new in the 2021 GCP budget (Friedlingstein et al., 2022) and represented a notable revision to global emissions (CarbonBrief, 2021). The emissions from the BLUE (Hansis et al., 2015) and OSCAR (Gasser et al., 2020) bookkeeping models were based on the land use data set LUH2-GCB2021 (Hurtt et al., 2017, 2020; Chini et al., 2021), which, in turn, used data on land-use change from the FAO and version 3.3 of the History Database of the Global Environment (HYDE) data set (Klein Goldewijk et al., 2017b, 2017a). Thus, the data on land-use change employed in all three bookkeeping models were based, at least in part, on rates of land-use change from FAOSTAT. Despite the use of this common data set, differences among the estimated emissions still remain, perhaps because national statistics differ from those reported by FAOSTAT. Analyses by Kondo et al. (2022) and Yu et al. (2022) provide recent examples of discrepancies in reported rates of land-use change in Southeast Asia and China, respectively.
In contrast to the declining emissions calculated from the FAO data on land use, Feng et al. (2022), using high-resolution satellite data to document changes in forest area in the tropics, reported a near doubling of emissions between 2001–2005 (average emissions of 0.97 Pg C yr−1) and 2015–2019 (1.99 Pg C yr−1). Interestingly, the emissions reported for the first period are in agreement with both our estimates and those reported by Tubiello et al. (2021) (Table 7). For the second period (2015–2019); however, Feng et al. (2022) reported emissions 2 times higher than those based on the FAO rates of deforestation.
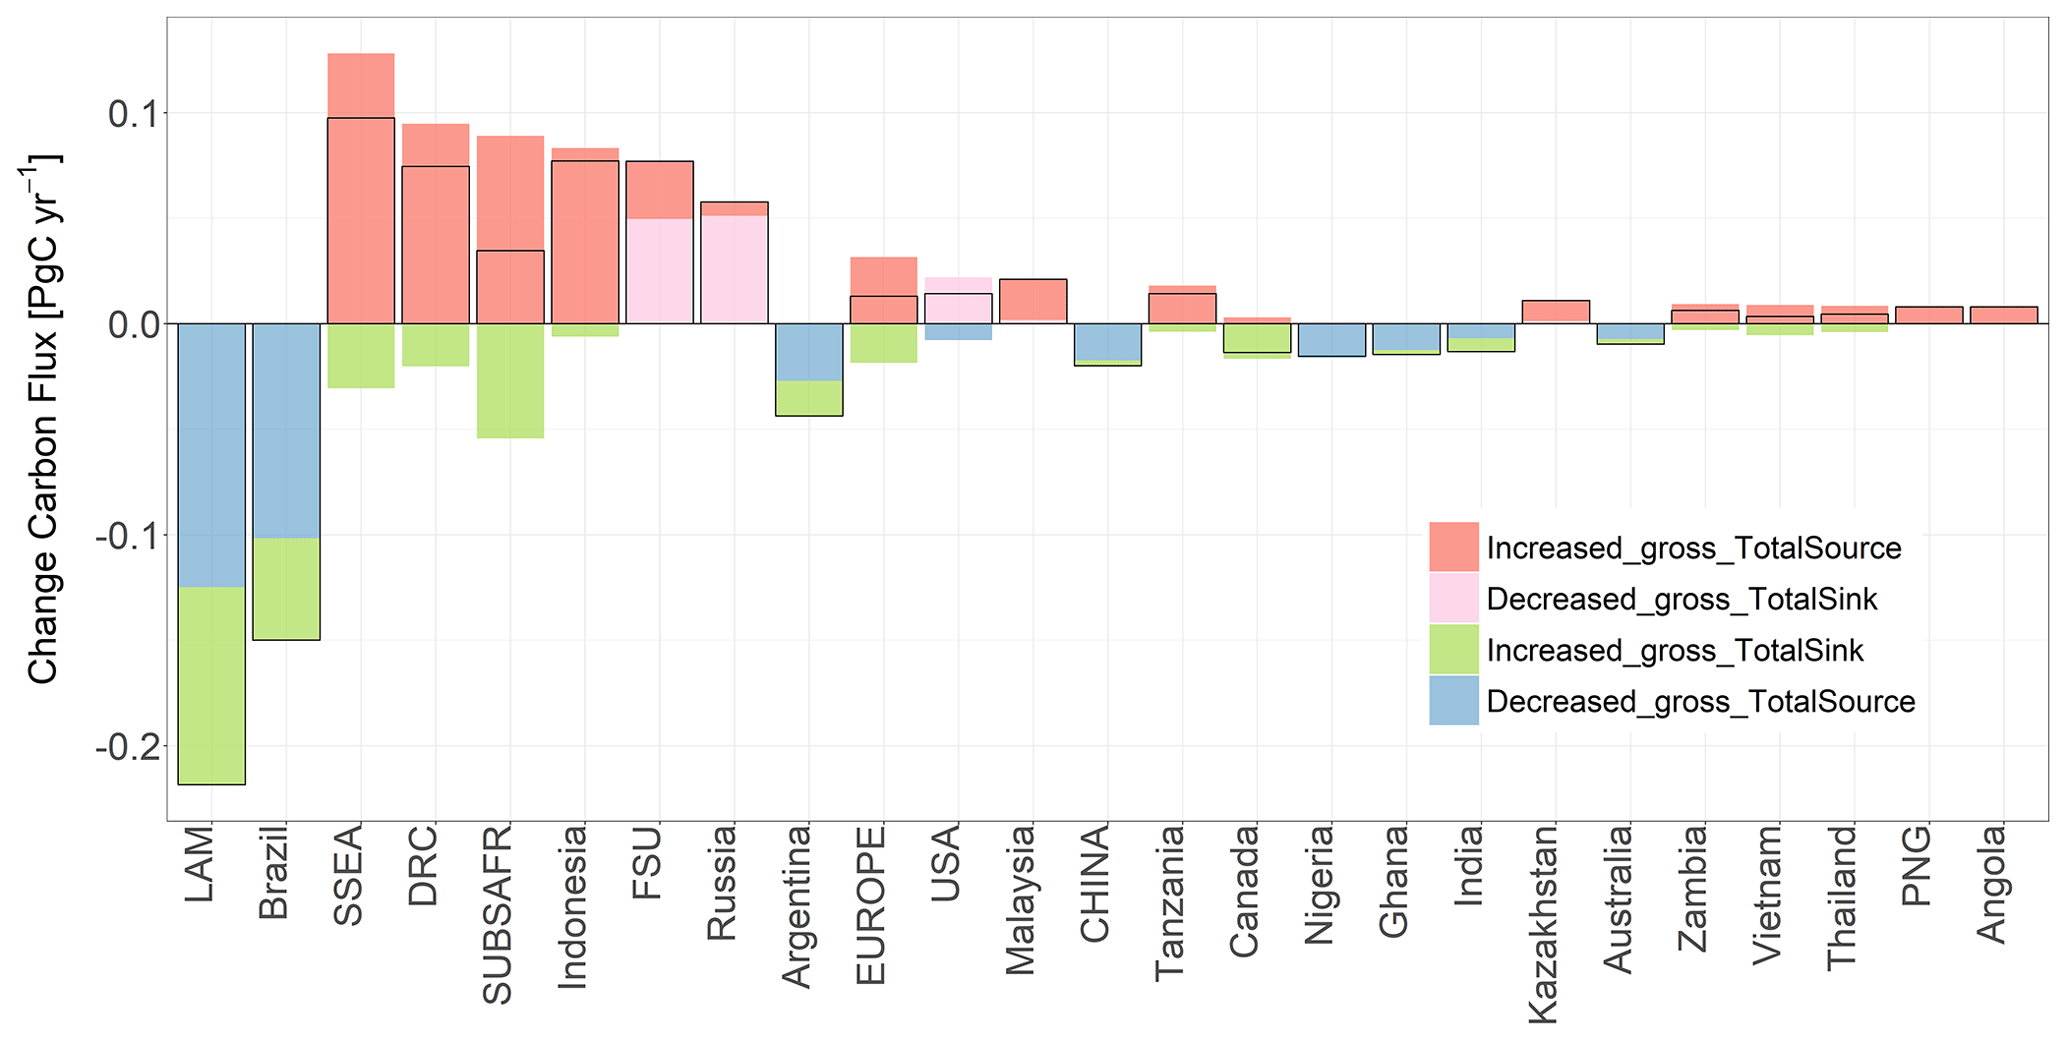
Figure 16Changes in the sources and sinks of carbon between the first and second decades of the 21st century. Changes in the net source/sink are shown by horizontal black lines. Negative values indicate reduced emissions in second decade.
None of our simulations showed the increase in emissions that Feng et al. (2022) reported, although they were qualitatively similar in identifying the regions and countries with declining and increasing rates of deforestation. In both studies, emissions were increasing in Africa and Southeast Asia and declining in Latin America (Fig. 16). In our analysis, the recent decline in emissions was led by Brazil and Argentina. An analysis comparing changes between 2001–2005 and 2015–2019 (similar to the comparison by Feng et al., 2022) did not change the results appreciably from those shown in Fig. 16.
The trends in rates of tropical deforestation and associated emissions are strikingly different between the FAO and Feng et al. (2022). Thus, we pose the following question: can the difference be explained? Below, we consider three possible explanations for how the two studies might be reconciled.
4.3.1 Are the emissions from deforestation gross or net emissions?
When a hectare is deforested, net and gross emissions of carbon are identical. However, when FAOSTAT (FAO, 2021) reports a loss of forest area for a country, that loss is a net loss, and it is possible that high-resolution data from satellites record gross rates of forest loss that are partially offset by gross rates of forest gain within that country. In such a case, the emissions from gross losses in forest area would be greater than the emissions from net losses of forest area. It is possible that the higher estimates of deforestation (and emissions) from Feng et al. (2022) result from gross deforestation, whereas the lower estimates from FAOSTAT result from net deforestation.
4.3.2 Deforestation versus forest loss
Another possible explanation for different rates of deforestation is related to the definition of deforestation. The United Nations Framework Convention on Climate Change (UNFCCC) and the Intergovernmental Panel on Climate Change (IPCC) define deforestation as the conversion of forest to another land use, i.e., cropland, pasture, or other land. The temporary loss of forests as a result of harvests, fire, or other disturbances, even if directly anthropogenic, is not deforestation according to this definition, as the disturbed forest is expected to recover. Moreover, the land is still defined as forest if it is temporarily without trees. Some estimates of deforestation, particularly those from satellite data (e.g., Feng et al., 2022), may include temporary losses of forest that are not deforestation by this definition. Such estimates of deforestation would be higher than those reported by FAOSTAT and used here to calculate anthropogenic emissions.
4.3.3 Re-clearing of fallows already under shifting cultivation
A third possible explanation for different deforestation rates and associated emissions is that the re-clearing of fallows under shifting cultivation may be attributed to deforestation. The term deforestation is appropriate the first time a forest is converted to shifting cultivation, but subsequent re-clearing of fallow is not deforestation (unless the recovery of forest in the fallows is identified as an increase in forest area). The cropped areas of shifting cultivation have tree cover and may be mistakenly identified as forests with remote sensing. Older fallows are even more forest-like, although perhaps recognizable as degraded forest.
If only a small fraction of the re-clearing of fallows was counted as deforestation by Feng et al. (2022), the rate of deforestation would have been inflated. According to our analysis, the area under shifting cultivation was 450 × 106 ha in 2020. More importantly, the annual re-clearing of these lands was 25.7 × 10⁶ ha in 2020. This rate is large in comparison to tropical deforestation rates of 10 × 106 ha inferred from FAOSTAT (FAO, 2021).
Although any of these three explanations might help explain why satellite-based data would provide higher rates of forest loss than ground surveys, none of them explains why the disagreement between FAOSTAT (FAO, 2021) and Feng et al. (2022) was only for the second period and not the first. The two studies report changes in emissions of opposite sign. It would appear that one of them is simply wrong.
4.3.4 What if some deforestation is not directly anthropogenic?
Aragão et al. (2018) reported that the (directly anthropogenic) emissions from deforestation in Brazilian Amazonia were declining, whereas the (indirectly anthropogenic) emissions from drought-related fires were increasing. The authors reported this finding despite the observation that many fires in Amazonia were arguably the direct effect of human activity (deliberate burning to clear forests). The finding raises the possibility that some deforestation may not be directly anthropogenic, but rather a consequence of indirect effects (e.g., changes in climate, fires, and storms) (Gatti et al., 2021). However, this possibility does not help explain the difference between Feng et al. (2022) and FAOSTAT, as they both reported forest loss and did not distinguish anthropogenic from non-anthropogenic loss.
Nevertheless, the question of causality (direct versus indirect anthropogenic effects) is important, as the global net effect of environmental change, so far, has been to increase carbon storage on land. However, changes in the environment (indirect effects) may result in gross emissions as well as sinks. It may be that terrestrial sinks are decreasing (or emissions from indirect effects are increasing) (Aragão et al., 2018). Fire-induced savannization of tropical forests has long been recognized as a potential consequence of climate change (Cochrane et al., 1999; Beckett et al., 2022). Perhaps such a transition is beginning.
The broader issue is whether changes in land use and land cover are directly anthropogenic or not. We assumed that changes in land use reported by FAOSTAT were indeed directly anthropogenic. Clearly, croplands and pastures are (directly anthropogenic) land uses. Forestry is also anthropogenic, but forests and other land are not land uses, they are land covers; thus, if changes in other land result not only from changes in land use but also from indirect effects, FCO may not be anthropogenic, as assumed here. The distinction between directly and indirectly anthropogenic is important, as emissions from indirect effects offer clues regarding whether the terrestrial carbon sink may be changing. If land-use data from the FAO include indirect as well as direct effects, those data may no longer help define or constrain direct effects.
The distinction between direct and indirect effects has some similarities with the distinction between land use and land cover. Land use is clearly anthropogenic, whereas land cover may or may not be. Hence, the two commonly used acronyms to describe terrestrial carbon emissions – LULUCF (land use, land-use change, and forestry) and LULCC (land-use and land-cover change) – are not the same. LULUCF is a UNFCCC and IPCC term and concerns direct anthropogenic changes in land use. In contrast, LULCC, a term used by NASA and generally based on satellite data, concerns changes in land cover. The terms have been used interchangeably but perhaps ought not to be. LULUCF is generally assumed to be anthropogenic, whereas LULCC includes land-cover change, which need not be anthropogenic. If some deforestation is driven by changes in climate (e.g., droughts, fires, and storms), it should be attributed to indirect effects.
Indirect effects are believed responsible for a land sink that is larger than the net emissions from management (Friedlingstein et al., 2022). That does not mean, however, that all indirect effects remove carbon from the atmosphere. Some may also drive emissions. Amazonia may be an example of a region in which indirect effects are leading to additional emissions instead of (or as well as) sinks of carbon. The possibility would help explain why the global land sink seems to have shifted from the tropics to boreal regions after the 1980s (Ciais et al., 2019).
Our use of data from FAOSTAT assumed that changes in land use/land cover were directly anthropogenic. On the contrary, changes in forest land and other land, in particular, could include both direct and indirect effects. Most scholars think that droughts, fires, and storms have so far been minor in replacing forests with other land cover. In other words, deforestation has been largely anthropogenic to date. The same is not true for forest degradation, which is driven by both direct and indirect effects. Separation of the emissions attributable to these effects is important, as mistaken attribution could mask a declining land sink. Indeed, declining emissions from LULUCF, given a generally constant airborne fraction, suggest that the land and/or ocean sinks are also declining (Van Marle et al., 2022). Documentation of such a decline is crucial.
Overall, one would expect satellite-based changes in land use to be more consistent (the same approach used everywhere) and, perhaps, more accurate (less potential for cheating) than changes reported to the FAO by individual countries using varied methods for determining change. Sadly, however, if the conditions described above account for the divergent trends in rates of deforestation and reported emissions, then data from satellites may not provide an easy resolution. The “advantage” of satellite data being more consistent may not be an advantage if, for example, shifting cultivation is not consistently practiced in different countries. Furthermore, anthropogenic versus non-anthropogenic disturbances are difficult to distinguish with any kind of measurement, and the fate of disturbed lands (including both land use and carbon density) may remain uncertain for years following a disturbance. The recent disagreement between satellite-based and ground-based rates of wood harvest in Europe provides an example of the limitations of satellite-based measures of land use (Palahí et al., 2021; Ceccherini et al., 2020; Picard et al., 2021; Wernick et al., 2021).
On the other hand, forest degradation, as opposed to deforestation, may be better documented with satellite data than with tabular data, as it seems to be widespread and caused by a variety of different agents and processes (Kan et al., 2023; Lapola et al., 2023). Satellites with lidar or radar sensors are especially promising for estimating changes in aboveground biomass (Baccini et al., 2017; Brandt et al., 2018), although not necessarily for assigning cause.
One further advantage of satellite data (as opposed to tabular data) is their explicit geographic specificity. If the spatial resolution is fine enough, maps of changes in area can be overlaid on maps of biomass to determine the biomass of the forests actually deforested (Harris et al., 2021). Furthermore, knowing where deforestation has occurred may help identify what the deforestation was for (i.e., what “other land” is) and what caused it. Ground surveys may provide more detail and accuracy, but the magnitude and distribution of change, globally, clearly require a combination of ground- and space-based observations.
Annual emissions of carbon from land use, land-use change, and forestry (LULUCF) as reported in this analysis are available through the Harvard Dataverse (https://doi.org/10.7910/DVN/U7GHRH, Houghton and Castanho, 2023). The tabular data include both net and gross annual fluxes of carbon globally and regionally from 1850 to 2020 as well as a list of the countries included in each region. The emissions were calculated with a bookkeeping model using the shifting cultivation interpretation of land-use change, inferred from data from FAOSTAT (http://www.fao.org/faostat/en/#data/, FAO, 2021). Estimates include the emissions from peatlands in both Southeast Asia and Northern Hemisphere regions. Further breakdown of the data may be obtained directly from the authors (rhoughton@woodwellclimate.org and acastanho@woodwellclimate.org).
A major objective in quantifying the emissions of carbon from terrestrial ecosystems is to separate the emissions resulting from management (direct anthropogenic activities) from those resulting from the effects of environmental change (indirect effects). Those resulting from management can, in theory, be controlled, whereas those resulting from environmental change are more difficult to control. The estimated emissions of carbon from LULUCF calculated in this analysis approximate the emissions resulting from management, but they are not complete: they do not include the effects of agricultural management practices (e.g., irrigation), only the effects of converting lands from one use to another. They also include the major effects of forestry (i.e., wood harvest). Despite the difficulties and uncertainties apparent throughout this effort, quantifying the terrestrial emissions of carbon that are directly anthropogenic is important, both for predicting future rates of climate change and for identifying land-based solutions for mitigation.
However, the separation of emissions into those caused by direct, as opposed to indirect, effects of human activity may not be necessary for national reporting of emissions and, further, it may be limiting. Carbon credits and debits are now limited to anthropogenic emissions, defined by the emissions from managed lands (Ogle et al., 2018; Grassi et al., 2018; Grassi et al., 2022). Nevertheless, the emissions from managed land include indirect effects as well. It would be much simpler in practice, consistent with observations, and would provide the appropriate incentives for mitigation if countries were credited and debited for all emissions and removals of carbon on all lands. Penalties for emissions resulting from droughts, fires, and natural disturbances might seem unfair, but the same unfairness applies equally to current rewards for carbon removals (the land sink). At present, at a global scale, the non-anthropogenic land sink is greater than the net emissions attributable to anthropogenic activities. Policies that rewarded countries for maintaining and enhancing that sink would provide a greater opportunity for slowing climate change than policies rewarding only reductions in anthropogenic emissions.
Table A1Detailed reference for each property downloaded from FAOSTAT (FAO, 2021) in October 2021 (FAO, 2021).
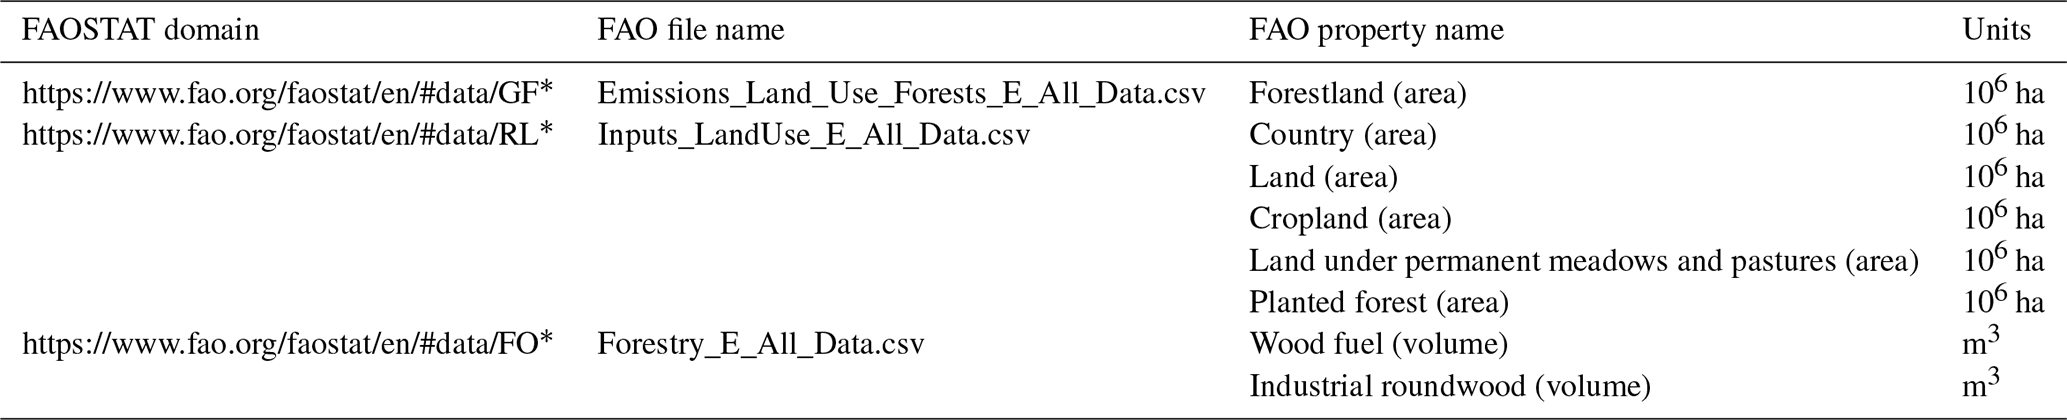
* Last access: October 2021.
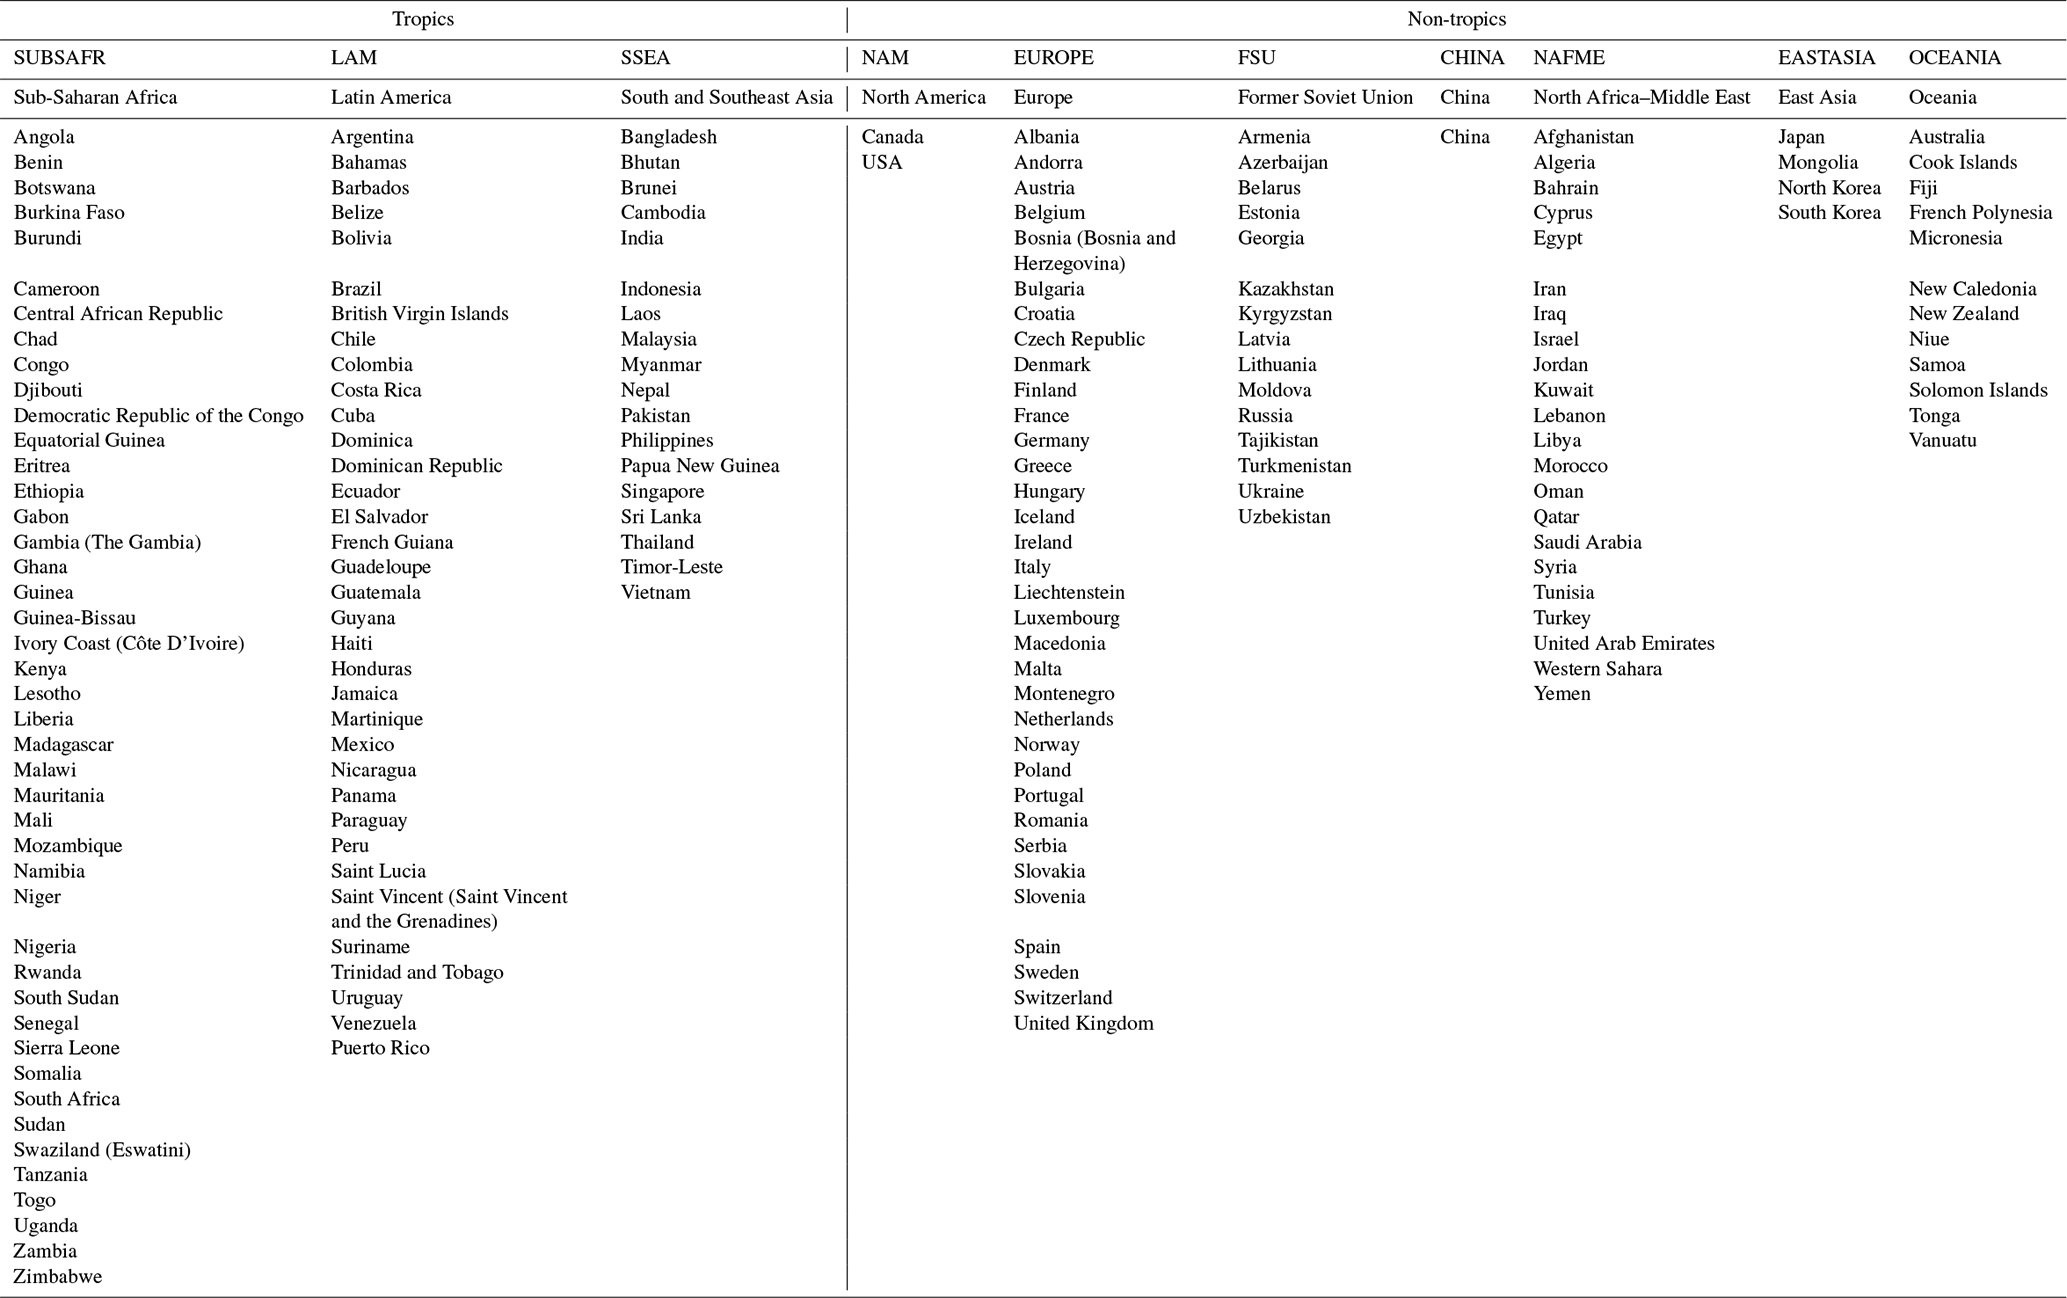
Table A3Median carbon densities (primary vegetation and soil in megagrams of carbon per hectare) for 20 types of ecosystems (ranges include the variation among different countries with the same ecosystem type).
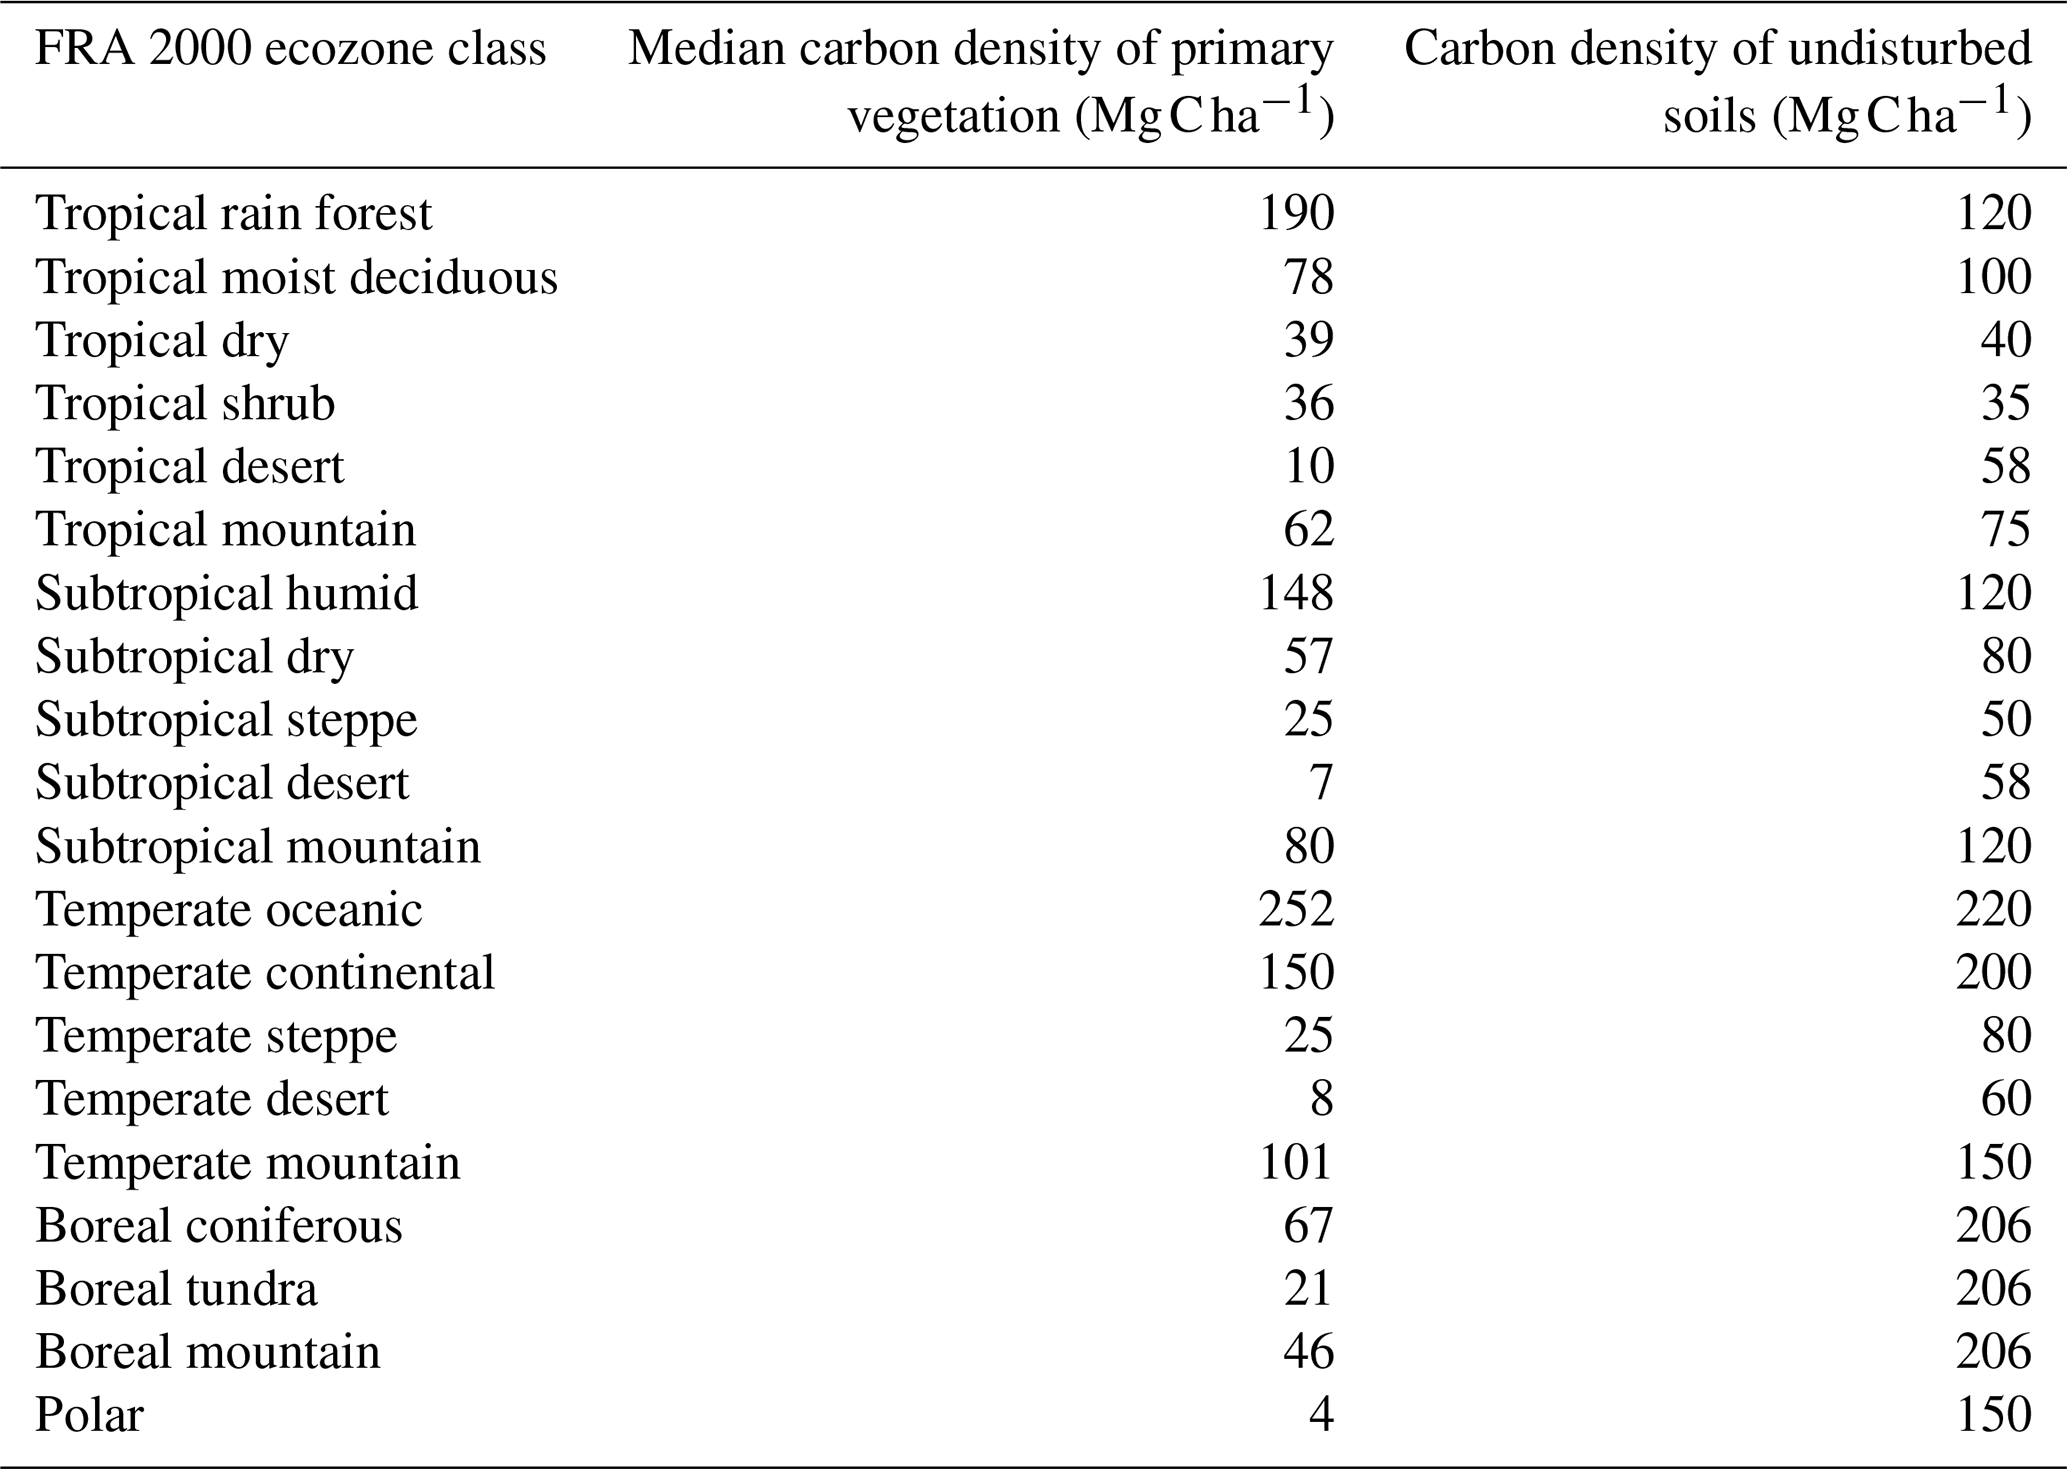
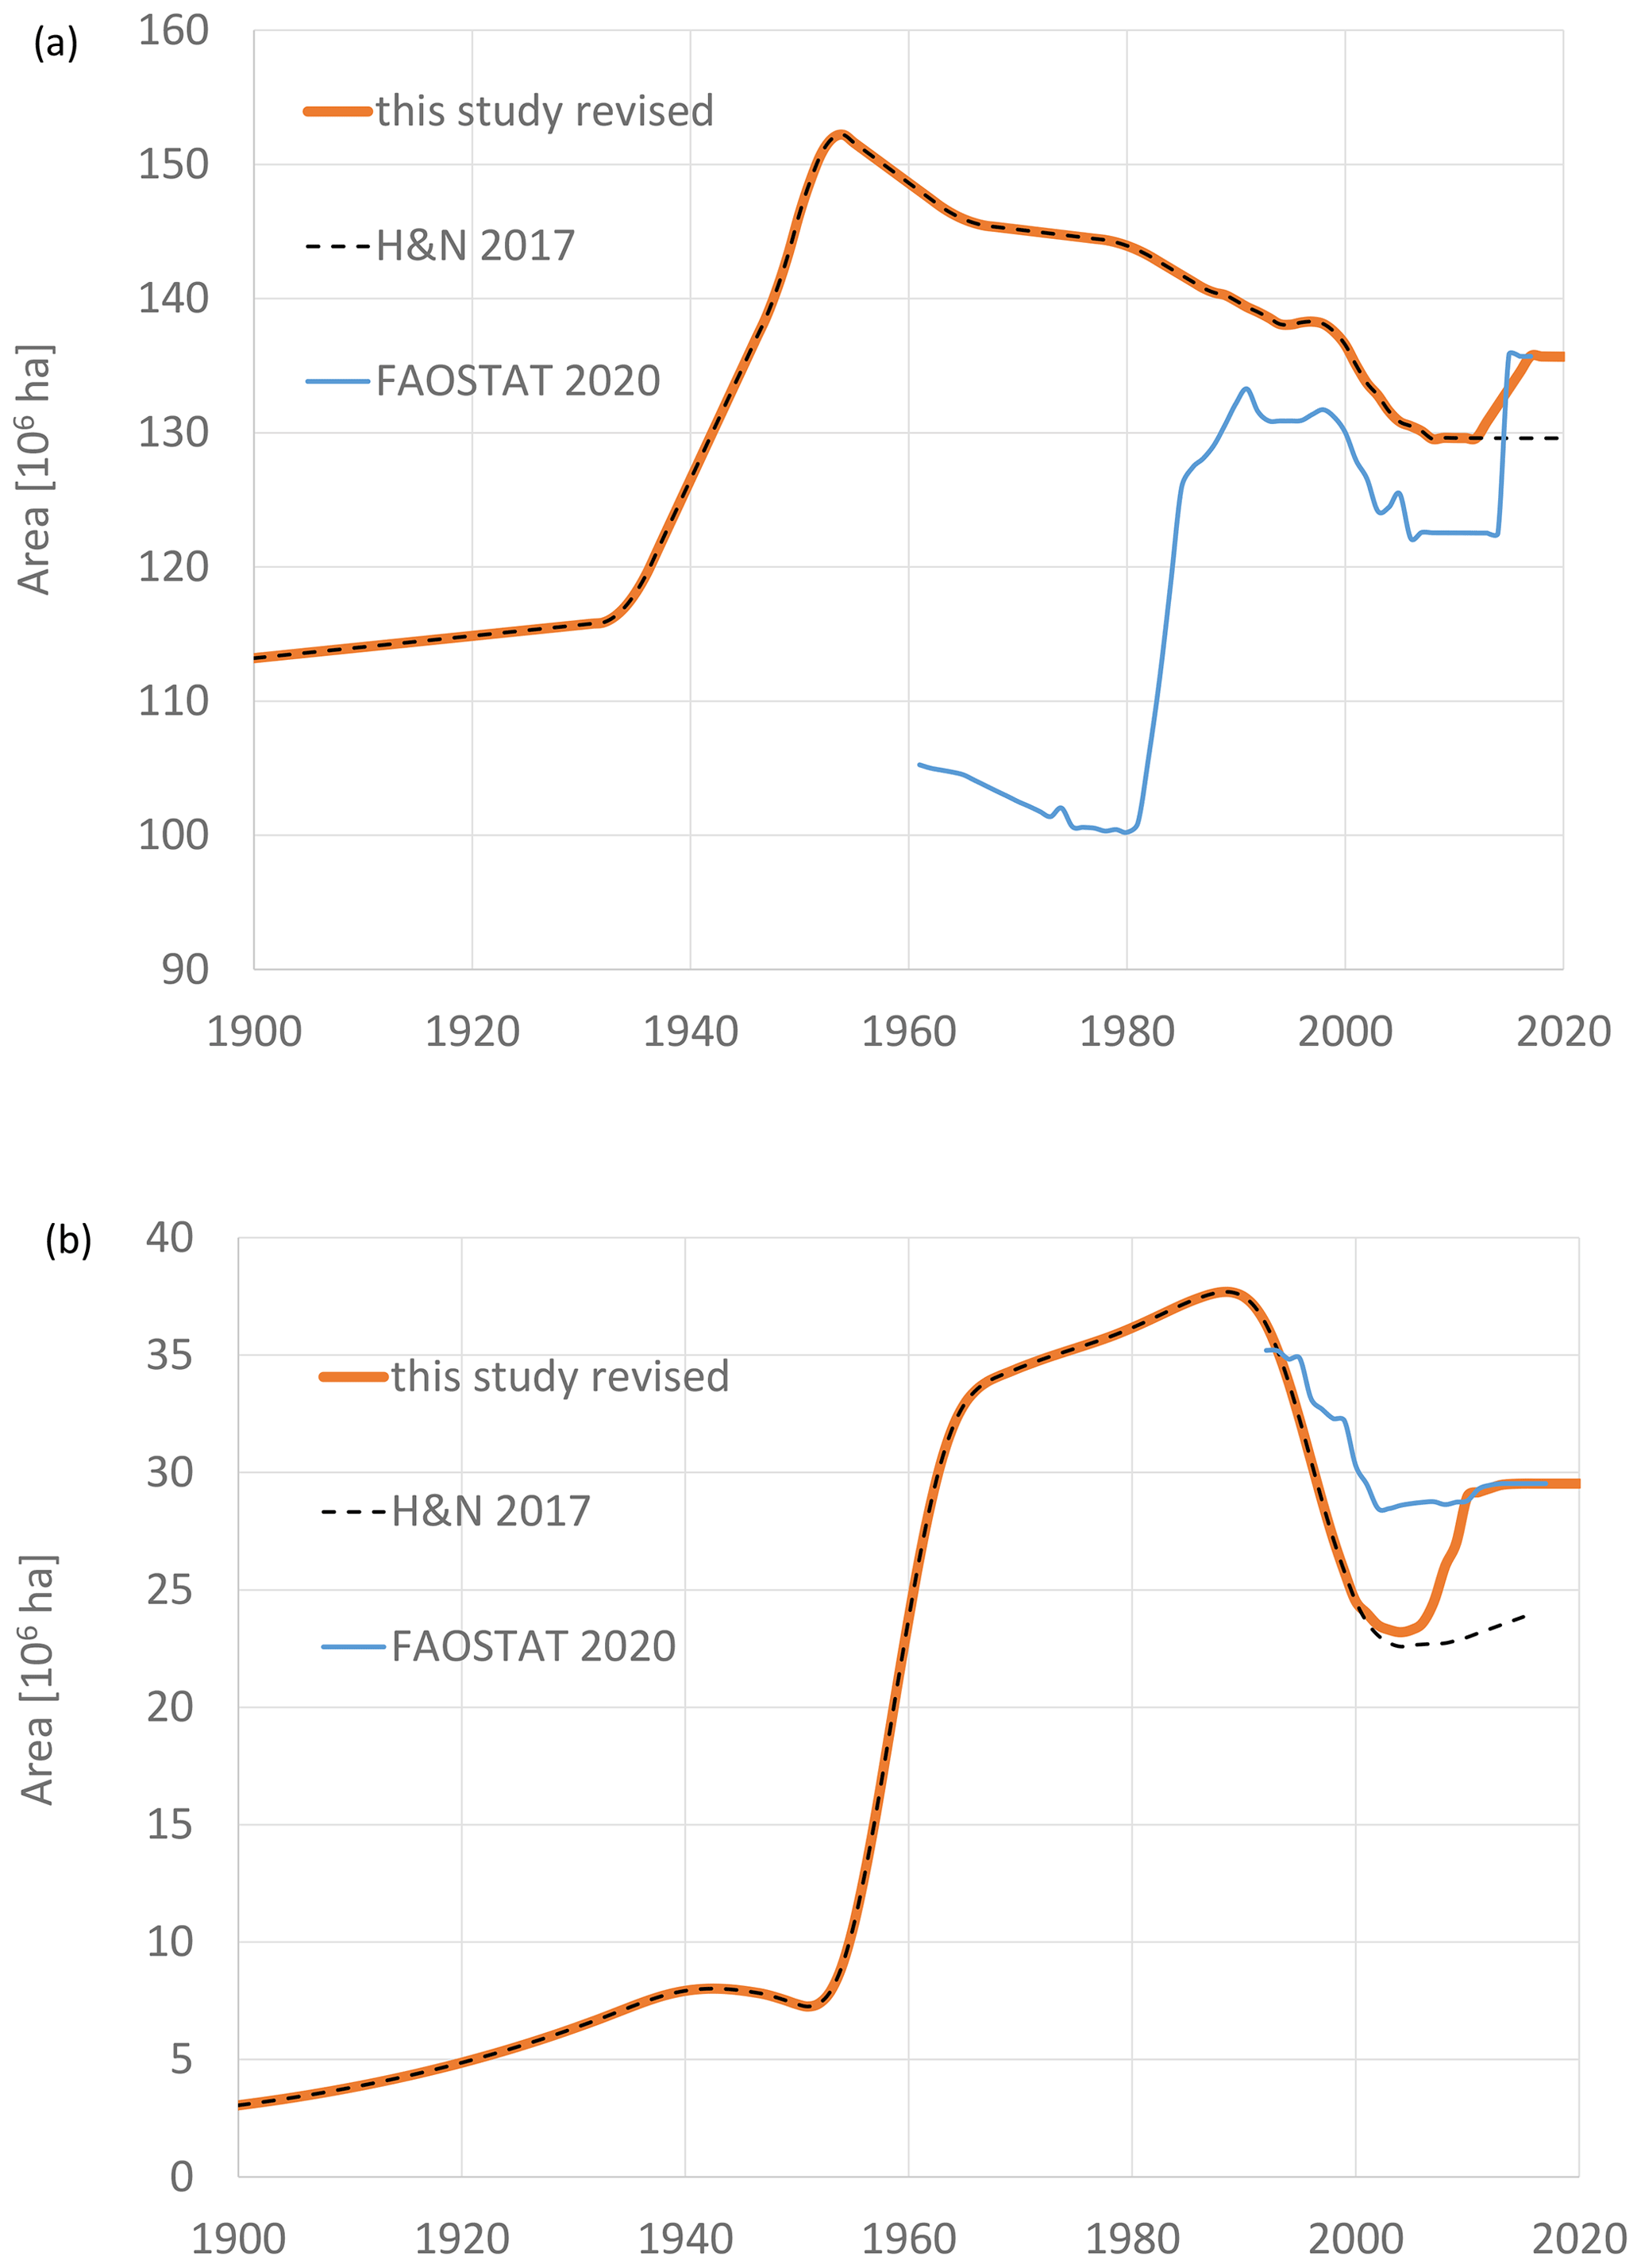
Figure B1Cropland areas revised in this study (orange line) compared to cropland area in FAOSTAT (FAO, 2021) (blue line) and Houghton and Nassikas (2017) (dashed black line) for China (a) and Kazakhstan (b).
Both RAH and AC participated in all aspects of the analysis and writing.
The contact author has declared that neither of the authors has any competing interests.
Publisher's note: Copernicus Publications remains neutral with regard to jurisdictional claims in published maps and institutional affiliations.
We thank Chunjing Qiu for providing annual emissions from the use of Northern Hemisphere peatlands and Guido van der Werf for updated estimates of carbon emissions from fires in Southeast Asia (GFED). We are grateful to Francesco Tubiello and two anonymous reviewers for their suggestions that increased the accuracy, clarity, and comprehensiveness of the final work, which is not to say that they agree with everything written here.
Funding was provided by the Fund for Climate Solutions through the Woodwell Climate Research Center.
This paper was edited by Hao Shi and reviewed by two anonymous referees.
Aragão, L. E. O. C., Anderson, L. O., Fonseca, M. G., Rosan, T. M., Vedovato, L. B., Wagner, F. H., Silva, C. V. J., Silva Junior, C. H. L., Arai, E., Aguiar, A. P., Barlow, J., Berenguer, E., Deeter, M. N., Domingues, L. G., Gatti, L., Gloor, M., Malhi, Y., Marengo, J. A., Miller, J. B., Phillips, O. L., and Saatchi, S.: 21st Century drought-related fires counteract the decline of Amazon deforestation carbon emissions, Nat. Commun., 9, 536, https://doi.org/10.1038/s41467-017-02771-y, 2018.
Baccini, A., Walker, W., Carvalho, L., Farina, M., Sulla-Menashe, D., and Houghton, R. A.: Tropical forests are a net carbon source based on aboveground measurements of gain and loss, Science, 358, 230–234, https://doi.org/10.1126/science.aam5962, 2017.
Bartalev, S. A., Plotnikov, D. E., and Loupian, E. A.: Mapping of arable land in Russia using multi-year time series of MODIS data and the LAGMA classification technique, Remote Sens. Lett., 7, 269–278, 2016.
Bastos, A., Hartung, K., Nützel, T. B., Nabel, J. E. M. S., Houghton, R. A., and Pongratz, J.: Comparison of uncertainties in land-use change fluxes from bookkeeping model parameterisation, Earth Syst. Dynam., 12, 745–762, https://doi.org/10.5194/esd-12-745-2021, 2021.
Beckett, H., Staver, A. C., Charles-Dominique, T., and Bond, W. J.: Pathways of savannization in a mesic African savanna–forest mosaic following an extreme fire, J. Ecol., 110, 902–915, 2022.
Betts, R. A., Cox, P. M., Collins, M., Harris, P. P., Huntingford, C., and Jones, C. D.: The role of ecosystem-atmosphere interactions in simulated Amazonian precipitation decrease and forest dieback under global climate warming, Theor. Appl. Climatol., 78, 157–175, https://doi.org/10.1007/s00704-004-0050-y, 2004.
Brando, P. M., Paolucci, L., Ummenhofer, C. C., Ordway, E. M., Hartmann, H., Cattau, M. E., Rattis, L., Medjibe, V., Coe, M. T., and Balch, J.: Droughts, wildfires, and forest carbon cycling: A pantropical synthesis, Annu. Rev. Earth Planet. Sc., 47, 555–581, 2019.
Brandt, M., Wigneron, J.-P., Chave, J., Tagesson, T., Penuelas, J., Ciais, P., Rasmussen, K., Tian, F., Mbow, C., and Al-Yaari, A.: Satellite passive microwaves reveal recent climate-induced carbon losses in African drylands, Nature Ecology & Evolution, 2, 827–835, 2018.
CarbonBrief: Homepage, Carbon Brief Ltd, UK, https://www.carbonbrief.org/global-co2-emissions-have-been-flat-for-a-decade-new-data-reveals, last access: 4 November 2021.
Ceccherini, G., Duveiller, G., Grassi, G., Lemoine, G., Avitabile, V., Pilli, R., and Cescatti, A.: Abrupt increase in harvested forest area over Europe after 2015, Nature, 583, 72–77, https://doi.org/10.1038/s41586-020-2438-y, 2020.
Chini, L., Hurtt, G., Sahajpal, R., Frolking, S., Klein Goldewijk, K., Sitch, S., Ganzenmüller, R., Ma, L., Ott, L., Pongratz, J., and Poulter, B.: Land-use harmonization datasets for annual global carbon budgets, Earth Syst. Sci. Data, 13, 4175–4189, https://doi.org/10.5194/essd-13-4175-2021, 2021.
Ciais, P., Tan, J., Wang, X., Roedenbeck, C., Chevallier, F., Piao, S. L., Moriarty, R., Broquet, G., Le Quéré, C., Canadell, J. G., Peng, S., Poulter, B., Liu, Z., and Tans, P.: Five decades of northern land carbon uptake revealed by the interhemispheric CO2 gradient, Nature, 568, 221–225, https://doi.org/10.1038/s41586-019-1078-6, 2019.
Cochrane, M. A., Alencar, A., Schulze, M. D., Souza Jr, C. M., Nepstad, D. C., Lefebvre, P., and Davidson, E. A.: Positive feedbacks in the fire dynamic of closed canopy tropical forests, Science, 284, 1832–1835, 1999.
Conchedda, G. and Tubiello, F. N.: Drainage of organic soils and GHG emissions: validation with country data, Earth Syst. Sci. Data, 12, 3113–3137, https://doi.org/10.5194/essd-12-3113-2020, 2020.
Curtis, P. G., Slay, C. M., Harris, N. L., Tyukavina, A., and Hansen, M. C.: Classifying drivers of global forest loss, Science, 361, 1108–1111, 2018.
Davidson, E. A. and Ackerman, I. L.: Changes in soil carbon inventories following cultivation of previously untilled soils, Biogeochemistry, 20, 161–193, 1993.
De Sy, V., Herold, M., Achard, F., Beuchle, R., Clevers, J., Lindquist, E., and Verchot, L.: Land use patterns and related carbon losses following deforestation in South America, Environ. Res. Lett., 10, 124004, https://doi.org/10.1088/1748-9326/10/12/124004, 2015.
Detwiler, R.: Land use change and the global carbon cycle: the role of tropical soils, Biogeochemistry, 2, 67–93, 1986.
Erb, K.-H., Kastner, T., Luyssaert, S., Houghton, R. A., Kuemmerle, T., Olofsson, P., and Haberl, H.: Bias in the attribution of forest carbon sinks, Nat. Clim. Change, 3, 854–856, 2013.
Fantini, A. C., Bauer, E., de Valois, C. M., and Siddique, I.: The demise of swidden-fallow agriculture in an Atlantic Rainforest region: Implications for farmers' livelihood and conservation, Land Use Policy, 69, 417–426, 2017.
FAO: Forest Resources Assessment 1990. Tropical Countries, FAO Forestry Paper 112, FAO, Rome, 1993.
FAO: FAOSTAT Statistical Database, FAO, Rome, http://www.fao.org/faostat/en/#data/ (last access: March 2016), 2015.
FAO: Global Forest Resources Assessment, FRA, FAO, Rome, Extracted from: http://www.fao.org/forestry/fra/fra2020/en/ (last access: October 2021), 2020.
FAO: FAOSTAT Statistical Database, FAO, Rome, Extracted from: http://www.fao.org/faostat/en/#data/ (last access: October 2021), 2021.
FAO/UNEP: Los Recursos Foresrales de Ia America Tropical (United Nations 32/6.1301-78-04, lnforme tecnico 1, FAO, Rome, 1981); Forest Resources of Tropical Africa Parts I and 2 (UN 32/6.1301-78-04, Tech. Rep. 2, FAO, Rome, 1981); Forest Resources of Tropical Asia (UN 32/6.1301-78-04, Tech. Rep. 3, FAO, Rome, 1981), 1981.
Federici, S., Tubiello, F. N., Salvatore, M., Jacobs, H., and Schmidhuber, J.: New estimates of CO2 forest emissions and removals: 1990–2015, Forest Ecol. Manag., 352, 89–98, 2015.
Feng, Y., Zeng, Z., Searchinger, T. D., Ziegler, A. D., Wu, J., Wang, D., He, X., Elsen, P. R., Ciais, P., and Xu, R.: Doubling of annual forest carbon loss over the tropics during the early twenty-first century, Nature Sustainability, 5, 444–451, 2022.
Field, R. D., van Der Werf, G. R., and Shen, S. S.: Human amplification of drought-induced biomass burning in Indonesia since 1960, Nat. Geosci., 2, 185–188, 2009.
Friedlingstein, P., O'Sullivan, M., Jones, M. W., Andrew, R. M., Gregor, L., Hauck, J., Le Quéré, C., Luijkx, I. T., Olsen, A., Peters, G. P., Peters, W., Pongratz, J., Schwingshackl, C., Sitch, S., Canadell, J. G., Ciais, P., Jackson, R. B., Alin, S. R., Alkama, R., Arneth, A., Arora, V. K., Bates, N. R., Becker, M., Bellouin, N., Bittig, H. C., Bopp, L., Chevallier, F., Chini, L. P., Cronin, M., Evans, W., Falk, S., Feely, R. A., Gasser, T., Gehlen, M., Gkritzalis, T., Gloege, L., Grassi, G., Gruber, N., Gürses, Ö., Harris, I., Hefner, M., Houghton, R. A., Hurtt, G. C., Iida, Y., Ilyina, T., Jain, A. K., Jersild, A., Kadono, K., Kato, E., Kennedy, D., Klein Goldewijk, K., Knauer, J., Korsbakken, J. I., Landschützer, P., Lefèvre, N., Lindsay, K., Liu, J., Liu, Z., Marland, G., Mayot, N., McGrath, M. J., Metzl, N., Monacci, N. M., Munro, D. R., Nakaoka, S.-I., Niwa, Y., O'Brien, K., Ono, T., Palmer, P. I., Pan, N., Pierrot, D., Pocock, K., Poulter, B., Resplandy, L., Robertson, E., Rödenbeck, C., Rodriguez, C., Rosan, T. M., Schwinger, J., Séférian, R., Shutler, J. D., Skjelvan, I., Steinhoff, T., Sun, Q., Sutton, A. J., Sweeney, C., Takao, S., Tanhua, T., Tans, P. P., Tian, X., Tian, H., Tilbrook, B., Tsujino, H., Tubiello, F., van der Werf, G. R., Walker, A. P., Wanninkhof, R., Whitehead, C., Willstrand Wranne, A., Wright, R., Yuan, W., Yue, C., Yue, X., Zaehle, S., Zeng, J., and Zheng, B.: Global Carbon Budget 2022, Earth Syst. Sci. Data, 14, 4811–4900, https://doi.org/10.5194/essd-14-4811-2022, 2022.
Gasser, T., Crepin, L., Quilcaille, Y., Houghton, R. A., Ciais, P., and Obersteiner, M.: Historical CO2 emissions from land use and land cover change and their uncertainty, Biogeosciences, 17, 4075–4101, https://doi.org/10.5194/bg-17-4075-2020, 2020.
Gatti, L. V., Basso, L. S., Miller, J. B., Gloor, M., Gatti Domingues, L., Cassol, H. L. G., Tejada, G., Aragão, L. E. O. C., Nobre, C., Peters, W., Marani, L., Arai, E., Sanches, A. H., Corrêa, S. M., Anderson, L., Von Randow, C., Correia, C. S. C., Crispim, S. P., and Neves, R. A. L.: Amazonia as a carbon source linked to deforestation and climate change, Nature, 595, 388–393, https://doi.org/10.1038/s41586-021-03629-6, 2021.
Grassi, G., House, J., Kurz, W. A., Cescatti, A., Houghton, R. A., Peters, G. P., Sanz, M. J., Viñas, R. A., Alkama, R., and Arneth, A.: Reconciling global-model estimates and country reporting of anthropogenic forest CO2 sinks, Nat. Clim. Change, 8, 914–920, 2018.
Grassi, G., Schwingshackl, C., Gasser, T., Houghton, R. A., Sitch, S., Canadell, J. G., Cescatti, A., Ciais, P., Federici, S., Friedlingstein, P., Kurz, W. A., Sanz Sanchez, M. J., Abad Viñas, R., Alkama, R., Bultan, S., Ceccherini, G., Falk, S., Kato, E., Kennedy, D., Knauer, J., Korosuo, A., Melo, J., McGrath, M. J., Nabel, J. E. M. S., Poulter, B., Romanovskaya, A. A., Rossi, S., Tian, H., Walker, A. P., Yuan, W., Yue, X., and Pongratz, J.: Harmonising the land-use flux estimates of global models and national inventories for 2000–2020, Earth Syst. Sci. Data, 15, 1093–1114, https://doi.org/10.5194/essd-15-1093-2023, 2023.
Guo, L. B. and Gifford, R. M.: Soil carbon stocks and land use change: a meta analysis, Glob. Change Biol., 8, 345–360, 2002.
Hansis, E., Davis, S. J., and Pongratz, J.: Relevance of methodological choices for accounting of land use change carbon fluxes, Global Biogeochem. Cy., 29, 1230–1246, 2015.
Harris, D. R.: Swidden systems and settlement, in: Man, Settlement and Urbanism, edited by: Ucko, P. J., Tringham, R., and Dimbleby, G. W., Schenkman Publishing Company, Cambridge, MA, 245–262, 1972.
Harris, N. L., Gibbs, D. A., Baccini, A., Birdsey, R. A., De Bruin, S., Farina, M., Fatoyinbo, L., Hansen, M. C., Herold, M., Houghton, R. A., and Potapov, P. V.: Global maps of twenty-first century forest carbon fluxes, Nat. Clim. Change, 11, 234–240, 2021.
Heinimann, A., Mertz, O., Frolking, S., Egelund Christensen, A., Hurni, K., Sedano, F., Parsons Chini, L., Sahajpal, R., Hansen, M., and Hurtt, G.: A global view of shifting cultivation: Recent, current, and future extent, PLOS ONE, 12, e0184479, https://doi.org/10.1371/journal.pone.0184479, 2017.
Hooijer, A., Page, S., Canadell, J. G., Silvius, M., Kwadijk, J., Wösten, H., and Jauhiainen, J.: Current and future CO2 emissions from drained peatlands in Southeast Asia, Biogeosciences, 7, 1505–1514, https://doi.org/10.5194/bg-7-1505-2010, 2010.
Hooijer, A., Page, S., Jauhiainen, J., Lee, W. A., Lu, X. X., Idris, A., and Anshari, G.: Subsidence and carbon loss in drained tropical peatlands, Biogeosciences, 9, 1053–1071, https://doi.org/10.5194/bg-9-1053-2012, 2012.
Houghton, R. and Castanho, A.: Annual emissions of carbon from land use, land-use change, and forestry 1850–2020 (V1), Harvard Dataverse [data set], https://doi.org/10.7910/DVN/U7GHRH, 2023.
Houghton, R. and Hackler, J.: Emissions of carbon from land use change in sub-Saharan Africa, J. Geophys. Res.-Biogeo., 111, G02003, https://doi.org/10.1029/2005JG000076, 2006.
Houghton, R. A.: How well do we know the flux of CO2 from land-use change?, Tellus B, 62, 337–351, 2010.
Houghton, R. A. and Nassikas, A. A.: Global and regional fluxes of carbon from land use and land cover change 1850–2015, Global Biogeochem. Cy., 31, 456–472, https://doi.org/10.1002/2016GB005546, 2017.
Houghton, R. A. and Nassikas, A. A.: Negative emissions from stopping deforestation and forest degradation, globally, Glob. Change Biol., 24, 350–359, 2018.
Hurtt, G., Chini, L., Sahajpal, R., Frolking, S., Bodirsky, B. L., Calvin, K., Doelman, J., Fisk, J., Fujimori, S., Goldewijk, K. K., Hasegawa, T., Havlik, P., Heinimann, A., Humpenöder, F., Jungclaus, J., Kaplan, J., Krisztin, T., Lawrence, D., Lawrence, P., Mertz, O., Pongratz, J., Popp, A., Riahi, K., Shevliakova, E., Stehfest, E., Thornton, P., van Vuuren, D., and Zhang, X.: Harmonization of global land use scenarios (LUH2): Historical v2.1h 850 – 2015, Earth System Grid Federation [data set], https://doi.org/10.22033/ESGF/input4MIPs.1127, 2017.
Hurtt, G. C., Chini, L., Sahajpal, R., Frolking, S., Bodirsky, B. L., Calvin, K., Doelman, J. C., Fisk, J., Fujimori, S., Klein Goldewijk, K., Hasegawa, T., Havlik, P., Heinimann, A., Humpenöder, F., Jungclaus, J., Kaplan, J. O., Kennedy, J., Krisztin, T., Lawrence, D., Lawrence, P., Ma, L., Mertz, O., Pongratz, J., Popp, A., Poulter, B., Riahi, K., Shevliakova, E., Stehfest, E., Thornton, P., Tubiello, F. N., van Vuuren, D. P., and Zhang, X.: Harmonization of global land use change and management for the period 850–2100 (LUH2) for CMIP6, Geosci. Model Dev., 13, 5425–5464, https://doi.org/10.5194/gmd-13-5425-2020, 2020.
Ickowitz, A.: Shifting cultivation and deforestation in tropical Africa: critical reflections, Dev. Change, 37, 599–626, 2006.
Johnson, D. W. and Curtis, P. S.: Effects of forest management on soil C and N storage: meta analysis, Forest Ecol. Manag., 140, 227–238, 2001.
Kan, S., Chen, B., Persson, U. M., Chen, G., Wang, Y., Li, J., Meng, J., Zheng, H., Yang, L., and Li, R.: Risk of intact forest landscape loss goes beyond global agricultural supply chains, One Earth, 6, 55–65, 2023.
Klein Goldewijk, K., Dekker, S. C., and van Zanden, J. L.: Per-capita estimations of long-term historical land use and the consequences for global change research, Journal of Land Use Science, 12, 313–337, 2017a.
Klein Goldewijk, K., Beusen, A., Doelman, J., and Stehfest, E.: Anthropogenic land use estimates for the Holocene – HYDE 3.2, Earth Syst. Sci. Data, 9, 927–953, https://doi.org/10.5194/essd-9-927-2017, 2017b.
Kondo, M., Sitch, S., Ciais, P., Achard, F., Kato, E., Pongratz, J., Houghton, R. A., Canadell, J. G., Patra, P. K., and Friedlingstein, P.: Are Land-Use Change Emissions in Southeast Asia Decreasing or Increasing?, Global Biogeochem. Cy., 36, e2020GB006909, https://doi.org/10.1029/2020GB006909, 2022.
Kraemer, R., Prishchepov, A. V., Müller, D., Kuemmerle, T., Radeloff, V. C., Dara, A., Terekhov, A., and Frühauf, M.: Long-term agricultural land-cover change and potential for cropland expansion in the former Virgin Lands area of Kazakhstan, Environ. Res. Lett., 10, 054012, https://doi.org/10.1088/1748-9326/10/5/054012, 2015.
Lanly, J. P.: Tropical Forest Resources FAO Forestry Pap. 30, FAO, Rome, 1982.
Lapola, D. M., Pinho, P., Barlow, J., Aragão, L. E., Berenguer, E., Carmenta, R., Liddy, H. M., Seixas, H., Silva, C. V., and Silva-Junior, C. H.: The drivers and impacts of Amazon forest degradation, Science, 379, eabp8622, https://doi.org/10.1126/science.abp8622, 2023.
Liu, M. and Tian, H.: China's land cover and land use change from 1700 to 2005: Estimations from high-resolution satellite data and historical archives, Global Biogeochem. Cy., 24, GB3003, https://doi.org/10.1029/2009GB003687, 2010.
Murty, D., Kirschbaum, M. U., Mcmurtrie, R. E., and Mcgilvray, H.: Does conversion of forest to agricultural land change soil carbon and nitrogen? A review of the literature, Glob. Change Biol., 8, 105–123, 2002.
Naipal, V., Ciais, P., Wang, Y., Lauerwald, R., Guenet, B., and Van Oost, K.: Global soil organic carbon removal by water erosion under climate change and land use change during AD 1850–2005, Biogeosciences, 15, 4459–4480, https://doi.org/10.5194/bg-15-4459-2018, 2018.
Ogle, S. M., Domke, G., Kurz, W. A., Rocha, M. T., Huffman, T., Swan, A., Smith, J. E., Woodall, C., and Krug, T.: Delineating managed land for reporting national greenhouse gas emissions and removals to the United Nations framework convention on climate change, Carbon Balance and Management, 13, 1–13, 2018.
Palahí, M., Valbuena, R., Senf, C., Acil, N., Pugh, T. A., Sadler, J., Seidl, R., Potapov, P., Gardiner, B., and Hetemäki, L.: Concerns about reported harvests in European forests, Nature, 592, E15–E17, 2021.
Pan, Y., Birdsey, R. A., Fang, J., Houghton, R., Kauppi, P. E., Kurz, W. A., Phillips, O. L., Shvidenko, A., Lewis, S. L., Canadell, J. G., Ciais, P., Jackson, R. B., Pacala, S. W., McGuire, A. D., Piao, S., Rautiainen, A., Sitch, S., and Hayes, D.: A Large and Persistent Carbon Sink in the World's Forests, Science, 333, 988–993, https://doi.org/10.1126/science.1201609, 2011.
Picard, N., Leban, J.-M., Guehl, J.-M., Dreyer, E., Bouriaud, O., Bontemps, J.-D., Landmann, G., Colin, A., Peyron, J.-L., and Marty, P.: Recent increase in European forest harvests as based on area estimates (Ceccherini et al., 2020) not confirmed in the French case, Ann. For. Sci., 78, 1–5, https://doi.org/10.1007/s13595-021-01030-x, 2021.
Pongratz, J., Reick, C. H., Houghton, R. A., and House, J. I.: Terminology as a key uncertainty in net land use and land cover change carbon flux estimates, Earth Syst. Dynam., 5, 177–195, https://doi.org/10.5194/esd-5-177-2014, 2014.
Post, W. M. and Kwon, K. C.: Soil carbon sequestration and land-use change: processes and potential, Glob. Change Biol., 6, 317–327, 2000.
Prishchepov, A. V., Radeloff, V. C., Baumann, M., Kuemmerle, T., and Müller, D.: Effects of institutional changes on land use: agricultural land abandonment during the transition from state-command to market-driven economies in post-Soviet Eastern Europe, Environ. Res. Lett., 7, 024021, https://doi.org/10.1088/1748-9326/7/2/024021, 2012.
PRODES: Instituto Nacional de Pesquisas Espaciais, Coordenacao geral de observaçao da Terra, INPE, Sao Paulo, http://terrabrasilis.dpi.inpe.br/app/dashboard/deforestation/biomes/legal_amazon/rates, (last access: August 2022), 2021.
Qiu, C., Ciais, P., Zhu, D., Guenet, B., Peng, S., Petrescu, A. M. R., Lauerwald, R., Makowski, D., Gallego-Sala, A. V., and Charman, D. J.: Large historical carbon emissions from cultivated northern peatlands, Science Advances, 7, eabf1332, https://doi.org/10.1126/sciadv.abf1332, 2021.
Randerson, J., Van Der Werf, G., Giglio, L., Collatz, G., and Kasibhatla, P.: Global Fire Emissions Database, Version 4, (GFEDv4), ORNL DAAC, Oak Ridge, Tennessee, USA, 2018.
Randerson, J. T.: Global warming and tropical carbon, Nature, 494, 319, https://doi.org/10.1038/nature11949, 2013.
Rossi, S., Tubiello, F. N., Prosperi, P., Salvatore, M., Jacobs, H., Biancalani, R., House, J. I., and Boschetti, L.: FAOSTAT estimates of greenhouse gas emissions from biomass and peat fires, Climatic Change, 135, 699–711, https://doi.org/10.1007/s10584-015-1584-y, 2016.
Samndong, R. A., Bush, G., Vatn, A., and Chapman, M.: Institutional analysis of causes of deforestation in REDD+ pilot sites in the Equateur province: Implication for REDD+ in the Democratic Republic of Congo, Land Use Policy, 76, 664–674, 2018.
Schierhorn, F., Müller, D., Beringer, T., Prishchepov, A. V., Kuemmerle, T., and Balmann, A.: Post-Soviet cropland abandonment and carbon sequestration in European Russia, Ukraine, and Belarus, Global Biogeochem. Cy., 27, 1175–1185, 2013.
Schlesinger, W.: The world carbon pool in soil organic matter: A source of atmospheric CO2, in The Role of Terrestrial Vegetation in the Global Carbon Cycle: Measurement by Remote Sensing, SCOPE 23, edited by: Woodwell, G. M., John Wiley, New York, 111–124, 1984.
Schlesinger, W. H.: Changes in soil carbon storage and associated properties with disturbance and recovery, in: The changing carbon cycle, edited by: Trabalka, J. R. and Reichle, D. E., Springer, New York, NY, 194–220, https://doi.org/10.1007/978-1-4757-1915-4_11, 1986.
Schwingshackl, C., Obermeier, W. A., Bultan, S., Grassi, G., Canadell, J. G., Friedlingstein, P., Gasser, T., Houghton, R. A., Kurz, W. A., and Sitch, S.: Differences in land-based mitigation estimates reconciled by separating natural and land-use CO2 fluxes at the country level, One Earth, 5, 1367–1376, 2022.
Silva, J., Carreiras, J., Rosa, I., and Pereira, J.: Greenhouse gas emissions from shifting cultivation in the tropics, including uncertainty and sensitivity analysis, J. Geophys. Res.-Atmos., 116, D20304, https://doi.org/10.1029/2011JD016056, 2011.
Snedaker, S. C. and Gamble, J. F.: Compositional analysis of selected second-growth species from lowland Guatemala and Panama, BioScience, 19, 536–538, 1969.
Tubiello, F. N., Conchedda, G., Wanner, N., Federici, S., Rossi, S., and Grassi, G.: Carbon emissions and removals from forests: new estimates, 1990–2020, Earth Syst. Sci. Data, 13, 1681–1691, https://doi.org/10.5194/essd-13-1681-2021, 2021.
Turner, B., Hanham, R. Q., and Portararo, A. V.: Population pressure and agricultural intensity, Ann. Assoc. Am. Geogr., 67, 384–396, 1977.
Tyukavina, A., Potapov, P., Hansen, M. C., Pickens, A. H., Stehman, S. V., Turubanova, S., Parker, D., Zalles, V., Lima, A., and Kommareddy, I.: Global trends of forest loss due to fire from 2001 to 2019, Frontiers in Remote Sensing, 3, https://doi.org/10.3389/frsen.2022.825190, 2022.
Uribe, M. d. R., Coe, M. T., Castanho, A. D., Macedo, M. N., Valle, D., and Brando, P. M.: Net loss of biomass predicted for tropical biomes in a changing climate, Nat. Clim. Change, 13, 274–281, 2023.
USDA: Forest Service Cooperative Fire Protection Program Wildfire Statistics 1926–1990, USDA, U. S. Government Printing Office, Washington, DC, 1926–1990.
van Marle, M. J., van Wees, D., Houghton, R. A., Field, R. D., Verbesselt, J., and van der Werf, G.: New land-use-change emissions indicate a declining CO2 airborne fraction, Nature, 603, 450–454, 2022.
Van Vliet, N., Mertz, O., Heinimann, A., Langanke, T., Pascual, U., Schmook, B., Adams, C., Schmidt-Vogt, D., Messerli, P., and Leisz, S.: Trends, drivers and impacts of changes in swidden cultivation in tropical forest-agriculture frontiers: a global assessment, Global Environ. Chang., 22, 418–429, 2012.
Wang, Z., Hoffmann, T., Six, J., Kaplan, J. O., Govers, G., Doetterl, S., and Van Oost, K.: Human-induced erosion has offset one-third of carbon emissions from land cover change, Nat. Clim. Change, 7, 345–349, 2017.
Watson, R. T., Noble, I. R., Bolin, B., Ravindranath, N. H., Verardo, D. J., and Dokken, D. J. (Eds.): Land use, land-use change and forestry. A special report of the Intergovernmental Panel on Climate Change, Cambridge University Press, New York, 2000.
Wernick, I. K., Ciais, P., Fridman, J., Högberg, P., Korhonen, K. T., Nordin, A., and Kauppi, P. E.: Quantifying forest change in the European Union, Nature, 592, E13–E14, 2021.
Wiltshire, A. J., von Randow, C., Rosan, T. M., Tejada, G., and Castro, A. A.: Understanding the role of land-use emissions in achieving the Brazilian Nationally Determined Contribution to mitigate climate change, Climate Resilience and Sustainability, 1, e31, https://doi.org/10.1002/cli2.31, 2022.
Xu, L., Saatchi, S. S., Yang, Y., Yu, Y., Pongratz, J., Bloom, A. A., Bowman, K., Worden, J., Liu, J., and Yin, Y.: Changes in global terrestrial live biomass over the 21st century, Science Advances, 7, eabe9829, https://doi.org/10.1126/sciadv.abe9829, 2021.
Yu, Z., Ciais, P., Piao, S., Houghton, R. A., Lu, C., Tian, H., Agathokleous, E., Kattel, G. R., Sitch, S., and Goll, D.: Forest expansion dominates China's land carbon sink since 1980, Nature Commun., 13, 5374, 2022.
Zinke, P. J., Stangenberger, A. G., Post, W. M., Emanuel, W. R., and Olson, J. S.: Worldwide Organic Soil Carbon and Nitrogen Data, Rep. ORNL/CDIC-18, Oak Ridge Natl. Lab., Oak Ridge, Tenn., 1986.