the Creative Commons Attribution 4.0 License.
the Creative Commons Attribution 4.0 License.
 | 02 May 2023
Only a minority of bacteria grow after wetting in both natural and post-mining biocrusts in a hyperarid phosphate mine
Eva Petrova
Osnat Gillor
Yaron Ziv
Biological soil crusts (biocrusts) are key contributors to desert ecosystem functions, therefore, biocrust restoration following mechanical disturbances is imperative. In the Negev Desert hyperarid regions, phosphate mining has been practiced for over 60 years, destroying soil habitats and fragmenting the landscape. In this study, we selected one mining site restored in 2007, and we used DNA stable isotope probing (DNA-SIP) to identify which bacteria grow in post-mining and adjacent natural biocrusts. Since biocrust communities activate only after wetting, we incubated the biocrusts with HO for 96 h under ambient conditions. We then evaluated the physicochemical soil properties, chlorophyll a concentrations, activation, and functional potential of the biocrusts. The DNA-SIP assay revealed low bacterial activity in both plot types and no significant differences in the proliferated communities' composition when comparing post-mining and natural biocrusts. We further found no significant differences in the microbial functional potential, photosynthetic rates, or soil properties. Our results suggest that growth of hyperarid biocrust bacteria after wetting is minimal. We hypothesize that due to the harsh climatic conditions, during wetting, bacteria devote their meager resources to prepare for the coming drought, by focusing on damage repair and organic compound synthesis and storage rather than on growth. These low growth rates contribute to the sluggish recovery of desert biocrusts following major disturbances such as mining. Therefore, our findings highlight the need for implementing active restoration practices following mining.
- Article
(4832 KB) - Full-text XML
-
Supplement
(661 KB) - BibTeX
- EndNote


Phosphate mining in the Negev Desert, Israel, has been taking place since the 1960s in large areas. ICL-Rotem mining company leads the phosphate mining activities and has been practicing a reclamation-oriented mining protocol for the past 15 years. The mining protocol entails the excavation of the top 50–70 cm of soil (which they consider to be topsoil), followed by the overburden (the layer covering the phosphate), then storing the two soil layers in separate piles. Following the excavation of the phosphate, the overburden is returned to the mining pit followed by the topsoil. Finally, the terrain is leveled with heavy machinery. The area is then considered a restored, post-mining site.
Open mining activities lead to the destruction of the local vegetation and seed bank and the fragmentation of the natural landscape (Sengupta, 2021). The consequences include land degradation, erosion, soil and water pollution, and dust dispersion. In addition, mining activity often leads to decreased biodiversity in and around mining sites (Bridge, 2004; Sengupta, 2021). One of the ecosystem components being destroyed by mining activities in the Negev Desert is the biological soil crust layer (biocrust). Biocrust is the topmost layer of many arid soils and comprises primary-producing and heterotrophic microorganisms that bind together soil particles using secreted extracellular polymeric substances (EPSs), mainly polysaccharides (Weber et al., 2022). Biocrusts provide many ecosystem services, including fixing nitrogen and carbon as well as soil stabilization (Belnap and Lange, 2003). While biocrust microorganisms developed various adaptations to withstand the harsh desert environment (Makhalanyane et al., 2015), biocrust structures are susceptible to mechanical disturbances. Such a disturbance, especially over large scales (for example, mining activity), breaks and buries biocrust organisms, often resulting in changed biocrust communities (Belnap and Eldridge, 2003).
In previous research, we evaluated the biocrust bacterial communities in phosphate mining sites (Gabay et al., 2022). Briefly, we found that natural and post-mining biocrusts differ in community composition and diversity. Following the biocrust community analysis, we sought to identify which bacterial groups are actively growing in the biocrust and whether the composition differs between natural and post-mining sites. To this end, we used DNA stable isotope probing (DNA-SIP): a culture-free approach that allows the detection of actively growing microorganisms by labeling them with stable isotopes such as 15N, 14C, and 18O (Dumont and Hernández García, 2019). SIP has been widely applied in identifying microbial groups that participate in carbon and nitrogen cycling, such as methanotrophs (Sultana et al., 2019; Zhang et al., 2020), methylotrophs (Macey et al., 2020; Arslan et al., 2022), and nitrogen fixers (Pepe-Ranney et al., 2016; Angel et al., 2018). Likewise, SIP can use the incorporation of heavy water (HO) into various biomarkers to study the growth and function of microorganisms that become activated upon wetting (Schwartz et al., 2019). Previous HO SIP experiments measured microbial growth rates and dynamics following hydration (Blazewicz et al., 2020). Desert biocrusts make an ideal study system for HO SIP experiments, as they become active quickly following hydration (Angel and Conrad, 2013), resuming growth, nutrient cycling, and excretion of extracellular organic materials (Garcia-Pichel and Belnap, 1996; Belnap and Lange, 2003).
In this research, we investigated the proliferation of bacterial groups in biocrusts taken from reference (“natural”) areas and post-mining sites by incubating biocrust samples with isotopically labeled water (HO). We hypothesized that growth patterns and taxonomic identity of bacterial groups would differ significantly when comparing natural and post-mining biocrusts. Specifically, we expected higher bacterial growth rates in natural compared to post-mining biocrusts. Based on our previous findings, we specifically expected higher activity of Cyanobacteria in the natural biocrusts (Gabay et al., 2022).
2.1 Study site and sample collection
Sampling was conducted during June 2020 at the Gov mining site, located in the Zin Valley (30.84∘ N, 35.09∘ E, 98 m above sea level), where restoration was completed in 2007. The study area was previously described in Gabay et al. (2022). Briefly, Zin Valley is a hyperarid region of the Negev Desert, with 50 mm average annual rainfall (Zin factory meteorological data) and highly saline soils (average electrical conductivity, EC, is 24 dS m−1). The main soil cover types in Zin Valley are biocrusts and desert pavement, with scarce vegetation of mainly annual species. The soil composition in the post-mining site and natural area is similar with 70 % sand, 18 % silt, and 12 % clay, and 68 % sand, 20 % silt, and 12 % clay for natural and post-mining, respectively (Gabay et al., 2022). The soils in Zin Valley are classified as Solonchak according to the World Reference Based soil classification system.
Biocrusts were sampled either from the post-mining site or the adjacent natural area. The biocrusts in Gov are thin (between 1.5–2.5 mm deep) and smooth. The site is characterized by areas covered in biocrusts or desert pavement. In each sampling site, we sampled along a 100 m strip at approximately 10 m intervals (Fig. 1). In total, we sampled 20 biocrust samples (10 from each site). We collected the biocrusts using a spatula, at an average depth of 2 mm. Biocrusts were placed in 100 mm × 15 mm Petri dishes lined with cotton. For the SIP assay, we chose five of the 10 samples from each site containing the highest chlorophyll a concentrations as estimated in preliminary experiments (Table S1).
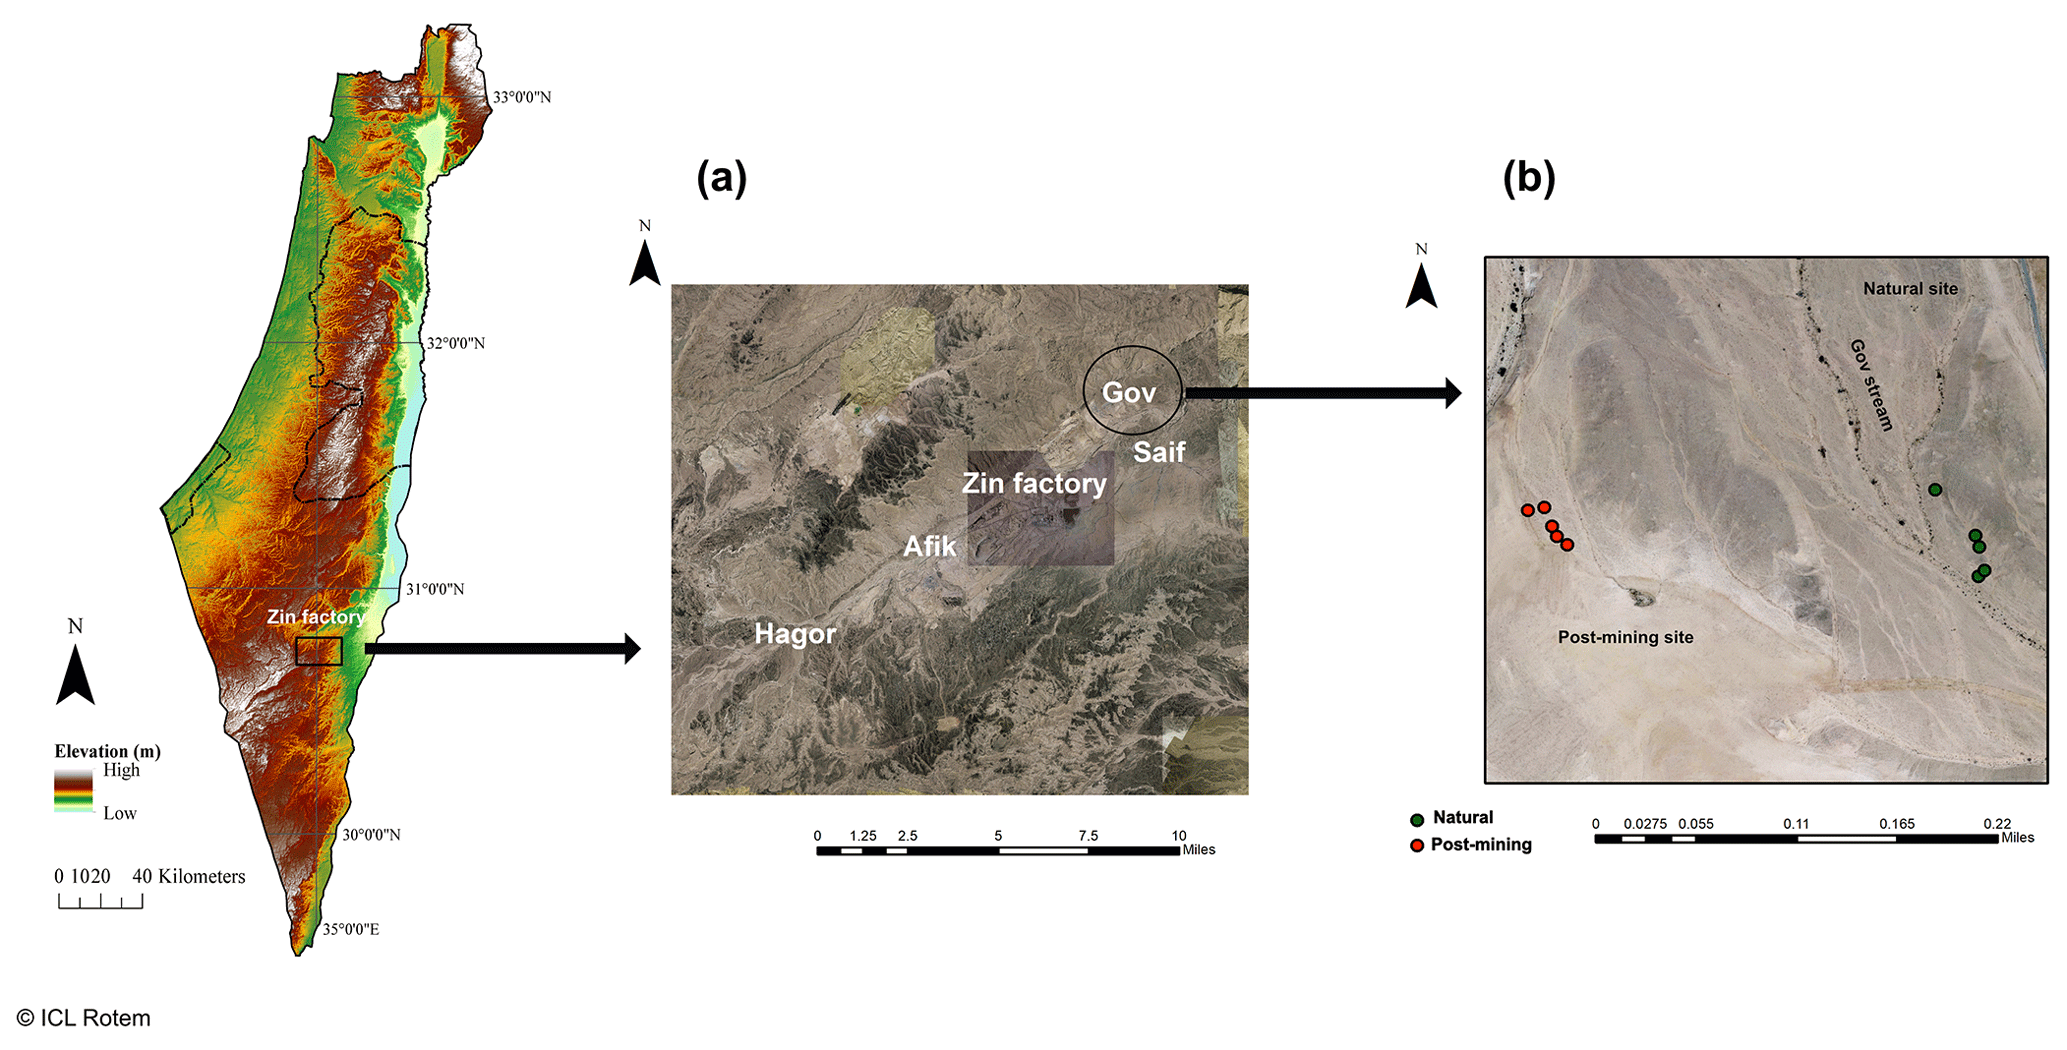
Figure 1Map of the research area. Map (a) shows the different post-mining sites around the Zin factory. Map (b) shows the biocrust sampling points in Gov mining site used for this research. Green dots represent the natural biocrusts, and red dots represent the post-mining biocrusts.
2.2 Soil properties
Five biocrust samples from each plot type (post-mining and natural) were sent for analysis of soil properties (pH, EC, and NO concentrations and soil organic matter). The analysis was performed at the Gilat Soil Laboratory (Gilat Research Center, Gilat, Israel).
2.3 Chlorophyll a extraction
Chlorophyll a was extracted from biocrust samples using a protocol previously described in Gabay et al. (2022). Briefly, chlorophyll a was extracted from 3 g soil of each biocrust sample and was diluted in 9 mL of methanol for 15 min at 65 ∘C. The soil solution was centrifuged at 2000 rpm for 5 min, supernatant was collected, and absorbance was measured in a spectrophotometer at 665 nm. Concentrations were calculated according to Ritchie (2006) and normalized to 1 g of soil. Extractions of the biocrusts were performed before (dry biocrusts) and after 96 h incubation with distilled water (DW) under identical conditions to the incubation with HO.
2.4 Stable isotope probing
2.4.1 Soil incubation
To test the incorporation of 18O into biocrust samples, a microcosm was designed to control for the incubation conditions. Each microcosm consisted of a 10 mL glass vial in which 1 g of biocrust sample was placed. To achieve field water-holding capacity, 0.15 mL of HO or DNase-free water were added. The glass vials were then sealed with butyl rubber stoppers (Sigma-Aldrich, St. Louis, Missouri, United States) to prevent evaporation. Both labeled and unlabeled controls were incubated in duplicates, for a total of 40 vials. Samples were incubated under a 12 h photoperiod for 96 h in an incubator (FOC 225 I; VELP Scientifica, Usmate Velate MB, Italy) to allow the incorporation of 18O into the bacterial DNA. Following incubation, the microcosms were sacrificed, and each biocrust sample was divided into four bead beating tubes (Qiagen, Hilden, Germany), each containing 0.25 g of soil, and stored at −80 ∘C until further analysis.
Each labeled sample had a non-labeled control, incubated under identical conditions but with DNase-free water instead of 18O water.
2.4.2 DNA extraction
DNA was extracted from all biocrust samples using DNeasy PowerSoil Pro Kit (Qiagen), according to the manufacturer's instructions. The biomass in hyperarid biocrusts tends to be very low, yielding only minute amounts of DNA. Therefore, each 1 g soil was extracted in batches of 0.25 g, and the extracts were later consolidated to increase DNA yield.
2.4.3 SIP gradient preparation and fractionation
DNA (ca. 3.5 ng) was subjected to isopycnic gradient centrifugation in a solution of caesium chloride (7.163 M CsCl; Sigma Aldrich. St Louis, MI, USA) and buffer (0.1 M Tris-HCl at pH of 8.0, 0.1 M KCl, and 1 mM EDTA; all from Sigma Aldrich) to a final density of 1.725 g mL−1 as described previously (Jia et al., 2019). The tubes were spun for 44 h at 177 000 g and then fractionated by water displacement using a syringe pump (NE-300 Just Infusion™ Syringe Pump, NewEra Pump systems, Farmingdale, NY, USA). The refractive index was measured using an AR200 digital refractometer (Reichert, Depew, NY, USA) and then the DNA was precipitated using a polyethylene glycol 6000 solution (30 % PEG 8000 and 1.6 M NaCl) and 30 µg of GlycoBlue coprecipitant (Thermo Fisher Scientific, Waltham, MS, USA). Copy numbers of the 16S rRNA gene in each fraction were determined by qPCR using a probe-based approach. Primers 338F and 805R (Yu et al., 2005) coupled with a 516P probe (FAM-BHQ1 dual labeled) were used for the assay. Per one reaction 10 µL of TaqMan™ Fast Advanced Master Mix (Thermo Fisher Scientific), 0.4 µL of bovine saline albumin (BSA; Thermo Fisher Scientific), 1 µL of each primer (10 µM), 0.4 µL of a probe (10 µM), and 2.2 µL of PCR water was combined and mixed with 5 µL of DNA. After 5 min initial denaturation at 95 ∘C, a cycling program of 40 cycles of 95 ∘C for 30 s followed by 62 ∘C for 1 min was applied. Gene copy numbers were established from a standard curve of Escherichia coli 16S rRNA gene.
2.4.4 Polymerase chain reaction (PCR) and sequencing
Following fractionation, all samples (labeled and unlabeled) were amplified using the 16S rRNA primers 515F_mod and 806R_mod (Apprill et al., 2015; Parada et al., 2016). Each reaction consisted of 2.5 µL Green Taq Buffer (Thermo Fisher Scientific), 2.5 µL of dNTP set (biotechrabbit, Berlin, Germany), 0.1 µL of BSA (Thermo Fisher Scientific), 0.625 µL of each primer (10 µM), 0.125 µL DreamTaq Green DNA polymerase (Thermo Fisher Scientific), and 17.5 µL of PCR water (Sigma Aldrich, St Louis, MI, USA). The PCR ran for 38 cycles using the following program: denaturation at 94 ∘C for 45 s, annealing at 52 ∘C for 45 s, extension at 72 ∘C for 45 s, and a final cycle of extension at 72 ∘C for 10 min. The amplified fragments were sequenced using MiniSeq (Illumina, San Diego, CA, USA) at the UIC sequencing core, University of Illinois, Chicago, Illinois (https://www.rushu.rush.edu/research/rush-core-laboratories/rush-genomics-and-microbiome-core-facility, last access: 22 October 2021). DNA extraction and SIP gradient controls, PCR negative controls, and mock community (ZymoBIOMICS Microbial Community Standard II Log Distribution; Zymo Research, Irvine, CA, USA) samples (two of each) were also sequenced to control for contaminants in the sequencing results.
2.5 Bioinformatic analysis
All the bioinformatic and statistical analyses were done in R V4.1.1 (R Development Core Team, 2013). Labeling of bacteria was detected using differential abundance analysis as described in Angel (2019). Briefly, the sequences were processed using the DADA2 package V8.8 (Callahan et al., 2016) for quality filtering, denoising, read-merging, chimera removal, constructing amplicon sequence variants (ASVs) tables, and taxonomic assignment. Detection and removal of potential contaminant sequences were performed using the R package decontam V.1.12.0 (Davis et al., 2017). Prevalence filtering of rare ASVs was done using the phyloseq package V1.36.0 (McMurdie and Holmes, 2013). ASVs that appeared in less than 2.5 % of the samples were removed. A maximum-likelihood phylogenetic tree was calculated using IQ-TREE2 V 2.1.1. (Minh et al., 2020). Finally, differential abundance analysis was performed using DESeq2 V1.32.0 (Love et al., 2014) to compare the relative abundance of each ASV in the heavy fractions of labeled DNA to the unlabeled heavy fractions (the negative control samples), which allows identifying the bacterial groups that incorporated the water isotope into their DNA. The results were filtered to include only ASVs with a log2-fold change and a significance value of p<0.1.
2.6 Predictions of genomic functions
Abundances of functional genes based on 16S rRNA gene abundances were performed using PICRUSt2 (Douglas et al., 2019). Abundances of functional genes were predicted based on a filtered ASV table containing only ASVs belonging to proliferated bacteria based on the differential abundance modeling. The resulting output is functional identifications that were annotated using the KEGG database to infer functional gene families. Each gene was then classified into a function category, and the abundance of genes within each category was averaged. The function categories were chosen based on Meier et al. (2021). In their study, Meier et al. collected biocrusts from the Negev and analyzed bacterial metagenomes in the biocrusts to evaluate the distribution of metabolic potential among bacterial populations. To compare functional potential between various bacterial phyla, they selected metabolic genes encoded in the metagenomic-assembled genomes and grouped them into 10 function categories.
2.7 Statistical analyses
Chlorophyll a concentrations were visualized as an estimation plot using the dabestr package V0.3.0 (Ho and Tumkaya, 2019). The effect size was calculated as a bootstrap 95 % confidence interval. Relative abundances of phyla, abundances of functional genes, and soil properties were compared between natural and post-mining biocrusts using Mann–Whitney tests. The community composition of natural and post-mining biocrusts was assessed using only sequences belonging to proliferated bacteria based on DESeq2 modeling. The weighted UniFrac (Lozupone et al., 2011) was used to calculate the similarity between the natural and post-mining communities, and an adonis model was used to assess whether communities differ significantly from each other (package Vegan V2.6-2; Dixon, 2003).
3.1 Sample wetting and greening
Most biocrust samples (both natural and post-mining) showed greening within 36 to 48 h into the 96 h incubation. By the end, most samples displayed varying degrees of greening, indicating cyanobacterial activity. Generally, post-mining biocrust showed less greening than the natural biocrusts (Fig. 2).
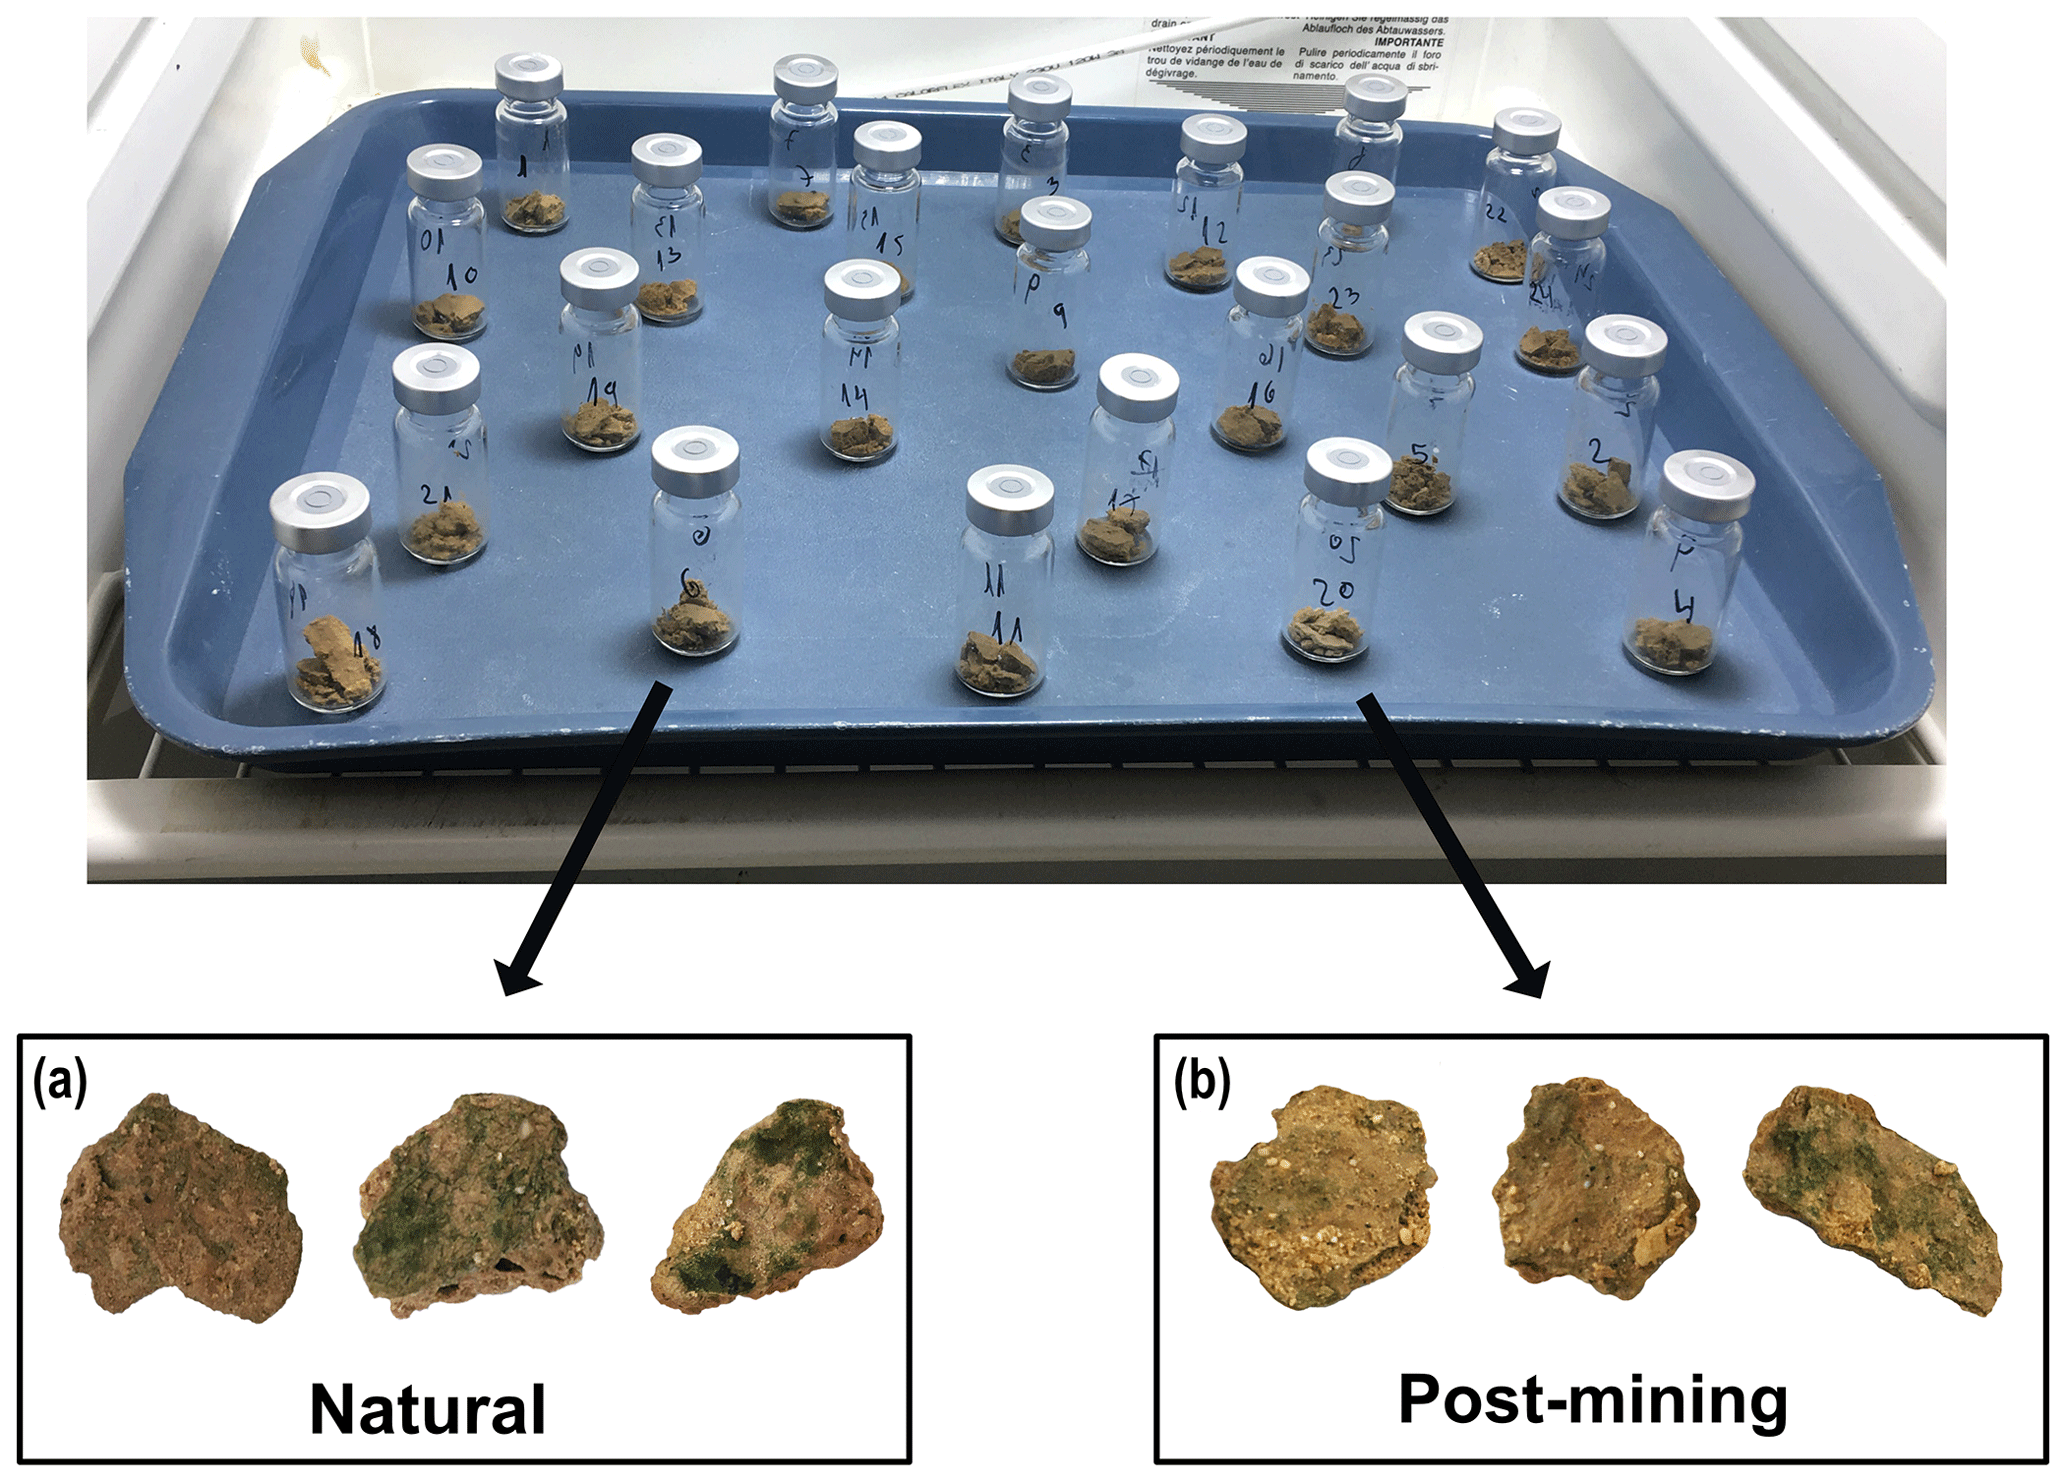
Figure 2Incubation setup. Top picture – biocrusts in sealed glass vials in the incubator. Bottom picture – natural (a) and post-mining (b) biocrusts following the 96 h incubation.
3.2 Soil properties
EC and NO were significantly higher in natural biocrusts compared to post-mining biocrusts (EC: t = 2.89, p<0.05; NO: t = 4, p<0.01; Table 1). Soil organic matter was also significantly higher in the natural biocrusts (t = 3.77, p<0.01; Table 1). pH was slightly higher in natural biocrusts, however, the differences were not statistically significant (pH: t = 1.41, p = 0.19; Table 1).
Table 1Soil properties for natural and post-mining biocrusts. The numbers represent the means for each property and the standard deviation. Significant differences are marked with an asterisk (* p<0.05; p<0.01).

3.3 Chlorophyll a
The estimation plot revealed an effect size estimate at 1.42 (95 CI −0.432, 3.03; Fig. 3). In the natural samples, there was no clear clustering according to the soil water content i.e., dry or hydrated (following 96 h incubation with water). In fact, there was a larger variance between samples collected after incubation (Fig. 3). Hydrated post-mining biocrusts had consistently higher chlorophyll a concentrations compared to dry biocrusts. It is also apparent that the variance between samples was smaller in the post-mining biocrusts (Fig. 3).
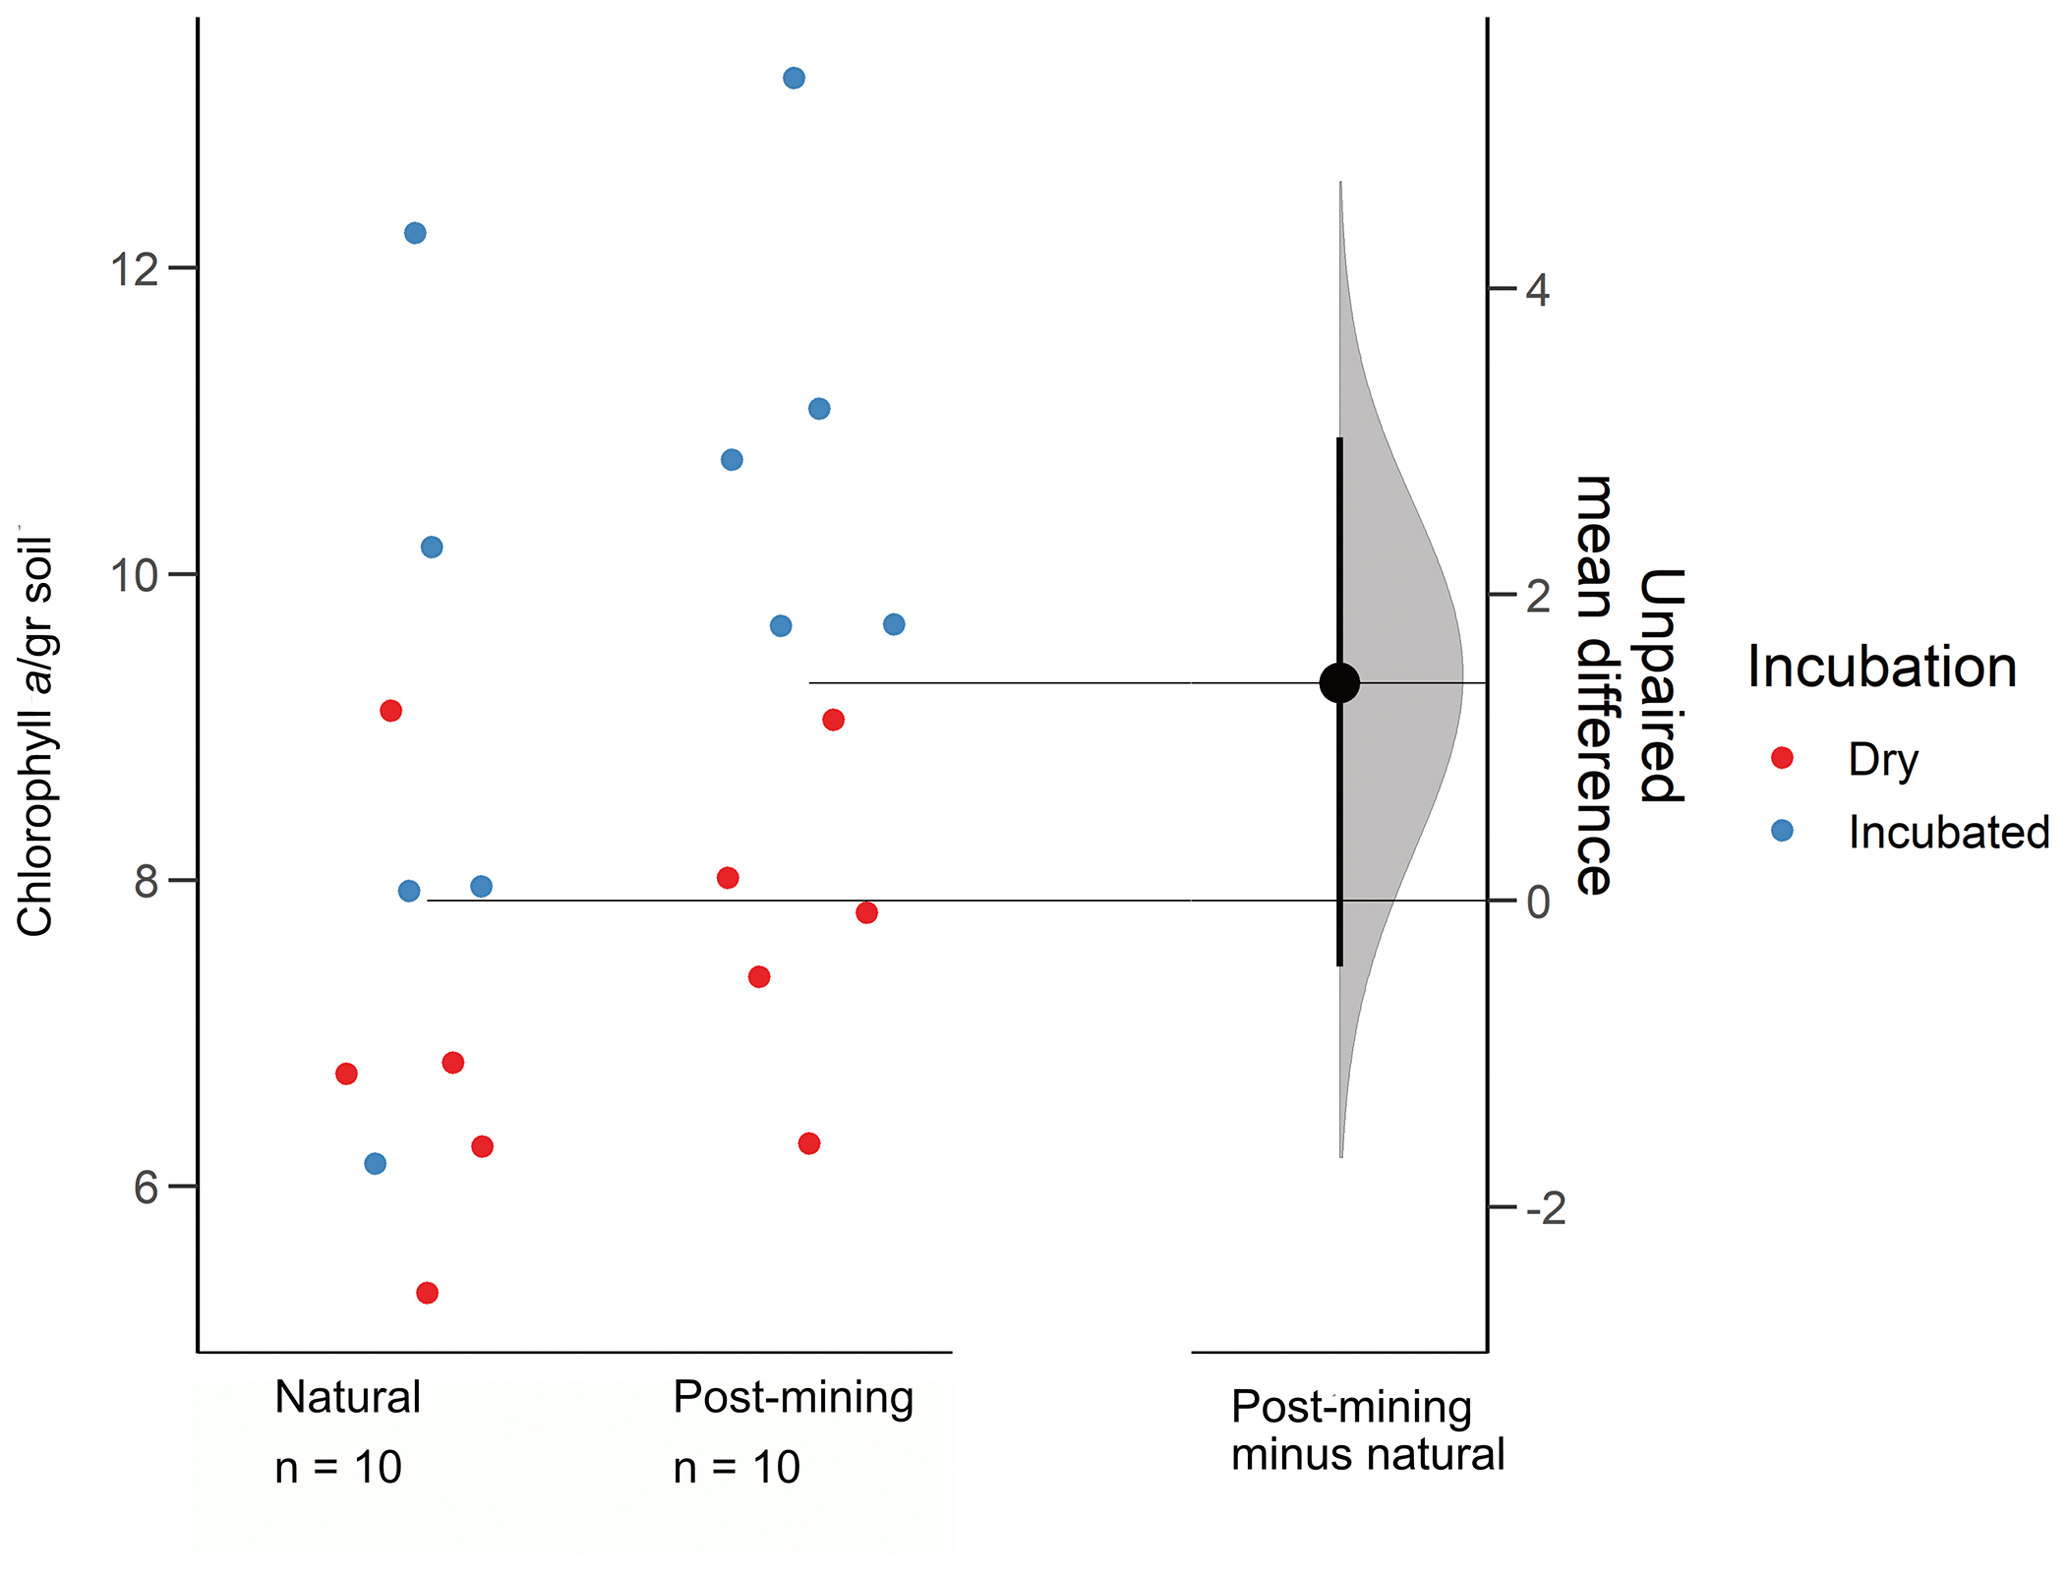
Figure 3Estimation plots of chlorophyll a concentrations. Dots represent the biocrust samples, and colors represent either dry or incubated soil.
3.4 Sequencing and differential abundance modeling
Sequencing resulted in 47 311 reads per sample on average (Table S2) and 10 275 ASVs (Table S3). Following decontamination and filtering, 86 % of the ASVs were removed (Table S3). However, they accounted for only 16 % of the total reads. Out of the remaining 1404 ASVs, 1266 in total were labeled and used for the differential abundance modeling (Table S3). Each sequence in the labeled samples was compared to its corresponding negative control, and the log2-fold change in labeled sequences was evaluated to determine whether an ASV could be considered truly labeled (i.e., belonging to growing bacteria) based on the significance threshold. One of the natural biocrust samples, no. 1 (Fig. 4) displayed much higher labeling than the other four samples (414 ASVs passed, out of a total of 1093; Fig. 4). Excluding sample 1, 38 out of 975 ASVs in total passed the significance threshold for log2-fold change. In post-mining samples, the number of labeled reads was more consistent among the different samples (Fig. 4). Out of 874 ASVs in total, 68 passed the threshold for log2-fold change. Altogether, the number of labeled ASVs did not differ significantly between natural and post-mining samples (natural sample 1 was excluded, natural community mean of 9.5, post-mining community mean of 13.6, W = 9, and p = 0.9).
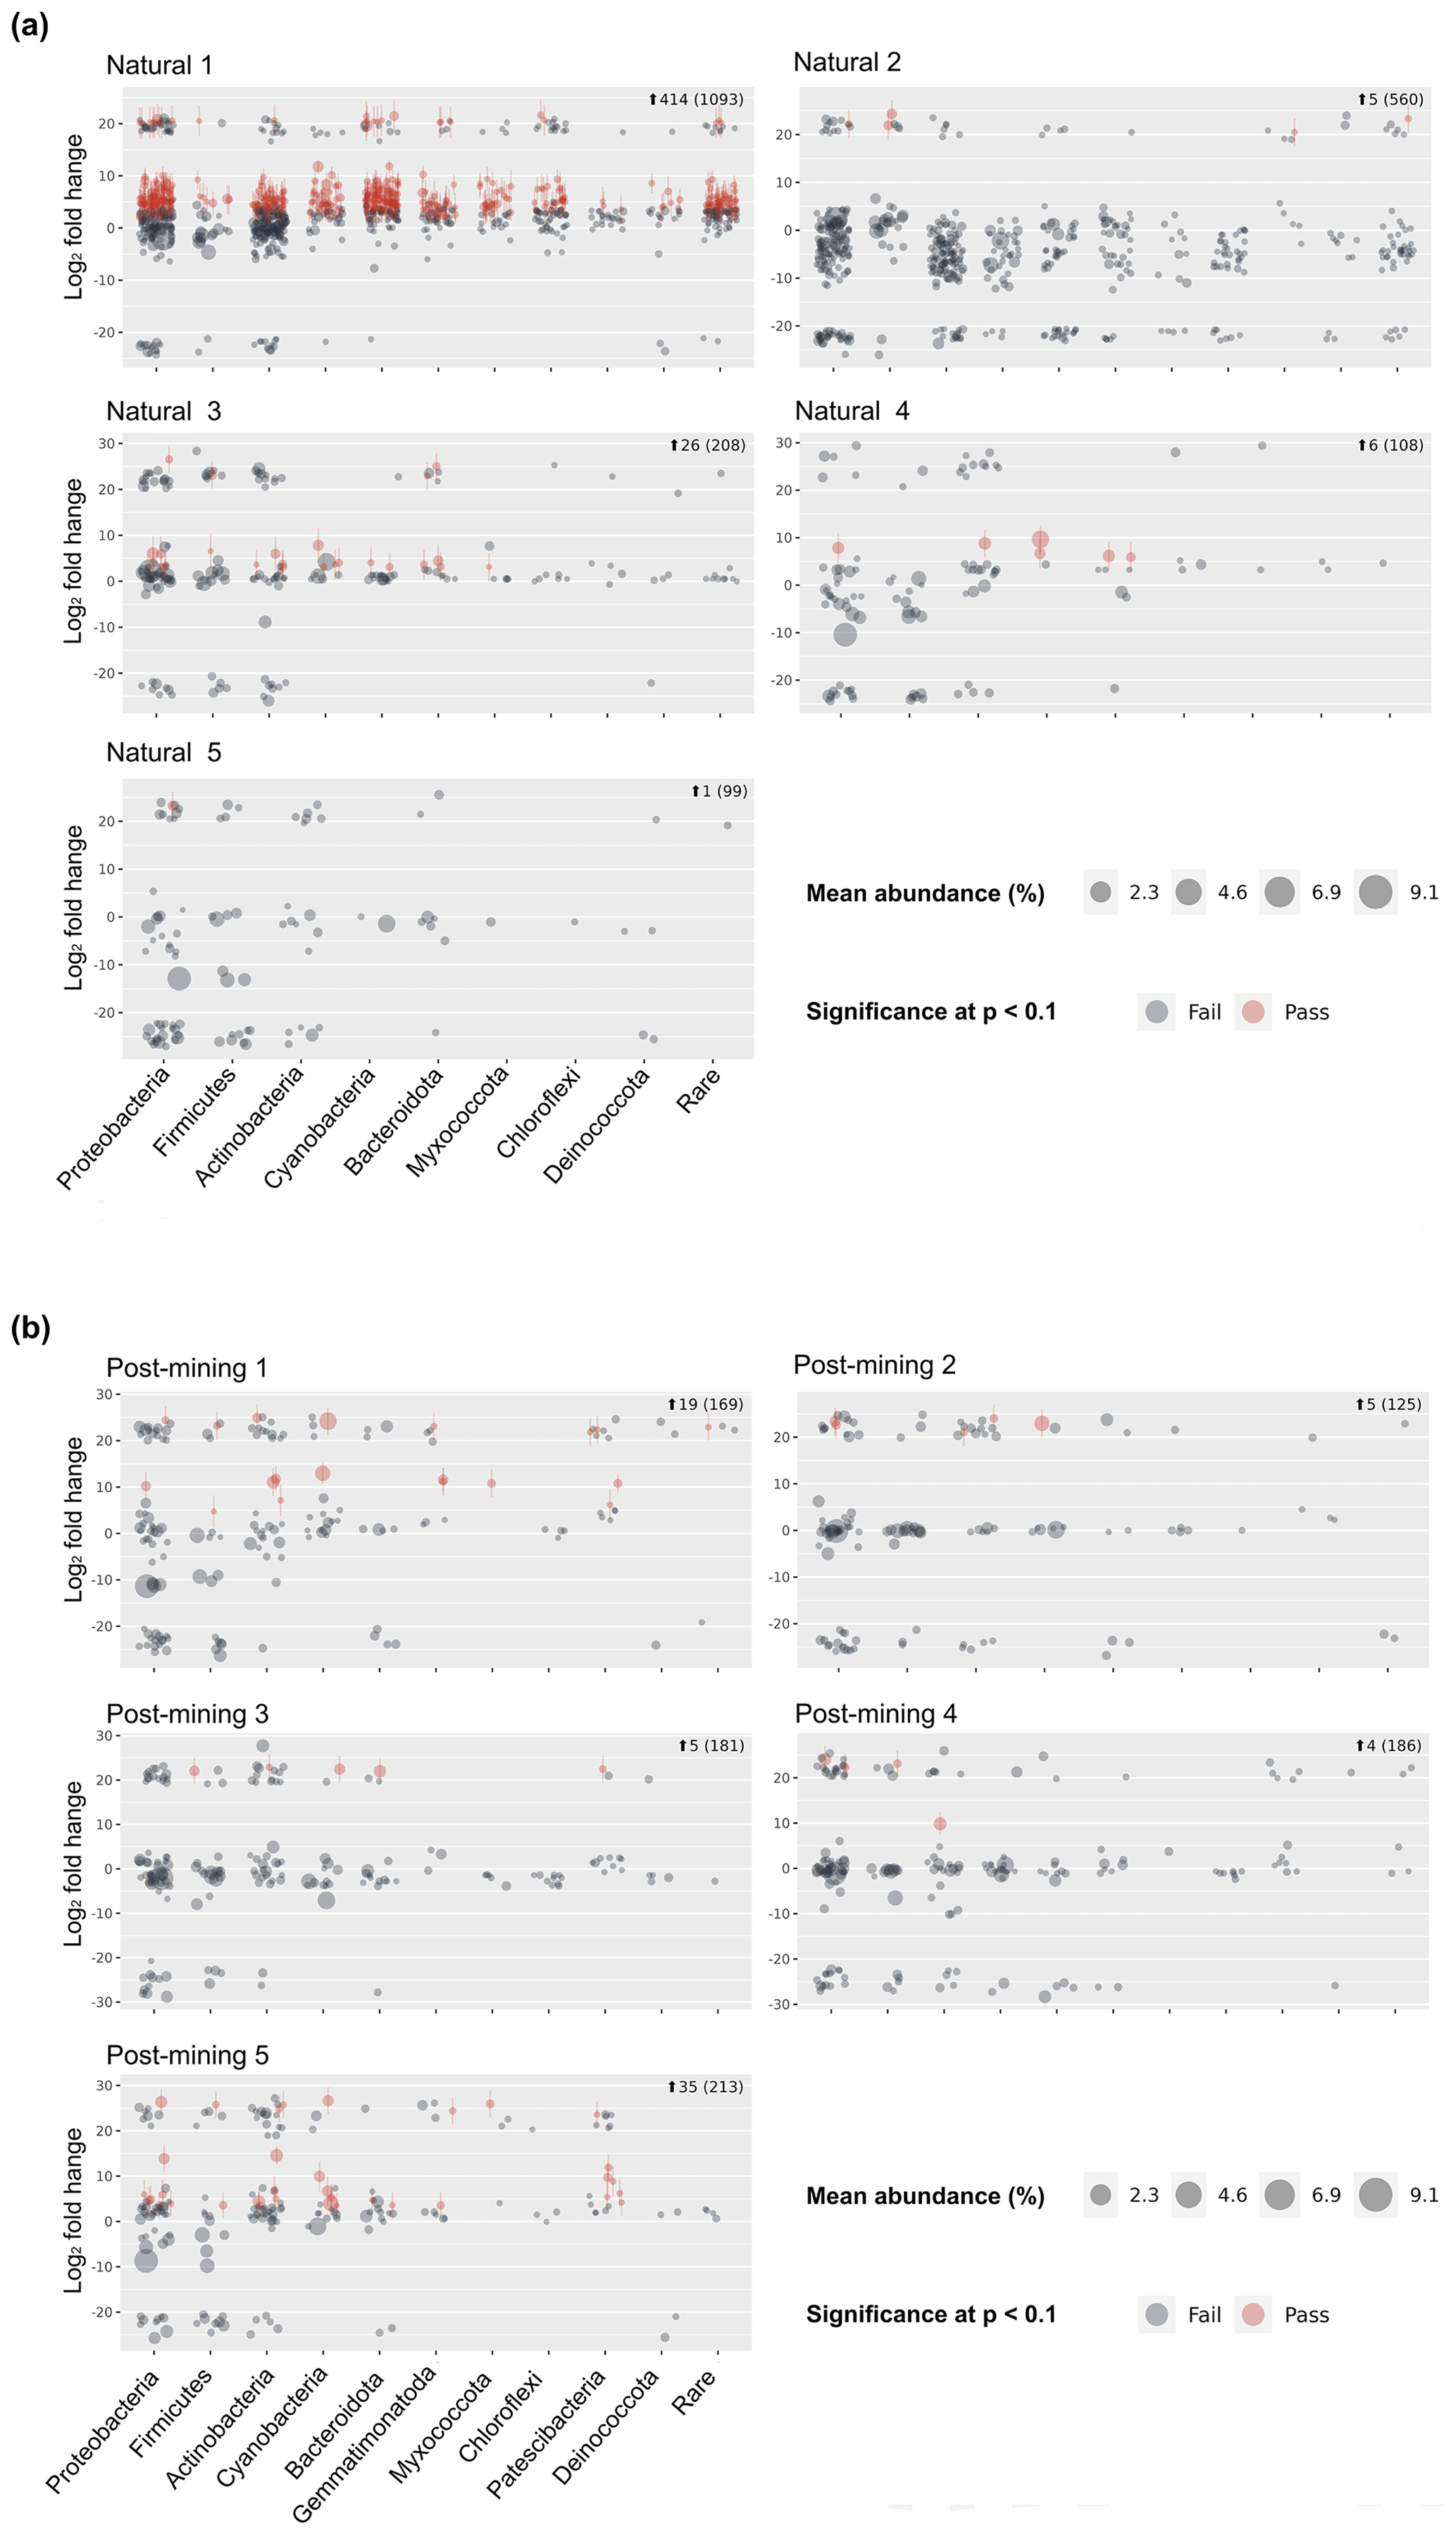
Figure 4Community composition of proliferated bacteria in natural (a) and post-mining (b) biocrusts. Each graph represents a different sample. Red dots indicate labeled ASVs, and gray dots indicate unlabeled ASVs, based on Deseq2 modeling.
3.5 Composition of the proliferated bacterial community
Figure 5a depicts a principal coordinate analysis (PCoA) ordination based on weighted UniFrac metric showing that the biocrust samples do not cluster according to plot type (natural sample number 1 was excluded). Furthermore, the adonis test revealed no significant differences in community composition (weighted UniFrac ∼ plot type; F = 1.23, R2=0.15, and p = 0.21). A comparison of phyla relative abundances reveals higher abundances of Cyanobacteria and Actinobacteria in post-mining samples, and higher abundances of Firmicutes and Proteobacteria in natural samples (Fig. 5b). However, none of the abundances differ significantly between groups (Table S4). A Venn diagram of unique and overlapping sequences reveals that only eight out of 88 labeled sequences appear both in natural and post-mining samples (Fig. S2). However, phylogenetic trees depicting the different proliferated bacterial groups indicate that, for the most part, sequences that appear in natural and post-mining biocrusts belong to the same orders/classes. In the phylum Cyanobacteria, labeled sequences belonged to two classes, and most sequences in both natural and post-mining samples belonged to the class Cyanobacteria, with a slightly higher prevalence in the post-mining samples (Fig. S1). The class Bacteroidia, belonging to the phylum Bacteroidota, had a similar prevalence for natural and post-mining samples (Fig. S1). The trend was similar in the class Bacilli, belonging to the phylum Firmicutes (Fig. S1). In the Alphaproteobacteria phylum, the orders Rhodobacteriales, Rhizobiales, and Sphingomonadales appeared in both natural and post-mining samples (Fig. S1). The phylum Gammaproteobacteria appeared only once in post-mining samples but was more prevalent in natural samples (Fig. S1). The phylum Actinobacteria was more prevalent in post-mining samples, yet the orders Frankiales, Micrococcales, and Propionibacteriales appeared in both natural and post-mining samples (Fig. S1).
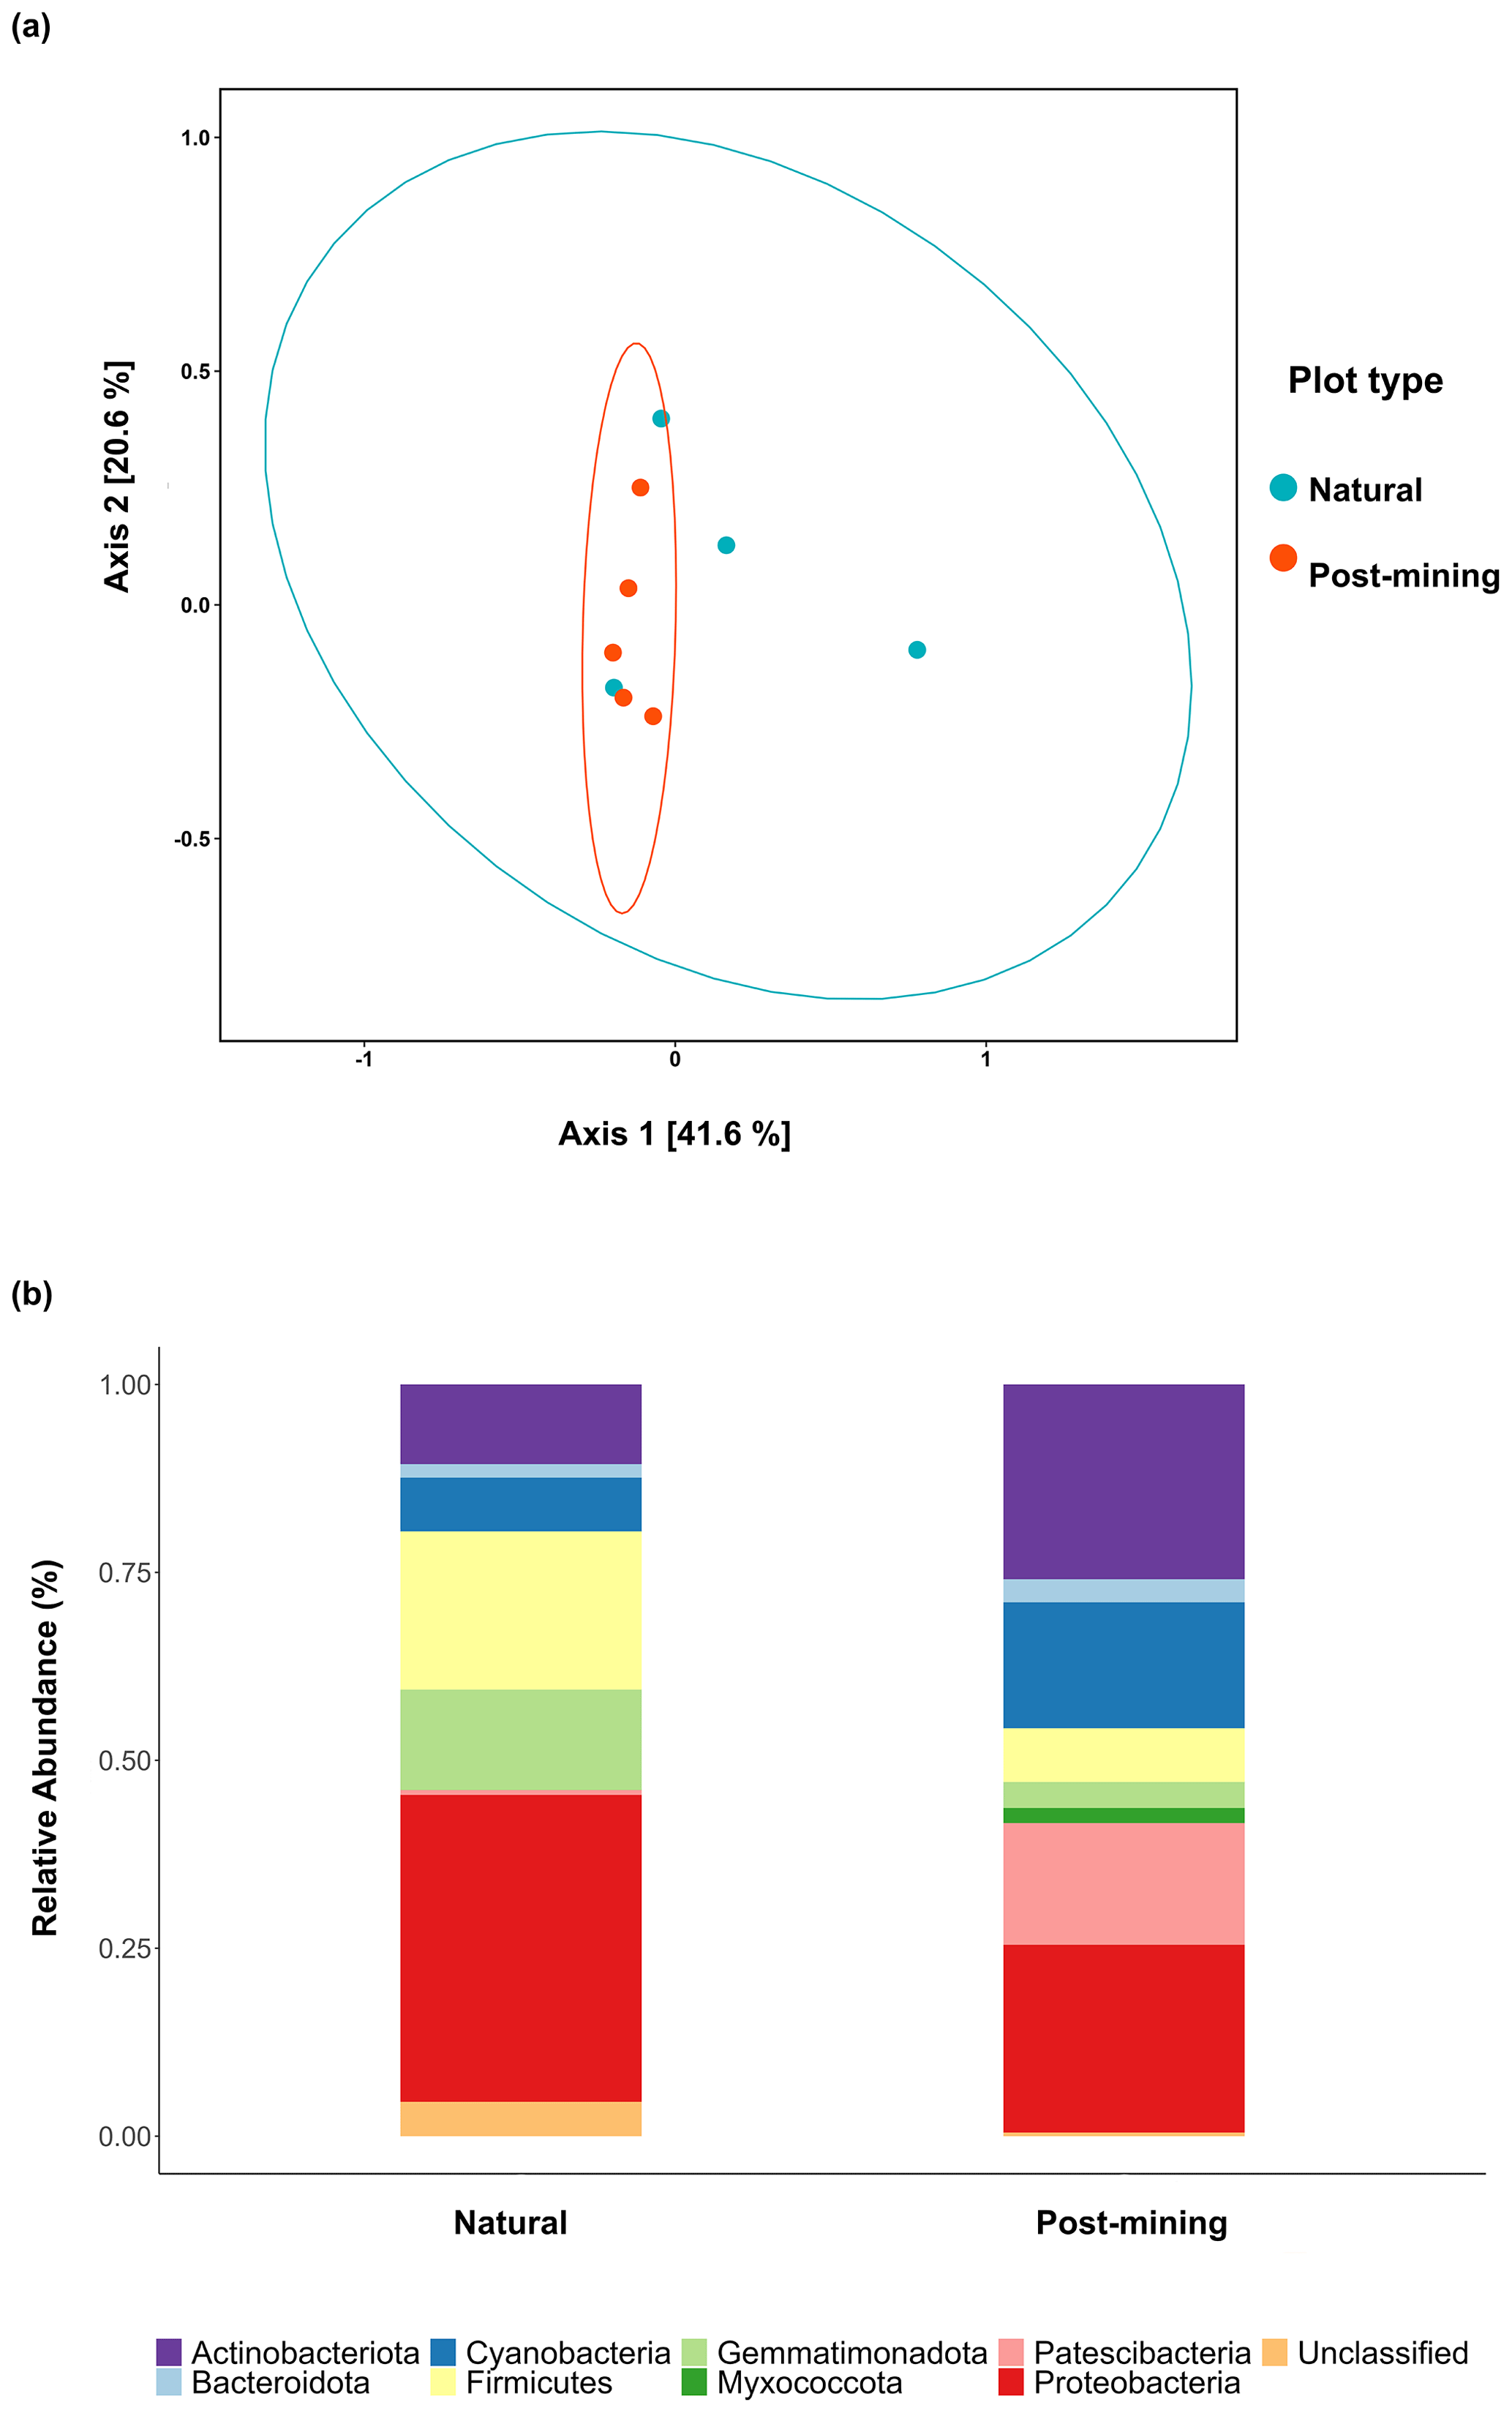
Figure 5Composition of proliferated community. Top figure (a) depicts a PCoA ordination of community composition based on weighted UniFrac similarity metric. Blue dots are natural samples, and pink dots are post-mining samples. The ellipses represent 95 % confidence intervals, the bottom figure (b) depicts a bar plot of phyla relative abundance ( %) in natural and post-mining biocrusts.
3.6 Predictions of genomic functions
Abundances of 10 function categories (listed in Table S5) were compared between natural and post-mining biocrust samples. Abundances were generally higher in post-mining compared to natural biocrusts (Fig. 6; Table S5). Also, the variance between samples was larger in post-mining biocrust (Fig. 6). However, the differences between plot types were not statistically significant in any of the function categories (Table S5).
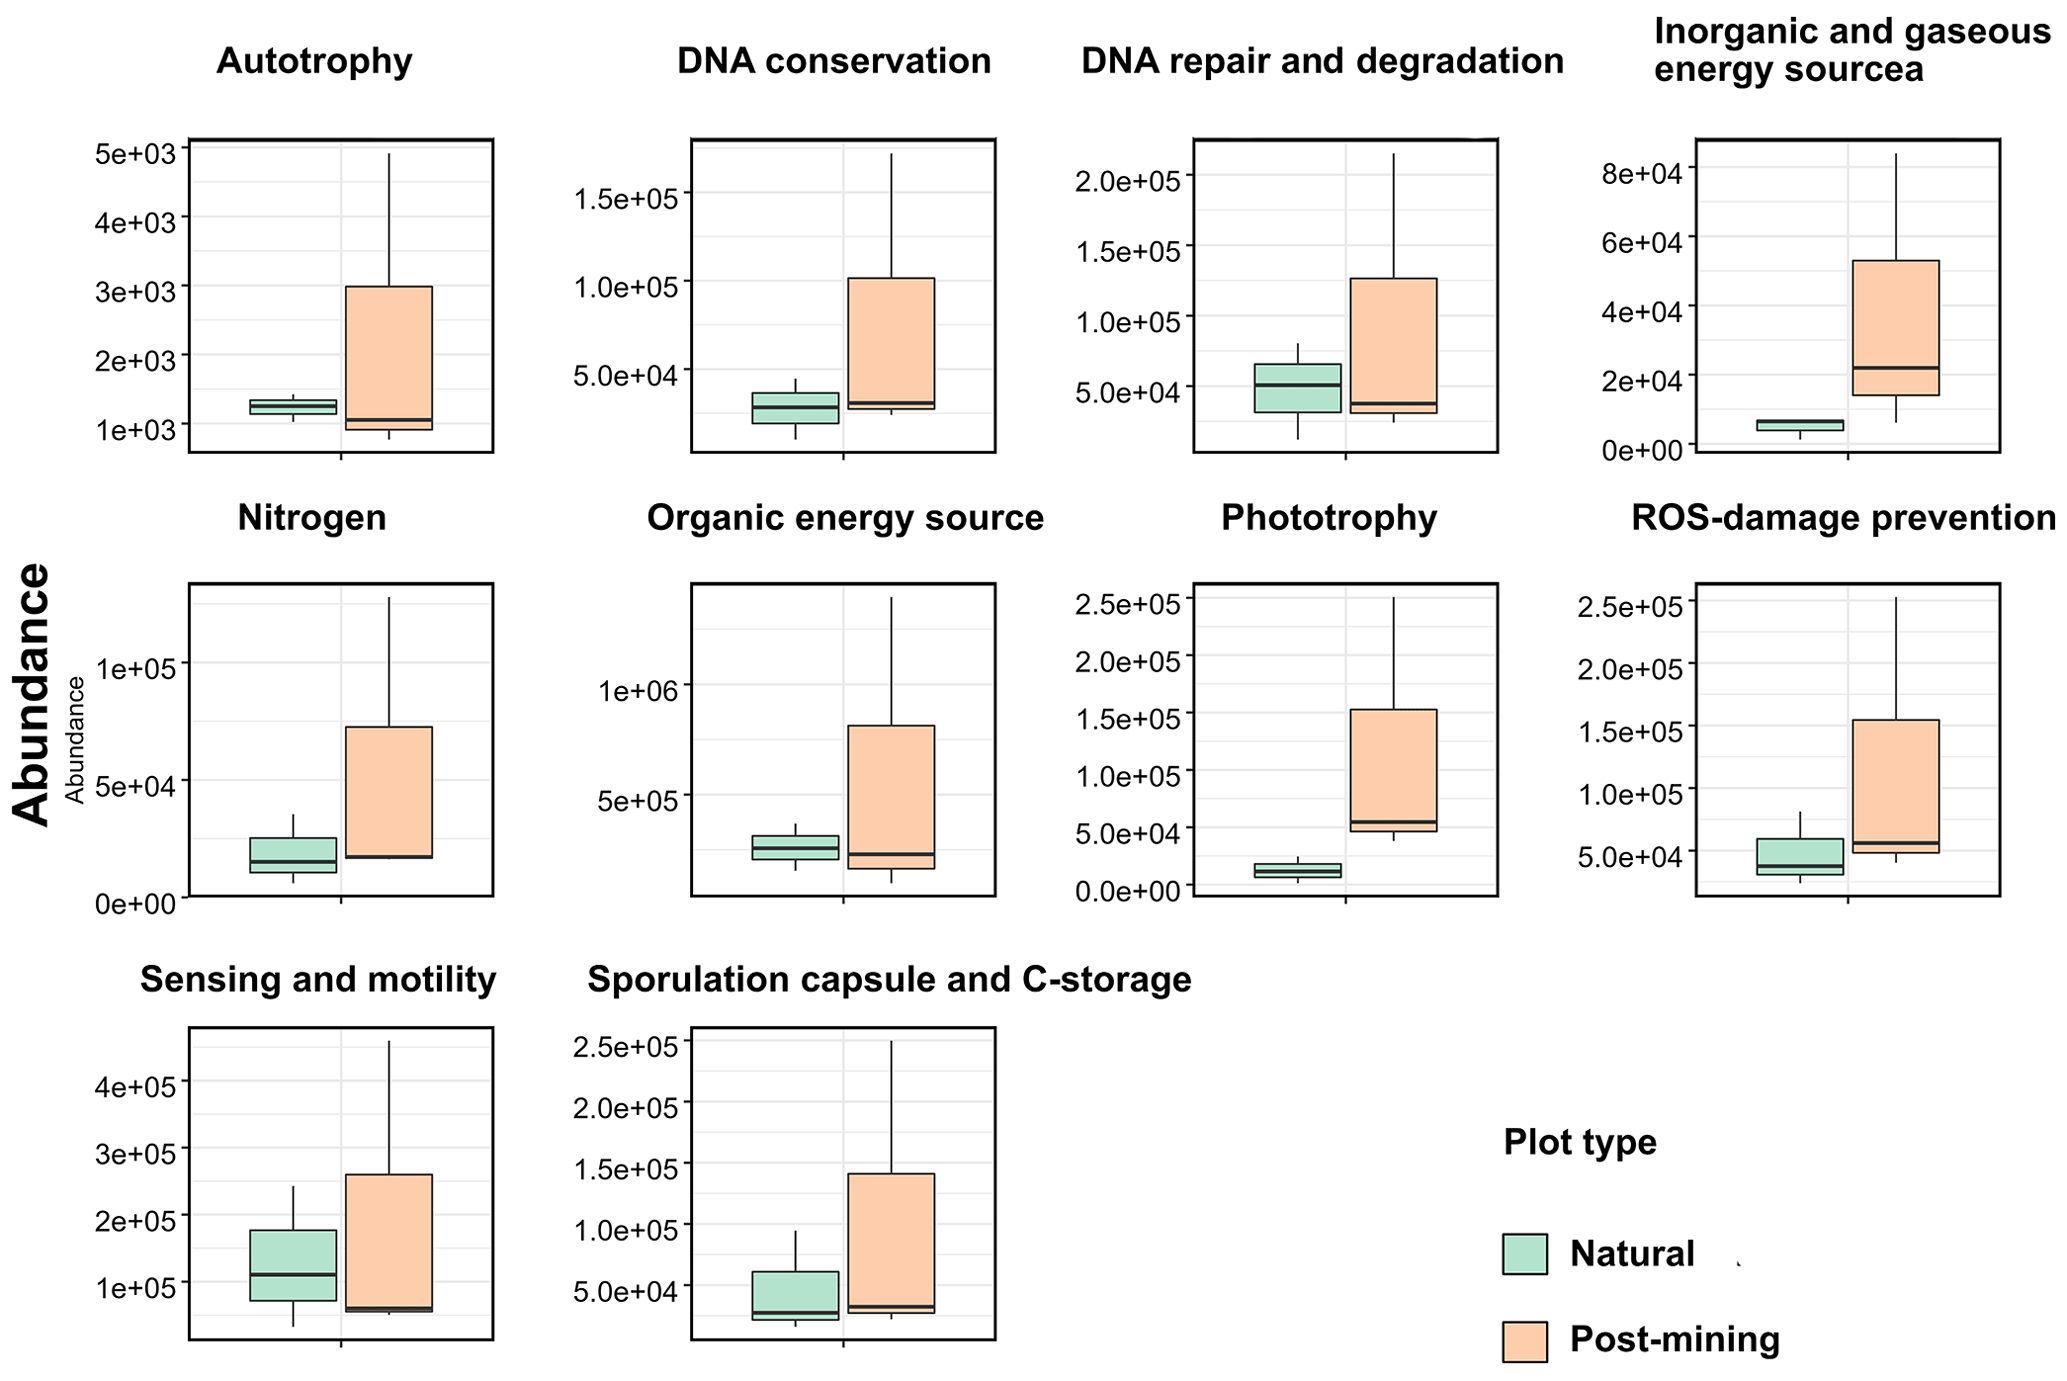
Figure 6Boxplot of functional predictions. The y axis represents functional gene abundances. The line represents the median, and the whiskers represent the range.
In this study, we examined which groups of the biocrust bacterial communities grow after hydration using an SIP assay and differential abundance and diversity modeling. We hydrated and incubated the biocrusts for 96 h expecting bacterial growth, yet very little growth was detected. Only 3.9 % of the natural and 7.7 % of the post-mining biocrusts' ASVs were identified as truly labeled by the stable isotope. Post-mining biocrusts had a slightly higher number of labeled ASVs compared to natural biocrusts, but the differences were not significant. Also, the composition and taxonomic identity of the growing communities did not significantly differ between natural and post-mining biocrusts.
Biocrust organisms are known to resume activity quickly following hydration, resuming functions such as damage repair, germination, nutrient cycling, and growth (Harel et al., 2004; Rajeev et al., 2013; Green and Proctor, 2016; Thomas et al., 2022). Hydration was also demonstrated to change the biocrust bacterial communities (Angel and Conrad, 2013; Štovícek and Gillor, 2022). In an HO SIP assay using the Negev Desert biocrusts from arid and hyperarid regions, samples were hydrated and incubated for 3 weeks at maximum water-holding capacity. Within days, changes in the labeled bacterial community composition and abundance were observed, indicating growth (Angel and Conrad, 2013). Similarly, biocrusts collected in the Negev Desert Highlands during a rain event and subsequent desiccation, demonstrated an increase in Cyanobacteria and decrease in Actinobacteria relative abundance (Baubin et al., 2021), implying selective activation of bacterial taxa in the hydrated biocrust.
In other HO SIP assays on soil bacterial communities, a quick response to rewetting was observed, and bacterial growth was evident within 24 to 72 h of incubation (Blazewicz et al., 2014; Aanderud et al., 2015). Thus, we assumed that hydration and incubation of hyperarid biocrusts under favorable conditions would result in growth. Previous studies examining the effect of a physical disturbance (repeated trampling) on biocrust communities revealed a decrease in the amount of extractable DNA, lower chlorophyll a, and a decrease in biomass and Cyanobacteria abundance (Kuske et al., 2012; Steven et al., 2015; Chung et al., 2019). However, these studies investigated a localized disturbance compared to mining disturbance, where the biocrust is completely removed over large spatial scales. Moreover, the previous studies were conducted in environments that were less extreme than the hyperarid Zin Valley. Therefore, we expected the damage to the biocrust in Zin post-mining sites to follow similar patterns but to be more conspicuous than the previously reported disturbed biocrusts (Kuske et al., 2012; Steven et al., 2015; Chung et al., 2019). Our previous report (Gabay et al., 2022) supported this notion; we demonstrated differences in bacterial communities in natural and post-mining biocrusts, expecting these differences to be reflected in the proliferating communities of these biocrusts.
Our previous survey (2017) also revealed significantly lower abundances of Cyanobacteria and chlorophyll a concentrations in post-mining biocrusts (Gabay et al., 2022). Out of the four mining sites surveyed, Gov (which was restored in 2007) showed the most considerable shift in biocrust community following mining. However, in the current study, we sampled post-mining biocrusts at a different location in the Gov mining site (∼ 500 m away from the original plot) due to technical constraints. In the new location, we found that the photosynthetic potential of the biocrust in the post-mining plots did not differ from the natural biocrust. These results highlight the importance of microenvironments in shaping the functionality of biocrusts (Garcia-Pichel and Belnap, 1996). The similarities in active communities and photosynthetic potential could be due to more developed biocrusts in the new sampling locations compared to the previous ones.
Photosynthetic activity is usually observed in biocrusts within minutes to hours after hydration by either dew or rain (Harel et al., 2004; Lange, 2003). In our experiment, we hydrated the biocrusts to capacity and then incubated the samples for 96 h. During the incubation, most biocrust samples displayed some degree of greening, with more greening in the natural biocrusts (Fig. 2). This indicates that the photosynthetic bacteria in the biocrust were activated upon wetting. Yet, no significant differences were detected between natural and post-mining biocrusts' chlorophyll a concentrations (Fig. 3) or abundances of photosynthesis-related genes (Fig. 6). This implies that similar abundances of photosynthetic bacteria were activated upon wetting in both biocrusts, yet they barely proliferated (Fig. 4).
The PICRUSt analysis revealed no significant differences in the abundances of genes within any of the function categories examined (Fig. 6). In contrast, a previous study conducted in the Negev Desert Highlands examined active bacterial communities during a rain and subsequent drying (Baubin et al., 2021). The results indicated an increase in genes related to photosynthesis, light, and sensing following the rain, while the other function categories did not vary significantly. We note that the identity and abundances of the functional genes in the dry biocrusts detected by Baubin et al. (2021) and here (Fig. 6) are similar. Therefore, we propose that the similarity between the post-mining and natural biocrust communities (Fig. 5) reflect similar functional potential (Fig. 6). However, low abundance of active ASVs were used to infer the abundances of functional genes, and large variance between samples in post-mining biocrusts could mask significant differences (Table S5).
The growth patterns of biocrust organisms are affected by local environmental conditions (Kim and Or, 2017). Zin mining fields are in a hyperarid region, where extreme heat events are frequent in the summer, and rains are scarce and unpredicted. Moreover, in recent years there were only two or three rain events during each rainy season (Zin factory meteorological data). Hydration is the most important factor affecting biocrust organisms' growth rate, while long desiccation periods negatively affect growth (Zaady et al., 2016). Also, salinity levels in Zin Valley soils are high (Table 1; Levi et al., 2021), imposing further stress on the biocrust community. It is known that in high stress environments, biocrust microorganisms increase nutrient availability and accumulation by resuming carbon and nitrogen fixation upon hydration (Aranibar, 2022). The resulting organic carbon and nitrogen compounds can be consumed during the long desiccation periods (Belnap, 2003; Colesie et al., 2014). One study examining microbial nitrogen transformations in biocrusts collected from succulent Karoo biome in Namibia and South Africa showed that following wetting, nitrogen cycling genes are expressed in biocrust organisms (Maier et al., 2022). Another study examining biocrust samples taken from the Moab Desert in Utah demonstrated a pulse of metabolite release following controlled wetting (Swenson et al., 2018). Based on these reports, and due to the extreme conditions in Zin Valley (Levi et al., 2021), we suggest that hyperarid biocrust communities prioritize functions such as metabolite production, nutrient cycling, and preparation for desiccation over growth.
Natural recovery of biocrusts has been long debated and is generally estimated to be a slow process, especially in arid sites that experience very short activity periods for biocrust development, such as the hyperarid Zin mining site (Kidron et al., 2020; Weber et al., 2016). The time and trajectory of recovery depend on many factors relating to local climatic conditions and site properties (Belnap and Lange, 2003). One such factor that greatly affects establishment and restoration of biocrusts is the proximity, availability, and dispersal timing of biocrust propagules (Bowker, 2007; Walker et al., 2007). Thus, the low proliferation rates we observed, particularly in post-mining biocrusts, suggest that restoration processes might be much slower than previously estimated. The topsoil from a stockpile is used to cover the mining pits. This soil may not contain a biocrust seed bank because it was probably destroyed and buried during the mining processes. Further increase in bacterial biomass might highly depend on the dispersal of biocrust propagules to the site from adjacent natural areas by wind or water. Our results further emphasize the need for active restoration measures in the Zin mines. Such measures include soil inoculation with local cyanobacterial propagules (Acea, 2003; Wang et al., 2009; Zhao et al., 2016; Velasco Ayuso et al., 2017) and increased hydration (Morillas and Gallardo, 2015; Zhang et al., 2018), which were effective in enhancing biocrust establishment and recovery following disturbances (Antoninka et al., 2020).
Low proliferation of biocrust bacteria was detected after wetting, suggesting prolonged recovery times of biocrusts following major mechanical disturbances such as mining. Furthermore, recovery largely depends on site conditions and the ability of biocrust propagules to disperse to post-mining sites. Further research is needed to confirm our hypothesis of low proliferation and thus restoration rates in hyperarid biocrust bacterial communities.
All data produced in this study and scripts used for community analysis, functional predictions, and chlorophyll a estimation plot are available at https://github.com/TaliaJoanne/SIP-experiment-Zin-mines (Gabay, 2023). The raw 16S sequences are available in the NCBI database under BioProject ID PRJNA906925 and accession numbers SAMN31937891–SAMN31937900 (https://www.ncbi.nlm.nih.gov/bioproject/PRJNA906925, last access: 30 November 2022).
The supplement related to this article is available online at: https://doi.org/10.5194/soil-9-231-2023-supplement.
TG: conception, sample collection, incubation, chlorophyll a and DNA extraction, statistical analysis, visualization, and writing (original draft preparation, reviewing, and editing). EP: DNA-SIP assay, DNA quantification, and PCR amplification. OG and YZ: conception, writing (reviewing and editing), investigation, and supervision. RA: conception, statistical analysis, visualization, supervision, and writing (reviewing and editing). All authors read and approved the paper.
The contact author has declared that none of the authors has any competing interests.
Publisher's note: Copernicus Publications remains neutral with regard to jurisdictional claims in published maps and institutional affiliations.
We thank Matan Avital from ICL-Rotem for coordinating sample collection and providing Zin factory maps and meteorological data, Sharon Moscovitz for her assistance in sample collection, and Ofer Ovadia for suggestions on statistical analyses. Lastly, we thank ICL-Rotem for their support and funding of this research.
Funding for this research was provided by ICL-Rotem. Roey Angel was supported by the Czech Science Foundation (grant no. 19-24309Y) and Eva Petrova was supported by the Czech Ministry of Education Youth and Sport (SoWa Ecosystems Research (grant no. EF16_013/0001782)).
This paper was edited by Rafael Clemente and reviewed by two anonymous referees.
Aanderud, Z. T., Jones, S. E., Fierer, N., and Lennon, J. T.: Resuscitation of the rare biosphere contributes to pulses of ecosystem activity, Front. Microbiol., 6, 24, https://doi.org/10.3389/fmicb.2015.00024, 2015.
Acea, M.: Cyanobacterial inoculation of heated soils: effect on microorganisms of C and N cycles and on chemical composition in soil surface, Soil Biol. Biochem., 35, 513–524, https://doi.org/10.1016/S0038-0717(03)00005-1, 2003.
Angel, R.: Stable Isotope Probing Techniques and Methodological Considerations Using 15N, in: Stable Isotope Probing: Methods and Protocols, edited by: Dumont, M. G. and Hernández García, M., Springer New York, New York, NY, 175–187, https://doi.org/10.1007/978-1-4939-9721-3_14, 2019.
Angel, R. and Conrad, R.: Elucidating the microbial resuscitation cascade in biological soil crusts following a simulated rain event: Microbial resuscitation in biological soil crusts, Environ. Microbiol., 15, 2799–2815, https://doi.org/10.1111/1462-2920.12140, 2013.
Angel, R., Panhölzl, C., Gabriel, R., Herbold, C., Wanek, W., Richter, A., Eichorst, S. A., and Woebken, D.: Application of stable-isotope labelling techniques for the detection of active diazotrophs: Detecting diazotrophs with stable-isotope techniques, Environ. Microbiol., 20, 44–61, https://doi.org/10.1111/1462-2920.13954, 2018.
Antoninka, A., Faist, A., Rodriguez-Caballero, E., Young, K. E., Chaudhary, V. B., Condon, L. A., and Pyke, D. A.: Biological soil crusts in ecological restoration: emerging research and perspectives, Restor. Ecol., 28, S3–S8, https://doi.org/10.1111/rec.13201, 2020.
Apprill, A., McNally, S., Parsons, R., and Weber, L.: Minor revision to V4 region SSU rRNA 806R gene primer greatly increases detection of SAR11 bacterioplankton, Aquat. Microb. Ecol., 75, 129–137, https://doi.org/10.3354/ame01753, 2015.
Aranibar, J. N.: Functional responses of biological soil crusts to simulated small precipitation pulses in the Monte desert, Argentina, Geoderma, 410, 115660, https://doi.org/10.1016/j.geoderma.2021.115660, 2022.
Arslan, M., Müller, J. A., and Gamal El-Din, M.: Aerobic naphthenic acid-degrading bacteria in petroleum-coke improve oil sands process water remediation in biofilters: DNA-stable isotope probing reveals methylotrophy in Schmutzdecke, Sci. Total Environ., 815, 151961, https://doi.org/10.1016/j.scitotenv.2021.151961, 2022.
Baubin, C., Ran, N., Siebner, H., and Gillor, O.: The response of desert biocrust bacterial communities to hydration-desiccation cycles, SOIL Discuss. [preprint], https://doi.org/10.5194/soil-2021-88, 2021.
Belnap, J.: The world at your feet: desert biological soil crusts, Front. Ecol. Environ., 1, 181–189, https://doi.org/10.1890/1540-9295(2003)001[0181:TWAYFD]2.0.CO;2, 2003.
Belnap, J. and Eldridge, D.: Disturbance and Recovery of Biological Soil Crusts, in: Biological Soil Crusts: Structure, Function, and Management, edited by: Belnap, J. and Lange, O. L., Springer Berlin Heidelberg, Berlin, Heidelberg, 363–383, https://doi.org/10.1007/978-3-642-56475-8_27, 2003.
Belnap, J. and Lange, O. L.: Biological Soil Crusts: Structure, Function, and Management, Springer Berlin Heidelberg, Berlin, Heidelberg, https://doi.org/10.1007/978-3-642-56475-8, 2003.
Blazewicz, S. J., Schwartz, E., and Firestone, M. K.: Growth and death of bacteria and fungi underlie rainfall-induced carbon dioxide pulses from seasonally dried soil, Ecology, 95, 1162–1172, https://doi.org/10.1890/13-1031.1, 2014.
Blazewicz, S. J., Hungate, B. A., Koch, B. J., Nuccio, E. E., Morrissey, E., Brodie, E. L., Schwartz, E., Pett-Ridge, J., and Firestone, M. K.: Taxon-specific microbial growth and mortality patterns reveal distinct temporal population responses to rewetting in a California grassland soil, ISME J., 14, 1520–1532, https://doi.org/10.1038/s41396-020-0617-3, 2020.
Bowker, M. A.: Biological Soil Crust Rehabilitation in Theory and Practice: An Underexploited Opportunity, Restor. Ecol., 15, 13–23, https://doi.org/10.1111/j.1526-100X.2006.00185.x, 2007.
Bridge, G.: Contested Terrain: Mining and the Environment, Annu. Rev. Environ. Res., 29, 205–259, https://doi.org/10.1146/annurev.energy.28.011503.163434, 2004.
Callahan, B. J., McMurdie, P. J., Rosen, M. J., Han, A. W., Johnson, A. J. A., and Holmes, S. P.: DADA2: High-resolution sample inference from Illumina amplicon data, Nat. Method., 13, 581–583, https://doi.org/10.1038/nmeth.3869, 2016.
Chung, Y. A., Thornton, B., Dettweiler-Robinson, E., and Rudgers, J. A.: Soil surface disturbance alters cyanobacterial biocrusts and soil properties in dry grassland and shrubland ecosystems, Plant Soil, 441, 147–159, https://doi.org/10.1007/s11104-019-04102-0, 2019.
Colesie, C., Allan Green, T. G., Haferkamp, I., and Büdel, B.: Habitat stress initiates changes in composition, CO2 gas exchange and C-allocation as life traits in biological soil crusts, ISME J., 8, 2104–2115, https://doi.org/10.1038/ismej.2014.47, 2014.
Davis, N. M., Proctor, D., Holmes, S. P., Relman, D. A., and Callahan, B. J.: Simple statistical identification and removal of contaminant sequences in marker-gene and metagenomics data, Microbiome, 6, 1–14, https://doi.org/10.1101/221499, 2017.
Dixon, P.: VEGAN, a package of R functions for community ecology, J. Veg. Sci., 14, 927–930, https://doi.org/10.1111/j.1654-1103.2003.tb02228.x, 2003.
Douglas, G. M., Maffei, V. J., Zaneveld, J., Yurgel, S. N., Brown, J. R., Taylor, C. M., Huttenhower, C., and Langille, M. G. I.: PICRUSt2: An improved and customizable approach for metagenome inference, BioRxiv, 672295, https://doi.org/10.1101/672295, 2019.
Dumont, M. G. and Hernández García, M. (Eds.): Stable Isotope Probing: Methods and Protocols, Springer New York, New York, NY, https://doi.org/10.1007/978-1-4939-9721-3, 2019.
Gabay, T.: TaliaJoanne/SIP-experiment-Zin-mines: SIP experiment Zin mines (v1.1), Zenodo [code], https://doi.org/10.5281/zenodo.7848152, 2023
Gabay, T., Rotem, G., Gillor, O., and Ziv, Y.: Understanding changes in biocrust communities following phosphate mining in the Negev Desert, Environ. Res., 207, 112200, https://doi.org/10.1016/j.envres.2021.112200, 2022.
Garcia-Pichel, F. and Belnap, J.: Microenvironments and Microscale Productivity of Cyanobacterial Desert Crusts, J. Phycol., 32, 774–782, https://doi.org/10.1111/j.0022-3646.1996.00774.x, 1996.
Green, T. G. A. and Proctor, M. C. F.: Physiology of Photosynthetic Organisms Within Biological Soil Crusts: Their Adaptation, Flexibility, and Plasticity, in: Biological Soil Crusts: An Organizing Principle in Drylands, edited by: Weber, B., Büdel, B., and Belnap, J., Springer International Publishing, Cham, 347–381, https://doi.org/10.1007/978-3-319-30214-0_18, 2016.
Harel, Y., Ohad, I., and Kaplan, A.: Activation of Photosynthesis and Resistance to Photoinhibition in Cyanobacteria within Biological Desert Crust, Plant Physiol., 136, 3070–3079, https://doi.org/10.1104/pp.104.047712, 2004.
Ho, J., Tumkaya, T., Aryal, S., Choi, H., and Claridge-Chang, A.: Moving beyond P values: data analysis with estimation graphics, Nat. Method., 16, 565–566, https://doi.org/10.1038/s41592-019-0470-3, 2019.
Jia, Z., Cao, W., and Hernández García, M.: DNA-based stable isotope probing, in: Stable Isotope Probing, Springer, 17–29, https://doi.org/10.1007/978-1-4939-9721-3_2, 2019.
Kidron, G. J., Xiao, B., and Benenson, I.: Data variability or paradigm shift? Slow versus fast recovery of biological soil crusts-a review, Sci. Total Environ., 721, 137683, https://doi.org/10.1016/j.scitotenv.2020.137683, 2020.
Kim, M. and Or, D.: Hydration status and diurnal trophic interactions shape microbial community function in desert biocrusts, Biogeosciences, 14, 5403–5424, https://doi.org/10.5194/bg-14-5403-2017, 2017.
Kuske, C. R., Yeager, C. M., Johnson, S., Ticknor, L. O., and Belnap, J.: Response and resilience of soil biocrust bacterial communities to chronic physical disturbance in arid shrublands, ISME J., 6, 886–897, https://doi.org/10.1038/ismej.2011.153, 2012.
Lange, O. L.: Photosynthesis of Soil-Crust Biota as Dependent on Environmental Factors, in: Biological Soil Crusts: Structure, Function, and Management, edited by: Belnap, J. and Lange, O. L., Springer Berlin Heidelberg, Berlin, Heidelberg, 217–240, https://doi.org/10.1007/978-3-642-56475-8_18, 2003.
Levi, N., Hillel, N., Zaady, E., Rotem, G., Ziv, Y., Karnieli, A., and Paz-Kagan, T.: Soil quality index for assessing phosphate mining restoration in a hyper-arid environment, Ecol. Indic., 125, 107571, https://doi.org/10.1016/j.ecolind.2021.107571, 2021.
Love, M. I., Huber, W., and Anders, S.: Moderated estimation of fold change and dispersion for RNA-seq data with DESeq2, Genome Biol., 15, 550, 1–21, https://doi.org/10.1186/s13059-014-0550-8, 2014.
Lozupone, C., Lladser, M. E., Knights, D., Stombaugh, J., and Knight, R.: UniFrac: an effective distance metric for microbial community comparison, ISME J., 5, 169–172, 2011.
Macey, M. C., Pratscher, J., Crombie, A. T., and Murrell, J. C.: Impact of plants on the diversity and activity of methylotrophs in soil, Microbiome, 8, 1–17, https://doi.org/10.1186/s40168-020-00801-4, 2020.
Maier, S., Kratz, A. M., Weber, J., Prass, M., Liu, F., Clark, A. T., Abed, R. M. M., Su, H., Cheng, Y., Eickhorst, T., Fiedler, S., Pöschl, U., and Weber, B.: Water-driven microbial nitrogen transformations in biological soil crusts causing atmospheric nitrous acid and nitric oxide emissions, ISME J., 16, 1012–1024, https://doi.org/10.1038/s41396-021-01127-1, 2022.
Makhalanyane, T. P., Valverde, A., Gunnigle, E., Frossard, A., Ramond, J.-B., and Cowan, D. A.: Microbial ecology of hot desert edaphic systems, FEMS Microbiol. Rev., 39, 203–221, https://doi.org/10.1093/femsre/fuu011, 2015.
McMurdie, P. J. and Holmes, S.: phyloseq: An R Package for Reproducible Interactive Analysis and Graphics of Microbiome Census Data, Plos One, 8, e61217, https://doi.org/10.1371/journal.pone.0061217, 2013.
Meier, D. V., Imminger, S., Gillor, O., and Woebken, D.: Distribution of Mixotrophy and Desiccation Survival Mechanisms across Microbial Genomes in an Arid Biological Soil Crust Community, mSystems, 6, e00786-20, https://doi.org/10.1128/mSystems.00786-20, 2021.
Minh, B. Q., Schmidt, H. A., Chernomor, O., Schrempf, D., Woodhams, M. D., von Haeseler, A., and Lanfear, R.: IQ-TREE 2: New Models and Efficient Methods for Phylogenetic Inference in the Genomic Era, Mol. Biol. Evol., 37, 1530–1534, https://doi.org/10.1093/molbev/msaa015, 2020.
Morillas, L. and Gallardo, A.: Biological soil crusts and wetting events: Effects on soil N and C cycles, Appl. Soil Ecol., 94, 1–6, https://doi.org/10.1016/j.apsoil.2015.04.015, 2015.
Parada, A. E., Needham, D. M., and Fuhrman, J. A.: Every base matters: assessing small subunit rRNA primers for marine microbiomes with mock communities, time series and global field samples, Environ. Microbiol., 18, 1403–1414, 2016.
Pepe-Ranney, C., Koechli, C., Potrafka, R., Andam, C., Eggleston, E., Garcia-Pichel, F., and Buckley, D. H.: Non-cyanobacterial diazotrophs mediate dinitrogen fixation in biological soil crusts during early crust formation, ISME J., 10, 287–298, https://doi.org/10.1038/ismej.2015.106, 2016.
Rajeev, L., da Rocha, U. N., Klitgord, N., Luning, E. G., Fortney, J., Axen, S. D., Shih, P. M., Bouskill, N. J., Bowen, B. P., Kerfeld, C. A., Garcia-Pichel, F., Brodie, E. L., Northen, T. R., and Mukhopadhyay, A.: Dynamic cyanobacterial response to hydration and dehydration in a desert biological soil crust, ISME J., 7, 2178–2191, https://doi.org/10.1038/ismej.2013.83, 2013.
Ritchie, R. J.: Consistent Sets of Spectrophotometric Chlorophyll Equations for Acetone, Methanol and Ethanol Solvents, Photosyn. Res., 89, 27–41, https://doi.org/10.1007/s11120-006-9065-9, 2006.
Schwartz, E., Hayer, M., Hungate, B. A., and Mau, R. L.: Stable Isotope Probing of Microorganisms in Environmental Samples with HO, in: Stable Isotope Probing, Springer, 129–136, https://doi.org/10.1007/978-1-4939-9721-3_10, 2019.
Sengupta, M.: Environmental impacts of mining: monitoring, restoration, and control, 2nd Edn., CRC Press, Boca Raton, FL, Abingdon, Oxon, 1 pp., https://doi.org/10.1201/9780203757062, 2021.
Steven, B., Kuske, C. R., Gallegos-Graves, L. V., Reed, S. C., and Belnap, J.: Climate Change and Physical Disturbance Manipulations Result in Distinct Biological Soil Crust Communities, Appl. Environ. Microbiol., 81, 7448–7459, https://doi.org/10.1128/AEM.01443-15, 2015.
Štovícek, A. and Gillor, O.: The Response of Soil Microbial Communities to Hydration and Desiccation Cycles in Hot Desert Ecosystems, in: Microbiology of Hot Deserts, edited by: Ramond, J.-B. and Cowan, D. A., Springer International Publishing, Cham, 244, 319–339, https://doi.org/10.1007/978-3-030-98415-1_11, 2022.
Sultana, N., Zhao, J., Zheng, Y., Cai, Y., Faheem, M., Peng, X., Wang, W., and Jia, Z.: Stable isotope probing of active methane oxidizers in rice field soils from cold regions, Biol. Fertil. Soils, 55, 243–250, https://doi.org/10.1007/s00374-018-01334-7, 2019.
Swenson, T. L., Karaoz, U., Swenson, J. M., Bowen, B. P., and Northen, T. R.: Linking soil biology and chemistry in biological soil crust using isolate exometabolomics, Nat. Commun., 9, 19, https://doi.org/10.1038/s41467-017-02356-9, 2018.
R Development Core Team: R: A language and environment for statistical computing, Vienna, Austria, https://www.R-project.org/, (last access: 1 December 2022), 2013.
Thomas, A. D., Elliott, D. R., Hardcastle, D., Strong, C. L., Bullard, J., Webster, R., and Lan, S.: Soil biocrusts affect metabolic response to hydration on dunes in west Queensland, Australia, Geoderma, 405, 115464, https://doi.org/10.1016/j.geoderma.2021.115464, 2022.
Velasco Ayuso, S., Giraldo Silva, A., Nelson, C., Barger, N. N., and Garcia-Pichel, F.: Microbial Nursery Production of High-Quality Biological Soil Crust Biomass for Restoration of Degraded Dryland Soils, Appl. Environ. Microbiol., 83, e02179-16, https://doi.org/10.1128/AEM.02179-16, 2017.
Walker, L. R., Walker, J., and Hobbs, R. J. (Eds.): Linking restoration and ecological succession, Springer, New York, NY, 190 pp., https://doi.org/10.1007/978-0-387-35303-6, 2007.
Wang, W., Liu, Y., Li, D., Hu, C., and Rao, B.: Feasibility of cyanobacterial inoculation for biological soil crusts formation in desert area, Soil Biol. Biochem., 41, 926–929, https://doi.org/10.1016/j.soilbio.2008.07.001, 2009.
Weber, B., Büdel, B., and Belnap, J. (Eds.): Biological Soil Crusts: An Organizing Principle in Drylands, Springer International Publishing, Cham, 226, https://doi.org/10.1007/978-3-319-30214-0, 2016.
Weber, B., Belnap, J., Büdel, B., Antoninka, A. J., Barger, N. N., Chaudhary, V. B., Darrouzet-Nardi, A., Eldridge, D. J., Faist, A. M., Ferrenberg, S., Havrilla, C. A., Huber-Sannwald, E., Malam Issa, O., Maestre, F. T., Reed, S. C., Rodriguez-Caballero, E., Tucker, C., Young, K. E., Zhang, Y., Zhao, Y., Zhou, X., and Bowker, M. A.: What is a biocrust? A refined, contemporary definition for a broadening research community, Biol. Rev., 97, 1768–1785, https://doi.org/10.1111/brv.12862, 2022.
Yu, Y., Lee, C., Kim, J., and Hwang, S.: Group-specific primer and probe sets to detect methanogenic communities using quantitative real-time polymerase chain reaction, Biotechnol. Bioeng., 89, 670–679, 2005.
Zaady, E., Eldridge, D. J., and Bowker, M. A.: Effects of Local-Scale Disturbance on Biocrusts, in: Biological Soil Crusts: An Organizing Principle in Drylands, edited by: Weber, B., Büdel, B., and Belnap, J., Springer International Publishing, Cham, 226, 429–449, https://doi.org/10.1007/978-3-319-30214-0_21, 2016.
Zhang, C., Niu, D., Song, M., Elser, J. J., Okie, J. G., and Fu, H.: Effects of rainfall manipulations on carbon exchange of cyanobacteria and moss-dominated biological soil crusts, Soil Biol. Biochem., 124, 24–31, https://doi.org/10.1016/j.soilbio.2018.05.021, 2018.
Zhang, L., Dumont, M. G., Bodelier, P. L. E., Adams, J. M., He, D., and Chu, H.: DNA stable-isotope probing highlights the effects of temperature on functionally active methanotrophs in natural wetlands, Soil Biol. Biochem., 149, 107954, https://doi.org/10.1016/j.soilbio.2020.107954, 2020.
Zhao, Y., Bowker, M. A., Zhang, Y., and Zaady, E.: Enhanced Recovery of Biological Soil Crusts After Disturbance, in: Biological Soil Crusts: An Organizing Principle in Drylands, Vol. 226, edited by: Weber, B., Büdel, B., and Belnap, J., Springer International Publishing, Cham, 226, 499–523, https://doi.org/10.1007/978-3-319-30214-0_24, 2016.