


In the early twentieth century, Mexican immigration to the United States transformed from a small flow into a mass movement that continues to today (Durand, Massey, and Zenteno Reference Durand, Massey and Zenteno2001; Feliciano Reference Feliciano2001; Gratton and Gutmann Reference Gratton and Gutmann2000).Footnote 1 The migrants who left Mexico during this period were different from earlier cohorts. They turned away from traditional zones of settlement and increasingly began to work in activities other than agriculture (Cardoso Reference Cardoso1980; Gratton and Merchant 2015; Innis-Jiménez Reference Innis-Jiménez2013). Previous literature has shown that stagnant living standards in Mexico as well as more and better employment opportunities across the American Southwest were the main incentives to migrate. Growing migrant networks and the recruiting of intending migrants by American employers reduced migration costs, making migration to the United States even more profitable (Brass Reference Brass1990; Durand Reference Durand2016; Henderson Reference Henderson2011). Unlike previous periods, however, a number of shocks including armed conflicts, severe economic downturns, and sharp changes in immigration policy may have also influenced who crossed the border during the early twentieth century (Escamilla-Guerrero, Kosack, and Ward Reference Escamilla-Guerrero, Kosack and Ward2021). This paper examines how the Mexico–U.S. migration flow changed in response to the Panic of 1907—the most severe financial crisis before the Great Depression. In particular, we leverage this major demand shock to identify changes in migrant selection and study the role of labor recruiting in shaping the composition of the flow.
The 1907 Panic unfolded quickly and unexpectedly in the second half of the year. During these months two thousand companies and more than one hundred banks failed (Markham Reference Markham2002, p. 31). Many financial institutions across the United States also limited or suspended their cash payments, pushing companies in all economic sectors to curtail operations (Andrew Reference Andrew1908). In the aftermath of the crisis real GNP and industrial production declined 6.7 and 30 percent, respectively (Hansen Reference Hansen2014; Odell and Weidenmier Reference Odell and Weidenmier2004). How migrant selection adjusts to large-scale shocks such as the Panic of 1907 depends on whether the incentives and means to migrate are significantly affected. The few studies addressing the impact of economic crises on Mexican immigration provide mixed results, with selection on education changing after the Great Recession (Villarreal Reference Villarreal2014) but being not affected by the Peso Crisis of 1995 (Monras Reference Monras2020). Unlike contemporary settings, the early twentieth century provides a unique opportunity to assess the impact of random shocks on migrant selection, as the United States maintained an open border for Mexican immigration (Durand Reference Durand2016; Fogel Reference Fogel1978; Samora Reference Samora1982). The absence of entry restrictions not only allows for immigration to adjust to shocks in the short run, but also minimizes the under-enumeration of undocumented migrants, a factor that can bias selection estimates (Fernández-Huertas Reference Fernández-Huertas2011; Ibarraran and Lubotsky Reference Ibarraran, Lubotsky and George2007).
We use anthropometric evidence on height (physical stature) to assess migrant selection in the absence of wage data and occupation rankings. Height has been used extensively to study selection into migration in diverse historical contexts (Humphries and Leunig Reference Humphries and Leunig2009; Juif and Quiroga Reference Juif and Quiroga2019; Kosack and Ward Reference Kosack and Ward2014; Spitzer and Zimran Reference Spitzer and Zimran2018; Stolz and Baten Reference Stolz and Baten2012), as it is positively correlated with human capital and earnings potential (Borrescio-Higa, Bozzoli, and Droller 2019; Komlos and Baten Reference Komlos and Baten2004; Komlos and Meermann Reference Komlos and Meermann2007; Schultz Reference Schultz2002).Footnote 2 A major advantage of using height as a measure of selection is that for adults, height cannot be manipulated in anticipation of or in response to migration. We obtain data on the height of Mexican migrants from individual records of border crossings from 1906 to 1908. These documents capture migrant arrivals at nine entrance ports located along the Mexico–U.S. border.Footnote 3 To determine the selection of Mexican immigration, we estimate differences in height between migrants and three samples of residents. The height data for Mexican residents come from military recruitment records of ordinary soldiers and elite forces, and from passport application records. These comparison samples capture the lower, intermediate, and upper ranks of Mexico’s height distribution, respectively. In this sense, the estimated height differentials allow us to infer from which part of the height distribution the migrants were drawn. In our baseline specification, we control for the individual’s birth cohort (year of birth) and birth region, as these factors may influence height over time and across space.
We find that migrants were 2.3 cm taller than ordinary soldiers, 0.6 cm taller than military elite forces, and 2.7 cm shorter than passport holders. This implies that Mexican immigration was characterized by an intermediate or positive selection, as relatively tall, physically productive individuals with higher earnings potential moved to the United States. Our estimates hold when controlling for occupational skill class, suggesting that Mexico sent its “best” unskilled, skilled, and professional workers. In addition, the degree of selection varied across source regions, with migrants from the central plateau—who faced the lowest wages in Mexico and had to travel about 580 km to the border—being more positively selected than their peers from the North—who migrated from locations less than 200 km away from the border. This finding is consistent with predictions of the Chiquiar and Hanson (Reference Chiquiar and Hanson2005) model, where the poor and unskilled are disproportionately priced out of migration due to high bureaucratic, information, and transportation costs that are likely to decrease with human capital. Our results showing that Mexican migrants were mostly drawn from the intermediate/upper ranks of the height (earnings) distribution are also consistent with documented selection patterns for the period (Kosack and Ward Reference Kosack and Ward2014) and contemporary settings (Mishra Reference Mishra2007; Orrenius and Zavodny Reference Orrenius and Zavodny2005).
To examine the impact of the Panic of 1907 on migrant selection, we classify migrants into three groups (time periods) depending on when they crossed the border: before, during, or after the crisis. Our empirical approach estimates selection patterns in each period conditional on the aforementioned control variables, each interacted with a full set of time-period dummies. This allows the effect of each factor to vary arbitrarily across periods. We find that migrants were positively selected on height (0.7 cm taller) relative to the military elite before the Panic of 1907. This pattern changed dramatically during the Panic, with migrants being negatively selected (0.9 cm shorter). We also observe selection patterns returning to pre-Panic levels once the U.S. financial system was restored, suggesting that the crisis did not have a permanent effect on migrant selection. Our estimates are robust to several sensitivity checks, which include controlling for seasonal migration and allowing the effect of each control variable to vary flexibly across birth cohorts.
To explain how selection patterns adjusted to the crisis, we focus on factors affecting the costs of migration. In the early twentieth century, stagnant wages and binding liquidity constraints resulted in high migration costs for the majority of the Mexican population (Cardoso Reference Cardoso1980; Rosenzweig Reference Rosenzweig1965). This condition favored the operation of a labor recruiting system: the enganche (Brass Reference Brass1990; Durand Reference Durand2016). The enganche reduced migration costs by offering wages in advance and transportation to the destination in exchange for future labor services. We provide evidence suggesting that the enganche shaped the composition of Mexican immigration, as American recruiters systematically chose the tallest workers—that is, the enganche system was characterized by a positive selection in recruiting. On average, enganche migrants were 0.7 cm taller than migrants who crossed the border using other means. In the pre-Panic period, the enganche effect accounted for about 41 percent of the difference in height between migrants and the military elite. When the Panic of 1907 hit the financial system, American companies faced liquidity constraints and were not able to finance the enganche; therefore, the share of recruited migrant workers dropped from 36 to 1 percent. This variation in the share of recruited migrants allows us to infer that had the scale and degree of assortative recruiting continued during the crisis, the height difference between migrants and the military elite would have been about –0.2 cm only.
We also find significant changes in the height profile of recruited and non-recruited migrants in the aftermath of the crisis. The evidence suggests that recruiting patterns changed, with post-Panic, recruited migrants being on average 2.1 cm shorter than their pre-Panic peers. This effect, however, was counterbalanced by the change in the degree of positive selection among non-recruited migrants, who were about 1 cm taller than their pre-Panic counterparts. The combination of these opposing effects led to a positive selection similar, in terms of degree, to that observed in the pre-Panic period. This finding provides suggestive evidence that the enganche was a mechanism that maintained the height profile (skill mix) of Mexican immigration relatively constant in the short run. As part of the analysis, we show that the shift in recruiting patterns was not driven by the recruiting of seasonal migrants nor by regional droughts in Mexico that could have induced changes in the composition of recruited and non-recruited immigration.
One caveat to our results is that labor recruiting only partially explains the adjustments in migrant selection. This implies that unobserved factors influenced the above-mentioned shifts in selection. For example, previous literature shows that earnings inequality can change dramatically during and after large-scale shocks such as wars, public health emergencies, social conflicts, or financial crises (see Acemoglu, Autor, and Lyle Reference Acemoglu, Autor and Lyle2004; Adams-Prassl et al. Reference Adams-Prassl, Boneva, Golin and Rauh2020; Alvaredo, Cruces, and Gasparini Reference Alvaredo, Cruces and Gasparini2018; Piketty and Saez Reference Piketty and Saez2003). If during the Panic of 1907 the U.S. wage dispersion was substantially compressed, the relatively short and poor individuals from Mexico would have had the most to gain from migrating. This would explain the shift toward a negative selection during the crisis. However, this hypothesis is difficult to test without detailed wage data from both the United States and Mexico.
This paper adds to our knowledge about the selection of Mexico-to-U.S. immigration in the early twentieth century. In particular, our study complements the work of Kosack and Ward (Reference Kosack and Ward2014), who estimate the selection of Mexican migrants in 1920—that is, at the end of the Mexican Revolution. Our results pertain to selection patterns before this conflict, during which about 350,000 people fled Mexico (McCaa Reference McCaa2003). While both papers find positive selection on height relative to a similar sample of ordinary soldiers, we find that migrants were on average 2.1 cm taller. This height gap is half of that documented in Kosack and Ward (Reference Kosack and Ward2014), suggesting that the Mexican Revolution may have increased the degree of positive selection. Note that our immigration data cover more entrance ports (nine versus four) and thus may capture a higher variation in the composition of migrant flows.
Our main contribution is to provide an example of how selection patterns of Mexican immigration adjusted to random shocks in the later part of the Age of Mass Migration (1850–1920). We found that Mexican immigration was very responsive to changes in business conditions, with selection on height adjusting in a matter of months. Adjustments during and after the shock were partially mediated by the recruitment of migrant workers. In this sense, we also contribute to our understanding of the role of labor recruiting in shaping the composition of migrant flows. In the past and present, labor recruiting has influenced the decision to migrate, especially in contexts where social networks are not yet established (Abella Reference Abella, Douglas and Edward Taylor2004; Eelens and Speckmann Reference Eelens and Speckmann1990). Similar to the Mexican case, during the Age of Mass Migration, Brazilian landowners recruited intending Italian migrants, who were offered subsidized passages to Brazilian coffee plantations (Sánchez-Alonso Reference Sánchez-Alonso2019; Stolz, Baten, and Botelho Reference Stolz, Baten and Botelho2013). Hence, formal and informal recruiting systems can help us to understand who migrates in the early stages of international migration and reconcile empirical evidence that appears to be at odds with predictions from classic migrant selection models.Footnote 4
HISTORICAL BACKGROUND
The United States became the world’s leading manufacturing nation at the turn of the twentieth century (Maddison Reference Maddison1987; Nelson and Wright Reference Nelson and Wright1992; Wright Reference Wright1990). The rapid growth of the American economy increased employment opportunities, pulling millions of migrants from all over the world looking for better living conditions.Footnote 5 Mexicans were no exception. From 1900, Mexican immigration increased sharply and expanded its geographic range of settlement in the United States (Cardoso Reference Cardoso1980; Feliciano Reference Feliciano2001; Gratton and Merchant 2015).Footnote 6 Diverse factors shaped Mexican mass migration during this period, but labor recruiting practices and the lack of restrictive immigration policies were key. American companies and contractors recruited intending migrants in Mexican towns by offering wages in advance and transportation in exchange for future labor services (Brass Reference Brass1990; Durand Reference Durand2016). Once at the border, migrant workers were admitted without restrictions since they were considered temporary aliens who moved back and forth supplying labor (Fogel Reference Fogel1978; Gamio Reference Gamio1930; Samora Reference Samora1982). Mexican migrants were employed mainly in farms, mines, and railways across the American Southwest.
The American economic ascendancy also multiplied investment opportunities. National and state banks increased their bond and stock assets from 50 million in 1892 to 487 million in 1907 (Johnson Reference Johnson1908, p. 457). Moreover, the optimism engendered by the growing economy fueled the tendency of the public to take on more risk and invest in speculative industries. The Dow Jones index doubled from 1904 to 1906, and by the end of 1905, the call money rate was at 25 percent and foreseen to increase further the following year (Markham Reference Markham2002, p. 29). The appetite for investment was channeled by a financial system that was expanding rapidly. About 16 thousand financial institutions supplied capital for the creation of new firms in every sector of the U.S. economy (Bruner and Carr Reference Bruner and Carr2007, p. 116).Footnote 7 However, these institutions were mostly financial intermediaries (small unit banks, fiduciary trust companies, and clearing houses) that operated without effective financial regulation. While access to capital was relatively unconstrained, the absence of a central bank and the growing speculative environment made the U.S. financial system fragile.
The Panic of 1907
In April 1906, an earthquake devastated the city of San Francisco, causing damages equal to 10.5 billion in current U.S. dollars (Ager et al. 2020). Since most of the city’s insurance policies were underwritten by British companies, extraordinarily large amounts of gold flowed from London to the United States. In response, the Bank of England undertook defensive measures to sharply reduce the outflows of gold and attract gold imports (Odell and Weidenmier Reference Odell and Weidenmier2004, p. 1003). This policy added pressure to the fragile American financial markets, setting the stage for one of the most severe financial crises in American history: the Panic of 1907 (Frydman, Hilt, and Zhou Reference Frydman, Hilt and Zhou2015; Moen and Tallman 1992; Andrew Reference Andrew1908).
In March 1907, a scramble for liquidity produced a sell-off of securities. The repatriation of finance bills reduced substantially the U.S. gold stock, pushing the economy into a recession (Odell and Weidenmier Reference Odell and Weidenmier2004, p. 1021). Stock prices fell, and the financial system gradually faced greater pressure.Footnote 8 Finally, the Knickerbrocker Trust Company—the third largest trust company in New York—was suddenly suspended in October. This event triggered a full-blown panic. The suspension of payments by banks spread nationally, constraining transactions in all sectors and pushing companies to curtail operations. Full convertibility of deposits was not restored until January 1908 (Frydman, Hilt, and Zhou Reference Frydman, Hilt and Zhou2015, p. 912; Johnson Reference Johnson1908, p. 454).
It is unclear which industries were hit the hardest by the crisis, but based on the plunge in share price, companies in the auto, metals (copper and iron), mining, and railway industries may have experienced the greatest losses (see Figure 1 in Bruner & Carr (Reference Bruner and Carr2007)). The agricultural sector was similarly affected, with the number of farms that went bankrupt increasing by 26 percent in 1907 (U.S. Bureau of the Census 1949, p. 111). In this sense, the crisis impacted the main sources of employment for Mexican migrants, but its effect on the labor market may have been larger in the industrial sector.
We leverage two features of the Panic of 1907 to study how selection patterns of Mexican migrants adjusted during and after the crisis. First, previous literature shows that the 1906 San Francisco earthquake triggered the chain of events that culminated in the Panic of 1907 (Bruner and Carr Reference Bruner and Carr2007; Odell and Weidenmier Reference Odell and Weidenmier2004). Hence, the random nature of the crisis minimizes the likelihood of anticipation effects that can distort the response of migrant selection to changes in business conditions.Footnote 9 Second, although the Panic of 1907 became a world-wide affair (Johnson Reference Johnson1908; Noyes Reference Noyes1909), no bank collapsed or went bankrupt, nor losses for bill holders or depositors occurred in Mexico (Gómez Reference Gómez2011, p. 2095). It is documented that the structure of the Mexican financial system prevented contagion and guaranteed the national solvency abroad (The Wall Street Journal 1910). Moreover, unlike the United States, the Mexican economy and manufactures production expanded in 1907, and there is no evidence that bankrupt companies or unemployment increased.Footnote 10 The crisis, however, depressed trade with the United States and may have induced a transient recession in 1908, which was quickly overcome in 1909 (see Figure A.2 in the Online Appendix). This allows us to consider the business conditions in Mexico fixed during the period and discard the presence of simultaneous adjustments from the demand and supply sides induced by the crisis.
In addition, in the early twentieth century, Mexican migrants did not face legal barriers to entering the United States.Footnote 11 Immigration restrictions can hinder migrant selection adjustments, as they are implemented to control the scale and composition of immigration (Abramitzky and Boustan Reference Abramitzky and Boustan2017, p. 1324). Therefore, the U.S. open border policy enabled Mexican immigration to respond to shocks in the short run. The lack of immigration restrictions also minimizes illegal border crossings and thus the under-enumeration of undocumented migrants, a factor that can bias selection estimates in contemporary settings (Fernández-Huertas Reference Fernández-Huertas2011; Ibarraran and Lubotsky Reference Ibarraran, Lubotsky and George2007). Next, we present a conceptual framework to understand shifts in migrant selection patterns.
CONCEPTUAL FRAMEWORK AND RELATED LITERATURE
To explain differences in the skill mix of migrants, models of self-selection focus primarily on two factors: earnings inequality and migration costs. The classic Borjas–Roy model predicts that migrants from countries with relatively high earnings inequality will be negatively self-selected: drawn from the lower half of the skill distribution (Borjas Reference Borjas1987, 1991; Roy Reference Roy1951). This is because countries with high earnings dispersion are unattractive to workers with less-than-average productive skills, who would have the most to gain from moving to countries with relatively low earnings inequality. This prediction, however, assumes that migration costs are constant across individuals and thus do not influence the direction of selection. Chiquiar and Hanson (Reference Chiquiar and Hanson2005) extend the Borjas–Roy model by considering that, in practice, migration costs vary by skill level. They argue that bureaucratic, transportation, job-search, and information costs involved in migration are fixed, representing fewer hours of work for the highly skilled, who can finance migration with no or lower borrowing costs. The main implication of Chiquiar and Hanson’s framework is that migrants from countries with relatively high earnings inequality are unlikely to be negatively self-selected but drawn from the intermediate ranks of the skill distribution. This is because migration costs preclude the poor and low skilled from migrating, while high returns to skill (high earnings inequality) at home dissuade the highly skilled from migrating (see Online Appendix Figure A.3).Footnote 12
Historical evidence confirms that developments in earnings inequality across countries can explain shifts in migrant self-selection patterns. For example, over the last two centuries, migrants arriving in the United States have become more positively self-selected, which is partially explained by the widening of the U.S. income distribution and the divergence in absolute income between the United States and the developing world (Abramitzky and Boustan Reference Abramitzky and Boustan2017). Previous empirical research also shows that factors lowering migration costs for future migrants, such as migrant networks (McKenzie and Rapoport Reference McKenzie and Rapoport2007, 2010; Munshi Reference Munshi2003) and household wealth accumulation (Abramitzky, Boustan, and Eriksson Reference Abramitzky, Boustan and Eriksson2013; Connor Reference Connor2019) can influence migrant selection. Similarly, immigration policies that directly or indirectly affect migration costs can adjust the direction and degree of selection into (return) migration (see, e.g., Antecol, Cobb-Clark, and Trejo 2003; Bianchi Reference Bianchi2013; Clemens, Lewis, and Postel Reference Clemens, Lewis and Postel2018; Greenwood and Ward Reference Greenwood and Ward2015; Massey and Pren Reference Massey and Pren2012; Mayda et al. Reference Mayda, Francesc Ortega, Shih and Sparber2018; Spitzer and Zimran Reference Spitzer and Zimran2018; Timmer and Williamson Reference Timmer and Williamson1998; Ward Reference Ward2017).
In addition, unexpected events such as economic crises, natural disasters, or wars can shape self-selection patterns by affecting migration incentives. Negative shocks to receiving economies like the Panic of 1907 can reduce employment opportunities and thus increase labor-market competition among immigrants. This may affect the skill mix of migrants as competition increases migration costs through the increase in monetary and psychological costs associated with job search (Massey Reference Massey2016). Following Chiquiar and Hanson (Reference Chiquiar and Hanson2005), an increase in migration costs would disproportionately preclude the poor and low skilled from migrating, leading to an increase in the average skill level of migrants. Negative shocks, however, can differentially impact economic sectors and occupations. For example, shocks affecting manufacturing jobs more than agricultural ones would tend to reduce the average skill level of migrants, possibly inducing a greater degree of negative self-selection.Footnote 13
Negative shocks in sending countries can also impact migration incentives. However, they may not necessarily induce changes in self-selection patterns despite increasing migration costs, as factors including antipoverty programs and migrant networks can relax financial constraints for the poor and low-skilled, who otherwise would be priced out of migration (Angelucci Reference Angelucci2015). In fact, the few studies addressing the impact of shocks on migrant selection—which predominantly examine negative shocks in sending countries—provide mixed findings. On the one hand, Villarreal (Reference Villarreal2014) shows that the Great Recession (2007/9) modified significantly the selection of Mexican migrants in terms of education. Collins and Zimran (Reference Collins and Zimran2019) also document a decline in human capital of Irish migrants during Ireland’s Great Famine (1845/9). On the other hand, Monras (Reference Monras2020) argues that observable characteristics of Mexican migrants did not change significantly before and after the Mexican Peso Crisis of 1995, and Spitzer, Tortorici, and Zimran (Reference Spitzer, Tortorici and Zimran2020) find no evidence that the Messina-Reggio Calabria Earthquake (1908)—arguably the most devastating natural disaster in modern European history—impacted Italian emigration or its composition. A common feature of research studying disruptive events affecting immigration is the use of annual or census data, which may not always capture shifts in migrant selection. To overcome this limitation, we exploit high-frequency micro data (daily border crossings) that allow us to precisely pinpoint changes in migrant selection within a year. We now turn to describe these data and our measure of selection.
DATA
Measure of Selection
We use physical stature (height) to estimate the selection of Mexican migrants. Average height reflects genetic factors as well as nutritional and health conditions during early childhood and youth. Since wealthier people have better access to food, hygienic conditions, and medical resources, they tend to be taller than the poorer population (see Borrescio-Higa, Bozzoli, and Droller 2019; Deaton Reference Deaton2007; Komlos and Baten Reference Komlos and Baten2004; Komlos and Meermann Reference Komlos and Meermann2007; Komlos and A’Hearn 2019; Steckel Reference Steckel1995). Taller individuals also develop better cognitive abilities, reach higher levels of education, and thus tend to earn more as adults (Case and Paxson Reference Case and Paxson2008; Ogórek Reference Ogórek2019; Schultz Reference Schultz2002). Hence, physical stature is indicative of wealth and life chances.
Average height is a relevant measure of migrant selection when large sectors of the economy rely on physical productivity of labor and earnings data are scattered or unreliable. In fact, in contexts prior to widespread mechanization, physical stature is indicative of returns to strength and earnings potential (Juif and Quiroga Reference Juif and Quiroga2019, p. 116). López-Alonso (Reference López-Alonso2007) documents that this was the case of Mexico in the early twentieth century, making physical stature the best measure to estimate selection patterns of Mexican migrants. Moreover, height is a useful measure of selection because, for adult migrants, it cannot be manipulated in anticipation of or in response to emigration (Spitzer and Zimran Reference Spitzer and Zimran2018, p. 229).
Migrant Sample: Border Crossing Records
The registration of aliens arriving at the Mexico-U.S. land border began in 1906. American authorities used different types of documents to collect information about these individuals. These documents are known as Mexican Border Crossing Records (MBCRs), and to our knowledge, are the only individual-level data available to study Mexican immigration before 1910. The sample that we use comes from the publication N° A3365, which contains two-sheet manifests reporting rich information on immigrants that crossed the border at nine entrance ports (see Figure A.1 in the Online Appendix).Footnote 14 The manifests report individual characteristics (age, sex, marital status, occupation, literacy, citizenship, and race), anthropometric data (height, complexion, and color of eyes and hair), and geographic information (birthplace, final destination, and last residence). The anthropometric data were recorded by a sworn physician and surgeon, who examined each migrant at the entrance port. In addition, the manifests provide information about the migrant’s current and previous immigration spells.
One caveat is that age, birthplace, and occupation were self-reported and therefore subject to biases. A second caveat is that the sample records only documented immigration (crossings at official entrance ports) and may present problems of selection and under-enumeration. However, unlike nowadays, Mexican migrants did not have incentives to avoid official entrance ports for the desert. Most official entrance ports were also railway terminals and the principal crossing points for migrants from regions other than border municipalities. In addition, Escamilla-Guerrero (Reference Escamilla-Guerrero2020) provides evidence suggesting that the sample is representative of Mexican immigration during the 1900s and may capture an important share of the total border crossings. The sample covers the period from July 1906 to December 1908 and consists of 9,083 Mexican immigrants.Footnote 15 Note that we exclude data from 1909 onward to only capture migrant workers and not refugees from the Mexican Revolution (1910–1920).
Comparison Samples: Military Records and Passport Applications
We use military recruitment files and passport records to compare migrants with individuals that chose to remain in Mexico. These data are the result of extensive archival work completed by López-Alonso (2015), who uses height to study secular trends of living standards in Mexico from 1850 to 1950.Footnote 16 We believe that these comparison samples capture different parts of the height (earnings) distribution of the Mexican population, allowing us to identify from which part of the distribution the migrants were drawn.
The military recruitment files consist of two samples that capture two different parts of the height distribution in Mexico. On the one hand, the federales were ordinary soldiers of the Mexican army (cavalry, infantry, and artillery), who served and retired, died in the line of duty, or deserted the military. At the time, there were minimum age, health, literacy, and stature requirements to enlist in the army. While these requirements might have introduced systematic biases to the sample, López-Alonso (2015, p. 112) shows that none of them were enforced during the period. The sample size is 7,088 males born between 1840 and 1950, who proxy for the average laborer/peasant in Mexico—that is, the lower ranks of the height (earnings) distribution. The source of these data are the archives of the Ministry of National Defense (Secretaría de la Defensa Nacional–SEDENA).
On the other hand, the rural police, known as the rurales, were a militia created in 1860 as an armed group loyal to the president. The members of this militia received a higher salary than the federales and needed to bring their own horses and weapons in the militia’s beginnings. The rurales often received additional monetary rewards and political favors to maintain stability in the country. We consider the rurales sample separately from the federales because the rurales were clearly not representative of the ordinary soldier. Since the rurales received a higher salary and extra monetary and non-monetary rewards for their service, they were above the ordinary soldiers in the socioeconomic ladder. Hence, the rurales could be considered the military elite of that time, representing the intermediate ranks of the height (earnings) distribution in Mexico (López-Alonso 2015, p. 156). The sample size is 6,820 individuals born between 1840 and 1900, and the source of these data is the National Archives, Public Administration Section (Archivo General de la Nación–AGN).
Finally, the passport records consist of all the passport applications made from 1910 to 1942, reporting the applicant’s height. We believe that this sample represents the upper ranks of the height (earnings) distribution because passport holders were individuals with the economic means to travel abroad for business, leisure, or education purposes (López-Alonso and Condey Reference López-Alonso and Condey2003). Yet, two important characteristics of these data should be noticed. First, height was self-reported by the applicant. Second, the records capture all the issued passports but not all the travel permits issued by regional offices to applicants that could not travel to Mexico City. The sample size is 6,746 male individuals born between 1860 and 1922. The source of these data are the archives of the Ministry of Foreign Affairs (Secretaría de Relaciones Exteriores–SRE).
Descriptive Statistics
To obtain the best migrant selection estimates, we implement a series of data refinements. We keep only males reporting full geographic information (region and state of birth).Footnote 17 This allows us to capture differences in selection across Mexican regions. In addition, we keep migrants that had reached their terminal height at the moment of registration: individuals between 22 and 65 years old. This avoids capturing growing and shrinkage effects (Spitzer and Zimran Reference Spitzer and Zimran2018, p. 231). To minimize capturing effects of the Mexican Revolution present in the comparison samples, we keep military and passport holders that had passed their pubertal growth spurt before the Mexican Revolution regardless of their year of registration: individuals 18 years old or older before 1911. We apply this partial refinement because keeping only those individuals registered before the conflict reduces the size of the samples significantly. Therefore, our estimates may capture some effects of the conflict, such as time-varying sample selection.
In Figure 1, we plot kernel density estimates of height for each sample. Visual inspection suggests that all samples follow an approximate normal distribution and do not suffer from truncation. Table 1 presents the main characteristics of the final samples. On average, migrants were 168 cm tall, 3.6 cm taller than ordinary soldiers, 1.4 cm taller than military elite, and 2.1 cm shorter than passport holders.Footnote 18 Recall that a lower average height indicates that a group faced worse conditions of health care, nutrition, disease environment, and work assignments some 10 to 50 years before being observed (Schneider and Ogasawara Reference Schneider and Ogasawara2018, p. 64).Footnote 19 Hence, differences in height between samples confirm that the ordinary soldiers belonged to the lowest social strata, whereas the migrants and the military elite belonged to Mexico’s intermediate social strata. These height differentials, however, may be a product of the geography of emigration in Mexico. The distribution of the migrant sample reveals that indeed migrants came mostly from the North and Bajio (see Online Appendix Figure A.1).Footnote 20 In Online Appendix Table A.1, we present mean heights for each sample by region. The height gap between migrants and ordinary soldiers almost doubles in the Center and South relative to the North. This preliminary evidence suggests that the degree of selection on height varied substantially across regions. Interestingly, based on the amount of cash held at the crossing, migrants from the Center were considerably richer than the rest. They reported having 20 dollars, two times the amount held by migrants from the North. Bajio migrants had only one dollar in hand when crossing the border, suggesting that they were the poorest, as argued by previous literature (Durand Reference Durand2016; Verduzco Reference Verduzco1995).

Figure 1 KERNEL DENSITY ESTIMATES OF HEIGHT
Notes: The samples approximate normal distributions. The military data are not truncated, confirming that the 160 cm minimum-height requirement to join the army was not enforced.
Sources: Migrant sample from Mexican Border Crossing Records–Microfilm publication N° A3365. Military and Passport samples from López-Alonso (2015).
Table 1 SUMMARY STATISTICS

Notes: We classify the regions of birth and occupations following López-Alonso (2015, pp. 127, 128). We limit the sample to men because the military data do not report geographic information for women. We consider individuals that had reached their terminal height at the moment of registration: individuals between 22 and 65 years old. Seasonal migrants are those individuals who migrated during the planting (February–April) and harvest (August–October) seasons of the crops (cotton, grapes, lettuce, sugar beet, and other vegetables and fruits) in which Mexicans were usually employed (Cardoso Reference Cardoso1980; Clark Reference Clark1908).
Sources: Mexican Border Crossing Records, Microfilm publication N° A3365. Military and Passport samples from López-Alonso (2015).
Table 1 also shows that migrants were mostly unskilled workers and were less likely to be literate than the military or passport holders. This suggests that Mexican migrants may have moved to the United States to work in activities where brawn, relative to brain, had a greater value—that is, jobs with high returns to physical productivity. Clark (Reference Clark1908, pp. 477, 486) documents that outside agriculture, Mexican migrant workers were usually employed in activities related to railway track maintenance, or as drillers, wood choppers, coke pullers, and surface men in the mines: occupations requiring physical strength. In terms of marital status, about 59 percent of the migrants reported being married. Historical literature, however, agrees that male migrants did not move with their families but alone (Durand Reference Durand2016; González Reference González2010), and therefore a significant share of the flow may have consisted of seasonal (temporary) migrants (Gratton and Merchant 2015; Kosack and Ward Reference Kosack and Ward2014). In fact, Cardoso (Reference Cardoso1980) and Clark (Reference Clark1908) document that border crossings were more intense during the planting (February–April) and harvest (August–October) seasons of cotton, grapes, lettuce, sugar beets, and other vegetables and fruits, as seasonal agricultural migrants were mostly employed in these crops. To examine the relevance of seasonal migration, we classify individuals into seasonal and non-seasonal migrants depending on their crossing date. The micro data support the argument that seasonal migration was significant, with one in two migrants crossing the border during the planting or harvest seasons.
Regarding the comparison samples, the distribution across occupational skill classes reflects that the ordinary soldiers (federales) and military elite (rurales) capture different parts of Mexico’s skill distribution, with the former being more likely to be unskilled. The micro data also support the argument that passport holders belonged to the upper social class, as all were literate and most of them self-reported as professional workers. In addition, the passport samples concentrate in the Center, implying that most passport holders may have lived in Mexico City or nearby states, where the Mexican upper social strata resided at the time. Next, we estimate the selection of Mexican immigration and assess the impact of the Panic of 1907 on selection patterns.
EMPIRICAL STRATEGY
To estimate the selectivity of Mexican immigration, we pool the migrant sample with each of the comparison samples separately and estimate the following equation:
 $${y_i} = \alpha + \beta \cdot mi{g_i} + {\bf{X}}_i^{'} \cdot {\bf{B}} + {\varepsilon _i},$$
where
 ${y_i}$
is the height of individual i. The variable
${y_i}$
is the height of individual i. The variable
 $mi{g_i}$
is an indicator equal to 1 for individuals belonging to the migrant sample. The coefficient of interest,
$mi{g_i}$
is an indicator equal to 1 for individuals belonging to the migrant sample. The coefficient of interest,
 $\beta $
, captures the average difference in height between migrants and each comparison sample (federales, rurales, or passport holders), conditional on a vector of individual characteristics,
$\beta $
, captures the average difference in height between migrants and each comparison sample (federales, rurales, or passport holders), conditional on a vector of individual characteristics,
 ${\bf{X}}_i^{'}$
, that control for birth-cohort (year of birth), region of birth (North, Bajio, Center, or South), and occupational skill class (unskilled, skilled, or professional). The birth cohort dummies control for year-specific shocks affecting population height. Examples of these events are droughts or wars affecting the living standards of all individuals born during the time period of the event. The dummies for region of birth control for environmental factors that vary across regions and influence height, such as food availability or endemic diseases. The dummies for skill class factor out composition effects resulting from skill-based selection mechanisms that may be present in our comparison samples; for example, military recruitment patterns favoring the enlistment of unskilled over skilled individuals to minimize desertion. Standard errors in all regressions are clustered at the birth-cohort level.
${\bf{X}}_i^{'}$
, that control for birth-cohort (year of birth), region of birth (North, Bajio, Center, or South), and occupational skill class (unskilled, skilled, or professional). The birth cohort dummies control for year-specific shocks affecting population height. Examples of these events are droughts or wars affecting the living standards of all individuals born during the time period of the event. The dummies for region of birth control for environmental factors that vary across regions and influence height, such as food availability or endemic diseases. The dummies for skill class factor out composition effects resulting from skill-based selection mechanisms that may be present in our comparison samples; for example, military recruitment patterns favoring the enlistment of unskilled over skilled individuals to minimize desertion. Standard errors in all regressions are clustered at the birth-cohort level.
The estimated coefficient
 $\beta $
, however, reflects average selection estimates for the period October 1906–December 1908. As mentioned previously, from August 1907 to January 1908, the U.S. economy was severely affected by the Panic of 1907.Footnote
21
To estimate changes in selection into migration as a consequence of the crisis, we estimate the following model:
$\beta $
, however, reflects average selection estimates for the period October 1906–December 1908. As mentioned previously, from August 1907 to January 1908, the U.S. economy was severely affected by the Panic of 1907.Footnote
21
To estimate changes in selection into migration as a consequence of the crisis, we estimate the following model:
 $${y_{it}} = \alpha + \gamma \,{{\cdot}}\,mig{_i} + {\text{X}_i^{'}}\,{{\cdot}}\,\Gamma + \mathop \sum \limits_k {\lambda _k}\,{{\cdot}}\,mi{g_i}\,{{\cdot}}\,I_t^k + \mathop \sum \limits_k {\text X_i^{'}}\,{{\cdot}}\,I_t^k\,{{\cdot}}\,{\Lambda _k} + {\varepsilon _{it}},$$
where t indexes time and . The time-period dummies,
 $I_t^k$
, indicate whether an immigrant crossed the border during or after the crisis, respectively. Note that the comparison samples cannot be classified into these time periods, and thus the time-period indicators vary only across migrants. We also include a full set of interactions of control variables with time-period dummies. This allows the effect of each control variable to vary flexibly across time periods. The estimated coefficients
$I_t^k$
, indicate whether an immigrant crossed the border during or after the crisis, respectively. Note that the comparison samples cannot be classified into these time periods, and thus the time-period indicators vary only across migrants. We also include a full set of interactions of control variables with time-period dummies. This allows the effect of each control variable to vary flexibly across time periods. The estimated coefficients
 ${\lambda _k}$
capture the average difference in height for individuals that crossed the border during the Panic (August 1907–January 1908) or after the Panic (February 1908–December 1908) relative to those who migrated before the Panic (October 1906–July 1907). The estimated coefficient γ reflects the average height gap between pre-Panic migrants and each comparison sample. Holding everything else equal, the estimated selection pattern during the Panic of 1907,
${\lambda _k}$
capture the average difference in height for individuals that crossed the border during the Panic (August 1907–January 1908) or after the Panic (February 1908–December 1908) relative to those who migrated before the Panic (October 1906–July 1907). The estimated coefficient γ reflects the average height gap between pre-Panic migrants and each comparison sample. Holding everything else equal, the estimated selection pattern during the Panic of 1907,
 $k = Panic$
, is
$k = Panic$
, is
 $\gamma + {\lambda _k}$
. One caveat to our empirical approach is that the dummies for region of birth and skill class exert a constant effect on height across cohorts. As we observe migrants and non-migrants born over a long period (from 1840 to 1893), it is conceivable that the effects of these control variables vary across cohorts. To address this concern, we also estimate Equation (1) and Equation (2) including birth-region-by-cohort and skill-class-by-cohort fixed effects.
$\gamma + {\lambda _k}$
. One caveat to our empirical approach is that the dummies for region of birth and skill class exert a constant effect on height across cohorts. As we observe migrants and non-migrants born over a long period (from 1840 to 1893), it is conceivable that the effects of these control variables vary across cohorts. To address this concern, we also estimate Equation (1) and Equation (2) including birth-region-by-cohort and skill-class-by-cohort fixed effects.
Self-Selection of Mexican Migrants
Table 2 presents our migrant selection estimates.Footnote 22 Birth cohort (year of birth) is a control variable in all models. Differences between the estimates in Columns (1) and (2) confirm that environmental factors at the region level explain about 34–66 percent of the height gap between migrants and stayers. On average, migrants were relatively tall: 2.1 cm taller than the federales and 0.5 cm taller than the rurales. Relative to the passport holders, however, migrants were 3.1 cm shorter. Given that taller individuals tend to earn more, the results allow us to infer that earnings of migrants were higher than those of ordinary soldiers and very similar to the earnings of the military elite. Therefore, it is unlikely that the first Mexican migrants were negatively self-selected, but rather drawn primarily from the intermediate or upper ranks of the earnings distribution in Mexico—that is, Mexican immigration in the early twentieth century was characterized by an intermediate or positive selection. Moreover, as physical stature is correlated with unobserved productive skills, our results suggest that migrants may have had even higher human capital accumulation (Bodenhorn, Guinnane, and Mroz Reference Bodenhorn, Guinnane and Mroz2017, p. 201). This finding is consistent with the results of Kosack and Ward (Reference Kosack and Ward2014), who show that Mexican migrants were positively selected on height in 1920. Our results are also in line with literature arguing that contemporary Mexican migrants are drawn from the upper ranks of the educational or skill distribution (Chiquiar and Hanson Reference Chiquiar and Hanson2005; Orrenius and Zavodny Reference Orrenius and Zavodny2005).
Table 2 SELF-SELECTION OF MEXICAN MIGRANTS, 1906–1908 DEPENDENT VARIABLE: HEIGHT (CENTIMETERS)

* = Significant at the 10 percent level.
** = Significant at the 5 percent level.
*** = Significant at the 1 percent level.
Notes: Mexican migrants were 2.3 cm taller than the ordinary soldiers (federales), 0.6 cm taller than the military elite (rurales), and 2.7 cm shorter than Mexico’s upper social class (passport holders). Therefore, Mexican immigration in the early twentieth century was characterized by an intermediate or positive selection on height. Robust standard errors, clustered by birth cohort, in parenthesis.
Sources: Mexican Border Crossing Records, Microfilm publication N° A3365 and López-Alonso (2015).
One caveat to this finding is that our military and passport samples may be selected. For example, the federales were not conscripts but volunteers, and it is expected that in a growing economy like Mexico at the time, the opportunity cost of enlisting increases for productive and tall individuals (Bodenhorn, Guinnane, and Mroz Reference Bodenhorn, Guinnane and Mroz2017, p. 173). Hence, the federales sample may capture the shortest individuals within the lower ranks of the height distribution. This would lead to imprecise migrant selection estimates resulting from comparisons with extreme values of the distribution. However, if our comparison samples had major selection problems, we would expect to obtain conflicting migrant selection estimates across specifications: a negative selection relative to the lower social strata (ordinary soldiers) and a positive selection relative to the upper social strata (passport holders). Table 2 shows that our estimates are consistent across panels, suggesting that sample selection bias in our comparison groups should be minimum, if any. Previous literature, however, documents that non-pecuniary factors such as patriotism or recruitment patterns can influence the social class composition of volunteers enlisting in the military (Komlos and A’Hearn 2019, p. 1145). Considering that occupations are correlated with social class, we estimate migrant selection conditional on occupational skill class to account for selection mechanisms that may be present in our comparison samples. Results in Column (3) (Panels A and B) show no differences in migrant selection when controlling for skill class, suggesting that the skill composition of both military samples are not driving our results. However, controlling for skill class reduces by 32 percent the difference in height between migrants and passport holders (Panel C). This finding shows that comparing like with like—individuals born in the same year and region and with similar cognitive abilities (skills)—is advisable when the comparison groups may suffer from ambiguous sample selection bias. Column (4) presents the results of our flexible approach, which allows the effects of the aforementioned control variables to vary arbitrarily across birth cohorts. The height differences relative to the military samples are very similar to our previous results in terms of magnitude and significance, confirming the intermediate/positive selection of Mexican migrants. However, the height gap between migrants and passport holders increases by 27 percent. This adjustment suggests that the effects of factors influencing height, such as place of birth, are unlikely to remain constant over long periods of time.
Did the degree of selection vary across regions? To answer this question, we estimate Equation (2) separately for each region. We only present results for the North and Bajio, as 98 percent of the migrants in our sample came from these regions. Columns (5)–(6) of Table 2 show that the degree of positive selection relative to the ordinary soldiers was greater in the Bajio (see Panel A). This is explained by the combination of two factors. First, wages in the Bajio were considerably lower than elsewhere in Mexico (Rosenzweig Reference Rosenzweig1965, p. 450; Campos-Vázquez and Vélez-Grajales Reference Campos-Vázquez and Vélez-Grajales2012, p. 613). Second, Bajio migrants faced higher transportation costs. The average distance by train from Bajio municipalities to the border was 580 km, three times as much as from source municipalities in the North.Footnote 23 Hence, the poor and short population of the Bajio—for whom upfront monetary costs were higher and credit constraints likely binding—were disproportionately priced out of migration. We do not find statistically significant differences in height between migrants and elite soldiers. The point estimates, however, suggest that migrants were slightly taller than the military elite, with height gaps being very similar in both regions (see Panel B). Our results also show that the average height gap between migrants and passport holders was larger in the Bajio (see Panel C). The regional differences in the degree of migrant selection relative to ordinary soldiers and passport holders reveal that Bajio migrants came from a narrower range of stature values (earnings levels) than their Northern counterparts. The variation in the degree of migrant selection, however, does not change our main finding: migrants were mostly drawn from the intermediate/upper ranks of the height (earnings) distribution.
The Effect of the Panic of 1907
In Table 3, we show the effect of the 1907 Panic on migrant selection. Individuals that migrated during the crisis were 1.3–1.8 cm shorter than their pre-Panic counterparts. The estimated coefficients for the post-Panic period are small and not statistically significant, meaning that pre-Panic and post-Panic migrants had a similar stature. Column (1) reveals that before the Panic, migrants were positively selected on height relative to the average ordinary soldier (2.4 cm taller). This pattern changed during the Panic, when migrants became considerably less positively selected (0.5 cm taller), but returned to pre-crisis levels afterward. Column (2) shows that this finding holds when we allow the effects of the control variables to vary arbitrarily across cohorts. We observe the same “U” pattern relative to the rurales and passports samples. These results suggest that in the beginnings of the twentieth century, when migrants could cross the border without restrictions, the composition of Mexican immigration adjusted very quickly to short-run changes in the U.S. business conditions.
Table 3 IMPACT OF THE PANIC OF 1907 ON SELF-SELECTION PATTERNS DEPENDENT VARIABLE: HEIGHT (CENTIMETERS)

* = Significant at the 10 percent level.
** = Significant at the 5 percent level.
*** = Significant at the 1 percent level.
Notes: The Panic of 1907 changed significantly migrant selection. Immigrants became less positively selected during the crisis. Robust standard errors, clustered by birth cohort, in parenthesis. Interactions in the control variables denote full sets of interactions.
Sources: Mexican Border Crossing Records, Microfilm publication N° A3365 and López-Alonso (2015).
In Figure 2, we plot the adjusted mean height of migrants by month for the period under analysis (October 1906–December 1908).Footnote 24 Shifts in our measure of selection follow closely the development of the crisis. In March 1907, the first strong drop in stock prices occurred. In the following months, the speculation and uncertainty continued, and by May 1907, the U.S. economy had fallen into a short but severe recession (Odell and Weidenmier Reference Odell and Weidenmier2004, p. 1003). Similarly, we observe a decline in the adjusted height from March, with a substantial fall happening after May 1907. In August 1907, the Secretary of the Treasury announced the deposit of 28 million dollars to banks across the United States to relieve the expected stringency in the money supply and bring back confidence to the financial system (Markham Reference Markham2002, p. 31). This measure only delayed the financial crash of October, but along with substitutes for legal currency and the creation of “legal holidays” prevented even more bankruptcies during the Panic period (Andrew Reference Andrew1908, p. 516). Following the narrative of these events, the adjusted height increases slightly after August and falls later on. Finally, the adjusted height increases significantly after January 1908, when the payments to depositors of commercial banks were fully restored, but moderates over the year, returning to pre-Panic levels by July 1908.

Figure 2 MIGRANT SELF-SELECTION AND THE PANIC OF 1907
Notes: May-07: By May 1907, the United States had fallen into a short but severe recession. Aug-07: In August 1907, the Secretary of the Treasury announced the deposit of 28 million dollars to banks across the United States for relieving the expected stringency in money supply and bring back confidence to the financial system. Sep-07: From September to December 1907, a severe liquidity crisis developed and payments to depositors of commercial banks were suspended. Jan-08: In January 1908, payments to depositors were fully restored. To estimate the adjusted values, we regress individual height on a full set of fixed effects that control for municipality of birth, year of birth, month of crossing, and entrance port. We cluster standard errors at the year-by-month level. The military elite represents the intermediate ranks of the height distribution in Mexico.
Source: Mexican Border Crossing Records, Microfilm publication N° A3365.
We also indicate in Figure 2 the planting (February–April) and harvest (August–October) seasons of the crops in which Mexican migrants were usually employed. It is conceivable that the influx of seasonal agricultural migrants could have influenced the observed shifts in height if they were drawn from specific ranks of the height (earnings) distribution. Figure 2 shows, for example, that migrants were shorter during the harvest months, during which the financial crash also developed. To investigate this hypothesis, we estimate differences in height between seasonal and non-seasonal migrants conditional on our baseline set of control variables. Table 4 shows that the average difference in height between these two migrant groups was small and not statistically significant (see Column (1)). When decomposing this estimate by season, we find that planting- and harvesting-season migrants had different height profiles, with the former being taller (1.3 cm) and the latter being shorter (0.5 cm) than their non-seasonal counterparts (see Column (2)). We obtain similar results when performing the analysis at the region level (see Columns (3)–(6)).Footnote 25 Hence, seasonal migration could have magnified the fall in mean height observed during the crisis.
Table 4 HEIGHT DIFFERENCES BETWEEN SEASONAL AND NON-SEASONAL MIGRANTS DEPENDENT VARIABLE: HEIGHT (CENTIMETERS)

* = Significant at the 10 percent level.
** = Significant at the 5 percent level.
*** = Significant at the 1 percent level.
Notes: The omitted category is non-seasonal migrants. All models include a full set of interactions of control variables with birth cohort dummies. The control variables include region of birth and occupational skill class. Robust standard errors, clustered by the birth-cohort, in parenthesis.
Sources: Mexican Border Crossing Records–Microfilm publication N° A3365 and López-Alonso (2015).
To address this concern, we also estimate Equation (2) controlling for seasonal migration. Table 3 shows that our previous results do not suffer major changes, suggesting that the shift toward negative selection during the Panic period was unlikely to be driven by seasonal migration. Note that the estimated coefficients for the post-Panic period remain statistically insignificant across specifications, suggesting that the crisis did not have a permanent effect on the selection of Mexican immigration. This could also be interpreted as the crisis delaying migration rather than changing the composition of the flow. However, other factors could have contributed to the degree of selection returning to levels similar to those observed before the crisis.
LABOR RECRUITING
We next focus on factors that could have adjusted migrant self-selection by affecting the structure of migration costs during the Panic. In particular, we study the enganche, an institutionalized labor recruiting system used to allocate Mexican migrant workers in the United States during the early twentieth century. Labor recruiting systems are characterized by reducing transportation and job-search costs for intending migrants (Abella Reference Abella, Douglas and Edward Taylor2004; Eelens and Speckmann Reference Eelens and Speckmann1990); therefore, they can shape the scale and skill composition of immigration, especially in contexts where migration costs are high and migrant networks providing assistance and information are not yet established.
To see how labor recruiting can shape migrant selection, consider the model of Chiquiar and Hanson (Reference Chiquiar and Hanson2005), where migration costs are large and decrease with skills.Footnote 26 In this framework, the effect of labor recruitment on migrant selection depends on the scale and nature of recruitment. Note that the skill composition of immigration may not change if recruiting is practiced at a low scale. However, if labor recruiting accounts for a significant share of immigration, the effect toward a positive or negative selection depends on how intending migrants are recruited. On the one hand, intending migrants can be randomly recruited. The effect of random recruiting is to decrease migration costs at all skill levels. As a result, migration incentives increase at both ends of the skill distribution, in other words, more unskilled and skilled people are willing to migrate (see Panel A of Figure A.5 in the Online Appendix). On the other hand, intending migrants can be sorted and recruited based on skills. The effect of assortative recruiting is to decrease migration costs only at some skill levels. In this case, migration incentives increase for individuals with the skill profile preferred by the employer (see Panel B of Figure A.5 in the Online Appendix).
Employers can also adjust the pattern and scale of recruiting to deal with changes in business conditions. For example, recruiting can be scaled down in response to shocks such as the Panic of 1907, which are likely to negatively affect the demand for migrant workers. During health crises or wartime, however, the need for migrant workers with specific qualifications can increase (Clemens, Lewis, and Postel Reference Clemens, Lewis and Postel2018; Fernández-Reino, Sumption, and Vargas-Silva Reference Fernández-Reino, Sumption and Vargas-Silva2020; San Reference San2022). In this case, both the pattern and scale of recruiting can be adjusted to satisfy the labor demand in particular sectors. Labor recruiting systems can thus serve as an adjustment channel for migrant selection during periods of economic depression or expansion.
The Enganche
During the nineteenth century, Mexico was characterized by regional labor supply mismatches. The enganche, a system for recruiting and transporting workers to remote locations or with labor shortages, was institutionalized to regulate labor markets (Durand Reference Durand2016, pp. 50–1). Recruiters “hooked” workers by offering wages in advance in exchange for future labor service, creating a relationship of indebtedness that kept workers at the destination until the debt was cleared (Brass Reference Brass1990, p. 74). At the turn of the twentieth century, U.S. companies and labor contractors adopted the enganche to satisfy the increasing demand for workers in the American Southwest and other regions. The internationalization of this labor recruiting system was possible due to the expansion of the Mexican railway network and its connection to the U.S. rail lines from 1884. Contractors used railways for traveling south into Mexico and transporting recruited migrant workers north to the United States (Woodruff and Zenteno Reference Woodruff and Zenteno2007, p. 512). The recruitment of workers, however, was not confined to places with railway access. Clark (Reference Clark1908, p. 475) documents that intending migrants also arrived at border towns, where they met representatives of U.S. companies and labor contractors. The recruited workers then crossed the border and received transportation to the destination and a subsistence allowance, both discounted from their future wages (Clark Reference Clark1908; Durand Reference Durand2016; Gamio Reference Gamio1930). We will later show that intending migrants were not recruited randomly but from the upper half of Mexico’s height distribution. Therefore, the enganche can be understood as a persistent labor institution that reduced transportation and job-search costs for intending migrants with above-average earnings potential.
Identification of Enganche Migrants
Our data do not directly identify migrants that used the enganche to cross the border. Hence, we design a methodology to identify enganche migrants based on the characteristics of this labor recruiting system. The enganche profitability depended on two main factors: the number of workers recruited and the associated transportation costs. Previous literature suggests that recruiters commonly transported between 30 and 400 workers depending on the nature of the jobs and season of the year (Clark Reference Clark1908, pp. 470, 476; Durand Reference Durand2016, pp. 56, 63). We validated this information with 20 enganche advertisements published in Mexican and American newspapers from 1902 to 1909. The number of vacancies advertised ranges from 50 to 600, suggesting that the minimum number of workers that made the enganche profitable ranged between 30 to 50.
To identify enganche migrants, we first collapse the migrant sample by source (Mexican municipality), destination (American county), crossing date (month and year), and entrance port. Note that each source-destination-port-date combination represents a group/flow of migrants who reported the same source-destination pair and were registered at the same entrance port during the same month. We then standardize the size of each flow using the mean and standard deviation of the migration corridor (source-destination-port combination) to which they belong. Finally, we consider enganche migrants those individuals belonging to a flow of at least 30 migrants whose size falls at least one standard deviation above the mean size of the flows belonging to the same migration corridor. This methodology allows us to identify unusually, large groups of migrants who were likely moving together, which proxies for enganche migrants. We present a formal expression of this methodology in the Online Appendix. Figure 3 displays the municipalities that our methodology identifies as the source of enganche migrants. All the localities have direct access to railways, which was necessary for transporting the recruited migrant workers. The spatial distribution of the enganche also supports the argument that this labor recruiting system was practiced at border towns and in the central plateau of Mexico, where salaries were relatively low and labor-market pressures were high. One caveat to our methodology is that it may confound enganche migrants with seasonal immigration. To attenuate this concern, we explicitly control for seasonal immigration to disentangle the effect of the enganche on selection patterns.

Figure 3 SPATIAL DISTRIBUTION OF THE ENGANCHE (1906–08)
Notes: The polygons display the municipalities with presence of the enganche, a system of labor recruiting that reduced migration costs. Recruiters or enganchadores covered the transportation costs of the migrant in exchange of future labor service.
Source: Mexican Border Crossing Records, Microfilm publication N° A3365.
The Enganche Effect
Our methodology for identifying flows of recruited migrant workers reveals that the Panic of 1907 significantly affected the scale of labor recruiting. Online Appendix Table A.2 shows that before the Panic, about one in three migrants used the enganche to cross the U.S. border. This share falls to only 1 percent during the Panic, suggesting that the crisis severely affected labor recruiting. After the Panic, the recruiting of migrant workers resumed, with 13 percent of migrants using the enganche system (see Panel A). Although labor recruiting did not return to pre-Panic levels in either region, the share of enganche migrants had a greater recovery in the North—both in absolute and relative terms—than in the Bajio (see Panels B and C).
To identify additional changes in labor recruiting, we plot in Figure 4 the density of enganche and non-enganche immigration by month and source region. Before the crisis, enganche immigration followed seasonal patterns, with flows from both regions increasing during the planting season (February–April). We also observe large flows of enganche migrants in other periods, which may indicate that the enganches were used to satisfy labor demand in sectors other than agriculture. The density of enganche immigration from both regions falls just before the Panic, and it does not increase until after the crisis. Interestingly, we observe very few enganche flows from the North during the 1908 planting season, suggesting that the enganche operated primarily in the Bajio during the months following the Panic. Note that the density of non-enganche immigration from the North remains relatively constant across months. Non-enganche immigration from the Bajio, in contrast, increases just before the 1907 harvest season and remains constant from the onset of the crisis. Overall, the recruitment of migrant workers was dramatically curtailed during the Panic of 1907, and its scale and geographic composition changed after the crisis. If migrant workers were recruited from specific ranks of the height distribution, these changes could explain the observed shifts in the selection of Mexican immigration.
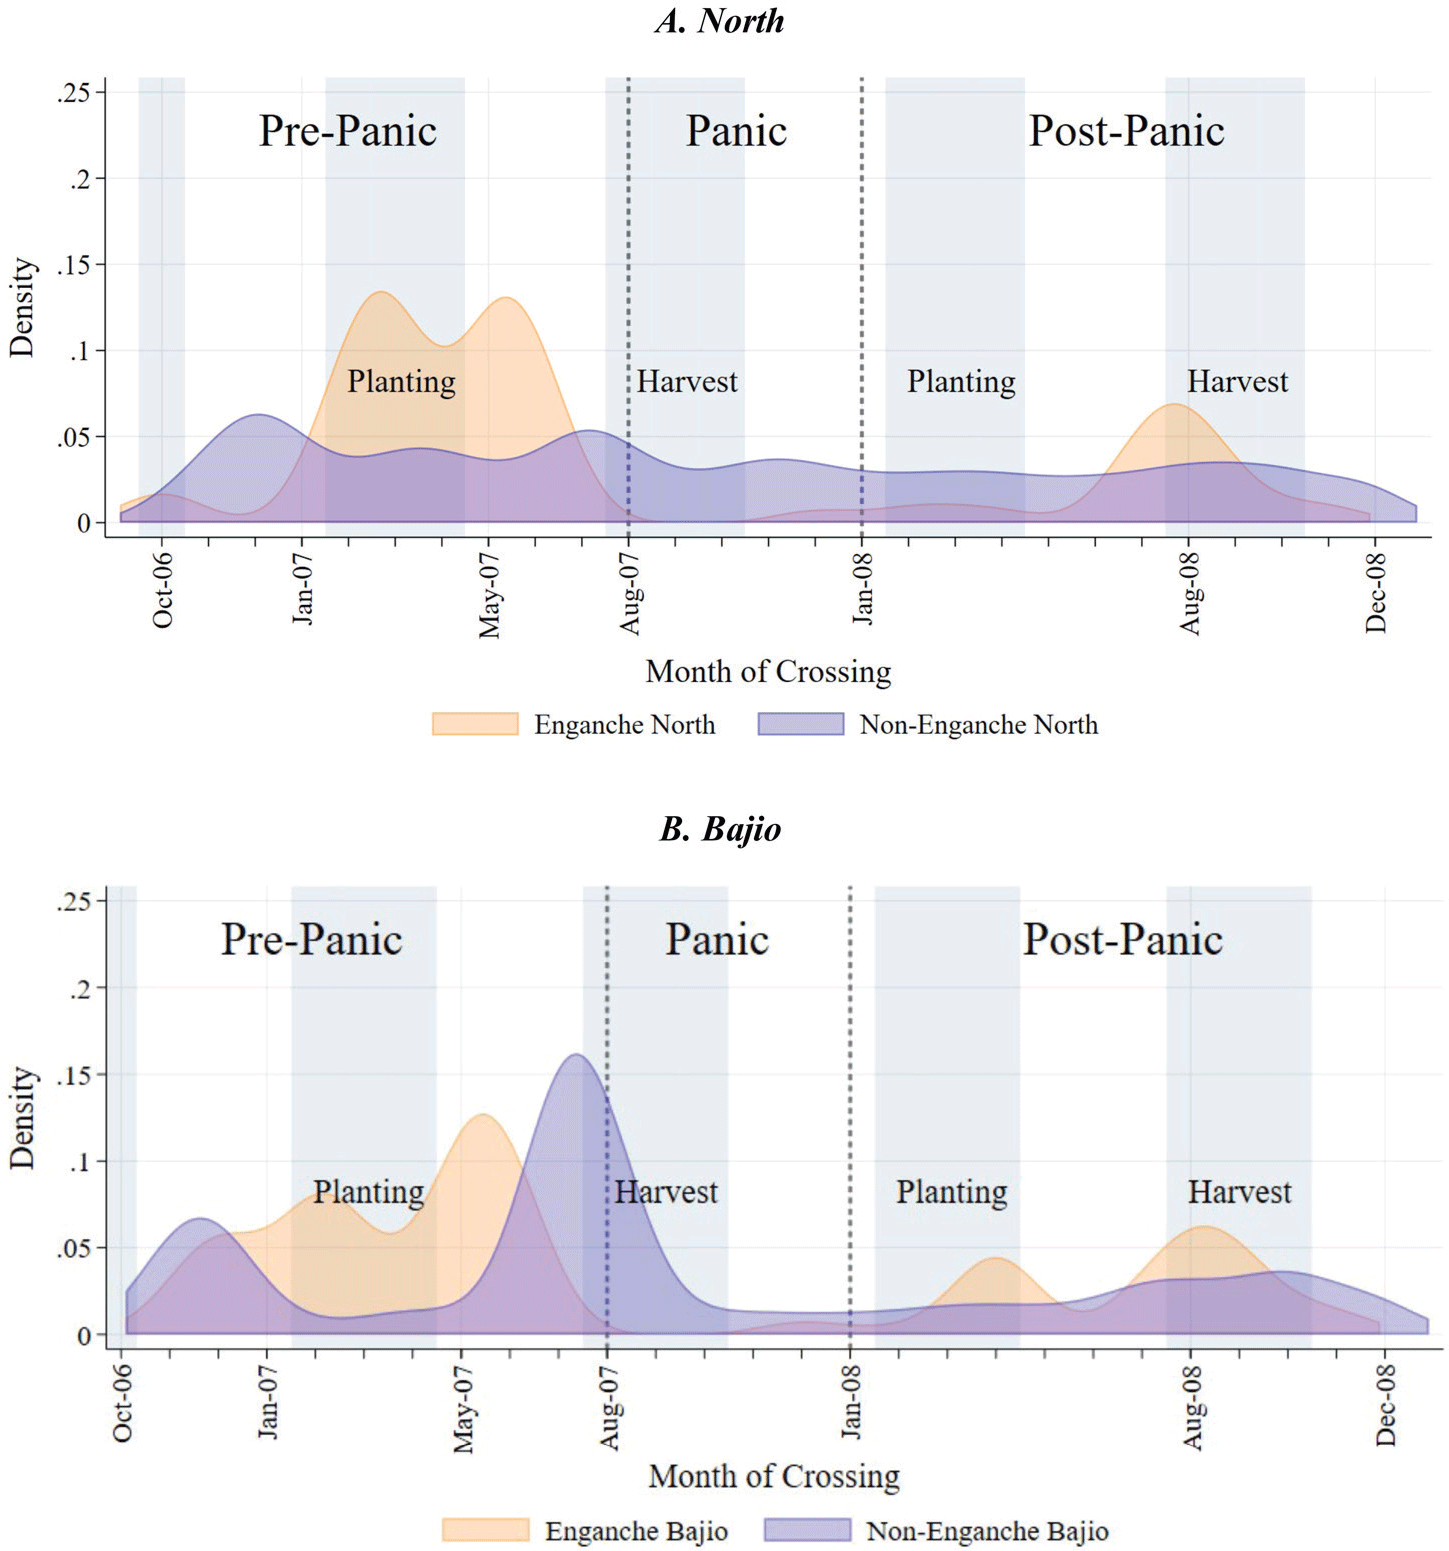
Figure 4 DISTRIBUTION OF THE MIGRANT SAMPLE, 1906–1908
Notes: The figure shows kernel density estimates of the migrant sample by source region. Previous literature documents that Mexican immigration was more intense during the planting (February–April) and harvest (August–October) seasons. The density of enganche immigration (recruited migrant workers) increases during these periods. The evidence also suggests that the enganche operated throughout the year before the Panic of 1907, suggesting that labor recruiting could have also been practiced in sectors other than agriculture. The Panic of 1907 “broke” the existing seasonal immigration patterns and neither the enganche nor the non-enganche immigration returned to their pre-Panic levels during 1908.
Source: Mexican Border Crossing Records, Microfilm publication N° A3365.
To disentangle the effect of the enganche system on migrant selection, we start by examining whether it was characterized by random or selective recruiting. We expand Equation (1) as follows:
 $${y_i} = \alpha + \beta \cdot mi{g_i} + \delta \cdot en{g_i} + {\bf X}_i^{'} \cdot {\bf {B}} + {\varepsilon _i},$$
where
 $en{g_i}$
is a dummy variable that takes the value of 1 if the migrant crossed the border using the enganche system and zero otherwise. The estimated coefficient
$en{g_i}$
is a dummy variable that takes the value of 1 if the migrant crossed the border using the enganche system and zero otherwise. The estimated coefficient
 $\delta $
captures the difference in height between enganche and non-enganche migrants. Column (1) of Table 5 shows that American recruiters chose the tallest laborers among those willing to migrate. On average, enganche migrants were 0.7 cm taller than migrants that crossed the U.S. border without using labor recruitment. The estimated coefficient
$\delta $
captures the difference in height between enganche and non-enganche migrants. Column (1) of Table 5 shows that American recruiters chose the tallest laborers among those willing to migrate. On average, enganche migrants were 0.7 cm taller than migrants that crossed the U.S. border without using labor recruitment. The estimated coefficient
 $\beta $
captures the difference in height between non-enganche migrants and each comparison sample. The
$\beta $
captures the difference in height between non-enganche migrants and each comparison sample. The
 $\beta $
coefficient reported in Column (1) is not statistically significant. However, the point estimate suggests that non-enganche migrants may have been about 0.4 cm taller than the military elite (intermediate selection). This implies that enganche migrants were clearly positively self-selected, as they may have been 0.7–1.1 cm taller than the military elite
$\beta $
coefficient reported in Column (1) is not statistically significant. However, the point estimate suggests that non-enganche migrants may have been about 0.4 cm taller than the military elite (intermediate selection). This implies that enganche migrants were clearly positively self-selected, as they may have been 0.7–1.1 cm taller than the military elite
 $\left( {\beta + \delta } \right)$
. Hence, the evidence suggests that, on average, American companies and labor contractors may have practiced positive assortative recruiting. Did the degree of assortative recruiting vary? In Figure 5, we plot monthly adjusted heights of enganche and non-enganche migrants. It is not clear that positive assortative recruiting was consistently practiced across months. However, recruited migrants were always at least as tall as their non-recruited counterparts, and in some planting and harvest months, recruited migrant workers were notably taller. This initial evidence suggests that the enganche pushed toward a positive selection through large-scale, positive assortative recruiting.
$\left( {\beta + \delta } \right)$
. Hence, the evidence suggests that, on average, American companies and labor contractors may have practiced positive assortative recruiting. Did the degree of assortative recruiting vary? In Figure 5, we plot monthly adjusted heights of enganche and non-enganche migrants. It is not clear that positive assortative recruiting was consistently practiced across months. However, recruited migrants were always at least as tall as their non-recruited counterparts, and in some planting and harvest months, recruited migrant workers were notably taller. This initial evidence suggests that the enganche pushed toward a positive selection through large-scale, positive assortative recruiting.

Figure 5 ADJUSTED HEIGHT OF ENGANCHE AND NON-ENGANCHE MIGRANTS, 1906–1908
Notes: We estimate the adjusted values regressing individual height on state-of-birth, year-of-birth, year-month of crossing, and entrance-port fixed effects. We cluster standard errors at the year-month level.
Source: Mexican Border Crossing Records, Microfilm publication N° A3365.
Table 5 IMPACT OF THE ENGANCHE ON MIGRANT SELECTION PATTERNS. DEPENDENT VARIABLE: HEIGHT (CENTIMETERS)

* = Significant at the 10 percent level.
** = Significant at the 5 percent level.
*** = Significant at the 1 percent level.
Notes: Robust standard errors, clustered by birth cohort, in parenthesis. Interactions in the control variables denote full sets of interactions.
Sources: Mexican Border Crossing Records–Microfilm publication N° A3365 and López-Alonso (2015).
The Enganche and the Panic of 1907
To examine the effect of the enganche on selection patterns across periods, we expand Equation (2) as follows:
 $$\begin{gathered}{y_{it}} = \alpha + \gamma \cdot mi{g_i} + \pi \cdot en{g_i} + {\bf X}_i^{'}\cdot{\bf \Gamma} + \mathop \sum \limits_k {\lambda _k}\cdot mi{g_i}\cdot I_t^k \\
+ \mathop \sum \limits_k {\phi _k}\cdot en{g_i}\cdot I_t^k + \mathop \sum \limits_k {\bf X}_i^{'}\cdot I_t^k\cdot{\Lambda _k} + {\varepsilon _{it}}, \\ \end{gathered}$$
$$\begin{gathered}{y_{it}} = \alpha + \gamma \cdot mi{g_i} + \pi \cdot en{g_i} + {\bf X}_i^{'}\cdot{\bf \Gamma} + \mathop \sum \limits_k {\lambda _k}\cdot mi{g_i}\cdot I_t^k \\
+ \mathop \sum \limits_k {\phi _k}\cdot en{g_i}\cdot I_t^k + \mathop \sum \limits_k {\bf X}_i^{'}\cdot I_t^k\cdot{\Lambda _k} + {\varepsilon _{it}}, \\ \end{gathered}$$
where
 $I_t^k$
is the same time-period dummies defined before. The estimated coefficients
$I_t^k$
is the same time-period dummies defined before. The estimated coefficients
 $\gamma $
and
$\gamma $
and
 ${\lambda _k}$
capture height differences between non-enganche migrants and each comparison sample, while the estimated coefficients
${\lambda _k}$
capture height differences between non-enganche migrants and each comparison sample, while the estimated coefficients
 $\pi $
and
$\pi $
and
 ${\phi _k}{\rm{\;}}$
capture height differences between enganche migrants and their non-enganche peers. Holding everything else equal, when
${\phi _k}{\rm{\;}}$
capture height differences between enganche migrants and their non-enganche peers. Holding everything else equal, when
 $k = Panic$
,
$k = Panic$
,
 $\left( {\pi + {\phi _k}} \right) + \left( {\gamma + {\lambda _k}} \right)$
will reflect the selection of enganche migrants during the Panic period.
$\left( {\pi + {\phi _k}} \right) + \left( {\gamma + {\lambda _k}} \right)$
will reflect the selection of enganche migrants during the Panic period.
Column (2) of Table 5 reports again our baseline migrant selection estimates across periods. Column (3) presents estimates of Equation (4), which allows us to infer how the scale and sorting of labor recruiting shaped the selection of Mexican immigration. We use estimates relative to the military elite to illustrate our argument. Estimates relative to the other comparison samples are reported in Online Appendix Table A.3. During the pre-Panic period, the average Mexican migrant was 0.67 cm taller than the military elite (Column (2)), whereas non-enganche migrants were 0.39 cm taller (Column (3)). Although the latter estimate is not statistically different from zero, the point estimate suggests that the enganche may have accounted for at least 41 percent of the average height gap between migrants and the military elite. This effect results from a share of enganche migrants of about 36 percent (scale of recruiting) and a 0.7 cm height gap between enganche and non-enganche migrants (degree of sorting).
During the Panic, Mexican immigration became negatively selected, with the average migrant being about 0.9 cm shorter than the military elite (Column (2)). The point estimates in Column (3) suggest a similar, negative height gap (–1 cm) between non-enganche migrants and the military elite, which is explained by the virtual absence of labor recruiting: only 1.2 percent of migrants used the enganche system during the crisis. Although the
 ${\phi _{Panic}}$
coefficient is not statistically different from zero, the point estimate is large and positive, suggesting that the degree of sorting in recruiting could have increased. Figure 5 shows that indeed the few enganche migrants that crossed the border during the Panic were taller than most of their pre-Panic peers. Back-of-the-envelope calculations suggest that had the scale and degree of selective recruiting continued during the Panic, the height difference between migrants and the military elite would have been about –0.2 cm. Equivalently, a 50 percentage point increase in the recruiting scale during the crisis would have offset the negative-selection effect of non-enganche immigration. How did the Panic of 1907 change the scale of recruiting? Recall that during the crisis, banks and financial institutions limited or suspended cash payments. This likely affected the liquidity of American companies and labor contractors for financing the enganche system, which operation required paying train tickets, subsistence allowances, and wages in advance for tens or hundreds of recruited migrant workers. The demand for migrant workers could have also decreased, as thousands of firms and over one hundred banks went bankrupt as the crisis unfolded (Markham Reference Markham2002, p. 32). In addition, major railway companies were severely impacted by the Panic and had to curtail their operations, affecting the transportation of workers in the United States (Johnson Reference Johnson1908, p. 456). These factors likely constrained the recruiting of migrant workers with above-average physical productivity, and consequently, their effect toward a positive selection faded.
${\phi _{Panic}}$
coefficient is not statistically different from zero, the point estimate is large and positive, suggesting that the degree of sorting in recruiting could have increased. Figure 5 shows that indeed the few enganche migrants that crossed the border during the Panic were taller than most of their pre-Panic peers. Back-of-the-envelope calculations suggest that had the scale and degree of selective recruiting continued during the Panic, the height difference between migrants and the military elite would have been about –0.2 cm. Equivalently, a 50 percentage point increase in the recruiting scale during the crisis would have offset the negative-selection effect of non-enganche immigration. How did the Panic of 1907 change the scale of recruiting? Recall that during the crisis, banks and financial institutions limited or suspended cash payments. This likely affected the liquidity of American companies and labor contractors for financing the enganche system, which operation required paying train tickets, subsistence allowances, and wages in advance for tens or hundreds of recruited migrant workers. The demand for migrant workers could have also decreased, as thousands of firms and over one hundred banks went bankrupt as the crisis unfolded (Markham Reference Markham2002, p. 32). In addition, major railway companies were severely impacted by the Panic and had to curtail their operations, affecting the transportation of workers in the United States (Johnson Reference Johnson1908, p. 456). These factors likely constrained the recruiting of migrant workers with above-average physical productivity, and consequently, their effect toward a positive selection faded.
In the aftermath of the crisis, we observe different adjustments in the selection of non-enganche and enganche migrants. On the one hand, non-enganche migrants became more positively selected, as they were 0.6–1 cm taller than their pre-Panic peers. On the other hand, the
 ${\phi _{post - Panic}}$
coefficient is not statistically different from zero. The point estimate, however, is negative and large, which indicates that recruiting patterns may have changed in the post-Panic. Figure 5 shows that the degree of positive sorting in recruiting varied during 1908, with the height of enganche migrants increasing substantially during the planting season and decreasing later in the year during the harvest months. We also observe seasonal shifts in the height of non-recruited migrants throughout 1908, although less pronounced.
${\phi _{post - Panic}}$
coefficient is not statistically different from zero. The point estimate, however, is negative and large, which indicates that recruiting patterns may have changed in the post-Panic. Figure 5 shows that the degree of positive sorting in recruiting varied during 1908, with the height of enganche migrants increasing substantially during the planting season and decreasing later in the year during the harvest months. We also observe seasonal shifts in the height of non-recruited migrants throughout 1908, although less pronounced.
Robustness Checks
The evidence noted earlier suggests that the recruitment of seasonal migrant workers could explain the observed shifts in migrant selection. We test this hypothesis by including in the control variables a full set of interactions between enganche and season dummies. Like all the control variables, we allow their effects to vary flexibly across periods. Column (4) of Table 5 reports estimates that reflect selection patterns for non-seasonal migrants. There are three main results to note. First, the negative selection of non-recruited migrants increases by 45 percent during the Panic. This indicates that seasonal immigration during the 1907 Panic did not influence the shift toward negative selection. In fact, the average adjusted height of non-recruited seasonal migrants did not change during the Panic (coefficient not reported). Second, the post-Panic positive selection of non-recruited migrants increases by 62 percent, which suggests that the crisis changed the height profile of non-seasonal migrants. Third, the enganche effect in the pre-Panic increases by 56 percent, implying that the degree of positive sorting in recruiting was greater among non-seasonal migrants. Note, however, that the crisis may have changed this pattern, as in the post-Panic non-seasonal recruited migrants became 2.1 cm shorter than their pre-Panic peers.
One important caveat to our findings is that events such as crop failures, droughts, or political unrest could have occurred in Mexico during our period of analysis. This kind of random shock can affect the incentives to migrate and consequently shape migrant selection. To our knowledge, there were no major social conflicts in Mexico that could have induced migration flows before December 1908. However, Contreras (Reference Contreras2005, p. 123), Clark (Reference Clark1908, p. 473), and Mayet et al. (1980, p. 757) document that some states experienced droughts in 1908, causing important crop losses in some areas (Cardoso Reference Cardoso1980, p. 12). We identify the specific locations affected by droughts using the Mexican Drought Atlas (Stahle et al. Reference Stahle, Cook, Burnette, Jose Villanueva, Burns, Daniel Griffin, Cook, Acuña, Torbenson and Howard2016) and link them with the migrants’ reported locations of origin. This allows us to identify migrants whose decision to move could have been influenced by the presence of droughts. We describe this methodology in more detail in the Online Appendix. We then estimate Equation (4), including a full set of interactions between an indicator for migrants affected by droughts and time-period dummies. Column (5) shows that our results remain very similar in terms of magnitude and significance, suggesting that the presence of droughts in Mexico did not explain the observed shifts in selection. Finally, Column (6) shows that our results hold when including birth-region-by-cohort and skill-class-by-cohort fixed effects.
CONCLUSION
Shifts in migrant selection induced by random shocks can have important implications. Changing selection can affect the earnings of natives and existing immigrants in the destination, which in turn can modify internal migration patterns at the local level (Abramitzky et al. Reference Abramitzky, Philipp, Leah, Boustan and Hansen2019). Short-run changes in the composition of arriving cohorts can also affect the assimilation process of the immigrant population (Massey Reference Massey2016). In the sending communities, short-run changes in the composition of migrants can affect inequality across households through direct and indirect effects of remittances (Ibarraran and Lubotsky Reference Ibarraran, Lubotsky and George2007; McKenzie and Rapoport Reference McKenzie and Rapoport2007).
We leverage the Panic of 1907—a severe financial crisis that unexpectedly affected the demand for Mexican migrant workers in the United States—to study how the selection of early-twentieth-century Mexican immigration adjusted to short-run changes in the business conditions. We find that migrants were drawn from the intermediate/upper ranks of Mexico’s height distribution. In other words, Mexico sent to the United States relatively tall laborers with above-average earnings potential. This selection pattern changed significantly in response to the crisis, with the adjustment toward negative selection occurring very quickly (in a matter of months). We also show that the observed short-run adjustments were partially mediated by a historical labor-recruiting system that was importantly involved in the immigration process and intertwined with the American business cycle. We provide evidence suggesting that the effect of labor recruiting on migrant selection may depend on the interaction of two factors: the scale and type of recruiting (assortative or random). The results suggest that in the early twentieth century, a period with no restrictions on Mexican immigration, assortative labor recruiting contributed to maintain relatively constant the height profile (skill-mix) of the migration flow in the short run.


 Open access