the Creative Commons Attribution 4.0 License.
the Creative Commons Attribution 4.0 License.
 | 12 Jan 2023
Soil depth as a driver of microbial and carbon dynamics in a planted forest (Pinus radiata) pumice soil
Loretta G. Garrett
Charlotte Armstrong
Fiona Dean
Steve A. Wakelin
Forest soils are fundamental in regulating the global carbon (C) cycle; their capacity to accumulate large stores of C means they form a vital role in mitigating the effects of climate change. Understanding the processes that regulate forest soil C dynamics and stabilisation is important to maximise the capacity and longevity of C sequestration. Compared with surface soil layers, little is known about soil C dynamics in subsoil layers, sensu those below 30 cm depth. This knowledge gap creates large uncertainties when estimating the distribution of global soil C stocks and assessing the vulnerability of soil C reserves to climate change. This study aimed to dive deep into the subsoils of Puruki Experimental Forest (New Zealand) and characterise the changes in soil C dynamics and the soil microbiome down to 1 m soil depth. ITS and 16S rRNA sequencing and quantitative real-time PCR were used to measure changes in soil microbial diversity, composition, and abundance. Stable (δ13C) and radioactive (14C) C analyses were performed to assess depth-driven changes in the stability and age of soil C. Our research identified large declines in microbial diversity and abundance with soil depth, alongside significant structural shifts in community membership. Importantly, we conservatively estimate that more than 35 % of soil C stocks are present in subsoil layers below 30 cm. Although the age of soil C steadily increased with depth, reaching a mean radiocarbon age of 1571 yr BP (years before present) in the deepest soil layers, the stability of soil C varied between different subsoil depth increments. These research findings highlight the importance of quantifying subsoil C stocks for accurate C accounting. By performing a broad range of analytical measures, this research has comprehensively characterised the abiotic and biotic properties of a subsoil environment – a frequently understudied but significant component of forest ecosystems.
- Article
(1945 KB) - Full-text XML
-
Supplement
(2305 KB) - BibTeX
- EndNote


Forest soils are influential in regulating the global C cycle, accounting for over 70 % of the world's soil organic C (SOC) reserves and supporting over 80 % of aboveground terrestrial C stocks (Batjes, 1996; Jobbágy and Jackson, 2000; Six et al., 2002). Developing forest management strategies that maximise soil C sequestration may serve as a powerful tool for offsetting fossil fuel emissions and mitigating the effects of climate change (Jandl et al., 2007; Mukul et al., 2020).
Compared with surface soil layers, the deeper subsoil layers of forest ecosystems are comparatively under-explored (Yost and Hartemink, 2020). Although the concentration of SOC declines with depth (Schmidt et al., 2011), studies have reported that, accumulatively, up to 50 % of total SOC may be contained within soil layers below 30 cm (Balesdent et al., 2018; Jobbágy and Jackson, 2000; Gonzalez et al., 2018; Ross et al., 2020).
Deep SOC is more resistant to decomposition by soil microorganisms due to the biological, physical, and chemical conditions of the subsoil environment (Schmidt et al., 2011). Thus, when undisturbed, deep SOC is considered to represent the “stable” fraction of the SOC pool. However, the stability of sequestered SOC is complex and is related to a range of variables including soil clay content, mineralogy, structure and texture, landscape position, association with microaggregates, climate, vegetation, and soil microorganisms (Jobbágy and Jackson, 2000; Lal, 2004; Kuzyakov, 2010; Song et al., 2020). Historical biases against sampling deeper soil layers limit our understanding of how the properties of subsoil environments influence SOC sequestration and storage. This introduces uncertainty when modelling the stability of deep SOC pools to climate change (Gross and Harrison, 2019).
Soil microorganisms are responsible for the transformation and stabilisation of SOC (Lladó et al., 2017; Spohn et al., 2016) and are influential in determining patterns of C sequestration (Jastrow et al., 2007). Studying the changes that occur to soil microbial communities with depth is essential to understand the nature and extent of their role in regulating long-term SOC dynamics. Previous studies have reported that soil microbial diversity, abundance, respiration, and C turnover decline with depth (Blume et al., 2002; Eilers et al., 2012; Fang et al., 2005; Fierer et al., 2003; Spohn et al., 2016). More recent research has explored the taxonomic and functional changes that occur in microbial communities with soil depth (Brewer et al., 2019; Frey et al., 2021; Hao et al., 2021). However, particularly for coniferous forest ecosystems, our knowledge of the response of soil microbial communities to depth and the environmental properties that drive these changes remains poorly understood. Furthermore, the inherently heterogeneous nature of soil environments, both globally and locally (Curd et al., 2018; Kuzyakov and Blagodatskaya, 2015; Štursová et al., 2016), means context-specific research is required to understand the SOC dynamics and associated microbiota of forest subsoil environments. To maximise the sink capacity of forest soils and to retain the SOC already stored at depth, we need to better understand the processes that regulate C sequestration and long-term C storage within the deep soil environment.
Using Puruki Experimental Forest (central North Island, New Zealand) as a case study, this research aimed to improve our understanding of subsoil C dynamics within a production forest. Using a wide range of analytical methods, we examined the variability in subsoil C in 10 cm increments down a 1 m soil profile. Changes in the diversity, composition, and abundance of bacterial and fungal communities with depth were quantified using 16S rRNA/ITS amplicon sequencing and quantitative real-time PCR (qPCR). To investigate changes in C cycling dynamics down each soil core, measurements of soil isotopic composition (13C 12C ratio) were performed, with the 13C 12C ratio of soils previously having been used as a proxy for soil C turnover (Garten et al., 2008; Paul et al., 2020; Poage and Feng, 2004; Wang et al., 2018). Radiocarbon ageing based on measurements of 14C abundance was further used to identify older stabilised C stocks (Chabbi et al., 2009). The results of this research contribute to our understanding of the biological and chemical properties of productive forest subsoil environments, a critical research gap that is fundamental for assessing the vulnerability of forest SOC stocks to climate change.
2.1 Study site and soil collection
Soils were sampled from Puruki Experimental Forest (38∘26′ S, 176∘13′ E), located in the Paeroa Range of New Zealand's central North Island (Fig. S1 in the Supplement). Puruki Experimental Forest (henceforth referred to as Puruki Forest) is a 35 ha Pinus radiata forest that was established in 1973, after previously being converted from podocarp/hardwood native forest to ryegrass and clover pasture in 1957 (Beets and Brownlie, 1987; Garrett et al., 2021). Puruki Forest is now near the end of its second rotation, having previously been harvested in 1997 (Oliver et al., 2004). Puruki Forest was selected for investigation due to its high scientific impact and extensive contribution to production forestry research (Garrett et al., 2021). Furthermore, Puruki Forest has an extensive body of historical data available related to soil health, productivity, and land management – factors which are important for helping us understand the drivers of subsoil C dynamics (Garret et al., 2021).
Puruki Forest sits at an elevation range of 500–700 m a.s.l. and varies from gently (less than 12∘) to steeply sloping (up to 30∘) land, with a mean annual rainfall of 1500 mm and mean annual temperature of 10 ∘C (Beets and Brownlie, 1987; Brownlie and Kelliher, 1989). Puruki Forest has an average soil pH of 5.2 at 0–10 cm depth (Beets and Brownlie, 1987). The soil pH at Puruki Forest has been reported to increase with depth, having an average pH of 5.62 at 1–2 m depth (Beets et al., 2004).
Soil parent materials at Puruki originated from the Taupo volcanic centre (1850 ± 100 BP), with older ash showers from Taupo and Okataina volcanic centres (Rijkse and Bell, 1974). The Orthic Pumice soils found at Puruki are highly permeable, being composed of loamy sand, silty sand, and gravel (Taupo lapilli) (New Zealand Soil Classification System; Hewitt, 2010).
A permanent sample plot (PSP) within the Rua sub-catchment of Puruki Forest was targeted for sampling. As Puruki Forest has a varied topology, our sampling plot was located along a 12∘ slope. Soils were collected just outside of the plot to avoid disturbance for longer-term monitoring at the site. For sampling, 10 points spaced 2 m apart were set out along an 18 m transect. At each sampling point, two paired 1 m soil cores were extracted using a motorised percussion soil sampler capable of collecting intact cores with an internal plastic sleeve; one core was taken for bulk density analysis, and the other core was used for DNA and chemical analysis. Following extraction, core pairs were visually compared to check for any considerable differences in soil colour and texture by depth (Fig. S2). Intact soil cores were transported back to the lab in cool, dark conditions. Care was taken to minimise disruption during transport so that cores remained intact from field to lab. Following transport, soil cores were divided into 10 cm increment samples. Incidences of compaction which occurred during sample collection were adjusted for during the division of cores into depth increments (Supplement Methods).
2.2 Sample preparation
To prepare soils for DNA analysis, moist soil samples were sieved to less than 2 mm and stored at −20 ∘C until ready for DNA extractions. DNA was extracted from 0.25 g of each soil sample using a DNeasy Powersoil Pro Kit (Qiagen) according to the manufacturer's instructions. Soils required for measurements of total C and nitrogen (N), total phosphorus (P), Bray P, pH, Mehlich 3 extractable elements (Ca, K, Mg, and Na), cation exchange capacity (CEC), exchangeable cations, organic P, and inorganic P were air dried and sieved to < 2 mm. For measurements of bulk density, air-dried fine (< 2 mm) and coarse (> 2 mm) soil fractions were oven dried separately at 104 ∘C until constant weight. Subsamples of air-dried soils were fine ground using a Spex800D ball mill for measurements of total C (%), total N (%), δ13C [‰], and radiocarbon 14C analysis [‰].
2.3 Soil chemistry
Total C and N were determined on fine (< 2 mm) and coarse (> 2 mm) fraction fine-ground soils by dry combustion using a LECO CNS-2000 carbon nitrogen analyser (Rayment and Lyons, 2011). Soil pH was determined in water at a soil : water ratio of 1:2.5 (Blakemore et al., 1977). Total phosphorus (P) was measured by flow injection analyser (FIA) colorimetry after sulphuric acid digestion (Blakemore et al., 1977; Taylor, 2000). Bray P was measured by FIA colorimetry after sequential Bray 2 (NH4F HCl) extraction at a ratio of 1:10 soil : extractant (Blakemore et al., 1977; Bray and Kurtz, 1945). Exchangeable cations (Ca, K, Mg, and Na) were measured by inductively coupled plasma mass spectrometry (ICP-MS) after 1:50 (macro) NH4CH3COO leaching. Cation exchange capacity (CEC) was measured by FIA colorimetry after 1 M NH4COOH leaching, followed by 1M NaCl (Blakemore et al., 1977; Sparks et al., 1996).
2.3.1 Stable isotope (δ13C) analysis
Fine-ground soil samples were sent to GNS Stable Isotope Laboratory (Wellington, New Zealand) for δ13C analysis by isotope ratio mass spectrometry. Soil samples were pre-treated by adding 10 % hydrochloric acid (HCl) to 1 g of each sample and left overnight at room temperature. Samples were then centrifuged and rinsed to neutral pH. Following pre-treatment, samples were freeze dried and measured on an Isoprime mass spectrometer using a Eurovector elemental analyser. All δ13C results are reported with respect to VPDB and N-Air, normalised to GNS internal standards which were cane sugar (−10.3 ‰), beet sugar (−24.6 ‰), and EDTA (−31.1 ‰). The stable carbon isotope composition (13C 12C) is reported in δ13C values presented as per thousand [per mille, ‰], with the analytical precision for these measurements being 0.2 ‰.
2.3.2 Radiocarbon 14C analysis
Fine ground soil samples were graphitised at the Houghton Carbon, Water, and Soils Lab (USDA Forest Service Northern Research Station, Michigan, US), and radiocarbon measurements were conducted at the DirectAMS facility (Bothell, Washington, US). Soil samples were combusted at 900 ∘C for 6 h in evacuated, sealed quartz tubes with cupric oxide (CuO) and silver (Ag) wire to form CO2 gas. After combustion, CO2 was reduced to graphite through heating at 570 ∘C with hydrogen (H2) gas and an iron (Fe) catalyst (Vogel et al., 1987). Graphite targets were analysed for radiocarbon abundance using accelerator mass spectrometry (AMS) and corrected for mass-dependent fractionation using measured δ13C values according to Stuiver and Polach (1977). Conventional Radiocarbon Age (CRA) and 14C are reported as defined by Stuiver and Polach (1977), with CRA presented as years before present (yr BP) and 14C presented as per thousand [per mille, ‰].
2.4 Microbial amplicon sequencing
Following the Earth Microbiome Project (EMP) protocols, barcoded forward and reverse primers 515F-806R were used to amplify the 16S rRNA V4 region (Caporaso et al., 2012). Nested PCRs were performed using the non-barcoded primers 27F-1492R on DNA samples that initially failed to amplify. The EMP's standard ITS amplicon protocol was followed to amplify the fungal ITS gene region using the barcoded primers ITS1f-ITS2 (Bokulich and Mills, 2013; Hoggard et al., 2018). DNA samples that initially failed to amplify were targeted for nested PCR using primers NSA3-ITS4. Full details of the PCR reaction protocols are provided in the Supplement Methods. Successful PCR amplicons were sent for Illumina 500 MiSeq 250 bp (16S rRNA) and Illumina 600 MiSeq 300 bp (ITS) paired-end sequencing at the Australian Genome Research Facility (AGRF; Melbourne, Australia). For the 16S rRNA amplicon libraries, eight no-template control (NTC) samples, which showed no visible bands during agarose gel electrophoresis, were sent for sequencing to check for contaminants.
2.5 Quantitative PCR
The absolute concentration of bacterial and fungal DNA in each DNA sample was determined from standard curves using AriaMx SYBR Green qPCR (Agilent Technologies). Broad-range forward and reverse primers 338F-518R and ITS1F-5.8s were selected to target the 16S rRNA (V3–V4) and ITS gene region for quantification (Shahsavari et al., 2016). Full details of the qPCR reaction protocol and standard curve preparation are provided in the Supplement Methods. Following quantification, 16S rRNA and ITS copy numbers were adjusted to copy numbers per nanogram of DNA.
2.6 Statistical analysis
Before analysis, slope-corrected C stocks (Mg ha−1) were calculated based on soil C concentration (Total C %) and soil bulk density measurements. Slope-corrected stocks were calculated using the following formula (Jones et al., 2008):
where BD is bulk density (g cm−3), SOCconc is total C (%), D is the thickness of the soil layer (cm), and SF is the slope factor. The values for total C, total N, and C stocks are reported using the sum of both the < 2 and > 2 mm soil fractions. Values for total P, Bray P (sequential extraction 1), and exchangeable cations (K, Ca, Mg, Na) were slope corrected and converted to kg ha−1. The changes in soil pH, total C (Mg ha−1), total N (kg ha−1), C : N ratio, δ13C [‰], total P (kg ha−1), Bray P (kg ha−1), total bulk density (g cm−3), and exchangeable cations K, Ca, Mg, and Na (kg ha−1) with soil depth were tested for significance using non-parametric Friedman tests with transect sampling position as a blocking variable. Post hoc tests were performed using pairwise Wilcoxon rank sum tests with Bonferroni correction.
To calculate differences in the allocation of C stocks down each soil profile, the proportion of C (Mg ha−1) allocated to each depth increment was calculated relative to the sum of total C (Mg ha−1) for each sample core. Differences in 16S rRNA and ITS copy number with depth were tested for significance using Kruskal–Wallis chi-squared tests, with post hoc testing performed using Dunn's test with Bonferroni's adjustment. To estimate the allocation patterns of microbial DNA abundance down the soil profile, the proportion (%) of 16S rRNA and ITS copy numbers allocated to each depth increment was calculated relative to the total sum of the soil core.
2.6.1 Microbial diversity analysis
Base calling and demultiplexing of sequencing libraries to per-sample fastQ files was performed using Illumina's bcl2fastq software (version 2.20.0.422). The DADA2 version 1.18 workflow (Callahan et al., 2016) was used to process paired-end fastQ files into amplicon sequence variants (ASVs). Briefly, forward and reverse reads were quality filtered, trimmed, and de-noised before being merged into ASVs. Chimeric ASVs were removed, and taxonomies were assigned to ASVs using the Ribosomal Database Project (RDP) Classifier (Wang et al., 2007) and the UNITE (Abarenkov et al., 2021) databases. After DADA2 processing, 74.92 ± 5.60 % of 16S rRNA input reads and 44.46 ± 14.35 % of ITS input reads were retained. Following DADA2 processing, ASV tables were filtered to remove unidentified phyla, unwanted phyla (i.e. Cyanobacteria and/or Chloroplasts), and singletons. For the 16S rRNA dataset, ASVs which had a higher average count in NTC samples than eDNA samples were removed. Rarefaction curves showing ASV richness by depth increment and PCR type can be seen in Figs. S3 and S4. Following the removal of samples with low ASV counts, ASV tables were rarefied to even sampling depth before analysis (16S rRNA: 11613 ASVs per sample, ITS: 10101 ASVs per sample).
Microbial alpha and beta diversity analyses were calculated on rarefied ASV tables using the R packages phyloseq (McMurdie and Holmes, 2013) and vegan (Oksanen et al., 2020). Changes in alpha diversity with depth were tested for statistical significance using Kruskal–Wallis chi-squared tests as described previously. Pairwise Spearman's correlation tests with Bonferroni adjustment were used to correlate alpha diversity values with soil chemical parameters using psych R (Revelle, 2021). Bray–Curtis distance matrices were calculated to measure community dissimilarity and ordinated using non-metric multidimensional scaling (NMDS). Differences in community dissimilarity by depth were tested for significance using PERMANOVA, and pairwise differences were tested using pairwiseAdonis R with Bonferroni adjustment (Arbizu, 2017). For both alpha and beta diversity analyses, the impacts of transect sampling position and PCR type (nested or single) were tested for significance. Mantel tests were used to correlate Euclidean distance matrices of soil chemical properties to Bray–Curtis matrices of microbial community composition. Venn diagrams were produced to show the proportion (%) shared versus unique ASVs between depth increments using MicEco R (Russel, 2021).
Analysis of Compositions of Microbiomes with Bias Correction (ANCOM-BC; Lin and Peddada, 2020) was used to identify microbial taxa which had a significant log-fold change between topsoil (0–30 cm) and subsoil layers (30–100 cm). Hierarchical clustering was performed on Euclidean distances of log-adjusted abundances, using the average linkage method (hclust R). Dendrograms were constructed using ggtree (Yu et al., 2017) to visualise the hierarchical clustering patterns of microbial orders based on their log-adjusted abundances. The log-adjusted abundances of microbial taxa obtained from ANCOM-BC analysis were correlated to soil chemical properties using pairwise Spearman's correlation tests with Bonferroni adjustment using psych R (Revelle, 2021). To assess changes in the diversity of high-level 16S rRNA functional genes with soil depth, PICRUSt2 was used to predict MetaCyc pathway abundances (Douglas et al., 2020; Caspi et al., 2018). MetaCyc pathway abundance predictions were analysed in phyloseq R using the same alpha and beta diversity methods as already outlined.
2.6.2 Microbial network analysis
ASV tables were split into samples from topsoil (0–30 cm) and subsoil (30 –100 cm) layers to obtain microbial communities specific to each soil layer. Topsoil and subsoil ASV tables were then filtered to retain only “core” communities (i.e. ASVs with a total relative abundance of at least 0.05 % in a minimum of three samples) and then summarised to genus level.
SPIEC-EASI networks were constructed using the Meinshausen–Buhlmann (MB) neighbourhood algorithm in SpiecEasi R (Kurtz et al., 2015). Networks were visualised using igraph R (Csárdi and Nepusz, 2006) and network statistics were calculated using Cytoscape 3.8.2 (Shannon et al., 2003). Significant differences (p < 0.05) in network statistics between topsoil and subsoil communities were tested using Wilcoxon signed rank tests (Mundra et al., 2021). Descriptions of these network statistics can be found in the Supplement Methods.
3.1 Soil chemistry, C stocks, and microbial DNA abundance
Total C (Mg ha−1), total N (kg ha−1), total P (kg ha−1), C : N ratio, and exchangeable cations (K, Ca, Mg, and Na; kg ha−1) significantly declined with soil depth (p < 0.05). Soil pH and bulk density (g cm−3) significantly increased with soil depth (p < 0.05). The results of soil chemical analyses and the corresponding statistical tests are presented in Tables S1 and S2.
The average soil C stock of the 1 m soil cores extracted from Puruki Forest was 99.71 ± 28.78 Mg ha−1 C. The average soil C stock allocated to the coarse (> 2 mm) soil fraction was 1.88 ± 1.92 Mg ha−1 of C, values which did not vary by soil depth (ANOVA: F = 1.58; p > 0.05).
On average, 34.58 ± 10.25 % of the soil C stock was allocated to the 30–100 cm (subsoil) layer (Fig. 1; Table S3 in the Supplement). The proportion of soil C stock allocated to the subsoil varied across the soil cores, ranging from 46.60 % to 16.21 %. On average, 33.45 ± 10.92 % of fungal DNA and 49.11 ± 4.82 % of bacterial DNA was allocated to the subsoil (Fig. 1; Tables S3 and S4). Thus, the allocation patterns of soil C with depth corresponded well to the distribution of bacterial and fungal DNA with depth.
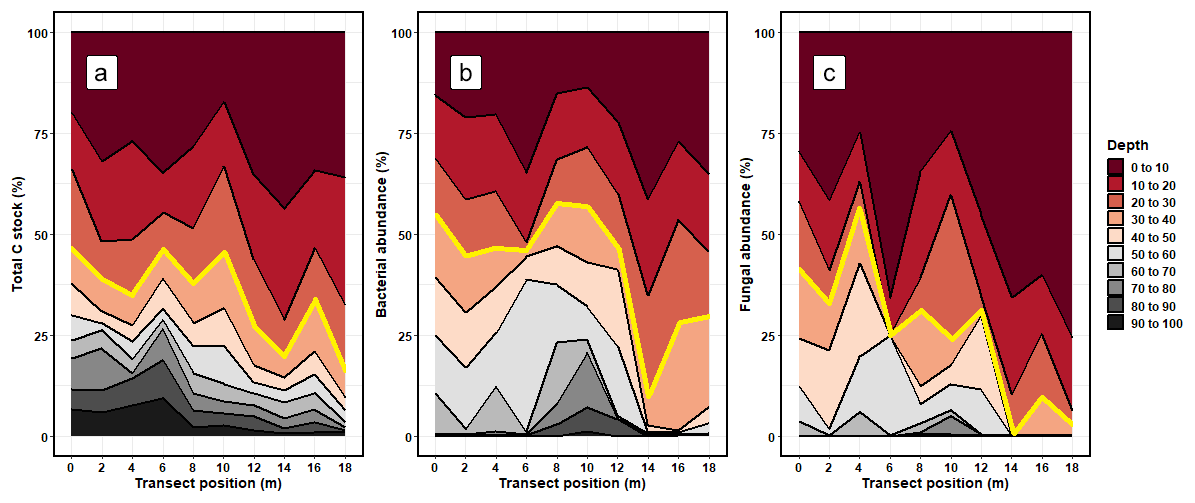
Figure 1The relative proportion (%) of (a) total carbon stocks (C Mg ha−1), (b) bacterial DNA abundance, and (c) fungal DNA abundance allocated to each depth increment. The values for soil C stocks are reported using the sum of < 2 and > 2 mm soil fractions. The transect position (m) shows where each soil core was extracted from along the sampling transect. The red line shows the typical cutoff point of the topsoil subsoil boundary, where measures below 30 cm are rarely taken.
3.2 δ13C and 14C natural abundance measurements
Overall, δ13C [‰] significantly increased by 1.58 ‰ (p < 0.05; Table S1) between depth increments of 0–10 and 90–100 cm. However, between soil depths of 70–90 cm the enrichment of 13C was lower than the rest of the subsoil (Fig. 2). Values for 14C [‰] and the CRA [yBP] of soil C declined with depth (Fig. 2; Table S1). The age of soil C steadily increased with depth and reached a mean age of 1570.83 ± 316.28 yr BP in the deepest soil layers of 90–100 cm.
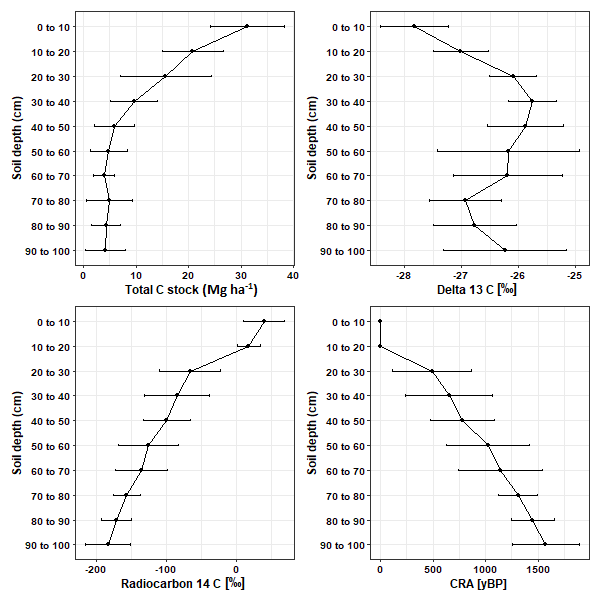
Figure 2The mean ± SD changes in total C stock (Mg ha−1), δ13C [‰], Δ14C [‰], and conventional radiocarbon age (CRA) [yr BP] with soil depth.
3.3 Changes in microbial diversity, abundance, and composition with depth
The richness, diversity, and evenness of fungal and bacterial communities significantly declined with depth (p < 0.05; Fig. 3; Tables S6 and S7). The same trends were evident for the predicted abundances of bacterial functional genes with depth (Table S7). Transect position had no relationship to bacterial alpha diversity; however, fungal evenness did vary across sampling locations (Table S7). The DNA abundance of bacteria and fungi significantly declined with soil depth (Fig. 3; Table S7) but was unaffected by transect position. Most of the significant differences in alpha diversity and DNA abundance occurred between the upper 0–20 cm depth increment and the rest of the soil; few significant pairwise differences were evident among soil layers sampled below 30 cm (Figs. S5–S8). When tested using pairwise Spearman's rank correlations (Fig. 4), microbial alpha diversity and abundance were strongly positively correlated to total C, total N, total P, C : N ratio, and 14C (ρ > 0.77; p < 0.05). Soil pH was strongly negatively correlated to microbial alpha diversity and abundance (ρ > −0.85; p < 0.05). δ13C was strongly negatively correlated to fungal richness (ρ = −0.85, p < 0.05) and bulk density (g cm−3) was strongly negatively correlated to bacterial abundance (ρ = −0.90, p < 0.05).

Figure 3The mean ± SD changes in microbial richness, Shannon diversity, Pielou's evenness, and 16S rRNA/ITS copy number with soil depth.
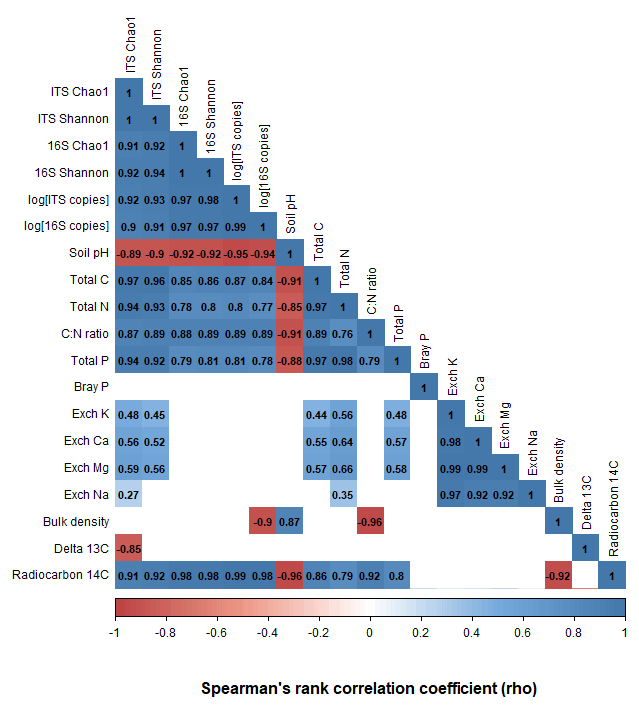
Figure 4A pairwise Spearman's correlation matrix showing the correlation between microbial richness, diversity, DNA abundance, and the associated soil chemical properties. Blank cells indicate non-significant (p > 0.05) correlations.
Bacterial (PERMANOVA: R2=0.21, p < 0.001) and fungal (R2=0.26, p < 0.001) community composition varied significantly between depth increments (Fig. 5). Pairwise adonis tests identified that the community composition of soils between 0 and 30 cm contributed to the majority of significant differences between groups, with the differences in microbial composition between soil increments past 30 cm being non-significant (Fig. S9). The composition of bacterial and fungal communities significantly differed by sampling transect position (bacteria: R2=0.13, p < 0.001; fungi: R2=0.04, p < 0.001). However, this accounted for less variation in community composition than soil depth. The composition of bacterial functional genes was significantly different between soil depth increments (R2=0.34, p < 0.001; Fig. S10).
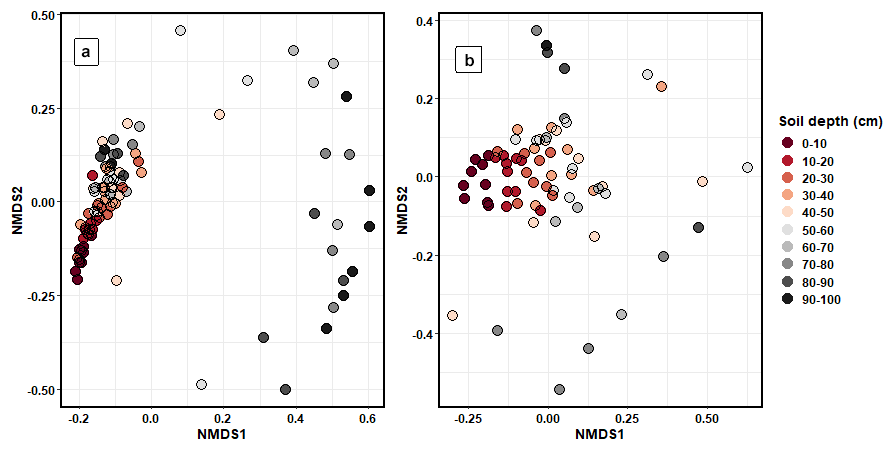
Figure 5NMDS ordination plots that were calculated using Bray–Curtis dissimilarity matrices showing the differences in (a) bacterial and (b) fungal community composition between the different soil depth increments.
Mantel tests identified that 14C (R=0.38, p < 0.001), C : N ratio (R=0.18, p < 0.05), bulk density (R=0.20, p < 0.05), Total p (R=0.16, p < 0.001), δ13C (R=0.13, p < 0.05), total N (R=0.13, p < 0.05), and exchangeable Ca (R=0.12, p < 0.01) shared a significant but weak correlation to bacterial community composition. Variables that shared a significant but weak correlation to fungal community composition included 14C (R=0.32, p < 0.001), δ13C (R=0.19, p < 0.01), total P (R=0.19, p < 0.01), total N (R=0.17, p < 0.01), total C (R=0.14, p < 0.05), and exch. Ca (R=0.21, p < 0.01). Furthermore, total N (R=0.17, p < 0.01), total P (R=0.17, p < 0.01), exchangeable Ca (R=0.13, p < 0.01), bulk density (R=0.12, p < 0.05), δ13C (R=0.18, p < 0.01), and 14C (R=0.38, p < 0.001) had a significant but weak correlation to bacterial functional genes.
3.4 Microbial taxonomic responses to soil depth
Only 9 % of bacterial ASVs and 2 % of fungal ASVs were present in all depth increments down the entire soil profile (Fig. S11). Upper depth increments (0–20 cm) had the highest number of unique bacterial (20 %) and fungal (32 %) ASVs, suggesting that these upper layers supported a greater range of unique bacterial and fungal taxa than the lower depths. Less than 3 % of bacterial ASVs and 1 % of fungal ASVs were found to be unique within depth increments from the 40 to 100 cm soil layer, suggesting that subsoils did not harbour vastly unique or distinctive microbial communities from those of topsoil layers.
Archaeal taxa belonging to Thermoplasmata, Desulfurococcales, Thermoprotei, Woesearchaeota incertae sedis (AR15, AR18, AR16, AR20), Euryarchaeota, Candidatus Aenigmarchaeum, and Thermoproteales exhibited significant positive log-fold changes with depth (Fig. 6). Furthermore, bacterial taxa belonging to Acidobacteria (e.g. Bryobacter, Gp20, Gp18, Gp25, Gp19, Gp6, Acidicapsa), Elusimicrobia (Blastocatella, Candidatus Endomicrobium), Planctomycetes (Phycisphaerales, Tepidisphaerales, Phycisphaerae), Firmicutes (Lactobacillales, Clostridia, Thermoanaerobacterales), Betaproteobacteria (Neisseriales, Ferritrophicales, Hydrogenophilales, Methylophilales), and Armatimonadetes (Gp2, Fimbriimonadales) exhibited a positive log-fold change in subsoils (Fig. 6). Fungal taxa which exhibited a positive log-fold change in subsoils (Fig. 6) included Calcarisporiellomycota, Exobasidiomycetes (Entylomatales), Sordariomycetes (Microascales, Trichosphaeriales, Annulatascales, Ophiostomatales), Agaricomycetes GS29, Sareomycetes (Sareales), Orbiliomycetes (Orbiliales), Malasseziomycetes (Malasseziales), and Kickxellomycetes (Kickxellales and GS29).
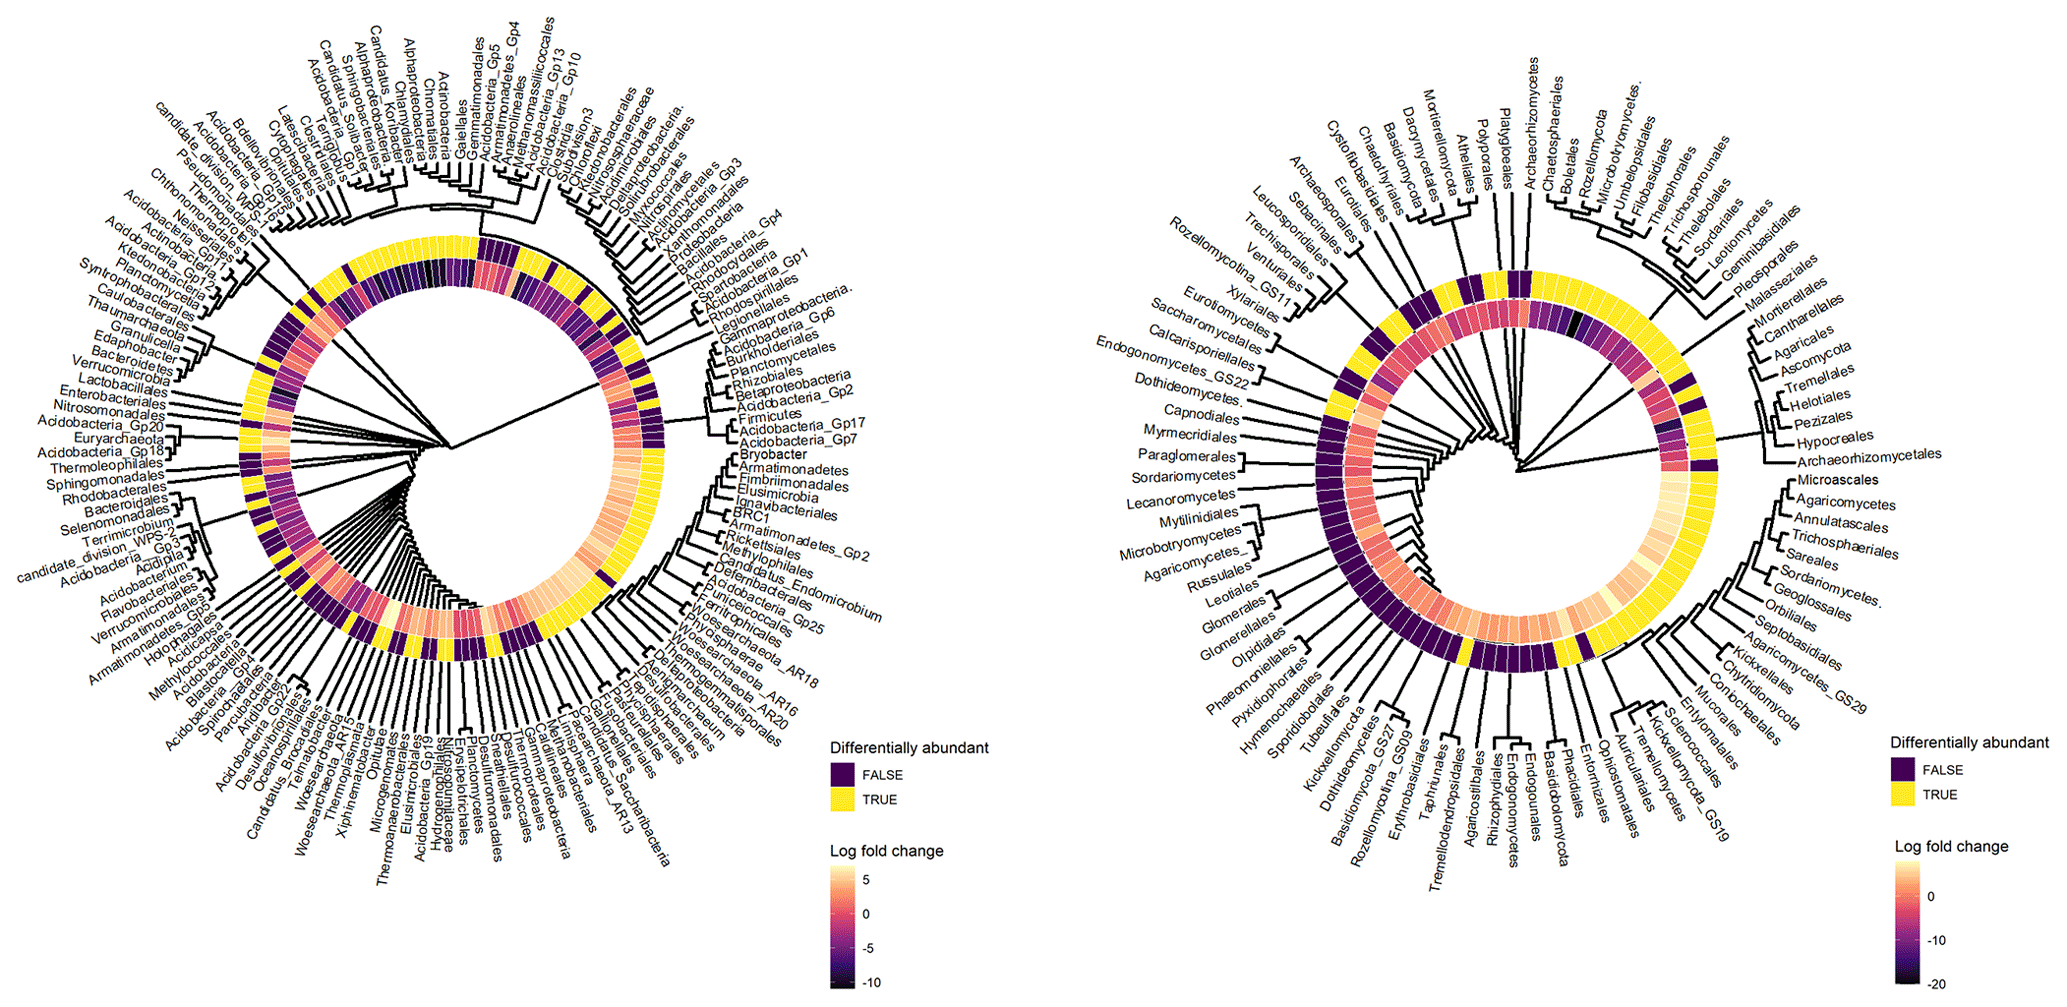
Figure 6Cluster dendrograms of bacterial and fungal orders based on their bias-adjusted abundances (ANCOM-BC analysis). Hierarchical clustering was performed on Euclidean distances of bias-adjusted abundances using the average linkage method. The log-fold change (LFC) value of each taxon between topsoil and subsoil is displayed. Taxa with positive LFC values were higher in subsoils and taxa with negative LFC values were lower in subsoils. The statistical significance of each taxa's differential abundance between topsoil and subsoil is displayed, with TRUE = p < 0.05 and FALSE = p > 0.05.
In contrast, bacterial taxa which had a significantly negative log-fold change in subsoils (Fig. 6) included Chlamydiae (Chlamydiales), Bacteroidetes (Sphingobacteriales, Cytophagales), Acidobacteria (Edaphobacter, Candidatus Solibacter, Candidatus Koribacter, Gp5, Gp16, Gp1, Terriglobus), Gammaproteobacteria (Chromatiales), Firmicutes (Clostridiales, Bacillales), Gemmatimonadetes (Gemmatimonadales), Verrucomicrobia (subdivision 3, Spartobacteria), Chloroflexi, Latescibacteria, and Actinobacteria (Ktedonobacterales, Actinomycetales, Gaiellales). The fungal phyla Mucoromycota, Rozellomycota, Mortierellomycota, and Glomeromycota exhibited large negative log-fold change values in subsoils, with members of the classes Tremellomycetes (e.g. Tremellales, Filobasidiales, Trichosporonales), Umbelopsidomycetes (Umbelopsidales), Agaricomycetes (Thelephorales, Boletales), Leotiomycetes (Helotiales, Thelebolales), Sordariomycetes (Xylariales, Chaetosphaeriales, Sordariales), and Microbotryomycetes exhibiting strong negative responses to increasing soil depth (Fig. 6). More detailed outputs of the ANCOM-BC analysis are presented in Tables S8–S13.
When correlating the abundance of microbial taxa to soil chemical properties, the microbial phyla Bacteriodetes, Chlamydiae, Chloroflexi, Gemmatimonadetes, Mortierellomycota, and Mucoromycota were strongly correlated (Spearman ρ > 0.7, p < 0.05) with 14C abundance (Table S14). Furthermore, of all the soil chemical properties measured, radiocarbon 14C abundance exhibited the greatest number of strong and significant correlations with the abundances of taxonomic groups (Table S14).
3.5 Structural changes in the soil microbiome with depth
The average node degree and neighbourhood connectivity of the topsoil interkingdom network was significantly higher than that of the subsoil network. In contrast, the average shortest path length and clustering coefficient were significantly higher in the subsoil interkingdom network (Fig. S12; Table S15). Compared with subsoils, the topsoil interkingdom network had a more connected structure with a greater degree of co-occurrences between genera. For both topsoil and subsoil interkingdom networks, bacterial genera were the dominant community members compared with fungi and archaea (Fig. 7). Networks of fungal-only topsoil communities had a significantly (p < 0.05) higher node degree, neighbourhood connectivity, average shortest path length, and betweenness centrality than fungal-only subsoil networks (Fig. S12; Table S15). For prokaryote-only networks (i.e. bacteria and archaea), the average node degree and average shortest path length was significantly higher in the topsoil than in the subsoil network (p < 0.05; Table S15). The fungal-only subsoil network exhibited a sparse structure, with 80.65 % of nodes being single nodes, i.e. they shared no co-occurrence with any other node (versus 30.34 % in the fungal topsoil network). In prokaryote-only networks, single nodes compromised 7.87 % of nodes in subsoils and 1.18 % of nodes in topsoils. In all of the networks, there was a greater proportion of positive edges (average 70.41 %) than negative edges (29.59 %) connecting the nodes (Table S15).
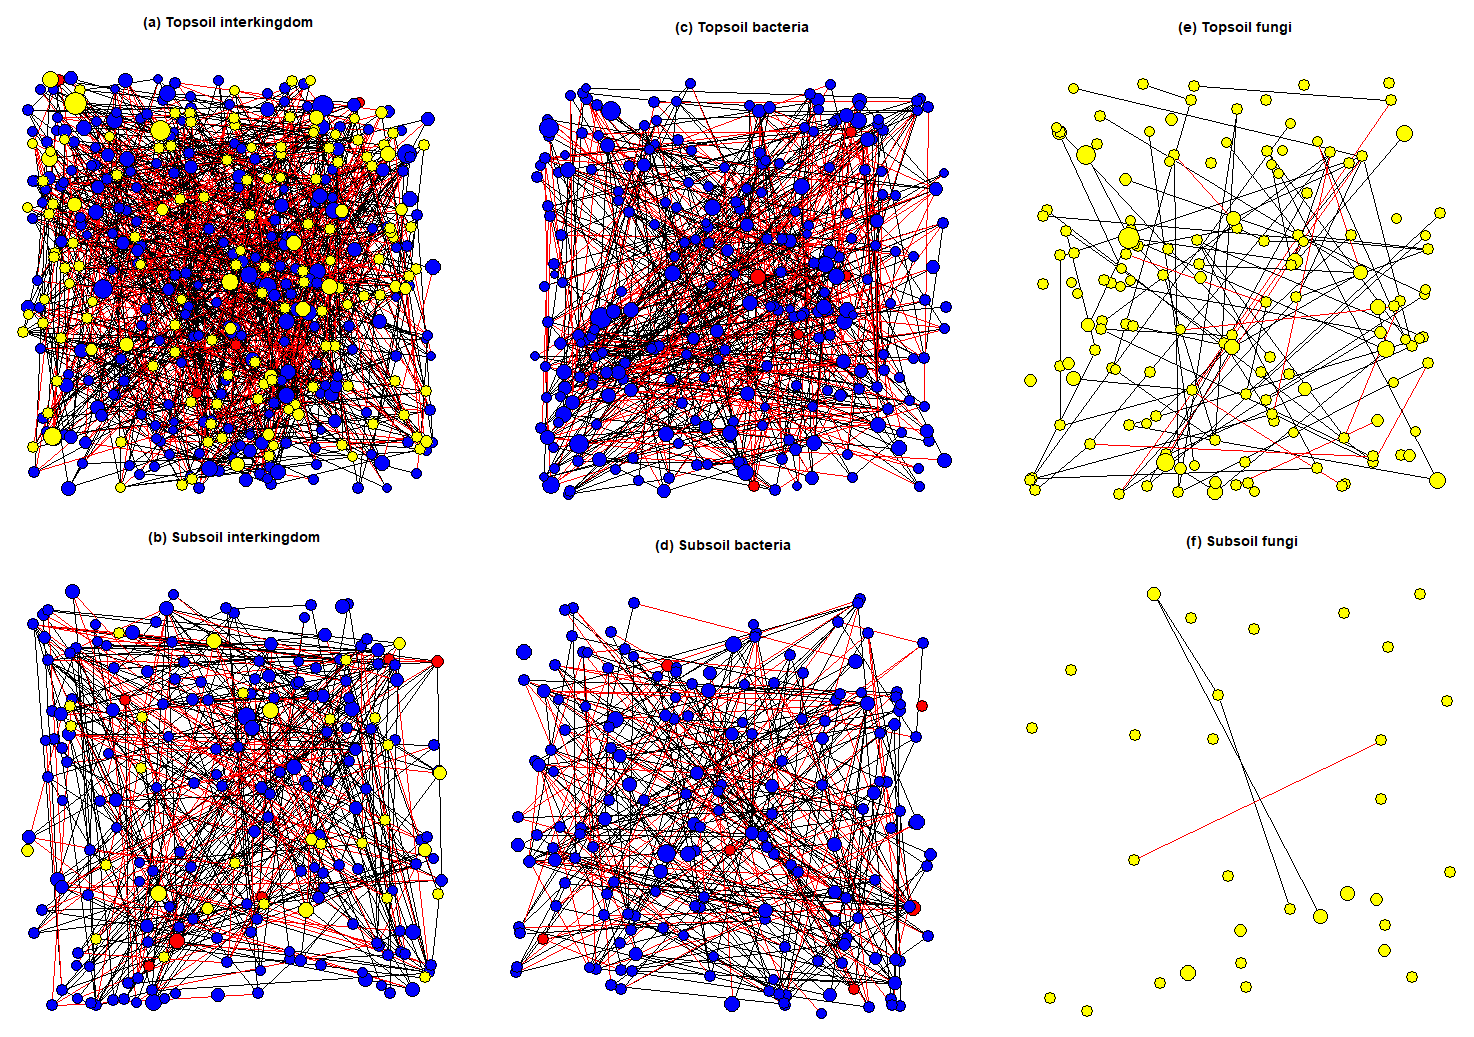
Figure 7SPIEC-EASI networks that were constructed on core microbial genera associated with topsoil (0–30 cm depth) and subsoil (30–100 cm depth) layers. Node size represents the normalised (centred log ratio) mean abundance of each genus. Blue nodes represent bacterial genera, red nodes represent archaeal genera, and yellow nodes represent fungal genera. Positive edge weights are shown by black lines connecting nodes and negative edge weights are shown by red lines connecting nodes.
4.1 Changes in soil C quantity, stabilisation, and age with depth
Previous research has identified large stores of unaccounted C stocks located in subsoil layers below 30 cm (Balesdent et al., 2018; Gonzalez et al., 2018; Ross et al., 2020). Our research identified that within Puruki Forest, 35 % of soil C stocks were allocated to the subsoil layers below 30 cm. Within our sampling site, subsoil C storage patterns were highly variable and ranged from 19 % to 46 % of the total soil C stocks. Previously, Oliver et al. (2004) remarked upon the large variability in soil C storage patterns across Puruki Forest, reporting average C stocks of 143 Mg ha−1 to 1 m soil depth; values which are higher than those observed in our study (99.71 Mg ha−1). High variability in subsoil C storage within Puruki Forest may be a signature of the natural textural and structural variation observed in the pumice soils (Silver et al., 2000; Telles et al., 2003). Furthermore, this variability may be a signature of Puruki's previous land use history (native forest > pasture > plantation) and the harvesting disturbances associated with historical management practices (Beets et al., 2002; Garrett et al., 2021; Rijkse and Bell, 1974). It is important to consider that our study was performed across a small spatial scale, with our 10 soil cores extracted from one transect within Puruki Forest. Given the high variability in soil C values observed in our data, we recommend that future studies perform soil sampling at a higher replication level, with soil cores extracted over a larger spatial extent within the study area under investigation.
We observed an overall enrichment of soil δ13C with depth which aligns with previous research (Garten, 2011; Wang et al., 2018). However, this was not a clear linear enrichment and δ13C was highly variable between depths of 70–90 cm. This corresponded to the high structural variability in our soil cores, as there were layers of coarse pumice material (Taupo lapilli) present throughout the subsoil horizons below 50 cm (Froggatt, 1981; Rijkse and Bell, 1974). Wynn et al. (2005) identified soil texture as an important factor governing soil δ13C enrichment, with finer-textured soils being associated with a greater degree of δ13C enrichment with soil depth than coarse-textured soils. As discussed prior in reference to subsoil C variability, the variability in soil δ13C with depth may be a consequence of previous disturbances from land management practices which caused a mixing of topsoil and subsoil layers (Oliver et al., 2004). Down to 1 m soil depth, 14C abundance declined by 229 ‰, which is lower than the median global decline of 502 ‰ (Mathieu et al., 2015). However, the mean radiocarbon age of our deepest soil layers (∼ 1570 yr BP) corresponds well to the age of the soil parent materials. Soil parent materials were dominated by the Taupo eruption and this can be directly observed by the layers of Taupo lapilli on Waimihia, Rotoma, Waiohau, and Rotorua ash beds present in several of our subsoils. As these layers of Taupo lapilli have been dated as 1760 ± 80 yr BP before 1950 (Rijkse and Bell, 1974), we would not have expected any soil radiocarbon ages to have exceeded this value.
4.2 Soil microbial diversity and abundance changed with soil depth
Although microbial DNA abundance declined with depth, accumulatively subsoils held 49 % of bacterial and 33 % of fungal DNA abundance which corresponded to values for subsoil C stocks. Soil microorganisms are responsible for the mineralisation of SOC and are influential in determining SOC formation, composition, and persistence (Domeignoz-Horta et al., 2021; Jansson and Hofmockel, 2020). Although subsoil C is considered more resistant to microbial decomposition (Schmidt et al., 2011), an accumulation of microbial “stocks” in proximity to subsoil C stores presents concerns, particularly given our uncertainty on the effects of climate change on soil microbial activity and C substrate use (Yang et al., 2021). However, the contribution of microbial necromass C to total soil C is known to increase with soil depth (Ni et al., 2020). As our research does not provide information on the viability or activity of subsoil microbial DNA, much of the accumulated bacterial and fungal DNA in the subsoil may be non-viable microbial cells. Much like incorporating measures of soil C age and stability when quantifying subsoil C stocks, further research should measure the abundance of subsoil microbial cells which are viable and active, as well as those which are dormant but have the potential to become active under global change. Doing so will help us better investigate the vulnerability of subsoil C stocks to microbial decomposition under climate change.
Soil microbial diversity and abundance declined sharply with depth which fits in agreement with previous research findings (Blume et al., 2002; Eilers et al., 2012; Mundra et al., 2021; Rosling et al., 2003). These declines occurred alongside clear shifts in microbial community composition. The magnitude of the depth-driven changes slowed past 30 cm, which marked a clear transitional change between the topsoil–subsoil boundary. Although fungal diversity and DNA abundance were generally much lower than that of bacteria, patterns in response to depth were consistent across both microbial kingdoms. The changes in microbial diversity and abundance were highly correlated with the concentration (total C %) and radiocarbon age of soil C. These findings support research that has proposed declines in soil C quantity, quality, and availability to be strong drivers of declines in microbial diversity and abundance (Eilers et al., 2012). Due to their proximity to aboveground vegetation, topsoil layers typically receive a wider load and range of fresh C inputs from surface litter and plant roots (Fierer et al., 2003; Spohn et al., 2016). This may explain why soil depths 0–20 cm supported the greatest number of unique ASVs (i.e. those which occurred only in that soil layer), with the number of unique ASVs declining sharply with depth.
4.3 Shifts in community co-occurrence patterns with depth
Whilst bacterial diversity and abundance declined sharply with depth, bacterial subsoil communities exhibited relatively minor differences in network structure compared with topsoil communities. Furthermore, subsoil fungal networks exhibited greater structural differences between topsoil and subsoil layers compared with bacterial communities. Subsoil fungal networks were almost entirely disconnected and there was no suite of co-occurring fungal genera that characterised the subsoil microbiome. The breakdown in subsoil fungal network structure may be explained simplistically by reduced community size limiting the ability for fungal co-occurrences to establish. Although still in low abundance, the relatively larger bacterial community abundance may have contributed to the lesser effects of soil depth on their co-occurrence patterns compared with fungi. Furthermore, as the properties of soil fungal communities are strongly driven by characteristics of aboveground vegetation (Likulunga et al., 2021; Urbanová et al., 2015), the breakdown in subsoil fungal co-occurrences may be due to their increasing physical distance from the surface litter and plant rhizosphere.
4.4 Differential responses of microbial taxa between topsoil and subsoils
Consistent with previous research, we observed an increased abundance of archaeal taxa in subsoils, mainly the phyla Euryarchaeota, Crenarchaeota, and Woesearchaeota (Brewer et al., 2019; Eilers et al., 2012; Frey et al., 2021; Hartmann et al., 2009). Proposed reasons for the increased abundance of archaea with depth include their adaptation to chronic energy stress (Valentine, 2007), involvement as ammonia oxidizers in driving autotrophic nitrification in deep soil layers (Eilers et al., 2012), preference as methanogens for anaerobic environments (Feng et al., 2019), and adaptation to nutrient-poor environments as slow growing oligotrophs (Turner et al., 2017).
Several representatives of the bacterial phyla Acidobacteria and Firmicutes increased in abundance with depth which may be explained by their tolerance for nutrient-limited environments (Bai et al., 2017; Brewer et al., 2019; Frey et al., 2021; Feng et al., 2019; Lladó et al., 2017). However, there were several representatives of Acidobacteria and Firmicutes that also declined with depth, such as Candidatus Solibacter, Candidatus Koribacter, and Clostridiales. Hansel et al. (2008) reported high variability in the distribution of Acidobacteria subdivisions among different soil horizons. The broad phylogenetic coverage and ecological diversity of Acidobacteria can make it difficult to infer metabolic and functional adaptations based on their taxonomic position alone (Hansel et al., 2008). Such issues highlight the need to adopt more trait-based approaches when investigating the microbial taxa that exhibit adaptive responses to soil depth. For example, the large genome size of Candidatus Solibacter (Challacombe et al., 2011) may explain its high abundance in surface soils, which have a wide range of C and nutrient inputs and greater exposure to environmental flux (Barberán et al., 2014). Theoretically, soil depth may drive a reduction in microorganisms with large genome sizes, as specialisation becomes more favourable under harsh conditions and the maintenance of a larger genome becomes too energetically costly.
Strong declines in the abundance of Bacteroidetes with depth have been previously attributed to their copiotrophic behaviour (Eilers et al., 2012; Feng et al., 2019; Mundra et al., 2021). In our study, the abundance of Bacteroidetes was positively correlated with 14C abundance. This may indicate the phylum's preference for fast-cycling, bioavailable C which typically declines with depth as more chemically resistant, slow-cycling C forms a greater proportion of the C pool (Koarashi et al., 2012; Torn et al., 1997). Previous research has observed an increased abundance of Gemmatimonadetes with depth due to their preference for low soil moisture (Bai et al., 2017; Chu et al., 2016; Frey et al., 2021; Li et al., 2020; Seuradge et al., 2016; Zhang et al., 2019; Debruyn et al., 2011). This is inconsistent with our findings and may be explained by the highly permeable soils within Puruki Forest that exhibit a greater potential for soil moisture to increase with depth, with the subsoil horizons having a high moisture capacity (Beets and Brownlie, 1987; Will and Stone, 1967; Beets and Beets, 2020). Carteron et al. (2021) observed large shifts in the ratio of saprophytic : mycorrhizal abundance with soil depth, which correlated to changes in soil chemistry. In our study, soil depth was associated with large declines in fungal taxa (i.e. Mucoromycota, Rozellomycota, Mortierellomycota, and Glomeromycota) previously reported in the literature as saprophytic and rhizospheric fungi (Bonfante and Venice, 2020; Hoffmann et al., 2011; Wagner et al., 2013; Yurkov et al., 2016).
The findings of our research address knowledge gaps related to subsoil C dynamics for production forests such Puruki Forest. A considerable proportion (at least 35 %) of soil C stocks within Puruki Forest were allocated to the subsoil layers below 30 cm, with this value reaching up to 49 % in some soil cores. In the deepest soil layers, the mean C age was 1571 yr BP, which corresponded closely to the estimated age of the soil parent materials. Although there were large declines in bacterial and fungal DNA abundance and diversity with soil depth, the magnitude of these changes slowed past 30 cm depth. This marked a topsoil–subsoil transitional boundary in the soil profile. In total, 49 % of bacterial and 33 % of fungal DNA abundance was allocated to the subsoil. Quantifying the viable activity of this microbial “biomass” is essential for predicting the vulnerability of subsoil C stocks to microbial decomposition under climate change. Numerous archaeal taxa exhibited an increased abundance in subsoils, indicating their potential ecological importance in deep soil environments. Furthermore, numerous fungal and bacterial taxa exhibited significant differential abundances between topsoil and subsoil layers. This supports the notion that subsoil environments may act as an environmental filter, with the vertical distribution of soil microorganisms reflecting the sharp changes in soil physical and chemical properties with depth.
The R code and datasets generated during this current study are available from the corresponding author upon reasonable request.
The supplement related to this article is available online at: https://doi.org/10.5194/soil-9-55-2023-supplement.
AKB led the data processing, statistical analysis, original writing of the manuscript, and the preparation the manuscript for publication. LGG and SAW contributed to developing the methodology, research supervision, and project administration. CA and FD contributed to developing the methodology. All authors provided critical feedback and helped shape the research, analysis and manuscript.
The contact author has declared that none of the authors has any competing interests.
Publisher’s note: Copernicus Publications remains neutral with regard to jurisdictional claims in published maps and institutional affiliations.
Thanks to Angela Wakelin, Stephen Pearce, and Scion analytical laboratory services (Scion, NZ). Further thanks to Jeff Hatten (Oregon State University, US) and Katherine Heckman (U.S. Department of Agriculture, US) for their assistance in the soil radiocarbon analysis.
This research has been supported by the New Zealand Ministry of Business, Innovation and Employment (MBIE) Strategic Science Investment Fund held by Scion (grant no. C04X1703).
This paper was edited by Ashish Malik and reviewed by Qiufang Zhang and one anonymous referee.
Abarenkov, K., Zirk, A., Piirmann, T., Pöhönen, R., Ivanov, F., Nilsson, R. H., and Kõljalg, U.: UNITE general FASTA release for Fungi, UNITE Community [data set], https://doi.org/10.15156/BIO/1280049, 2021.
Arbizu, P. M.: pairwiseAdonis: Pairwise Multilevel Comparison using Adonis, GitHub repository [code], https://github.com/pmartinezarbizu/pairwiseAdonis.git, 2017.
Bai, R., Wang, J.-T., Deng, Y., He, J.-Z., Feng, K., and Zhang, L.-M.: Microbial Community and Functional Structure Significantly Varied among Distinct Types of Paddy Soils But Responded Differently along Gradients of Soil Depth Layers, Front Microbiol., 8, 945, https://doi.org/10.3389/fmicb.2017.00945, 2017.
Balesdent, J., Basile-Doelsch, I., Chadoeuf, J., Cornu, S., Derrien, D., Fekiacova, Z., and Hatté, C.: Atmosphere–soil carbon transfer as a function of soil depth, Nature, 559, 599–602, https://doi.org/10.1038/s41586-018-0328-3, 2018.
Barberán, A., Ramirez, K. S., Leff, J. W., Bradford, M. A., Wall, D. H., and Fierer, N.: Why are some microbes more ubiquitous than others? Predicting the habitat breadth of soil bacteria, Ecol. Lett., 17, 794–802, https://doi.org/10.1111/ele.12282, 2014.
Batjes, N. H.: Total carbon and nitrogen in the soils of the world, Europ. J. Soil Sci., 47, 151–163, 1996.
Beets, P. and Brownlie, R.: Puruki experimental catchment: site, climate, forest management, and research, New Zeal. J. For. Sci., 17, 137–160, 1987.
Beets, P. N. and Beets, J. M.: Soil water storage changes in a small headwater catchment in the central North Island of New Zealand following afforestation with Pinus radiata, Forest Ecol. Manag., 462, 117967, https://doi.org/10.1016/j.foreco.2020.117967, 2020.
Beets, P., Oliver, G., and Clinton, P.: Soil carbon protection in podocarp/hardwood forest, and effects of conversion to pasture and exotic pine forest, Environ. Pollut., 116, 63–73, https://doi.org/10.1016/S0269-7491(01)00248-2, 2002.
Beets, P. N., Oliver, G. R., Kimberley, M. O., Pearce, S. H., and Rodgers, B.: Genetic and soil factors associated with variation in visual magnesium deficiency symptoms in Pinus radiata, Forest Ecol. Manag., 189, 263–279, https://doi.org/10.1016/j.foreco.2003.08.013, 2004.
Blakemore, L. C., Searle, P. L., and Daly, B. K.: Methods for chemical analysis of soils, Department of Scientific and Industrial Research, New Zealand, https://doi.org/10.7931/DL1-SBSR-10A, 1977.
Blume, E., Bischoff, M., Reichert, J., Moorman, T., Konopka, A., and Turco, R.: Surface and subsurface microbial biomass, community structure and metabolic activity as a function of soil depth and season, Appl. Soil Ecol., 20, 171–181, 2002.
Bokulich, N. A. and Mills, D. A.: Improved Selection of Internal Transcribed Spacer-Specific Primers Enables Quantitative, Ultra-High-Throughput Profiling of Fungal Communities, Appl. Environ. Microbiol., 79, 2519–2526, https://doi.org/10.1128/AEM.03870-12, 2013.
Bonfante, P. and Venice, F.: Mucoromycota: going to the roots of plant-interacting fungi, Fungal Biol. Rev., 34, 100–113, https://doi.org/10.1016/j.fbr.2019.12.003, 2020.
Bray, R. H. and Kurtz, L. T.: Determination of total, organic, and available forms of phosphorus in soils, Soil Sci., 59, 39–46, https://doi.org/10.1097/00010694-194501000-00006, 1945.
Brewer, T. E., Aronson, E. L., Arogyaswamy, K., Billings, S. A., Botthoff, J. K., Campbell, A. N., Dove, N. C., Fairbanks, D., Gallery, R. E., Hart, S. C., Kaye, J., King, G., Logan, G., Lohse, K. A., Maltz, M. R., Mayorga, E., O'Neill, C., Owens, S. M., Packman, A., Pett-Ridge, J., Plante, A. F., Richter, D. D., Silver, W. L., Yang, W. H., and Fierer, N.: Ecological and Genomic Attributes of Novel Bacterial Taxa That Thrive in Subsurface Soil Horizons, mBio, 10, e01318–01319, https://doi.org/10.1128/mBio.01318-19, 2019.
Brownlie, R. and Kelliher, F.: Puruki Forest climate: Measurement techniques, database, preliminary analyses, FRI bulletin No. 147, Scion, ISSN 0111-8129, 1989.
Callahan, B. J., McMurdie, P. J., Rosen, M. J., Han, A. W., Johnson, A. J. A., and Holmes, S. P.: DADA2: High-resolution sample inference from Illumina amplicon data, Nat. Method., 13, 581–583, https://doi.org/10.1038/nmeth.3869, 2016.
Caporaso, J. G., Lauber, C. L., Walters, W. A., Berg-Lyons, D., Huntley, J., Fierer, N., Owens, S. M., Betley, J., Fraser, L., and Bauer, M.: Ultra-high-throughput microbial community analysis on the Illumina HiSeq and MiSeq platforms, ISME J., 6, 1621–1624, 2012.
Carteron, A., Beigas, M., Joly, S., Turner, B. L., and Laliberté, E.: Temperate Forests Dominated by Arbuscular or Ectomycorrhizal Fungi Are Characterized by Strong Shifts from Saprotrophic to Mycorrhizal Fungi with Increasing Soil Depth, Microb. Ecol., 82, 377–390, https://doi.org/10.1007/s00248-020-01540-7, 2021.
Caspi, R., Billington, R., Fulcher, C. A., Keseler, I. M., Kothari, A., Krummenacker, M., Latendresse, M., Midford, P. E., Ong, Q., Ong, W. K., Paley, S., Subhraveti, P., and Karp, P. D.: The MetaCyc database of metabolic pathways and enzymes, Nucl. Acid. Res., 46, D633–D639, https://doi.org/10.1093/nar/gkx935, 2018.
Chabbi, A., Kögel-Knabner, I., and Rumpel, C.: Stabilised carbon in subsoil horizons is located in spatially distinct parts of the soil profile, Soil Biol. Biochem., 41, 256–261, 2009.
Challacombe, J., Eichorst, S., Hauser, L., Land, M., Xie, G., and Kuske, C.: Biological Consequences of Ancient Gene Acquisition and Duplication in the Large Genome of Candidatus Solibacter usitatus Ellin6076, PLoS ONE, 6, e24882, https://doi.org/10.1371/journal.pone.0024882, 2011.
Chu, H., Sun, H., Tripathi, B. M., Adams, J. M., Huang, R., Zhang, Y., and Shi, Y.: Bacterial community dissimilarity between the surface and subsurface soils equals horizontal differences over several kilometers in the western Tibetan Plateau, Environ. Microbiol., 18, 1523–1533, https://doi.org/10.1111/1462-2920.13236, 2016.
Csárdi, G. and Nepusz, T.: The igraph software package for complex network research, InterJournal, Complex Systems, 1695 pp., https://igraph.org/, 2006.
Curd, E. E., Martiny, J. B., Li, H., and Smith, T. B.: Bacterial diversity is positively correlated with soil heterogeneity, Ecosphere, 9, e02079, https://doi.org/10.1002/ecs2.2079, 2018.
DeBruyn, J. M., Nixon, L. T., Fawaz, M. N., Johnson, A. M., and Radosevich, M.: Global Biogeography and Quantitative Seasonal Dynamics of Gemmatimonadetes in Soil, Appl. Environ. Microbiol., 77, 6295–6300, https://doi.org/10.1128/AEM.05005-11, 2011.
Domeignoz-Horta, L. A., Shinfuku, M., Junier, P., Poirier, S., Verrecchia, E., Sebag, D., and DeAngelis, K. M.: Direct evidence for the role of microbial community composition in the formation of soil organic matter composition and persistence, ISME Commun., 1, 64, https://doi.org/10.1038/s43705-021-00071-7, 2021.
Douglas, G., Mackay, A., Vibart, R., Dodd, M., McIvor, I., and McKenzie, C.: Soil carbon stocks under grazed pasture and pasture-tree systems, Sci. Total Environ., 715, 136910, https://doi.org/10.1016/j.scitotenv.2020.136910, 2020.
Eilers, K. G., Debenport, S., Anderson, S., and Fierer, N.: Digging deeper to find unique microbial communities: the strong effect of depth on the structure of bacterial and archaeal communities in soil, Soil Biol. Biochem., 50, 58–65, 2012.
Fang, C., Smith, P., Moncrieff, J. B., and Smith, J. U.: Similar response of labile and resistant soil organic matter pools to changes in temperature, Nature, 433, 57–59, 2005.
Feng, H., Guo, J., Wang, W., Song, X., and Yu, S.: Soil Depth Determines the Composition and Diversity of Bacterial and Archaeal Communities in a Poplar Plantation, Forests, 10, 550, https://doi.org/10.3390/f10070550, 2019.
Fierer, N., Allen, A. S., Schimel, J. P., and Holden, P. A.: Controls on microbial CO2 production: a comparison of surface and subsurface soil horizons, Glob. Change Biol., 9, 1322–1332, https://doi.org/10.1046/j.1365-2486.2003.00663.x, 2003.
Frey, B., Walthert, L., Perez-Mon, C., Stierli, B., Köchli, R., Dharmarajah, A., and Brunner, I.: Deep Soil Layers of Drought-Exposed Forests Harbor Poorly Known Bacterial and Fungal Communities, Front Microbiol., 12, 674160, https://doi.org/10.3389/fmicb.2021.674160, 2021.
Froggatt, P. C.: Stratigraphy and nature of Taupo Pumice Formation, New Zeal. J. Geol. Geophys., 24, 231–248, https://doi.org/10.1080/00288306.1981.10422715, 1981.
Garrett, L. G., Wakelin, S. A., Pearce, S. H., Wakelin, S. J., and Barnard, T.: Puruki Experimental Forest – half a century of forestry research, New Zeal. J. Forest., 66, 3–10, 2021.
Garten, C. T., Hanson, P. J., Todd, D. E., Lu, B. B., Brice, D. J., Lajtha, K., and Michener, R.: Natural 15N-and 13C-abundance as indicators of forest nitrogen status and soil carbon dynamics, Stable Isotopes, Ecol. Environ. Sci., 61, 61–82, 2008.
Garten, C. T.: Comparison of forest soil carbon dynamics at five sites along a latitudinal gradient, Geoderma, 167/168, 30–40, https://doi.org/10.1016/j.geoderma.2011.08.007, 2011.
Gattinger, A., Muller, A., Haeni, M., Skinner, C., Fliessbach, A., Buchmann, N., Mäder, P., Stolze, M., Smith, P., Scialabba, N. E. H., and Niggli, U.: Enhanced topsoil carbon stocks under organic farming, P. Natl. Acad. Sci. USA, 109, 18226–18231, 2012.
Gonzalez, Y. N., Bacon, A. R., and Harris, W. G.: A Billion Tons of Unaccounted for Carbon in the Southeastern United States, Geophys. Res. Lett., 45, 7580–7587, https://doi.org/10.1029/2018GL077540, 2018.
Gross, C. D. and Harrison, R. B.: The Case for Digging Deeper: Soil Organic Carbon Storage, Dynamics, and Controls in Our Changing World, Soil Syst., 3, 28, https://doi.org/10.3390/soilsystems3020028, 2019.
Hansel, C. M., Fendorf, S., Jardine, P. M., and Francis, C. A.: Changes in bacterial and archaeal community structure and functional diversity along a geochemically variable soil profile, Appl. Environ. Microbiol., 74, 1620–1633, 2008.
Hao, J., Chai, Y. N., Lopes, L. D., Ordóñez, R. A., Wright, E. E., Archontoulis, S., and Schachtman, D. P.: The Effects of Soil Depth on the Structure of Microbial Communities in Agricultural Soils in Iowa (United States), Appl. Environ. Microbiol., 87, e02673-20, https://doi.org/10.1128/AEM.02673-20, 2021.
Hartmann, M., Lee, S., Hallam, S. J., and Mohn, W. W.: Bacterial, archaeal and eukaryal community structures throughout soil horizons of harvested and naturally disturbed forest stands, Environ. Microbiol., 11, 3045–3062, 2009.
Hewitt, A. E.: New Zealand soil classification, Landcare Research Science Series, No. 1, 3rd Edn., 136 pp., https://doi.org/10.7931/DL1-LRSS-1-2010, 2010.
Hoffmann, K., Voigt, K., and Kirk, P.: Mortierellomycotina subphyl. nov., based on multi-gene genealogies, Mycotaxon, 115, 353–363, https://doi.org/10.5248/115.353, 2011.
Hoggard, M., Vesty, A., Wong, G., Montgomery, J. M., Fourie, C., Douglas, R. G., Biswas, K., and Taylor, M. W.: Characterizing the Human Mycobiota: A Comparison of Small Subunit rRNA, ITS1, ITS2, and Large Subunit rRNA Genomic Targets, Front Microbiol., 9, 2208, https://doi.org/10.3389/fmicb.2018.02208, 2018.
Jandl, R., Lindner, M., Vesterdal, L., Bauwens, B., Baritz, R., Hagedorn, F., Johnson, D. W., Minkkinen, K., and Byrne, K. A.: How strongly can forest management influence soil carbon sequestration?, Geoderma, 137, 253–268, https://doi.org/10.1016/j.geoderma.2006.09.003, 2007.
Jansson, J. K. and Hofmockel, K. S.: Soil microbiomes and climate change, Nat. Rev. Microbiol., 18, 35–46, 2020.
Jastrow, J. D., Amonette, J. E., and Bailey, V. L.: Mechanisms controlling soil carbon turnover and their potential application for enhancing carbon sequestration, Climatic Change, 80, 5–23, https://doi.org/10.1007/s10584-006-9178-3, 2007.
Jobbágy, E. and Jackson, R.: The Vertical Distribution of Soil Organic Carbon and Its Relation to Climate and Vegetation, Ecol. Appl., 10, 423–436, https://doi.org/10.2307/2641104, 2000.
Jones, H. S., Garrett, L. G., Beets, P. N., Kimberley, M. O., and Oliver, G. R.: Impacts of harvest residue management on soil carbon stocks in a plantation forest, Soil Sci. Soc. Am. J., 72, 1621–1627, https://doi.org/10.2136/sssaj2007.0333, 2008.
Koarashi, J., Hockaday, W. C., Masiello, C. A., and Trumbore, S. E.: Dynamics of decadally cycling carbon in subsurface soils, J. Geophys. Res.-Biogeo., 117, G03033, https://doi.org/10.1029/2012JG002034, 2012.
Kurtz, Z. D., Müller, C. L., Miraldi, E. R., Littman, D. R., Blaser, M. J., and Bonneau, R. A.: Sparse and Compositionally Robust Inference of Microbial Ecological Networks, PLOS Comput. Biol., 11, e1004226, https://doi.org/10.1371/journal.pcbi.1004226, 2015.
Kuzyakov, Y. and Blagodatskaya, E.: Microbial hotspots and hot moments in soil: Concept and review, Soil Biol. Biochem., 83, 184–199, https://doi.org/10.1016/j.soilbio.2015.01.025, 2015.
Kuzyakov, Y.: Priming effects: Interactions between living and dead organic matter, Soil Biol. Biochem., 42, 1363–1371, https://doi.org/10.1016/j.soilbio.2010.04.003, 2010.
Lal, R.: Soil Carbon Sequestration Impacts on Global Climate Change and Food Security, Science, 304, 1623–1627, https://doi.org/10.1126/science.1097396, 2004.
Li, X., Wang, H., Li, X., Li, X., and Zhang, H.: Distribution characteristics of fungal communities with depth in paddy fields of three soil types in China, J. Microbiol., 58, 279–287, https://doi.org/10.1007/s12275-020-9409-8, 2020.
Likulunga, L. E., Rivera Pérez, C. A., Schneider, D., Daniel, R., and Polle, A.: Tree species composition and soil properties in pure and mixed beech-conifer stands drive soil fungal communities, Forest Ecol. Manag., 502, 119709, https://doi.org/10.1016/j.foreco.2021.119709, 2021.
Lin, H. and Peddada, S. D.: Analysis of microbial compositions: a review of normalization and differential abundance analysis, NPJ Biofilms Microbiomes, 6, 60, https://doi.org/10.1038/s41522-020-00160-w, 2020.
Lladó, S., López-Mondéjar, R., and Baldrian, P.: Forest Soil Bacteria: Diversity, Involvement in Ecosystem Processes, and Response to Global Change, Microbiol. Mol. Biol. R., 81, e00063-16, https://doi.org/10.1128/MMBR.00063-16, 2017.
Mathieu, J. A., Hatté, C., Balesdent, J., and Parent, É.: Deep soil carbon dynamics are driven more by soil type than by climate: a worldwide meta-analysis of radiocarbon profiles, Glob. Change Biol., 21, 4278–4292, 2015.
McMurdie, P. J. and Holmes, S.: phyloseq: An R Package for Reproducible Interactive Analysis and Graphics of Microbiome Census Data, Plos One, 8, e61217, https://doi.org/10.1371/journal.pone.0061217, 2013.
Mukul, S. A., Halim, M. A., and Herbohn, J.: Forest carbon stock and fluxes: distribution, biogeochemical cycles, and measurement techniques, Life on Land, Encyclopedia of the UN Sustainable Development Goals; Leal Filho, edited by: Azul, W., Brandli, A. M., Lange Salvia, L., Wall, A., T., Life on Land, Encyclopedia of the UN Sustainable Development Goals, Springer, 365–380, https://doi.org/10.1007/978-3-319-71065-5_23-1, 2020.
Mundra, S., Kjonaas, O. J., Morgado, L. N., Krabberod, A. K., Ransedokken, Y., and Kauserud, H.: Soil depth matters: shift in composition and inter-kingdom co-occurrence patterns of microorganisms in forest soils, FEMS Microbiol. Ecol., 97, fiab022, https://doi.org/10.1093/femsec/fiab022, 2021.
Ni, X., Liao, S., Tan, S., Peng, Y., Wang, D., Yue, K., Wu, F., and Yang, Y.: The vertical distribution and control of microbial necromass carbon in forest soils, Global Ecol. Biogeogr., 29, 1829–1839, https://doi.org/10.1111/geb.13159, 2020.
Oksanen, J., Blanchet, F. G., Friendly, M., Kindt, R., Legendre, P., McGlinn, D., Minchin, P. R., O'Hara, R. B., Simpson, G. L., Solymos, P., and Stevens, M. H. H.: vegan: Community Ecology Package, R package version 2.5-6, 2019 [code], https://github.com/vegandevs/vegan, 2020.
Oliver, G., Beets, P., Garrett, L., Pearce, S. H., Kimberley, M., Ford-Robertson, J. B., and Robertson, K.: Variation in soil carbon in pine plantations and implications for monitoring soil carbon stocks in relation to land-use change and forest site management in New Zealand, Forest Ecol. Manag., 203, 283–295, https://doi.org/10.1016/j.foreco.2004.07.045, 2004.
Paul, A., Balesdent, J., and Hatté, C.: 13C-14C relations reveal that soil 13C-depth gradient is linked to historical changes in vegetation 13C, Plant Soil, 447, 305–317, https://doi.org/10.1007/s11104-019-04384-4, 2020.
Poage, M. A. and Feng, X.: A theoretical analysis of steady state δ13C profiles of soil organic matter, Global Biogeochem. Cy., 18, GB2016, https://doi.org/10.1029/2003GB002195, 2004.
Rayment, G. E. and Lyons, D. J.: Soil chemical methods: Australasia, Vol. 3, CSIRO Publishing, ISBN 9780643101364, 2011.
Revelle, W.: psych: Procedures for Personality and Psychological Research, R package version 2.2.9, Northwestern University [code], https://CRAN.R-project.org/package=psych, 2021.
Rijkse, W. C. and Bell, J.: Soils of Purukohukohu IHD Experimental Basin, Rotorua County, North Island, New Zealand, NZ soil survey report, Department of Scientific and Industrial Research, https://doi.org/10.7931/DL1-SSR-18, 1974.
Rosling, A., Landeweert, R., Lindahl, B. D., Larsson, K. H., Kuyper, T. W., Taylor, A. F. S., and Finlay, R. D.: Vertical distribution of ectomycorrhizal fungal taxa in a podzol soil profile, New Phytol., 159, 775–783, https://doi.org/10.1046/j.1469-8137.2003.00829.x, 2003.
Ross, C. W., Grunwald, S., Vogel, J. G., Markewitz, D., Jokela, E. J., Martin, T. A., Bracho, R., Bacon, A. R., Brungard, C. W., and Xiong, X.: Accounting for two-billion tons of stabilized soil carbon, Sci. Total Environ., 703, 134615, https://doi.org/10.1016/j.scitotenv.2019.134615, 2020.
Russel, J.: Russel88/MicEco: v0.9.15 (v0.9.15), Zenodo [code], https://doi.org/10.5281/zenodo.4733747, 2021.
Schmidt, M. W. I., Torn, M. S., Abiven, S., Dittmar, T., Guggenberger, G., Janssens, I. A., Kleber, M., Kögel-Knabner, I., Lehmann, J., Manning, D. A. C., Nannipieri, P., Rasse, D. P., Weiner, S., and Trumbore, S. E.: Persistence of soil organic matter as an ecosystem property, Nature, 478, 49–56, https://doi.org/10.1038/nature10386, 2011.
Seuradge, B. J., Oelbermann, M., and Neufeld, J. D.: Depth-dependent influence of different land-use systems on bacterial biogeography, FEMS Microbiol. Ecol., 93, fiw239, https://doi.org/10.1093/femsec/fiw239, 2016.
Shahsavari, E., Aburto-Medina, A., Taha, M., and Ball, A. S.: A quantitative PCR approach for quantification of functional genes involved in the degradation of polycyclic aromatic hydrocarbons in contaminated soils, MethodsX, 3, 205–211, https://doi.org/10.1016/j.mex.2016.02.005, 2016.
Shannon, P., Markiel, A., Ozier, O., Baliga, N. S., Wang, J. T., Ramage, D., Amin, N., Schwikowski, B., and Ideker, T.: Cytoscape: a software environment for integrated models of biomolecular interaction networks, Genome Res., 13, 2498–2504, https://doi.org/10.1101/gr.1239303, 2003.
Silver, W. L., Neff, J., McGroddy, M., Veldkamp, E., Keller, M., and Cosme, R.: Effects of Soil Texture on Belowground Carbon and Nutrient Storage in a Lowland Amazonian Forest Ecosystem, Ecosystems, 3, 193–209, https://doi.org/10.1007/s100210000019, 2000.
Six, J., Callewaert, P., Lenders, S., De Gryze, S., Morris, S., Gregorich, E., Paul, E., and Paustian, K.: Measuring and understanding carbon storage in afforested soils by physical fractionation, Soil Sci. Soc. Am. J., 66, 1981–1987, 2002.
Song, W., Tong, X., Liu, Y., and Li, W.: Microbial Community, Newly Sequestered Soil Organic Carbon, and δ15N Variations Driven by Tree Roots, Front Microbiol., 11, 314, https://doi.org/10.3389/fmicb.2020.00314, 2020.
Sparks, D. L., Page, A. L., Helmke, P. A., Loeppert, R. H., Soltanpour, P. N., Tabatabai, M. A., Johnston, C. T., and Sumner, M. E.: Methods of Soil Analysis, Part 3 – Chemical Methods, Soil Science Society of America, 551–574, https://doi.org/10.2136/sssabookser5.3, 1996.
Spohn, M., Klaus, K., Wanek, W., and Richter, A.: Microbial carbon use efficiency and biomass turnover times depending on soil depth – Implications for carbon cycling, Soil Biol. Biochem., 96, 74–81, https://doi.org/10.1016/j.soilbio.2016.01.016, 2016.
Stuiver, M. and Polach, H. A.: Discussion Reporting of 14C Data, Radiocarbon, 19, 355–363, https://doi.org/10.1017/S0033822200003672, 1977.
Štursová, M., Bárta, J., Šantrůčková, H., and Baldrian, P.: Small-scale spatial heterogeneity of ecosystem properties, microbial community composition and microbial activities in a temperate mountain forest soil, FEMS Microbiol. Ecol., 92, fiw185, https://doi.org/10.1093/femsec/fiw185, 2016.
Taylor, M.: Determination of total phosphorus in soil using simple Kjeldahl digestion, Commun. Soil Sci. Plant Anal., 31, 2665–2670, 2000.
Telles, E. de C. C., de Camargo, P. B., Martinelli, L. A., Trumbore, S. E., da Costa, E. S., Santos, J., Higuchi, N., and Oliveira Jr., R. C.: Influence of soil texture on carbon dynamics and storage potential in tropical forest soils of Amazonia, Global Biogeochem. Cy., 17, 1040, https://doi.org/10.1029/2002GB001953, 2003.
Torn, M. S., Trumbore, S. E., Chadwick, O. A., Vitousek, P. M., and Hendricks, D. M.: Mineral control of soil organic carbon storage and turnover, Nature, 389, 170–173, https://doi.org/10.1038/38260, 1997.
Turner, S., Mikutta, R., Meyer-Stüve, S., Guggenberger, G., Schaarschmidt, F., Lazar, C. S., Dohrmann, R., and Schippers, A.: Microbial Community Dynamics in Soil Depth Profiles Over 120,000 Years of Ecosystem Development, Front Microbiol., 8, 874, https://doi.org/10.3389/fmicb.2017.00874, 2017.
Urbanová, M., Šnajdr, J., and Baldrian, P.: Composition of fungal and bacterial communities in forest litter and soil is largely determined by dominant trees, Soil Biol. Biochem., 84, 53–64, https://doi.org/10.1016/j.soilbio.2015.02.011, 2015.
Valentine, D. L.: Adaptations to energy stress dictate the ecology and evolution of the Archaea, Nat. Rev. Microbiol., 5, 316–323, https://doi.org/10.1038/nrmicro1619, 2007.
Vogel, J., Nelson, D., and Southon, J.: 14C Background Levels in An Accelerator Mass Spectrometry System, Radiocarbon, 29, 323–333, https://doi.org/10.1017/S0033822200043733, 1987.
Wagner, L., Stielow, B., Hoffmann, K., Petkovits, T., Papp, T., Vágvölgyi, C., De Hoog, G., Verkley, G., and Voigt, K.: A comprehensive molecular phylogeny of the Mortierellales (Mortierellomycotina) based on nuclear ribosomal DNA, Persoonia-Molecular Phylogeny and Evolution of Fungi, 30, 77–93, 2013.
Wang, C., Houlton, B. Z., Liu, D., Hou, J., Cheng, W., and Bai, E.: Stable isotopic constraints on global soil organic carbon turnover, Biogeosciences, 15, 987–995, https://doi.org/10.5194/bg-15-987-2018, 2018.
Wang, Q., Garrity, G. M., Tiedje, J. M., and Cole, J. R.: Naive Bayesian classifier for rapid assignment of rRNA sequences into the new bacterial taxonomy, Appl. Environ. Microbiol., 73, 5261–5267, 2007.
Will, G. and Stone, E.: Pumice soils as a medium for tree growth. 1. Moisture storage capacity, New Zeal. J. Forest., 12, 189–199, 1967.
Wynn, J. G., Bird, M. I., and Wong, V. N.: Rayleigh distillation and the depth profile of 13C 12C ratios of soil organic carbon from soils of disparate texture in Iron Range National Park, Far North Queensland, Australia, Geochim. Cosmochim. Ac., 69, 1961–1973, 2005.
Yang, Y., Li, T., Wang, Y., Cheng, H., Chang, S. X., Liang, C., and An, S.: Negative effects of multiple global change factors on soil microbial diversity, Soil Biol. Biochem., 156, 108229, https://doi.org/10.1016/j.soilbio.2021.108229, 2021.
Yost, J. L. and Hartemink, A. E.: How deep is the soil studied – an analysis of four soil science journals, Plant Soil, 452, 5–18, https://doi.org/10.1007/s11104-020-04550-z, 2020.
Yu, G., Smith, D. K., Zhu, H., Guan, Y., and Lam, T. T.-Y.: ggtree: an r package for visualization and annotation of phylogenetic trees with their covariates and other associated data, Method. Ecol. Evol., 8, 28–36, https://doi.org/10.1111/2041-210X.12628, 2017.
Yurkov, A. M., Wehde, T., Federici, J., Schäfer, A. M., Ebinghaus, M., Lotze-Engelhard, S., Mittelbach, M., Prior, R., Richter, C., Röhl, O., and Begerow, D.: Yeast diversity and species recovery rates from beech forest soils, Mycol. Prog., 15, 845–859, https://doi.org/10.1007/s11557-016-1206-8, 2016.
Zhang, C., Tayyab, M., Abubakar, A. Y., Yang, Z., Pang, Z., Islam, W., Lin, Z., Li, S., Luo, J., Fan, X., Fallah, N., and Zhang, H.: Bacteria with Different Assemblages in the Soil Profile Drive the Diverse Nutrient Cycles in the Sugarcane Straw Retention Ecosystem, Diversity, 11, 194, https://doi.org/10.3390/d11100194, 2019.