the Creative Commons Attribution 4.0 License.
the Creative Commons Attribution 4.0 License.
 | 21 Oct 2022
The Surface Water Chemistry (SWatCh) database: a standardized global database of water chemistry to facilitate large-sample hydrological research
Lobke Rotteveel
Franz Heubach
Shannon M. Sterling
Openly accessible global-scale surface water chemistry datasets are urgently needed to detect widespread trends and problems, to help identify their possible solutions, and to determine critical spatial data gaps where more monitoring is required. Existing datasets are limited with respect to availability, sample size and/or sampling frequency, and geographic scope. These limitations inhibit researchers from tackling emerging transboundary water chemistry issues – for example, the detection and understanding of delayed recovery from freshwater acidification. Here, we begin to address these limitations by compiling the global Surface Water Chemistry (SWatCh) database, available on Zenodo (https://doi.org/10.5281/zenodo.6484939; Rotteveel and Heubach, 2021). We collect, clean, standardize, and aggregate open-access data provided by six national and international programs and research groups (United Nations Environment Programme; Hartmann et al., 2019; Environment and Climate Change Canada; the United States of America National Water Quality Monitoring Council; the European Environment Agency; and the United States National Science Foundation McMurdo Dry Valleys Long-Term Ecological Research Network) in order to compile a database containing information on sites, methods, and samples, and a geospatial information system (GIS) shapefile of site locations. We remove poor-quality data (e.g., values flagged as “suspect” or “rejected”), standardize variable naming conventions and units, and perform other data cleaning steps required for statistical analysis. The database contains water chemistry data for streams, rivers, canals, ponds, lakes, and reservoirs across seven continents, 24 variables, 33 722 sites, and over 5 million samples collected between 1960 and 2022. Similar to prior research, we identify critical spatial data gaps on the African and Asian continents, highlighting the need for more data collection and sharing initiatives in these areas, especially considering that freshwater ecosystems in these environs are predicted to be among the most heavily impacted by climate change. We identify the main challenges associated with compiling global databases – limited data availability, dissimilar sample collection and analysis methodology, and reporting ambiguity – and provide recommended solutions. By addressing these challenges and consolidating data from various sources into one standardized, openly available, high-quality, and transboundary database, SWatCh allows users to conduct powerful and robust statistical analyses of global surface water chemistry.
- Article
(2104 KB) - Full-text XML
- BibTeX
- EndNote


Globally, 159 million people are reliant on untreated surface water, with only 1 in 3 people having access to safely managed drinking water services (World Health Organization and United Nations Children's Fund, 2017). With two-thirds of the global population (4.0 billion people) already experiencing water shortages at least 1 month per year (Mekonnen and Hoekstra, 2016) and 4.8–5.7 billion people projected to experience water shortages by 2050 (Burek et al., 2016), maintaining the quality of drinking water sources is paramount to human health and society. One of the main obstacles to achieving this goal is a lack of openly available, high-quality, transboundary data (World Health Organization and United Nations Children's Fund, 2017). Existing large-sample water quality datasets have (1) limited availability – for example, raw data may not be published with journal articles (Alsheikh-Ali et al., 2011); (2) limited sample size – for example, datasets may only include one waterbody type (Hartmann et al., 2014); or (3) limited geographic scope – for example, national datasets only include data for one country.
Delayed acidification recovery is an example of a transboundary problem which would benefit from a large-sample dataset. Here, we define a “transboundary problem” to be a water quality issue, or cause of a water quality issue, which crosses international borders. For example, a main driver of freshwater acidification in Atlantic Canada is acid deposition originating from all of the major production regions in North America, including those in the USA (Shaw, 1979). A similar definition of transboundary problem is often used when discussing water availability issues that cross international borders (e.g., Thu and Wehn, 2016). Ecosystem acidification and associated elevated aluminum (Al) concentrations are responsible for the loss of economically significant fish species (Committee on the Status of Endangered Wildlife in Canada, 2011; Dennis and Clair, 2012); reductions in crop success (Collignon et al., 2012); reduced forest health (Collignon et al., 2012; DeHayes et al., 1999; de Wit et al., 2010); and, therefore, carbon sequestration and the increased cost of water treatment (Letterman and Driscoll, 1988). Furthermore, high Al in drinking water resources may contribute to human osteological and neurological diseases (World Health Organization, 2010). Prior large-sample (Björnerås et al., 2017; Monteith et al., 2007) and global-scale (Weyhenmeyer et al., 2019) studies on freshwater acidification have indicated that recovery is delayed in some regions. However, to date, there is no openly available global-scale database of acidification-related water chemistry that includes Al, the increased concentrations of which are one of the most biotically toxic effects of acidification (Gensemer and Playle, 1999).
There is a need for harmonized large-sample hydrological research (Blöschl et al., 2019), and global datasets are required to develop global water chemistry models (Harrison et al., 2005a, b). The majority of water quality research has focused on catchment-scale datasets, which narrows our understanding of hydrochemical processes to catchments that have historically been studied. Catchment-scale analyses make valuable contributions to our understanding of hydrochemical processes; however, variability in catchment response to perturbation, which is potentially indicative of variability in hydrochemical processes, is difficult to evaluate in a robust manner without an approach that assesses multiple catchments/regions in a harmonized way. In the case of freshwater acidification, the water chemistry response to acid deposition may be altered by geology and land use/land cover; thus, observations made in one watershed/region may not generalize to others (e.g., Clair et al., 2011; Rotteveel and Sterling, 2020). For example, the watershed response to acid deposition is influenced by weak acids in regions with slow-weathering, base cation (CB) poor bedrock but not in regions with higher CB geology (Clair et al., 2011; Stoddard et al., 1999), and watersheds with high-intensity forest harvesting may be more strongly affected by acid deposition than those with less disturbance (Aherne et al., 2008; Feller, 2005).
Obtaining and consolidating water chemistry datasets for transboundary hydrological research is challenging due to limited data access as well as disparate (i.e., dissimilar) data collection programs and data reporting formats. Access may be limited because data are not published and/or kept confidential, as is the case for some sites within the United Nations International Centre for Water Resources and Global Change's Global Water Quality Database and Information System (GEMStat). Data collection programs are dissimilar largely due to a lack of international variable and analysis method definitions (World Health Organization and United Nations Children's Fund, 2017). For example, Al measurements may not be comparable across different functional, operational, and classical species definitions (Namieśnik and Rabajczyk, 2010; Ščančar and Milačič, 2006). Lastly, disparate variable naming conventions, units, and censored data notation complicate the consolidation of datasets from different sources, as these notations must first be standardized.
Here, we aim to address the above limitations by contributing an openly available, standardized, easy-to-use, global water chemistry database. We focus on providing data to address the problem of delayed freshwater acidification recovery by collecting, cleaning, standardizing, and compiling datasets of acidification-related water chemistry variables. Specifically, our research goals are (1) to develop a global database of acidification-related surface water chemistry, (2) to identify the main limitations associated with compiling this database, (3) to identify and characterize critical spatial data gaps within existing datasets, and (4) to provide recommendations for data reporting and storage to facilitate its easy access and use by other researchers.
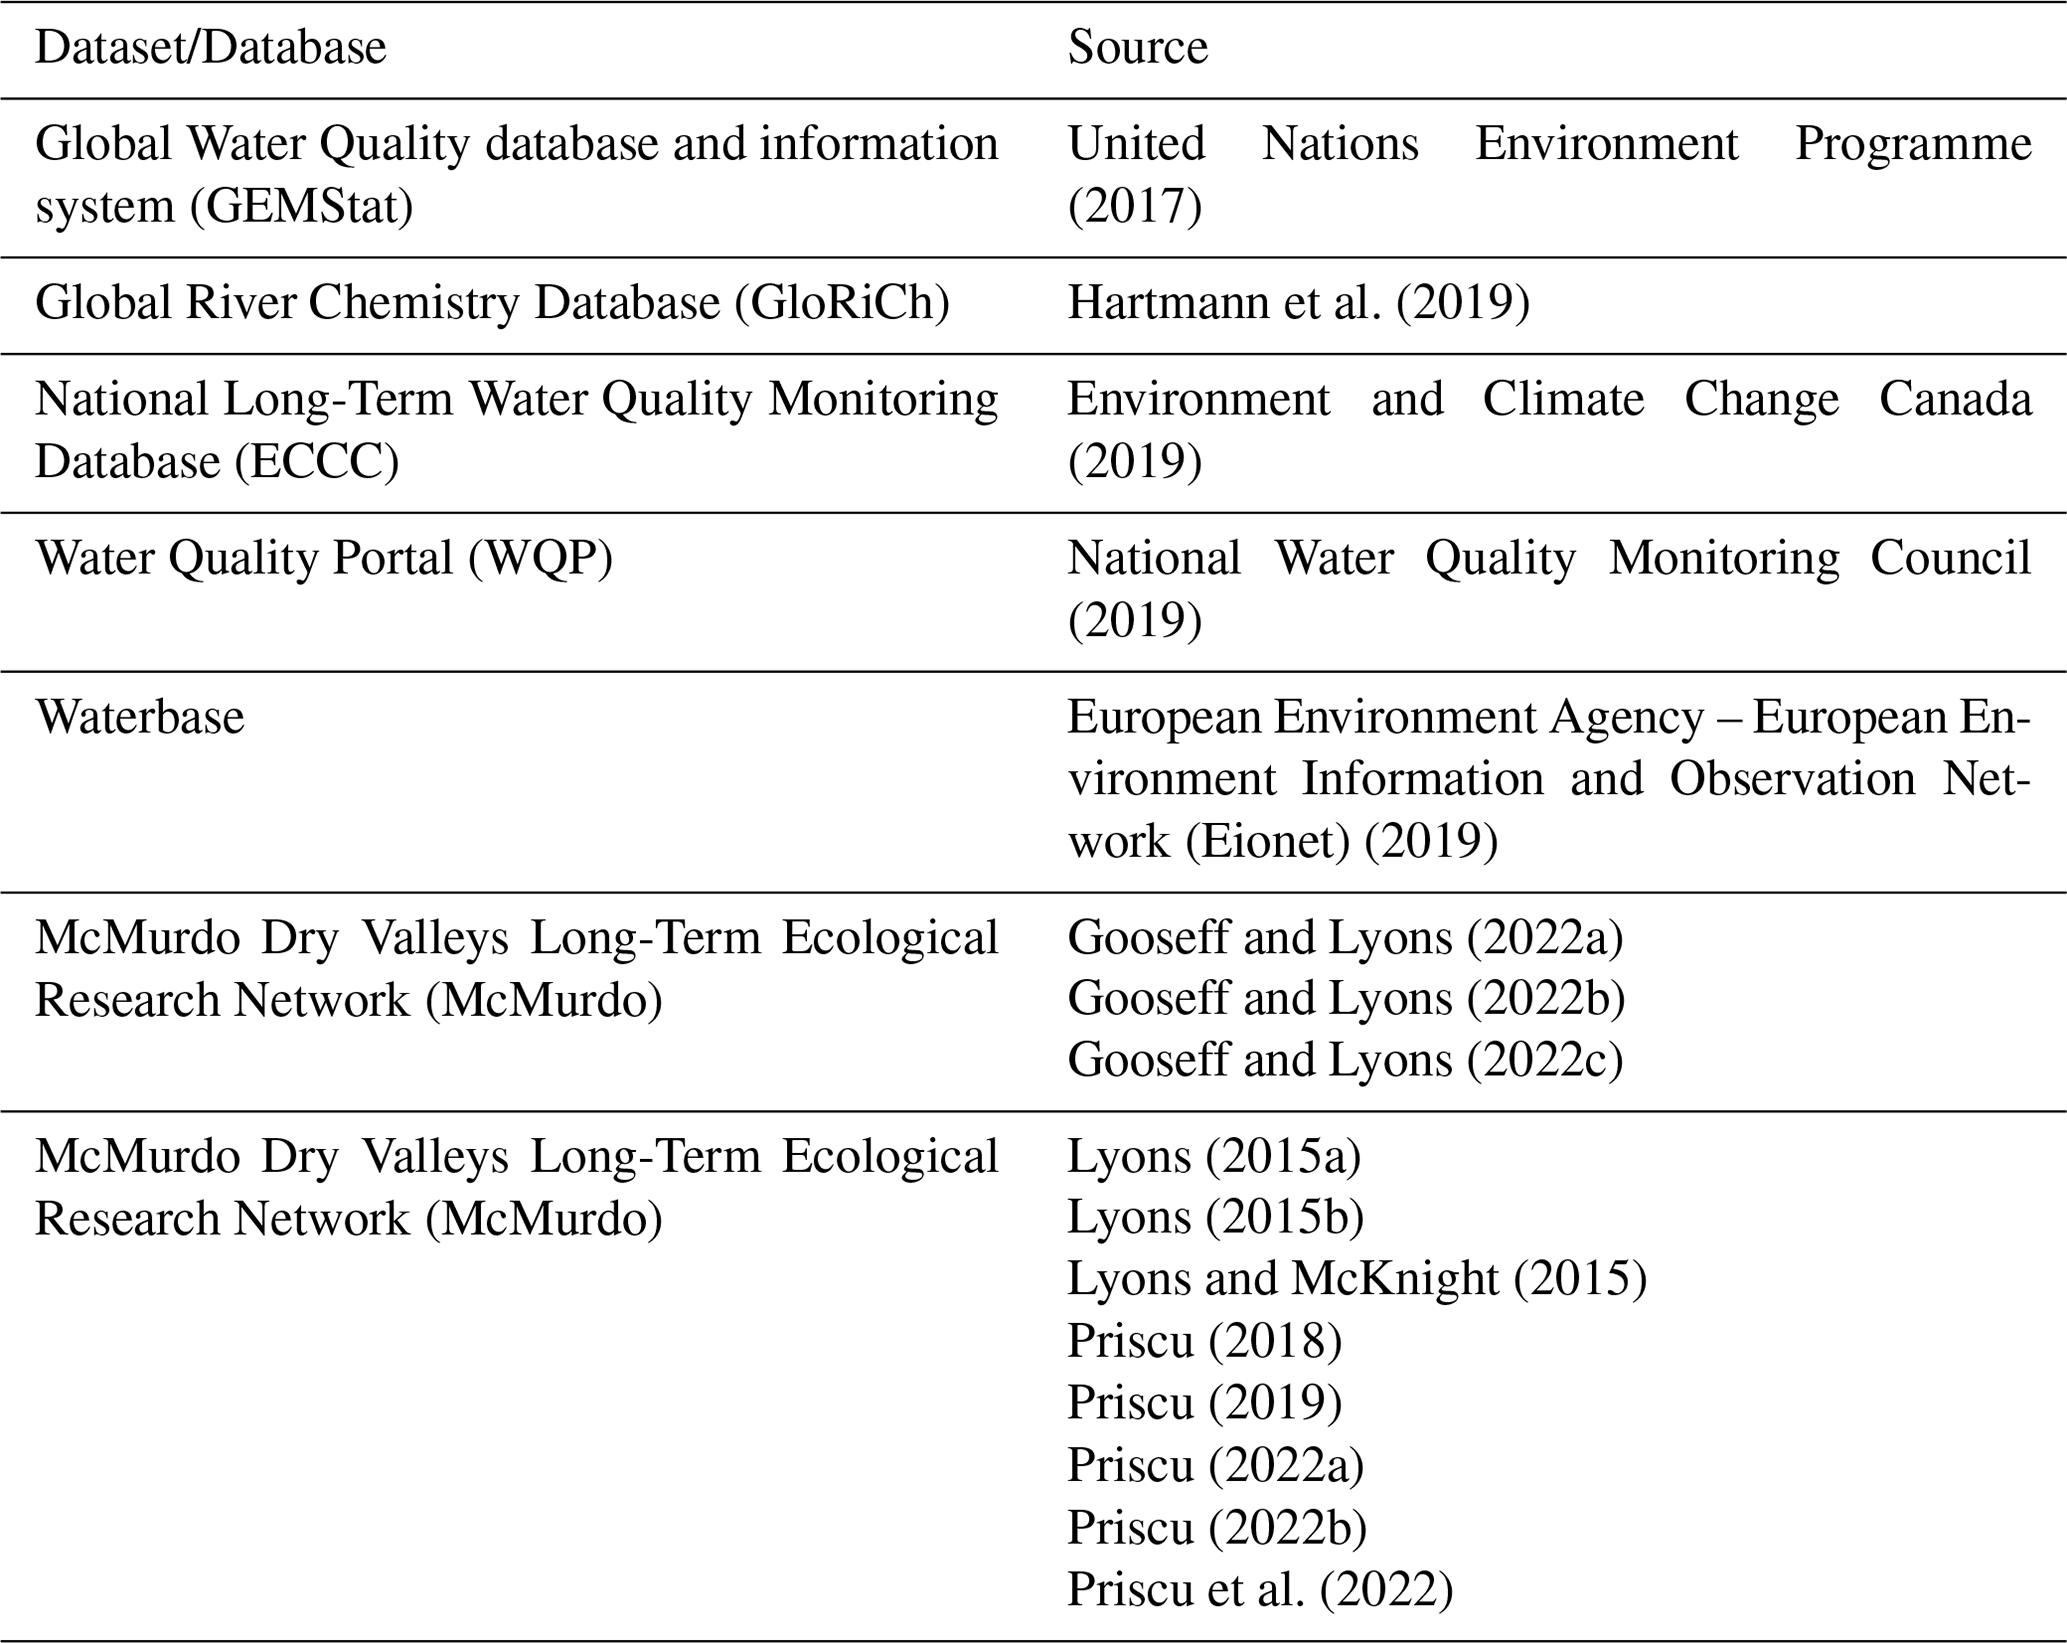
2.1 Data sources
We obtained input data for SWatCh from openly available datasets published by national and international agencies and from datasets available on open-access servers (Table 1). Our search terms were “water chemistry data” or “water quality data” and “global” or a country name, as listed in the member states of the United Nations (United Nations, 2009). Our data search did not have a geographic focus, although our sources were limited to datasets available in English. Datasets likely missed by this approach include those hosted on servers or websites without (English) search engine optimization (SEO) – that is, those not optimized with keywords identifiable by search engines to provide results (Google, 2002). All datasets were originally downloaded in September 2019 and updated during the manuscript review process in April and March 2022 so that newly published data could be included. The GloRiCh dataset was not re-downloaded because it had not been updated since the prior download, and the National Water Quality Monitoring Council Water Quality Portal dataset was not re-downloaded due to unresolved internal server errors.
2.2 Data inclusion
SWatCh includes 24 water chemistry variables collected in untreated surface waterbodies. We define “untreated” as water that is not wastewater or receiving treatment plant effluent near to the sample collection site (e.g., sites described as “wastewater” or “effluent”). The included waterbody types are streams, rivers, canals, ponds, lakes, and reservoirs. The included water chemistry variables are metals – Al and iron (Fe); CB species – calcium (Ca), magnesium (Mg), potassium (K), and sodium (Na); other measures of buffering capacity – the acid neutralization capacity (ANC), alkalinity, carbonate (CO3), and bicarbonate (HCO3); acid anions – sulfate (SO4), nitrate (NO3), and nitrite (NO2); other anions – fluoride (F) and chloride (Cl); nutrients – phosphorus (P), phosphate (PO4), and ammonium (NH4); physical parameters – pH and temperature; and carbon – carbon dioxide (CO2), total inorganic carbon (TIC), dissolved inorganic carbon (DIC), total organic carbon (TOC), and dissolved organic carbon (DOC). The included sample fractions are unfiltered, filtered, and extracted (i.e., acid digested). We screened out sites identified as confidential or with other publication restrictions. A visual representation of the data processing completed during the preparation of SWatCh is presented in Fig. 1.

Figure 1Workflow for creating SWatCh. Below detection limit is abbreviated as BDL, and coordinate reference system is abbreviated as CRS.
2.2.1 Flagging of low-quality data
We identified low-quality data using the flag “Rejected”; this included samples flagged as “unreliable”, “suspect”, or “poor quality” in the source databases. Additionally, we flagged values below zero for all variables except temperature, alkalinity, and ANC; these values are assumed to have been entered incorrectly. A total of 79 910 data points were considered to have low data quality, representing 1.48 % of the data in SWatCh.
2.2.2 Removal of duplicates
We removed duplicate site and sample data. Three of our source databases, GEMStat, the Global River Chemistry Database (GloRiCh), and Waterbase, are compilations of water chemistry data from several sources and, thus, repeat some measurements. We removed duplicated sites based on the unique site identification code. We removed duplicated samples based on the site identification code, date, variable name, variable fraction, variable speciation, and sample value. We define “variable fraction” as the component part of a water sample, such as filtered or unfiltered. “Variable speciation” is defined as the speciation of a reported parameter; for example, NH4 may be reported as nitrogen (N) or NH4.
2.2.3 Flagging of potential outliers
We identify potential outliers for each time series in SWatCh using a 4 times the median absolute deviation (MAD) cut-off value. The MAD is preferred to other methods of outlier removal when the data have a skewed distribution or large outliers are present (Leys et al., 2013; Rousseeuw and Hubert, 2011), as is common in water chemistry data (e.g., Rotteveel and Sterling, 2020). Water chemistry data in SWatCh have a skewed distribution for most variables; thus, the MAD is suitable outlier screening approach. The equation for the MAD is presented in Eq. (1).
Here, xi is an observation, and is the median (Rousseeuw and Hubert, 2011). A total of 0.27 % (13 309) of values were flagged as potential outliers.
2.3 Data standardization
2.3.1 Database format
The SWatCh database conforms to the DataStream Water Quality (DS-WQX) schema, a standardized data format that specifies the allowable elements and dataset structure. The DS-WQX schema is a simplified adaptation of the United States Environmental Protection Agency (US EPA) WQX schema. The US EPA WQX schema is an implementation of the Environmental Sampling, Analysis, and Results data standard which conforms to the National Environmental Information Exchange Network (EN) standards (US EPA, 2021). The complexity of the US EPA WQX schema presents a barrier to entry (DataStream Initiative, 2022) that is addressed by the simplified DS-WQX schema. The US EPA WQX schema is simplified compared with the DS-WQX schema in the following ways: most optional columns are removed, data are stored as one database as opposed to multiple relational datasets, column names are simplified, and date and time information is conformed to the ISO 8601 format to simplify parsing and ensure universal readability (DataStream Initiative, 2022). For further details, the reader is referred to https://github.com/datastreamapp/schema (last access: 9 April 2022).
We made two changes to the DS-WQX format: the minimum value for the “MonitoringLocationLatitude” field (i.e., the minimum allowable latitude value) was updated from 0 to −90 so that sites located in the Southern Hemisphere could be included, and “OTHER” was added as an allowable value to the “ResultAnalyticalMethodContext” field (i.e., the context associated with the analysis identifier code – for example, the agency that published the analysis method specifications) so that method information which was undefined in the DS-WQX schema could be included. For samples where the ResultAnalyticalMethodContext was specified as OTHER, information on the analysis identifier code context is provided in the “ResultComment” column.
2.3.2 Variable naming and measurement units
We standardized variable naming conventions in accordance with DS-WQX. Variable names are indicated separately from variable fractions and speciation to facilitate the analysis of different fractions simultaneously. In the input datasets, the fractions are not specified for all variables; for these, we denote the fraction as “Unspecified”.
We harmonized the measurement units and variable speciation for each parameter to simplify data analysis. Measurements were reported in different units in the input datasets; we standardized them to the most common SI (International System of Units) unit that we observed for each variable. For example, Ca was reported in micrograms per litre (µg L−1), milligrams per litre (mg L−1), equivalents per litre (eq L−1), and moles (mol), but it was most commonly reported in milligrams per litre; thus, we standardized the measurement unit to milligrams per litre. Concentrations are provided in milligrams per litre except for concentrations of Al and Fe (µg L−1), the ANC (mmol L−1), pH (unitless, denoted as “None”), and temperature (∘C).
Several input datasets did not include their encoding type, causing corrupted characters and measurement unit ambiguity. To prevent these errors, we omit non-ASCII (American Standard Code for Information Interchange) characters; for example, micrograms (µg) are denoted as “ug”. Measurement units in SWatCh conform to the DS-WQX standard.
2.3.3 Censored data notation
We standardized censored data notation to facilitate easier handling of these values. Censored data notation varied across the input datasets and included abbreviations such as “BDL”, “<”, or the numeric value of the detection limit. The input datasets did not distinguish between samples measured at or below the detection limit. Detection limits differed across and within datasets; thus, we standardized values below detection limit by flagging them and providing the detection limit in separate columns, allowing for various approaches to handle these results.
2.4 Mapping
We harmonized the coordinate reference systems (CRSs) of the sample site locations to simplify geographic analysis. Site location coordinates are provided in various CRSs in the input datasets; thus, we re-projected them to the World Geodetic System 1984 (WGS 84) geographic CRS. We selected WGS 84 because it provides a good mean solution across the globe and can easily be projected to local datums (Bajjali, 2018).
Table 2Summary of sample size, time series start and end dates, and average annual sampling frequency throughout time series separated by waterbody type and variable. Minimum and maximum are abbreviated as Min and Max, respectively.
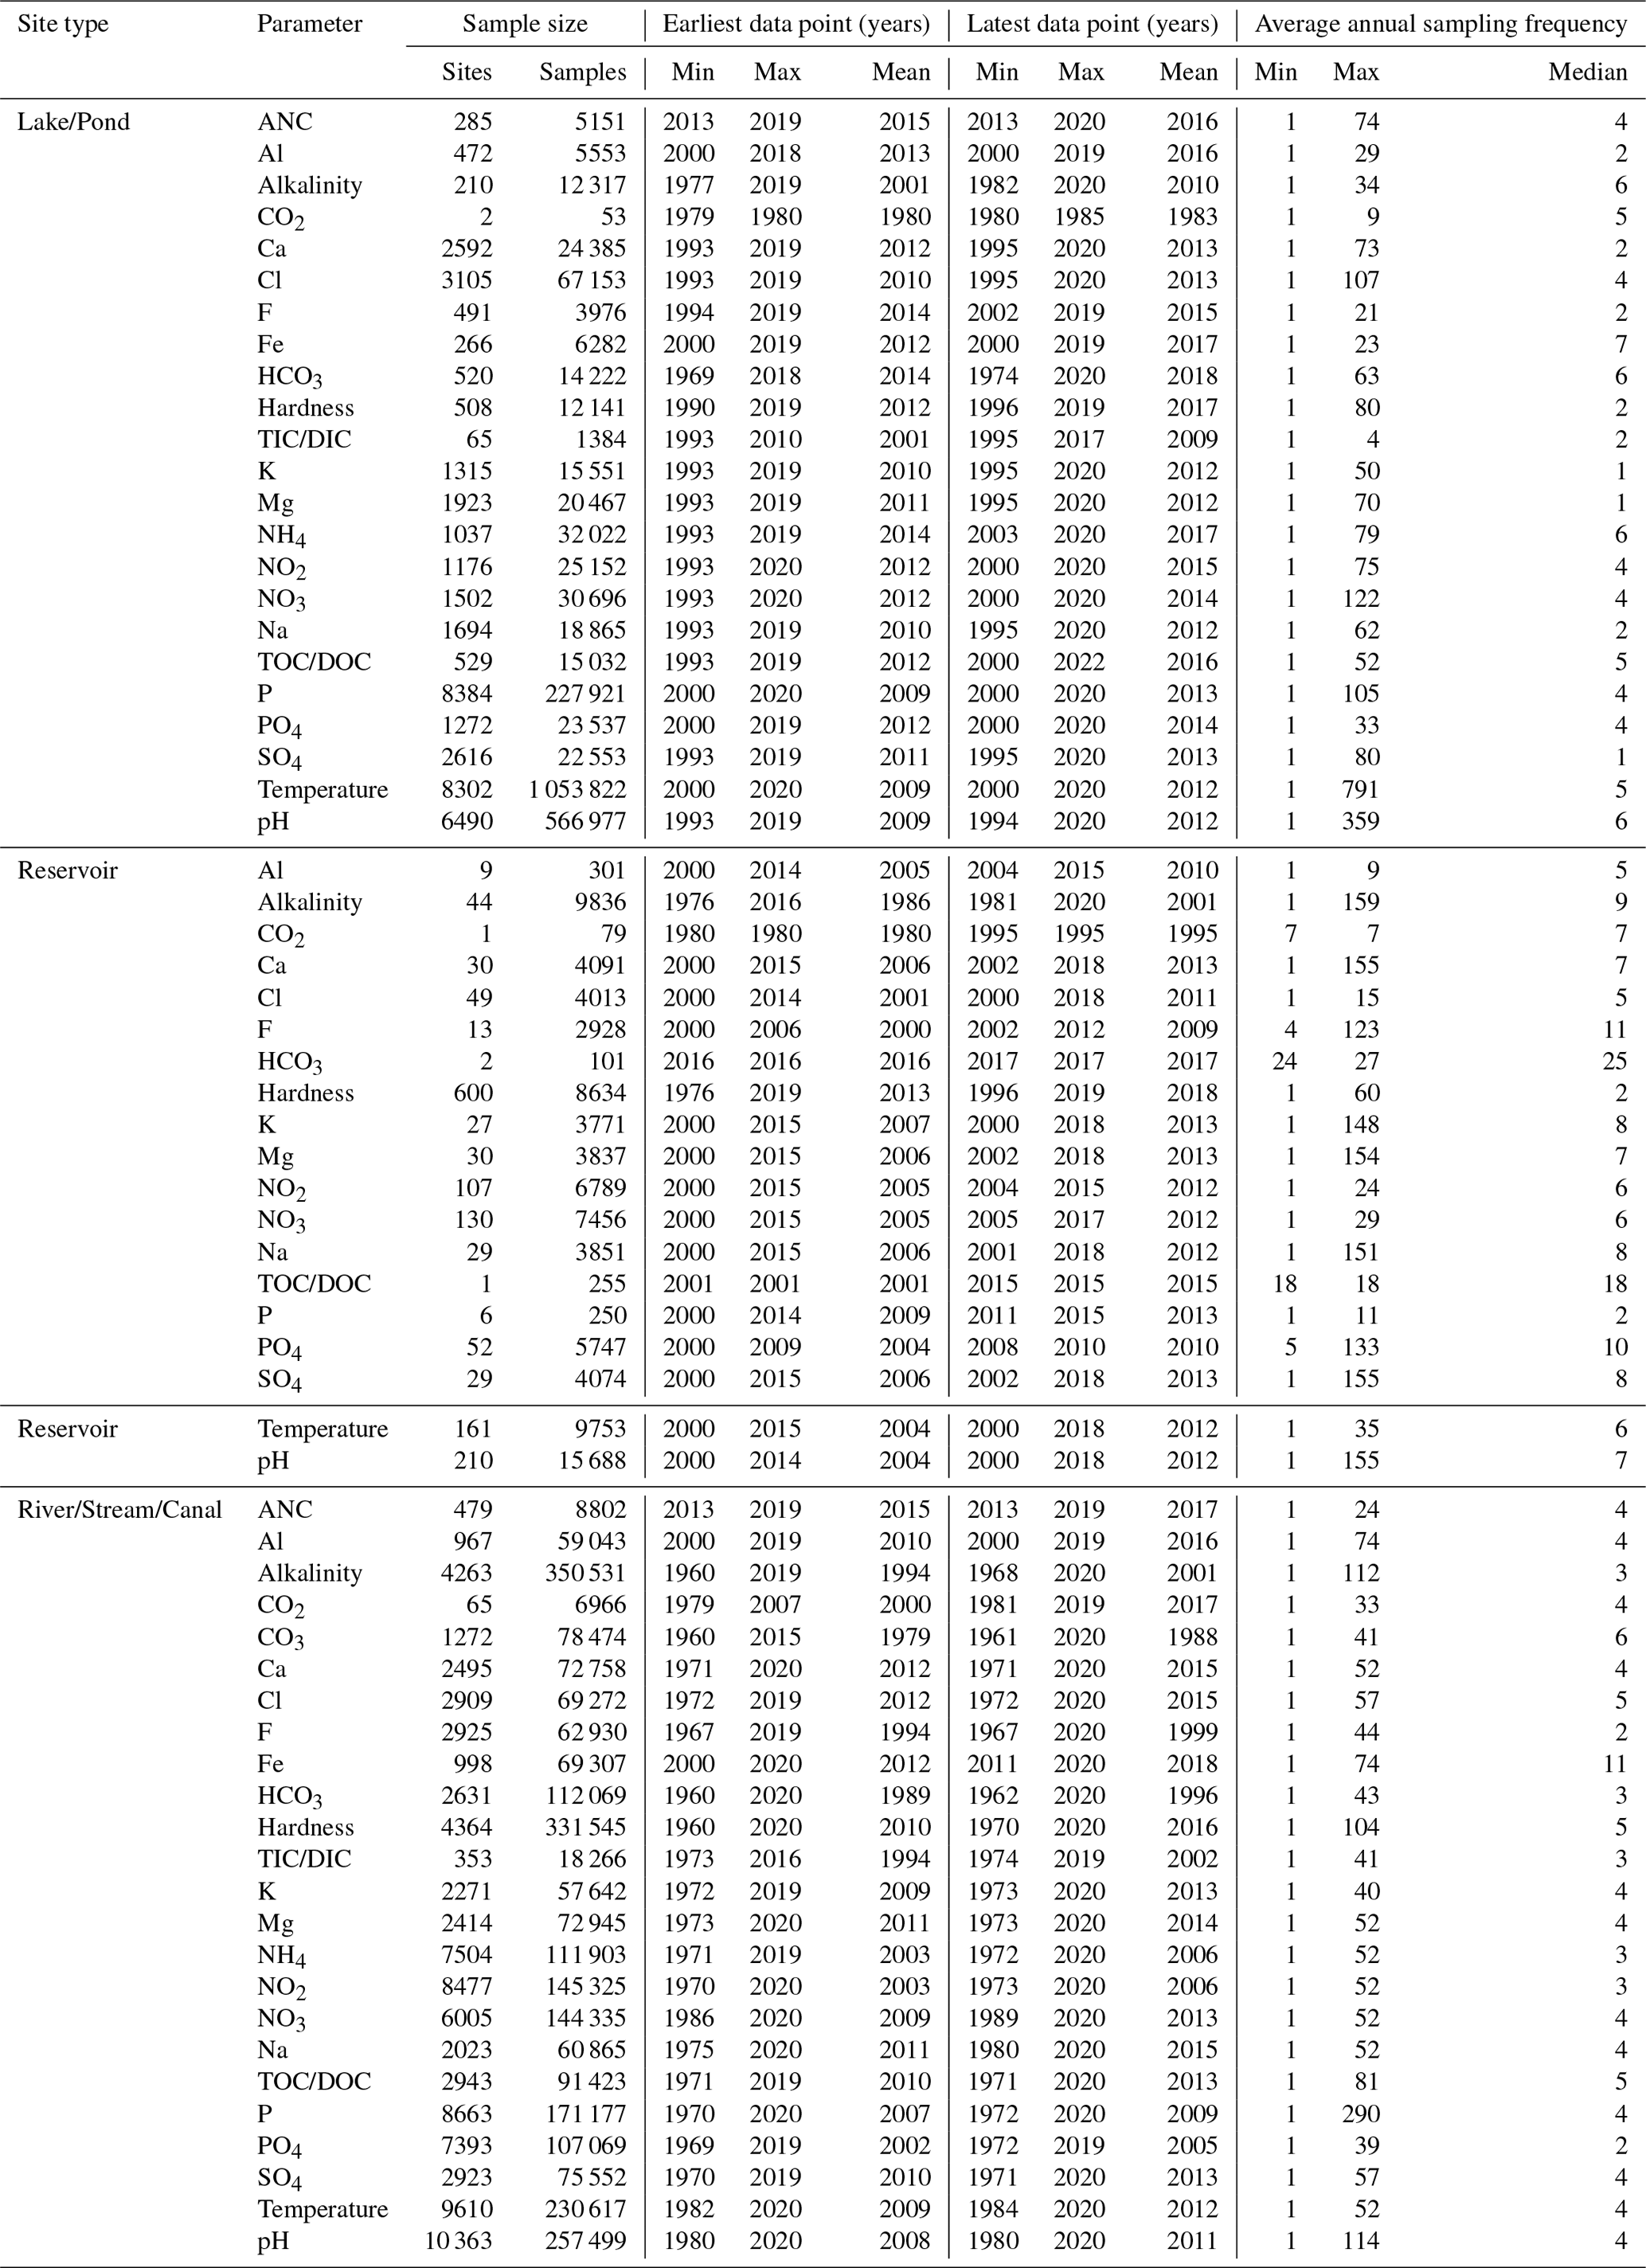
The SWatCh database contains water chemistry data across 24 variables, four fractions, 33 722 sites, and 5 062 980 samples collected between 1960 and 2022 (Table 2). SWatCh is available on Zenodo (https://doi.org/10.5281/zenodo.6484939; Rotteveel and Heubach, 2021). The sample collection frequency ranges from approximately twice a day to one-off samples, depending on the parameter and waterbody type. The parameters with the highest average annual sampling frequency are temperature (791) and pH (359). The average annual sampling frequency across all parameters is similar between waterbody types: four samples per year for lacustrine and riverine systems, and eight samples per year for reservoirs. Not all samples included collection and analysis methodologies; for the samples where this information was available, there are 565 different methods.
Table 3Sample size (sites) for waterbody types based on available parameters and time series duration. Sites included in consecutive parameter categories also meet all of the prior category requirements.
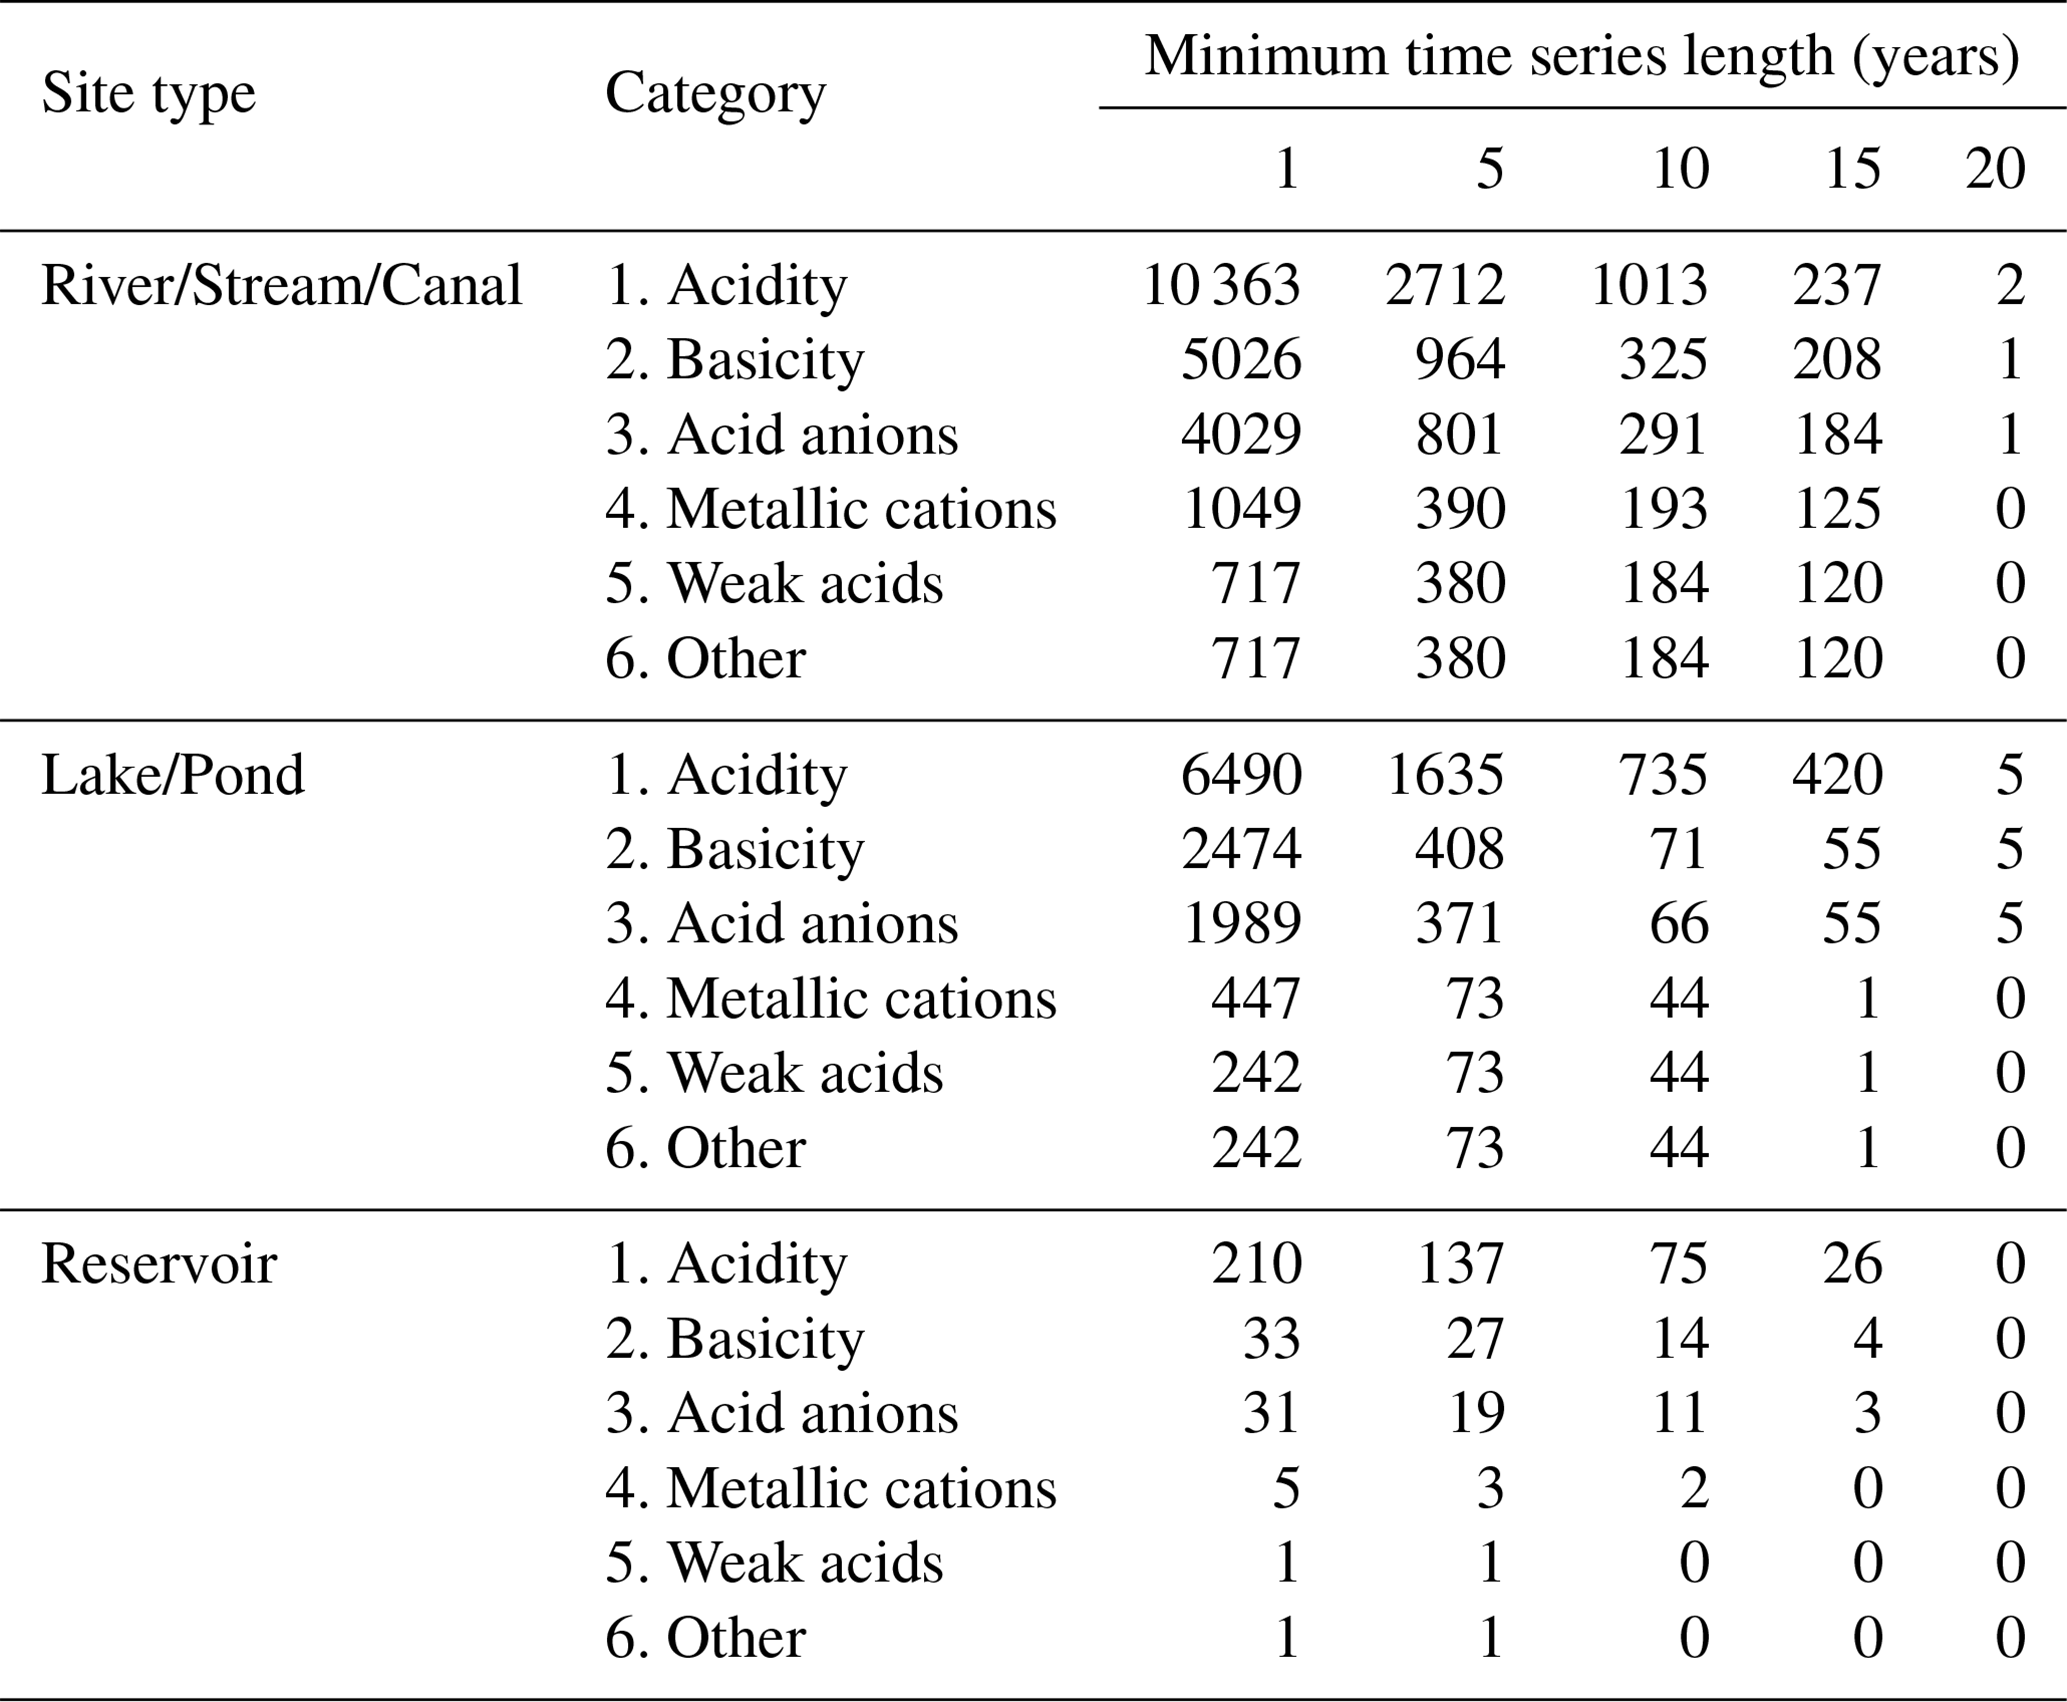

Figure 2Sample sites in the SWatCh database, coloured by dataset source (a) and separated by site type: lakes/ponds (b), rivers/streams/canals (c), and reservoirs (d). Points overlap where sites are in close vicinity. Natural Earth projection is used, and the scales are as follows: 1:275 000 000 (a) and 1:725 000 000 (b–d). Dataset abbreviations are defined in Table 1.
Sites in SWatCh are located across the globe, but they are concentrated in North America, South America, and Europe (Fig. 2) and encompass a variety of bedrock types (United States Geological Survey, USGS, 2022), land use types (Goldewijk et al., 2011), and climate zones (Kottek et al., 2006). The spatial distribution of sampling locations varies by waterbody type; notably, only riverine sites are available in northern North America and several island nations, such as Guam and New Zealand, and reservoir sites are concentrated in the equatorial and arid climate zones, such as Central America (Fig. 2).
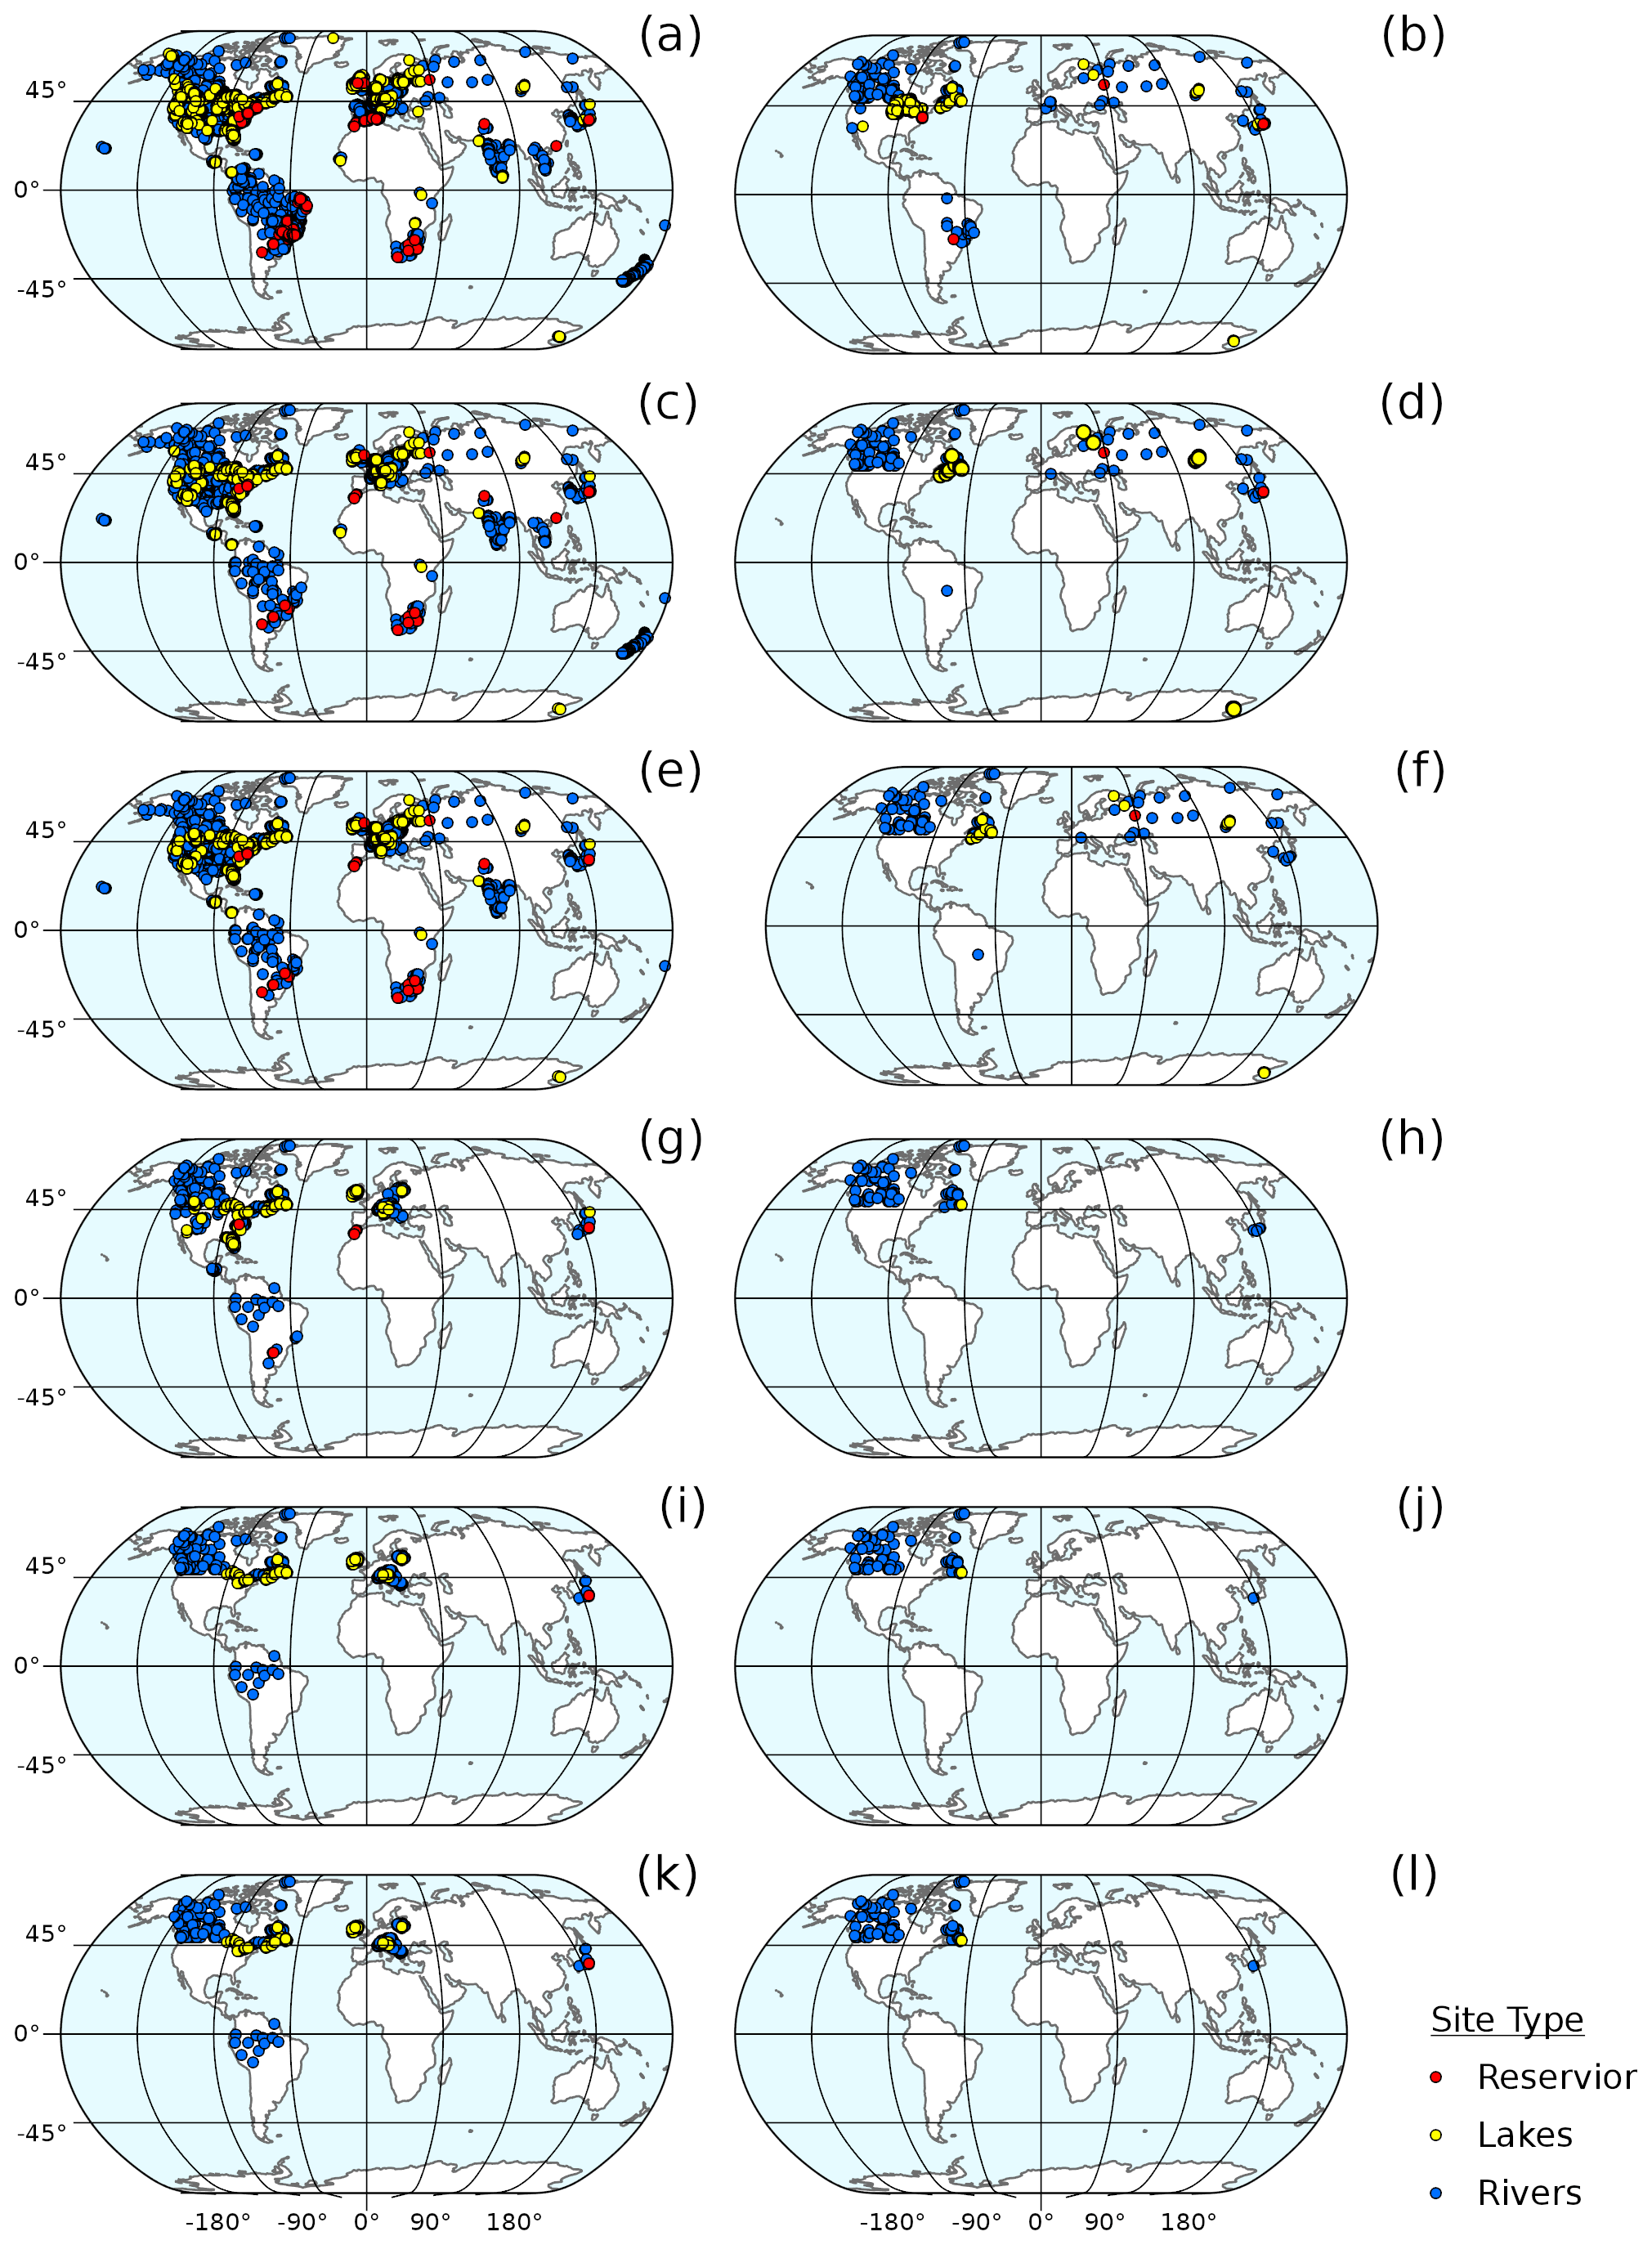
Figure 3Sample size (sites) for waterbody types based on time series duration and data availability in the following parameter categories: acidity (a, b), basicity (c, d), acid anions (e, f), metallic cations (g, h), weak acids (i, j), and other parameters (k, l). Sites included in consecutive parameter categories also meet all of the prior category requirements. Sites with at least one observation are shown in the left panes, and sites with a minimum time series length of 15 years are shown in the right panes. Points overlap where sites are in close vicinity. Natural Earth projection is used, and the scale is 1:550 000 000.
The number of sites available to study freshwater acidification, as well as the spatial extent of the sites, decreases with number of included parameters and time series length (Table 3, Fig. 3). We allocated the available parameters in SWatCh into five groupings, each of which allows freshwater acidification to be studied with increasing detail and certitude. The parameter groupings, in order of decreasing importance, are as follows:
-
Acidity (pH). pH is assigned the to the first grouping because it is the primary indicator of freshwater acidification.
-
Basicity (alkalinity, hardness, ANC, CO3, HCO3, Ca, and Mg). The primary measures of basicity are assigned to the second grouping because they are also used as primary indicators of freshwater acidification and can be used to determine the stage of freshwater acidification. For example, Stage 2 is characterized by an increase in freshwater CB concentrations as cation exchange from cation exchange sites in soils buffers acid anion deposition (Galloway et al., 1983). K and Na are not included in the basicity grouping because they are usually present in minor concentrations compared with Ca and Mg (Meybeck, 2004).
-
Acid anions (SO4, NO3, and NO2). Acid anions are assigned to the third grouping because acid deposition is usually the primary driver of freshwater acidification (Galloway et al., 1983), but it may not be a good indicator of freshwater acidification in low-CB waters or in waters with high DOC concentrations (Rotteveel and Sterling, 2020).
-
Metallic cations (Al and Fe). Metallic cations are assigned to the fourth group because soils undergo Al or Fe buffering in response to acid deposition once soil CB species are depleted (Björnerås et al., 2017; Galloway et al., 1983); thus, they are a secondary indicator of freshwater acidification.
-
Weak acids (CO2, TOC/DOC, and NH4). Although weak acids are not a primary driver of freshwater acidification in most catchments, they are an important driver of the freshwater response to acid deposition in some catchments with low buffering capacity (Clair et al., 2011; Rotteveel and Sterling, 2020); thus, they are assigned to the fifth grouping.
-
Other (temperature, K, Na, Cl, F, P, PO4, and DIC). The remaining parameters are assigned to the last group because they characterize catchment-scale processes that may have secondary effects on the freshwater response to acid deposition (e.g., Berger et al., 2015; Harriman et al., 1995; Kopáček et al., 2001). DIC is included in this group because the speciation (i.e., CO2, CO3, or HCO3) is unknown, although it can be calculated using pH.
Here, we discuss the main limitations that we encounter when compiling and analyzing datasets and provide recommendations for data sharing to facilitate more large-sample and global-scale water chemistry research.
4.1 Data availability and spatial gaps
Some variables have smaller sample sizes. The number of reported measurements differs greatly per variable, with metals (Fe and Al) and F having the smallest sample sizes and lowest sampling frequencies and pH and temperature having the largest and highest. This discrepancy is possibly due to these parameters being relevant to a wider range of research topics or the cost of measurement: pH and temperature can be measured with a variety of field- or laboratory-based multiparameter probes, whereas metals and anions require laboratory analysis. However, it is currently unknown if analysis results are under-reported for some variables – that is, if all laboratory analysis results are reported for each sample included in the input databases. Prior research on one of the main variables with a low sample size (Fe), includes an openly available research dataset of 340 waterbodies in Europe and eastern North America (Björnerås et al., 2017). Despite the geographical coverage and size of this dataset, it is not included in SWatCh because the data do not adhere to the DS-WQX data schema due to missing variable fractionation information. These types of published research datasets are uncommon (Alsheikh-Ali et al., 2011) and highlight the potential contribution of unpublished raw research data.
Critical data gaps exist across large areas on the African, Asian, Australian, and Antarctic continents, mainly representing the equatorial, arid, snowy, and polar climate zones (Kottek et al., 2006). The zones of missing data represent regions where freshwater acidification is an emerging issue (e.g., in China; Li et al., 2019) and regions where the climate-change-induced alteration of freshwater discharge regimes is projected to be the greatest by 2050 (Döll and Zhang, 2010). The lower data coverage in some of these regions represents a limitation in the development of global water chemistry models (Harrison et al., 2005a, b), and it may inhibit the detection – and therefore treatment – of emerging water quality problems related to the climate-change-induced perturbation of freshwater discharge regimes. The observed lower data availability may be because of our reliance on English datasets, less data sharing in these regions due to concerns about “parachute research” (where researchers abscond with local data to their home countries) (Serwadda et al., 2018), a lack of funding for scientific research (Serwadda et al., 2018), a lack of national data-sharing regulations (Serwadda et al., 2018; Thu and Wehn, 2016), or outdated information management systems (Thu and Wehn, 2016).
Despite the aforementioned data gaps, some of the most acidified regions of the world can be studied with a high degree of detail and certitude using SWatCh. Sites with sufficient available parameters (as defined in Sect. 3) and time series length (i.e., 10–15 years) to study drivers and trends are concentrated in the Northern Hemisphere, and they encompass the some of the most acidified regions of North America and Europe (Fig. 3; Björnerås et al., 2017; Clair, 2012; Clair et al., 2011; Driscoll et al., 2016). We chose a time series length of 10–15 years because this is the minimum duration required to distinguish between short-term hydrological variability and underlying system behaviour (Howden et al., 2011), and it is also comparable to time series lengths commonly used to study freshwater acidification (e.g., Burns et al., 2008; Clair et al., 2011; Driscoll et al., 2016). Based on the available parameters for locations with a 10- or 15-year time series, the following aspects of freshwater acidification can be studied using SWatCh: acidification stage, extent of base cation depletion, catchment buffering processes, the importance of natural and/or weak acids, and other influential catchment-scale processes. The lack of water chemistry data relevant to freshwater acidification in some regions may be related to historical preferential research focus: freshwater acidification research has historically predominantly been focused on Europe and North America (e.g., Björnerås et al., 2017; Holland et al., 2005; Stoddard et al., 1999), where this is an established environmental issue, and less focused on other regions such as China, where this is an emerging concern (e.g., Li et al., 2019).
Alleviating the issue of data availability is complex (Serwadda et al., 2018) but can be facilitated through journals more consistently implementing and enforcing data-sharing policies (Alsheikh-Ali et al., 2011), ensuring coherence with and balance between data-sharing policies and protecting national interests (Thu and Wehn, 2016), and engaging and crediting the people and organizations collecting the data (Serwadda et al., 2018).
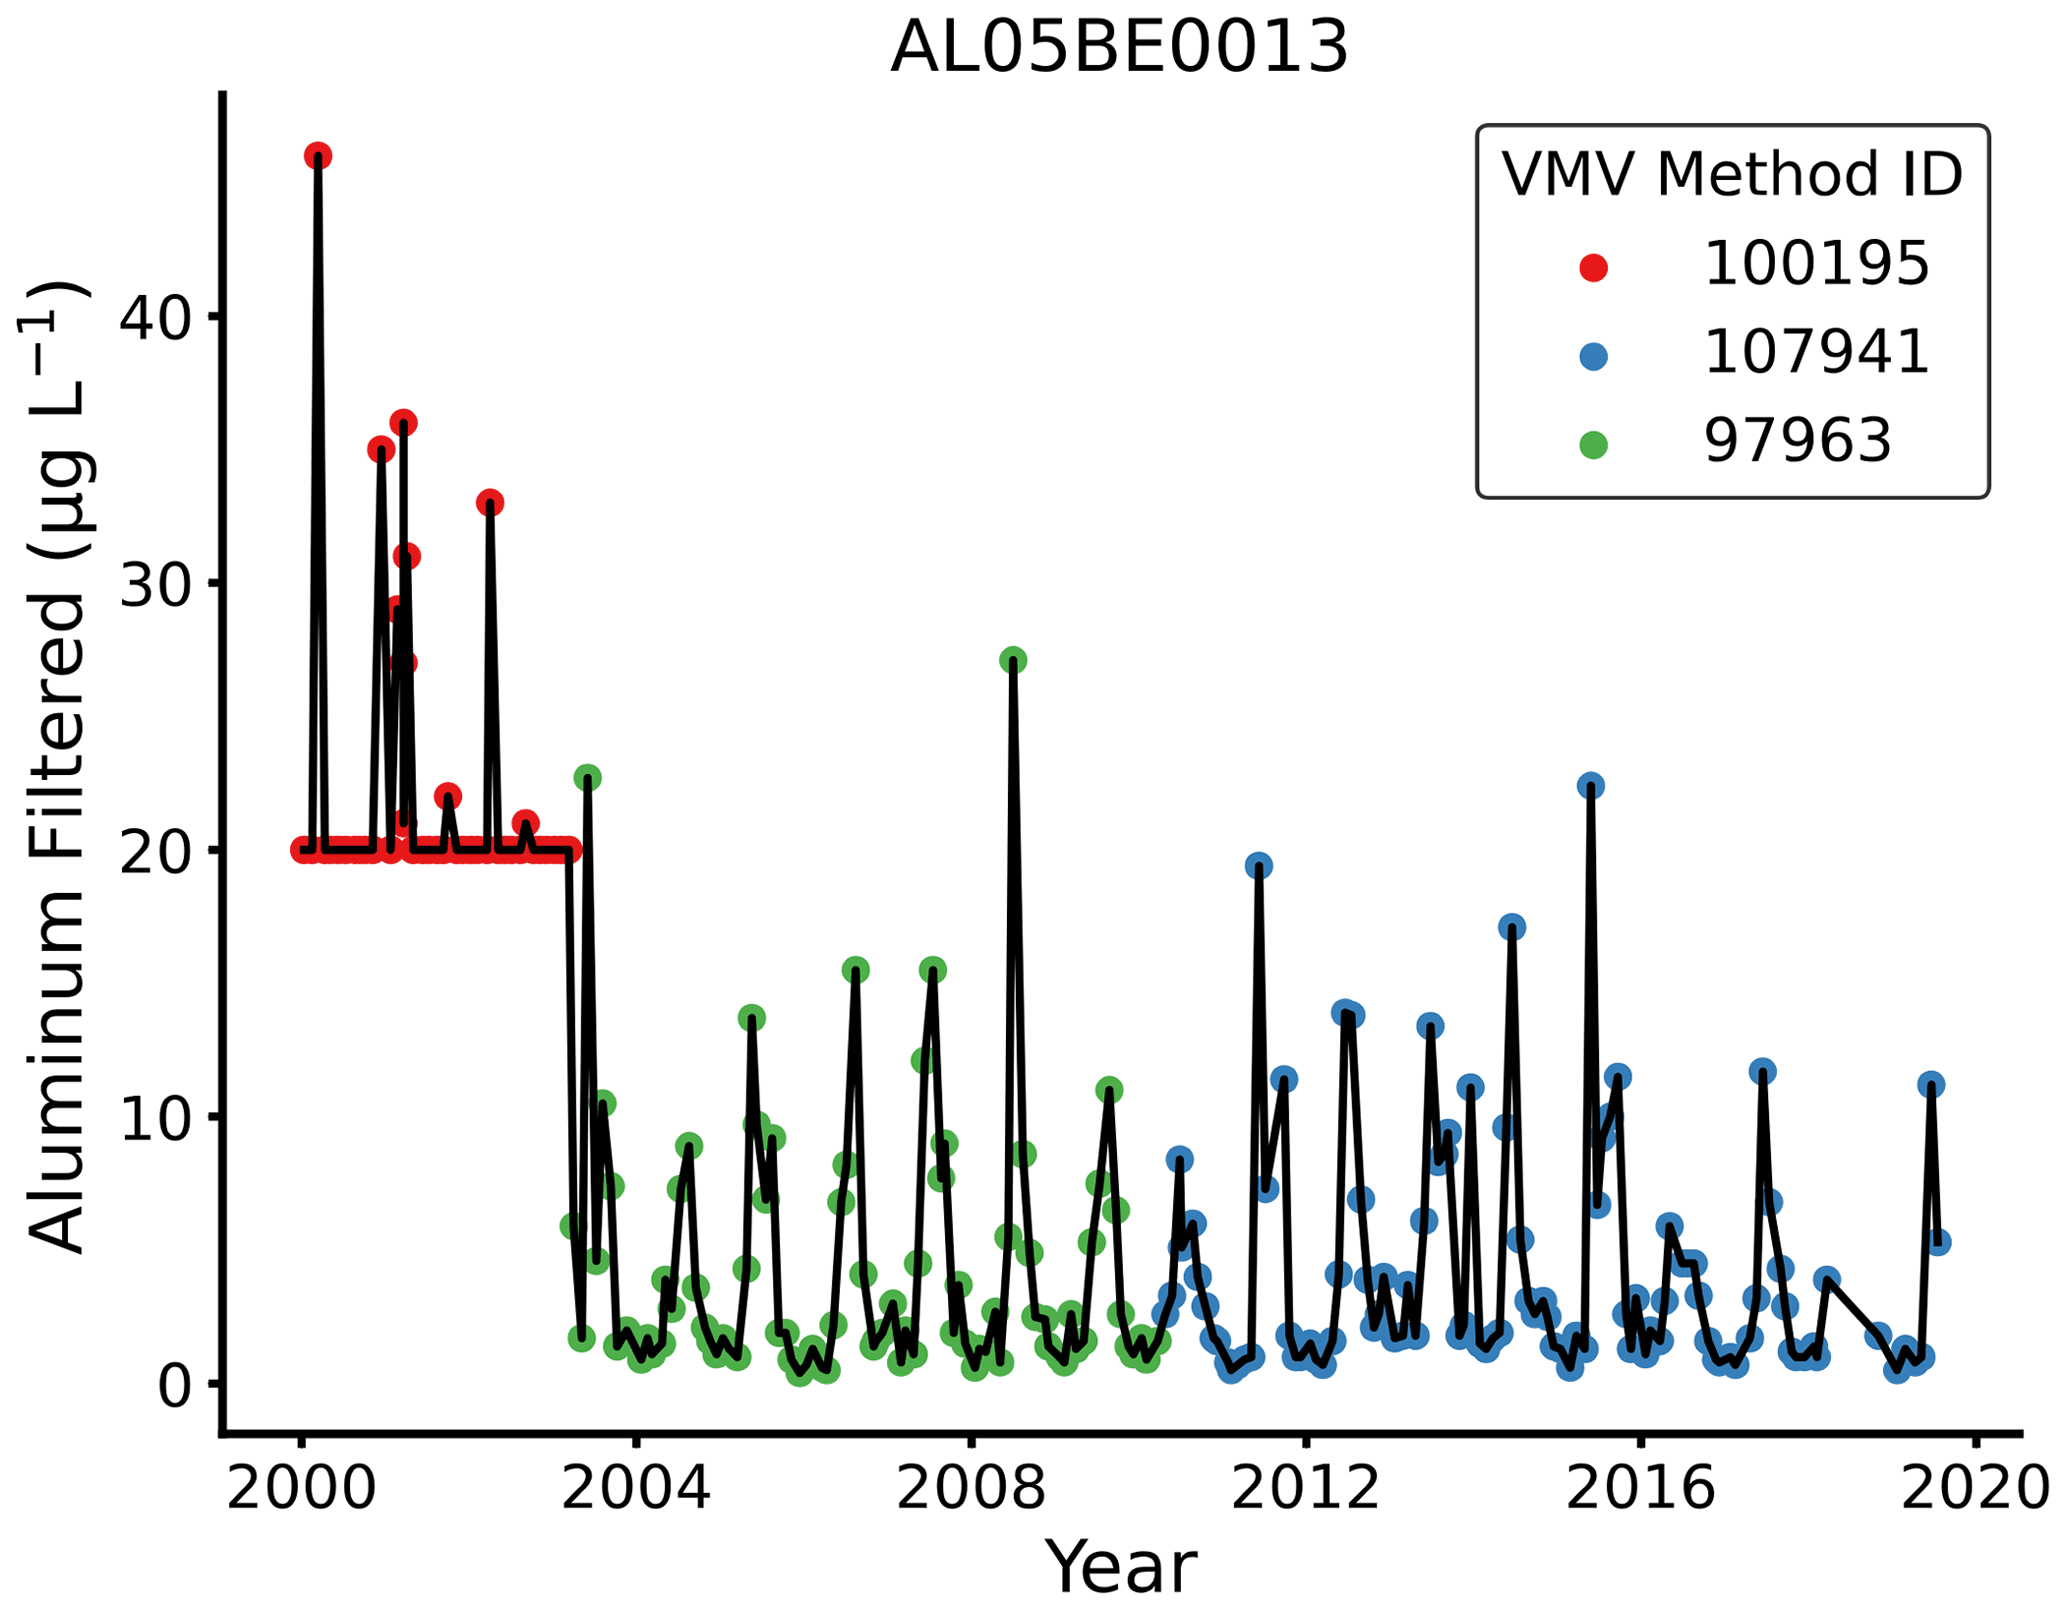
Figure 4Example of change in analysis methodology on detected concentrations. Coloured points represent different analysis methodologies. For non-detected concentrations, the detection limit is shown.
4.2 Methodology changes and dissimilarity
The analysis of time series and the intercomparison of data collected at different sites is challenging due to the dissimilarity of sample collection programs and methodology changes. Methodology changes throughout a time series may result in spurious trend test results. For example, at site AL05BE0013, located in the Bow River approximately 4.5 km upstream of Canmore, Alberta, Canada, dissolved Al was analyzed using Value Method Variable (VMV) 100195 prior to 2003 and VMV 107941 and 97963 after 2003 (Fig. 4). VMV 107941 and 97963 both use inductively coupled plasma mass spectrometry (ICP-MS) and have comparable low detection level limits, whereas VMV 100195 uses inductively coupled argon plasma emission spectroscopy (ICAP) and has a higher detection limit. Because most values in this time series are lower than the detection limit for VMV 100195 (i.e., 20 µg L−1), analysis of the time series without removing samples analyzed via VMV 100195 would result in the detection of a spurious negative trend. Similarly, disparate analysis methods across geographic regions may hinder the comparability and consolidation of data collected by different sources (World Health Organization and United Nations Children's Fund, 2017). For example, in the USA, Al samples may be analyzed by US EPA method 200.7, with an estimated detection limit of 45 µg L−1 (US EPA, 2015), whereas Al samples in Europe may be analyzed by ISO method 15586:2003, with an estimated detection limit of 1 µg L−1 (ISO/TC 147/SC2, 2003); samples analyzed using these two methods cannot be compared if Al concentrations are below 45 µg L−1. Trend analysis can also not be robustly performed if different sample fractions are present throughout the time series. For example, Environment and Climate Change Canada (ECCC) analyzed the unfiltered Al fraction as extractable Al (Alext; comprising the dissolved fraction and weakly bound or sorbed molecules) prior to 2011 in Atlantic Canada and as total Al (Alt; comprising dissolved, weakly bound or sorbed, and particulate molecules) after 2011 (Rotteveel and Sterling, 2020). To facilitate intercomparison of data and trend analysis, the creation of internationally standardized variable definitions and cross-boundary analysis methodology is needed (World Health Organization and United Nations Children's Fund, 2017).
4.3 Ambiguity and inconsistency
We encounter ambiguity and inconsistency in variable and fraction naming conventions, reporting units, analysis methodology, and dataset encoding. Firstly, we find variable and fraction definitions and consistency to be lacking in most input datasets. For example, an Ald sample may be filtered through a 0.45 or 0.10 µm filter; both samples are considered Ald but represent a different set of Al molecules. As naming conventions are variable and there are no internationally standardized variable definitions (World Health Organization and United Nations Children's Fund, 2017), defining variables and their fractions is required to prevent confusion regarding comparability. Similarly, reporting units and censored data notation should be defined and consistent throughout the dataset; this includes spelling, abbreviations, and capitalization. We also observe ambiguity regarding analysis methodology, where analysis methods are inadequately described or are missing entirely. Ideally, analysis method reporting includes all of the following which are applicable: filter size and type; analysis instrument; acid preservative type; location of acid preservation (in field or laboratory); and the analysis/speciation method, method code, its publishing agency, and a link to a reference document. Lastly, we encounter corrupted characters due to unknown dataset encoding. To prevent this ambiguity, the encoding of the dataset should be known and published; this is especially important for datasets not encoded in 8-bit Unicode (UTF-8), which is preferred for data exchange (ISO/IEC JTC 1/SC 2, 2017).
4.4 Limitations and future work
In addition to the challenges noted above, the main limitations of SWatCh are a lack of discharge data and information on watershed land use and land cover. We did not include discharge information, as there are numerous openly available global-scale river discharge datasets that cover some of the sites available in the SWatCh database – for example, those available via the European Environmental Agency's Waterbase or the Global Runoff Data Centre. Further development is needed to integrate existing discharge datasets into SWatCh, allowing discharge-weighted water chemistry concentrations to be computed. The DS-WQX schema does not allow for the inclusion of watershed information such as land use and land cover; thus, we do not include these data in SWatCh. Some of this information is available in the input datasets – for example, the GloRiCh database (Hartmann et al., 2014). Catchment characteristics can be identified for sites by using existing global datasets such as HydroATLAS, which provides information on hydrologic, physiographic, climate, land use and land cover, soils and geology, and anthropogenic influences for catchments at a resolution of up to 15 arcsec (approximately 463 m at the Equator) (Linke et al., 2019).
The SWatCh database is available on Zenodo (https://doi.org/10.5281/zenodo.6484939; Rotteveel and Heubach, 2021). No account nor sign-up is required to download the data. SWatCh is composed of third-party data, as listed in Table 1. The SWatCh database is licensed under the Creative Commons Attribution-NonCommercial-ShareAlike 4.0 International License. To view a copy of this license, the reader should visit http://creativecommons.org/licenses/by-nc-sa/4.0/ (last access: 1 May 2022) or send a letter to Creative Commons, P.O. Box 1866, Mountain View, CA 94042, USA. GEMStat data, 7401 sites (21.95 % of sites), are not available in SWatCh due to a publication ban. Users may add these data by requesting the GEMStat dataset from the United Nations Environment Programme and running the SWatCh data processing scripts available from the GitHub repository indicated below (Sect. 6).
The code used to generate the SWatCh database is published on GitHub: https://github.com/LobkeRotteveel/SWatCh (last access: 24 April 2022; Rotteveel and Heubach, 2022).
Prior research has demonstrated that, despite variability in sample size, geographic coverage, and analysis methodology, large-sample datasets facilitate the understanding of global water chemistry processes and the identification of transboundary problems (e.g., Björnerås et al., 2017; Monteith et al., 2007; Weyhenmeyer et al., 2019). Despite these clear benefits, there are few global-scale water chemistry datasets. We created SWatCh to begin to fill this gap; it is a global database of surface water chemistry focused on freshwater acidification-related variables. This database contains water chemistry data across 24 variables, four variable fractions, 33 722 sites, and 5 062 980 unique samples collected between 1960 and 2022. The numerous available variables and large sample sizes in SWatCh allow users to conduct powerful and robust statistical analyses to answer emerging global surface water chemistry questions. To facilitate data use in databases like SWatCh and by other researchers, we recommend making research data openly available; standardizing analysis methodology; and avoiding ambiguity/inconsistency in variable and fraction names, reporting units, censored data notation, analysis method descriptions, and dataset encoding. Future work should focus on filling the spatial data gaps identified in Asia, Africa, and Australia as well as on adding discharge data. With more people experiencing decreased water quantity (Burek et al., 2016; Mekonnen and Hoekstra, 2016), maintaining water quality is paramount. By facilitating the global exchange of their data, researchers can contribute toward this goal.
LR conceived the original idea, compiled, and prepared the data, co-developed the data processing scripts, conducted the geospatial information system (GIS) procedures, conceptualized and prepared the figures and tables, and was the principal author. FH wrote the data validation scripts and co-developed the data processing scripts. SMS provided supervision and co-edited the manuscript.
The contact author has declared that none of the authors has any competing interests.
While substantial efforts are made to eliminate errors from the SWatCh
database, complete accuracy of the data and metadata cannot be guaranteed.
All data and metadata are made available “as is”. Lobke Rotteveel,
Franz Heubach, and Shannon M. Sterling as well as their current or future
affiliated institutions, including the Sterling Hydrology Research Group and
Dalhousie University, cannot be held responsible for harms, damages, or other
consequences resulting from the use or interpretation of information
contained within the SWatCh database.
Publisher's note: Copernicus Publications remains neutral with regard to jurisdictional claims in published maps and institutional affiliations.
The authors are grateful to the United Nations Environment Programme, the International Centre for Water Resources and Global Change, Environment and Climate Change Canada, the McMurdo Dry Valleys Long-Term Ecological Research Team, the United States of America National Science Foundation and National Water Quality Monitoring Council, the European Environment Agency, and Jens Hartmann, Ronny Lauerwald, and Nils Moosdorf for making the data collected by their contributing agencies, laboratories, researchers, and technicians openly available data for research. We also wish to thank Rob Jamieson for his feedback on the draft of this manuscript. Moreover, the authors acknowledge Abby Millard and Lilian Barraclough for assistance with compiling site data.
This research has been supported by the Nova Scotia Graduate Scholarship program.
This paper was edited by Birgit Heim and reviewed by two anonymous referees.
Aherne, J., Posch, M., Forsius, M., Vuorenmaa, J., Tamminen, P., Holmberg, M., and Johansson, M.: Modelling the hydro-geochemistry of acid-sensitive catchments in Finland under atmospheric deposition and biomass harvesting scenarios, Biogeochemistry, 88, 233–256, https://doi.org/10.1007/s10533-008-9206-7, 2008.
Alsheikh-Ali, A. A., Qureshi, W., Al-Mallah, M. H., and Ioannidis, J. P. A.: Public Availability of Published Research Data in High-Impact Journals, PLOS One, 6, e24357, https://doi.org/10.1371/journal.pone.0024357, 2011.
Bajjali, W.: ArcGIS for environmental and water issues, Springer International Publishing, Cham, Switzerland, https://doi.org/10.1007/978-3-319-61158-7, 2018.
Berger, T., Mathurin, F. A., Gustafsson, J. P., Peltola, P., and Åström, M. E.: The impact of fluoride on Al abundance and speciation in boreal streams, Chem. Geol., 409, 118–124, https://doi.org/10.1016/j.chemgeo.2015.05.013, 2015.
Björnerås, C., Weyhenmeyer, G. A., Evans, C. D., Gessner, M. O., Grossart, H.-P., Kangur, K., Kokorite, I., Kortelainen, P., Laudon, H., Lehtoranta, J., Lottig, N., Monteith, D. T., Nõges, P., Nõges, T., Oulehle, F., Riise, G., Rusak, J. A., Räike, A., Sire, J., Sterling, S. M., and Kritzberg, E. S.: Widespread increases in iron concentration in European and North American freshwaters, Global Biogeochem. Cycles, 31, 1488–1500, https://doi.org/10.1002/2017GB005749, 2017.
Blöschl, G., Bierkens, M. F. P., Chambel, A., Cudennec, C. , Destouni, G., Fiori, A., Kirchner, J. W., McDonnell, J. J., Savenije, H. H. G., Sivapalan, M., Stumpp, C., Toth, E., Volpi, E., Carr, G., Lupton, C., Salinas, J., Széles, B., Viglione, A., Aksoy, H., Allen, S. T., Amin, A., Andréassian, V., Arheimer, B., Aryal, S. K., Baker, V., Bardsley, E., Barendrecht, M. H., Bartosova, A., Batelaan, O., Berghuijs, W. R., Beven, K., Blume, T., Bogaard, T., Borges de Amorim, P., Böttcher, M. E., Boulet, G., Breinl, K., Brilly, M., Brocca, L., Buytaert, W., Castellarin, A., Castelletti, A., Chen, X., Chen, Y., Chen, Y., Chifflard, P., Claps, P., Clark, M. P., Collins, A. L., Croke, B., Dathe, A., David, P. C., de Barros, F. P. J., de Rooij, G., Di Baldassarre, G., Driscoll, J. M., Duethmann, D., Dwivedi, R., Eris, E., Farmer, W. H., Feiccabrino, J., Ferguson, G., Ferrari, E., Ferraris, S., Fersch, B., Finger, D., Foglia, L., Fowler, K., Gartsman, B., Gascoin, S., Gaume, E., Gelfan, A., Geris, J., Gharari, S., Gleeson, T., Glendell, M., Gonzalez Bevacqua, A., González-Dugo, M. P., Grimaldi, S., Gupta, A. B., Guse, B., Han, D., Hannah, D., Harpold, A., Haun, S., Heal, K., Helfricht, K., Herrnegger, M., Hipsey, M., Hlaváčiková, H., Hohmann, C., Holko, L., Hopkinson, C., Hrachowitz, M., Illangasekare, T. H., Inam, A., Innocente, C., Istanbulluoglu, E., Jarihani, B., Kalantari, Z., Kalvans, A., Khanal, S., Khatami, S., Kiesel, J., Kirkby, M., Knoben, W., Kochanek, K., Kohnová, S., Kolechkina, A., Krause, S., Kreamer, D., Kreibich, H., Kunstmann, H., Lange, H., Liberato, M. L. R., Lindquist, E., Link, T., Liu, J., Loucks, D. P., Luce, C., Mahé, G., Makarieva, O., Malard, J., Mashtayeva, S., Maskey, S., Mas-Pla, J., Mavrova-Guirguinova, M., Mazzoleni, M., Mernild, S., Misstear, B. D., Montanari, A., Müller-Thomy, H., Nabizadeh, A., Nardi, F., Neale, C., Nesterova, N., Nurtaev, B., Odongo, V. O., Panda, S., Pande, S., Pang, Z., Papacharalampous, G., Perrin, C., Pfister, L., Pimentel, R., Polo, M. J., Post, D., Prieto Sierra, C., Ramos, M.-H., Renner, M., Reynolds, J. E., Ridolfi, E., Rigon, R., Riva, M., Robertson, D. E., Rosso, R., Roy, T., Sá, J. H. M., Salvadori, G., Sandells, M., Schaefli, B., Schumann, A., Scolobig, A., Seibert, J., Servat, E., Shafiei, M., Sharma, A., Sidibe, M., Sidle, R. C., Skaugen, T,, Smith, H., Spiessl, S. M., Stein, L., Steinsland, I., Strasser, U., Su, B., Szolgay, J., Tarboton, D., Tauro, F., Thirel, G., Tian, F., Tong, R., Tussupova, K., Tyralis, H., Uijlenhoet, R., van Beek, R., van der Ent, R. J., van der Ploeg, M., Van Loon, A. F., van Meerveld, I., van Nooijen, R., van Oel, P. R., Vidal, J.-P., von Freyberg, J., Vorogushyn, S., Wachniew, P., Wade, A. J., Ward, P., Westerberg, I. K., White, C., Wood, E. F., Woods, R., Xu, Z., Yilmaz, K. K., and Zhang, Y.: Twenty-three unsolved problems in hydrology (UPH) – a community perspective, Hydol. Sci. J., 64, 1141–1158, https://doi.org/10.1080/02626667.2019.1620507, 2019.
Burek, P., Satoh, Y., Fischer, G., Kahil, M. T., Scherzer, A., Tramberend, S., Nava, L. F., Wada, Y., Eisner, S., Flörke, M., Hanasaki, N., Magnuszewski, P., Cosgrove, B., and Wiberg, D.: Water futures and solution – fast track initiative (final report), International Institute for Applied Systems Analysis, Laxenburg, Austria, 2016.
Burns, D. A., Riva-Murray, K., Bode, R. W., and Passy, S.: Changes in stream chemistry and biology in response to reduced levels of acid deposition during 1987–2003 in the Neversink River Basin, Catskill Mountains, Ecol. Ind., 8, 191–203, https://doi.org/10.1016/j.ecolind.2007.01.003, 2008.
Clair, T. A.: Acid rain effects to Atlantic Canada: where we stand and the long road to recovery, Presentation to Mersey Tobiatic Research Institute, Kempt, Nova Scotia, Canada, 2012.
Clair, T. A., Dennis, I. F., and Vet, R.: Water chemistry and dissolved organic carbon trends in lakes from Canada's Atlantic Provinces: no recovery from acidification measured after 25 years of lake monitoring, Can. J. Fish. Aquat. Sci., 68, 663–674, https://doi.org/10.1139/f2011-013, 2011.
Collignon, C., Boudot, J.-P., and Turpault, M.-P.: Time change of aluminium toxicity in the acid bulk soil and the rhizosphere in Norway spruce (Picea abies (L.) Karst.) and beech (Fagus sylvatica L.) stands, Plant Soil, 357, 259–274, https://doi.org/10.1007/s11104-012-1154-2, 2012.
Committee on the Status of Endangered Wildlife in Canada: COSEWIC assessment and status report on the Atlantic salmon, Salmo salar, Committee on the Status of Endangered Wildlife in Canada, Ottawa, Canada, 2011.
DataStream Initiative: WQX Comparison, GitHub [data set], https://github.com/datastreamapp/schema/blob/main/docs/WQX.md, last access: 25 February 2022.
DeHayes, D. H., Schaberg, P. G., Hawley, G. J., and Strimbeck, G. R.: Acid rain impacts on calcium nutrition and forest health: alteration of membrane-associated calcium leads to membrane destabilization and foliar injury in red spruce, Bioscience, 49, 789–800, 1999.
Dennis, I. F. and Clair, T. A.: The distribution of dissolved aluminum in Atlantic salmon (Salmo salar) rivers of Atlantic Canada and its potential effect on aquatic populations, Can. J. Fish. Aquat. Sci., 69, 1174–1183, https://doi.org/10.1139/f2012-053, 2012.
de Wit, H. A., Eldhuset, T. D., and Mulder, J.: Dissolved Al reduces Mg uptake in Norway spruce forest: results from a long-term field manipulation experiment in Norway, Forest Ecol. Manag., 259, 2072–2082, https://doi.org/10.1016/j.foreco.2010.02.018, 2010.
Döll, P. and Zhang, J.: Impact of climate change on freshwater ecosystems: a global-scale analysis of ecologically relevant river flow alterations, Hydrol. Earth Syst. Sci., 14, 783–799, https://doi.org/10.5194/hess-14-783-2010, 2010.
Driscoll, C. T., Driscoll, K. M., Fakhraei, H., and Civerolo, K.: Long-term temporal trends and spatial patterns in the acid-base chemistry of lakes in the Adirondack region of New York in response to decreases in acidic deposition, Atmos. Environ., 146, 5–14, https://doi.org/10.1016/j.atmosenv.2016.08.034, 2016.
Environment and Climate Change Canada: National Long-term Water Quality Monitoring Data, http://data.ec.gc.ca/data/substances/monitor/national-long-term-water-quality-monitoring-data/, last access: 19 March 2022, 2019.
European Environment Agency – European Environment Information and Observation Network (Eionet): Waterbase - Water Quality ICM, https://www.eea.europa.eu/data-and-maps/data/waterbase-water-quality-icm-1 (last access: 5 April 2022), 2019.
Feller, M. C.: Forest harvesting and streamwater inorganic chemistry in western North America: a review, J. Am. Water Resour. Assoc., 41, 786–811, https://doi.org/10.1111/j.1752-1688.2005.tb03771.x, 2005.
Galloway, J. N., Norton, S. A., and Church, M. R.: Freshwater acidification from atmospheric deposition of sulfuric acid: A conceptual model, Environ. Sci. Technol., 17, 541–545, 1983.
Gensemer, R. W. and Playle, R. C.: The bioavailability and toxicity of aluminum in aquatic environments, Crit. Rev. Environ. Sci. Technol., 29, 315–450, https://doi.org/10.1080/10643389991259245, 1999.
Goldewijk, K. K., Beusen, A., van Drecht, G., and de Vos, M.: The HYDE 3.1 spatially explicit database of human-induced global land-use change over the past 12,000 years, Global Ecol. Biogeogr., 20, 73–86, https://doi.org/10.1111/j.1466-8238.2010.00587.x, 2011.
Google: Search Engine Optimization (SEO) starter guide – search console help: https://support.google.com/webmasters/answer/7451184?hl=en (last access: 7 July 2020), 2002.
Gooseff, M. N. and Lyons, W.: Dissolved organic carbon (DOC) concentrations in glacial meltwater streams, McMurdo Dry Valleys, Antarctica (1990–2020, ongoing), Environmental Data Initiative [data set], https://doi.org/10.6073/pasta/878eccb6e5c8e492f933381b8c257 d79, 2022a.
Gooseff, M. N. and Lyons, W.: Ion concentrations in glacial meltwater streams, McMurdo Dry Valleys, Antarctica (1993–2020, ongoing), Environmental Data Initiative [data set], https://doi.org/10.6073/pasta/275ee580f3c93f077dd7ddcce1f2e cdd, 2022b.
Gooseff, M. N. and Lyons, W.: Nitrogen and phosphorus concentrations in glacial meltwater streams, McMurdo Dry Valleys, Antarctica (1993–2020, ongoing), Environmental Data Initiative [data set], https://doi.org/10.6073/pasta/f6131f5ef67901bc98027e9df55ec 364, last access: 4 April 2022c.
Harriman, R., Anderson, H., and Miller, J. D.: The role of sea-salts in enhancing and mitigating surface water acidity, Water Air Soil Pollut., 85, 553–558, https://doi.org/10.1007/BF00476887, 1995.
Harrison, J. A., Seitzinger, S. P., Bouwman, A. F., Caraco, N. F., Beusen, A. H. W., and Vörösmarty, C. J.: Dissolved inorganic phosphorus export to the coastal zone: Results from a spatially explicit global model, Global Biogeochem. Cycles, 19, https://doi.org/10.1029/2004GB002357, 2005a.
Harrison, J. A., Caraco, N., and Seitzinger, S. P.: Global patterns and sources of dissolved organic matter export to the coastal zone: Results from a spatially explicit, Global Biogeochem. Cycles, 19, https://doi.org/10.1029/2005GB002480, 2005b.
Hartmann, J., Lauerwald, R., and Moosdorf, N.: A brief overview of the GLObal RIver Chemistry Database, GloRiCh, Proced. Earth Plan. Sci., 10, 23–27, https://doi.org/10.1016/j.proeps.2014.08.005, 2014.
Hartmann, J., Lauerwald, R., and Moosdorf, N.: GloRiCh – Global river chemistry database, PANGAEA [data set], https://doi.org/10.1594/PANGAEA.902360, 2019.
Holland, E. A., Braswell, B. H., Sulzman, J., and Lamarque, J.-F.: Nitrogen deposition onto the United States and Western Europe: synthesis of observations and models, Ecol. Appl., 15, 38–57, https://doi.org/10.1890/03-5162, 2005.
Howden, N. J. K., Burt, T. P., Worrall, F., and Whelan, M. J.: Monitoring fluvial water chemistry for trend detection: hydrological variability masks trends in datasets covering fewer than 12 years, J. Environ. Monit., 13, 514, https://doi.org/10.1039/c0em00722f, 2011.
ISO/IEC JTC 1/SC 2: ISO/IEC 10646:2017 Information technology – Universal Coded Character Set (UCS), International Organization for Standardization, Geneva, Switzerland, 2017.
ISO/TC 147 SC2: ISO 15586:2003 Water quality – determination of trace elements using atomic absorption spectrometry with graphite furnace, International Organization for Standardization, Geneva, Switzerland, 2003.
Kopáček, J., Ulrich, K.-U., Hejzlar, J., Borovec, J., and Stuchlík, E.: Natural inactivation of phosphorus by aluminum in atmospherically acidified water bodies, Water Res., 35, 3783–3790, https://doi.org/10.1016/S0043-1354(01)00112-9, 2001.
Kottek, M., Grieser, J., Beck, C., Rudolf, B., and Rubel, F.: World map of the Köppen-Geiger climate classification updated, Meteorol. Z., 15, 259–263, https://doi.org/10.1127/0941-2948/2006/0130, 2006.
Letterman, R. D. and Driscoll, C. T.: Survey of residual aluminum in filtered water, J. Am. Water Works Assoc., 80, 154–158, 1988.
Leys, C., Ley, C., Klein, O., Bernard, P., and Licata, L.: Detecting outliers: Do not use standard deviation around the mean, use absolute deviation around the median, J. Exp. Soc. Psych., 49, 764–766, https://doi.org/10.1016/j.jesp.2013.03.013, 2013.
Li, R., Cui, L., Zhao, Y., Meng, Y., Kong, W., and Fu, H.: Estimating monthly wet sulfur (S) deposition flux over China using an ensemble model of improved machine learning and geostatistical approach, Atmos. Environ., 214, 116884, https://doi.org/10.1016/j.atmosenv.2019.116884, 2019.
Linke, S., Lehner, B., Ouellet Dallaire, C., Ariwi, J., Grill, G., Anand, M., Beames, P., Burchard-Levine, V., Maxwell, S., Moidu, H., Tan, F., and Thieme, M.: Global hydro-environmental sub-basin and river reach characteristics at high spatial resolution, Sci. Data, 6, 283, https://doi.org/10.1038/s41597-019-0300-6, 2019.
Lyons, W.: Dissolved Inorganic Carbon in Streams, Environmental Data Initiative [data set], https://doi.org/10.6073/pasta/4d64208bd91fc6a336c9c388436b1 634, 2015a.
Lyons, W.: Stream Nutrients for Reactivated Channel, Environmental Data Initiative [data set], https://doi.org/10.6073/pasta/b3d212996e5e4cb7f91b82090b4 f550d, 2015b.
Lyons, W. and McKnight, D. M.: Stream Chemistry for Reactivated Channel. Environmental Data Initiative [data set], https://doi.org/10.6073/pasta/ed143e49e82d0aaa1494447ebcee 17c1, 2015.
Mekonnen, M. M. and Hoekstra, A. Y.: Four billion people facing severe water scarcity, Sci. Adv., 2, e1500323, https://doi.org/10.1126/sciadv.1500323, 2016.
Meybeck, M.: Global occurrence of major elements in rivers, in: Surface and ground water, weathering, and soils, vol. 5, Elsevier-Pergamon, Oxford, 207–223, 2004.
Monteith, D. T., Stoddard, J. L., Evans, C. D., de Wit, H. A., Forsius, M., Høgåsen, T., Wilander, A., Skjelkvåle, B. L., Jeffries, D. S., Vuorenmaa, J., Keller, B., Kopácek, J., and Vesely, J.: Dissolved organic carbon trends resulting from changes in atmospheric deposition chemistry, Nature, 450, 537–540, https://doi.org/10.1038/nature06316, 2007.
Namieśnik, J. and Rabajczyk, A.: The speciation of aluminum in environmental samples, Crit. Rev. Anal. Chem., 40, 68–88, https://doi.org/10.1080/10408340903153234, 2010.
National Water Quality Monitoring Council: Water Quality Portal, https://www.waterqualitydata.us, last access: 7 September 2019.
Priscu, J.: Dissolved inorganic carbon (DIC) concentrations in discrete water column samples collected from lakes in the McMurdo Dry Valleys, Antarctica (1993–2017, ongoing). Environmental Data Initiative [data set], https://doi.org/10.6073/pasta/e68682ea6614259b4f091be206a77 3b8, 2018.
Priscu, J.: Hydrogen ion concentrations (pH) in discrete water column samples collected from lakes in the McMurdo Dry Valleys, Antarctica (1993–2018, ongoing), Environmental Data Initiative [data set], https://doi.org/10.6073/pasta/a0c17e313c63f6b5e5e5e071e5ba6 b4a, 2019.
Priscu, J.: Dissolved organic carbon (DOC) concentrations in discrete water column samples collected from lakes in the McMurdo Dry Valleys, Antarctica (1993–2022, ongoing), Environmental Data Initiative [data set], https://doi.org/10.6073/pasta/a5d82d5d2167679c8ecff0d8ad06c 0ee, 2022a.
Priscu, J.: Nitrogen and phosphorus concentrations in discrete water column samples collected from lakes in the McMurdo Dry Valleys, Antarctica (1993–2020, ongoing), Environmental Data Initiative [data set], https://doi.org/10.6073/pasta/5cba7e25aa687c1e989c72c3ee0a0 f69, 2022b.
Priscu, J., Welch, K. A., and Lyons, W.: Ion concentrations in discrete water column samples collected from lakes in the McMurdo Dry Valleys, Antarctica (1991–2019, ongoing), Environmental Data Initiative [data set], https://doi.org/10.6073/pasta/31f7354d1a05679eb3ce7c384c6e2 b22, 2022.
Rotteveel, L. and Heubach, F.: The Surface Water Chemistry (SWatCh) database, Zenodo [data set], https://doi.org/10.5281/zenodo.6484939, 2021.
Rotteveel, L. and Heubach, F.: The Surface Water Chemistry Database (SWatCh), GitHub [code], https://github.com/LobkeRotteveel/SWatCh, last access: 24 April 2022.
Rotteveel, L. and Sterling, S. M.: Five aluminum seasonality regimes identified in chronically acidified rivers of Nova Scotia, Environ. Sci. Technol., 54, 807–817, https://doi.org/10.1021/acs.est.9b04872, 2020.
Rousseeuw, P. J. and Hubert, M.: Robust statistics for outlier detection: Robust statistics for outlier detection, WIREs Data Mining Knowl. Discov., 1, 73–79, https://doi.org/10.1002/widm.2, 2011.
Ščančar, J. and Milačič, R.: Aluminium speciation in environmental samples: a review, Anal. Bioanal. Chem., 386, 999–1012, https://doi.org/10.1007/s00216-006-0422-5, 2006.
Serwadda, D., Ndebele, P., Grabowski, M. K., Bajunirwe, F., and Wanyenze, R. K.: Open data sharing and the Global South – Who benefits?, Science, 359, 642–643, https://doi.org/10.1126/science.aap8395, 2018.
Shaw, R. W.: Acid precipitation in Atlantic Canada, Environ. Sci. Technol., 13, 406–411, https://doi.org/10.1021/es60152a006, 1979.
Stoddard, J. L., Jeffries, D. S., Lükewille, A., Clair, T. A., Dillon, P. J., Driscoll, C. T., Forsius, M., Johannessen, M., Kahl, J. S., Kellogg, J. H., Kemp, A., Mannio, J., Monteith, D. T., Murdoch, P. S., Patrick, S., Rebsdorf, A., Skjelkvåle, B. L., Stainton, M. P., Traaen, T., van Dam, H., Webster, K. E., Wieting, J., and Wilander, A.: Regional trends in aquatic recovery from acidification in North America and Europe, Nature, 401, 575–578, https://doi.org/10.1038/44114, 1999.
Thu, H. N. and Wehn, U.: Data sharing in international transboundary contexts: the Vietnamese perspective on data sharing in the Lower Mekong Basin, J. Hydrol., 536, 351–364, https://doi.org/10.1016/j.jhydrol.2016.02.035, 2016.
United Nations: http://www.un.org/en/members/index.shtml, last access: 5 June 2020, 2009.
United Nations Environment Programme: GEMStat database of the Global Environment Monitoring System for freshwater (GEMS/Water) Programme. International Centre for Water Resources and Global Change, Koblenz, GEMS/Water Data Centre, http://gemstat.org (last access: 24 March 2022), 2017.
US EPA: EPA method 200.7 Determination of metals and trace elements in water and wastes by inductively coupled plasma-atomic emission spectrometry, Environmental Monitoring Systems Laboratory, Cincinnati, Ohio, https://doi.org/10.1016/B978-0-8155-1398-8.50010-0, 2015.
US EPA: Water Quality Exchange, United States Government, https://www.epa.gov/sites/default/files/2015-11/documents/wqx_factsheet.pdf (last access: 27 February 2022), 2021.
USGS: World Geologic Maps [data set], https://certmapper.cr.usgs.gov/data/apps/world-maps/, last access: 4 April 2022.
Weyhenmeyer, G. A., Hartmann, J., Hessen, D. O., Kopáček, J., Hejzlar, J., Jacquet, S., Hamilton, S. K., Verburg, P., Leach, T. H., Schmid, M., Flaim, G., Nõges, T., Nõges, P., Wentzky, V. C., Rogora, M., Rusak, J. A., Kosten, S., Paterson, A. M., Teubner, K., Higgins, S. N., Lawrence, G. B., Kangur, K., Kokorite, I., Cerasino, L., Funk, C., Harvey, R., Moatar, F., de Wit, H. A., and Zechmeister, T.: Widespread diminishing anthropogenic effects on calcium in freshwaters, Sci. Rep.-UK, 9, 10450, https://doi.org/10.1038/s41598-019-46838-w, 2019.
World Health Organization: Aluminium in drinking-water: Background document for development of WHO Guidelines for Drinking-water Quality, WHO Press, Geneva, Switzerland, 2010.
World Health Organization and United Nations Children's Fund: Progress on Drinking Water, Sanitation and Hygiene: 2017 Update and SDG Baselines, Geneva, Switzerland, 2017.