Abstract
We report detailed mineralogy and geochemistry of hydrothermal mounds and chimneys in the TA25 West vent field (TA25 WVF), a newly discovered magmatic–hydrothermal system in the Tonga (Tofua) arc. Chimney samples are classified as sulfate- or sulfide-rich, based on major sulfide, sulfosalt, and sulfate minerals. The former type represents a simple mineral assemblage of predominance of anhydrite/gypsum + barite + pyrite, whereas the sulfide-rich chimneys show three different stages of mineralization with decreasing fluid temperature: sphalerite–pyrite dominated stage I, sphalerite–sulfosalts dominated stage II, and stage III is dominated by seawater alteration. Mound samples are characterized by sulfide assemblages and paragenesis similar to those of sulfide-rich samples, but abundant chalcopyrite indicates a relatively high-temperature mineralization. The chimney and mound samples are enriched in Au (average 9.2 ppm), Ag (297 ppm), As (1897 ppm), Sb (689 ppm), Hg (157 ppm), and Se (34.6 ppm). LA–ICP–MS and FE–TEM studies indicate that most of these elements occur in sulfides or sulfosalts in solid solution, although some occur as nanoparticles. This is mainly controlled by the combined effects of fluid conditions (temperature and redox state) and influx of ambient seawater. Petrography and trace-element compositions of sulfides and/or sulfosalts suggest that most concentrations of Au and Ag in the TA25 WVF result from the precipitation and/or adsorption of Au–Ag-bearing nanoparticles on rapidly crystallized sulfides, the substitution of Au and Ag in sulfide and/or sulfosalt minerals, and the saturation of Ag in hydrothermal fluids during late, relatively low-temperature mineralization (< 150 °C). The maximum measured temperature (242 °C) of venting fluids and calculated formation temperatures of sphalerite (229–267 ℃) are below the boiling temperature of seawater at the depths (966–1096 m) of the TA25 WVF, suggesting fluid boiling had little effect on Au–Ag-rich mineralization in the TA25 WVF. The presence of enargite–tetrahedrite–tennantite assemblages, high concentrations of magma-derived elements (e.g., Au, Ag, As, Sb, Hg, and Se), low δ34S values (2.1 to 4.3‰) of sulfide minerals relative to the host rocks, and the distribution of CO2-rich hydrothermal plumes (500 to 1000 ppm) suggest that the TA25 WVF is a submarine hydrothermal system influenced by a magmatic contribution in an arc setting. Our results indicate that the magmatic contribution is most likely to play an important role in supplying various metals, including Au and Ag, to the TA25 WVF. Subsequently, the rapid crystallization of sulfides induced by abundant fluid-seawater mixing significantly contributes to the precipitation of Au–Ag-rich mineralization.
Introduction
Seafloor massive sulfide (SMS) deposits have been discovered in various tectonic settings including mid-ocean ridges (MORs), volcanic arcs, and back-arc spreading centers (Hannington et al. 2005; Fuchs et al. 2019) since the discovery of deep seafloor hydrothermal activity in the Galapagos Spreading Center in 1977 (Corliss et al. 1979). Some SMS deposits are characterized by high concentrations of base (e.g., Cu, Zn, Pb) and/or precious metals (e.g., Au and Ag) of economic interest (Hannington et al. 2011; Webber et al. 2015; Knight et al. 2018; Zhang et al. 2020). Therefore, the investigation of their mineralogy, geochemistry, and conditions of formation is an important research focus in marine economic geology.
Metals in SMS deposits originate mainly from leaching of wall rocks or from magmatic fluid exsolution from underlying magma. The deposits in volcanic arc settings tend to have more magmatic input than those in MOR settings (de Ronde et al. 2005, 2011) due to the relatively shallow depth of their magma chambers and the hydrous, oxidizing, and volatile-rich nature of arc magmas (Ruscitto et al. 2010; Wallace et al. 2015; Zheng et al. 2016; Piccoli et al. 2019). Submarine magmatic–hydrothermal systems are commonly characterized by enrichments in Cu and Au and, to a lesser extent in Ag, As, Sb, and Hg relative to hydrothermal systems along MORs, which has been suggested to be related to a magmatic fluid influx (de Ronde et al. 2005, 2014; Hannington et al. 2005; Zhu et al. 2020). In particular, Au–Cu-rich mineralization is one of the most outstanding features of arc-related SMS deposits (de Ronde et al. 2011; Berkenbosch et al. 2012; Falkenberg et al. 2021). However, the mechanism of Au–Ag-rich mineralization is poorly constrained, although fluid boiling, mixing of Au-bearing fluid with ambient seawater, and the physico-chemical conditions of fluids (e.g., temperature and redox state) may play prominent roles (Herzig et al. 1993; Moss and Scott 2001; de Ronde et al. 2011; de Ronde and Stucker 2015; Gartman et al. 2018; Iizasa et al. 2019; Diehl et al. 2020; Zhang et al. 2020). Hence, further studies are required to better understand the Au–Ag-rich mineralization in arc-related hydrothermal systems.
Numerous studies have focused on the trace element compositions of sulfide minerals because the geochemistry of individual sulfide crystals from different types of hydrothermal vent fields can help to constrain the ore-forming processes associated with variable physicochemical conditions of hydrothermal fluids (Belissont et al. 2014; Keith et al. 2016; Maslennikov et al. 2017; Meng et al. 2020; Choi et al. 2021). In addition, the S isotope composition of sulfide minerals is commonly used to define the source components, such as wall-rock leaching of metal from substrates and potential contributions of magmatic volatiles (de Ronde et al. 2005, 2011; Yeats et al. 2014; Falkenberg et al. 2021). Therefore, the high-resolution trace element data and S isotope composition of sulfide minerals can be useful to trace the factors controlling the Au–Ag-rich mineralization.
The Tonga–Kermadec arc is the most hydrothermally active region in the western Pacific Ocean. Numerous studies have been conducted on hydrothermal vent fields in the Kermadec arc (Brothers, Clark, Rumble II West, Macauley and Monowai systems; de Ronde et al. 2003, 2005, 2007, 2011; Berkenbosch et al. 2012; Leybourne et al. 2012a, b) but little is known about the hydrothermal vent fields in the Tonga arc. The case studies in the Tonga arc have focused on hydrothermal vent fields with sulfide–sulfate chimneys at TA26 volcano (“V19-HR” in the SO-167 cruise; Stoffers et al. 2006) and Niua volcanic complex (Keith et al. 2016; Gartman et al. 2018; Falkenberg et al. 2021).
Since 2012, the Korea Institute of Ocean Science and Technology (KIOST) has explored seafloor hydrothermal vent fields for 26 volcanic edifices aligned in a 600-km-long survey area within the Tonga arc (Fig. 1; Stoffers et al. 2003). A major finding was the discovery of new hydrothermal vent fields on the eastern and western sides of the TA25 volcanic caldera (“V18s-HR” in the SO-167 cruise; Stoffers et al. 2006), i.e., the West (TA25 WVF) and East (TA25 EVF) vent fields, respectively. In this study, we report the first detailed results of the mineralogy and geochemistry of sulfide and/or sulfosalt minerals of the TA25 WVF. This included geochemical analyses of bulk hydrothermal samples and determination of trace elements (especially Au and Ag) and S isotope composition of sulfides and/or sulfosalts. The aim is to determine the principal factors controlling the geochemical variability of select minerals and to provide additional information on the mechanisms of Au–Ag-rich mineral deposition in arc-related settings.

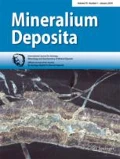
a Bathymetric map of the Tonga–Kermadec arc system showing major tectonic elements. Location of the TA25 survey area is shown by the red dotted box. b Map of survey area showing the distribution of Tonga arc volcanoes; for location of TA25, see red box. Abbreviation: LR-SMC, Louisville seamount chain
TA25 submarine volcano and hydrothermal vent field
The Tonga–Kermadec subduction system lies on the intra-oceanic convergent plate margin of the southwest Pacific Ocean, extending for ~ 2600 km between Tonga and New Zealand (Fig. 1a; de Ronde et al. 2003a, 2007). It is divided into the Tonga arc to the north and the Kermadec arc to the south, separated by the intersection of the NW–SE-trending Louisville seamount chain. The 26 submarine volcanoes are aligned subparallel with the Tonga arc, where the volcanic centers are characterized by single cones, complex calderas, or a combination of both (Fig. 1).
The TA25 submarine volcano lies in the southern part of the Tonga arc (Fig. 1b) and comprises complex volcanic edifices, including NE-trending, relatively small volcanic stratocones in the north and a large, oblate caldera with a nearby single larger volcanic cone in the south (Fig. 2a). The caldera, which has a diameter of about 6.5 km, sits on a volcanic platform with basal dimensions of 17 × 14 km. The caldera lies at a 1500-m water depth and is surrounded by 600- to 900-m-high caldera walls. A large-scale collapse feature is located on the northwestern flank of the caldera. Host rocks recovered by dredging from the caldera slopes are dominated by basalt to basaltic andesite, with minor dacite and rhyolite (Pak et al. 2018). The TA25 caldera hosts two hydrothermal vent fields; TA25 WVF at depths of 966–1096 m and TA25 EVF at depths of 900–1000 m, located on the caldera’s western and eastern slopes, respectively (Pak et al. 2018). The two vent fields show contrasting styles of hydrothermal activity (Pak et al. 2018), with the former being dominated by recent active vents that include Au–Ag-rich mineralization, while the latter shows hydrothermal activity waning, or having ceased altogether (Pak et al. 2018). The different stages of hydrothermal activity and the distance between the two fields (~ 4 km) suggest they are likely discrete hydrothermal systems within the caldera structure.

a Bathymetry map (35 × 35-m resolution) of the TA25 submarine volcano, showing stratocones to the NE and SW with several smaller cones trending NE, and the caldera volcano to the south. (b) High-resolution (5 × 5 m) bathymetry from the Canadian remotely operated vehicle (ROPOS) shows that seafloor hydrothermal vents in the TA25 WVF are distributed mainly along fracture zones at 966–1096-m depth
In the TA25 WVF study area, hydrothermal vents are distributed mainly along NE–SW- or NW–SE-trending depression zones (generally ~ 20 × 20 m), which might be parts of a conjugate fault set (Fig. 2b). The in situ sensor on the Canadian remotely operated vehicle (ROPOS) identified CO2-rich (500 to 1000 ppm) hydrothermal plumes that are distributed around the active vents (ESM 1 Fig. S1). Chimneys are mostly < 1.5 m in height but reach ~ 2 m, typically with single spires that taper at the top and are intermittently capped by delicate beehive structures (Fig. 3a). White-colored barite and bacteria mats cover the outermost surfaces of chimneys and surrounding areas, respectively (Fig. 3a, b). Chimneys are generally clustered and commonly aligned NE–SW, subparallel to the direction of possible radial fracture zones (Figs. 2b and 3c). Most chimneys are expelling transparent fluids with a maximum temperature of 242 ℃ at 1074 m water depth (Fig. 3d). Small venting structures, known as dwarf chimneys (usually < 0.3 m in height), are also widespread in the TA25 WVF area (Fig. 3e). They are characterized by single spires expelling fluids at up to 150 ℃. Mineralogical studies indicate that the dwarf chimneys are sulfate-rich. Sulfide mounds are typically < 5 m in diameter (Fig. 3f). Weakly diffuse venting characterized by low-temperature conditions (< 100 ℃) is commonly observed there (Fig. 3f). Vent megafauna occur in close proximity to the hydrothermal activity (Fig. 3g). Mussels, shrimps, sea anemones, barnacles and crabs occur with the active chimneys and/or mounds. Inactive chimneys, indicative of past hydrothermal activity, occur intermittently and are on average slightly taller (~ 2 m) than currently active chimneys (Fig. 3h).

Photographs of hydrothermal vents in the TA25 WVF from ROPOS. a Active chimneys feature single spires with “beehive” structures as indicated by the white arrow. b White barite and bacteria mats cover surfaces of the chimney and mound structures. c A NE–SW-trending cluster of chimneys. d Measured fluid temperatures were up to 242 ℃. e A dwarf chimney (< 0.3-m height) expelling clear fluids at temperatures of up to 150 ℃. f Small scale (< 5-m diameter) sulfide mound covered with Fe–Mn oxides. g Vent fauna around an active hydrothermal vent at 1068-m depth. h Dead chimney spires (~ 2-m height) occur intermittently in the TA25 WVF
Analytical methods
During three ROPOS dives and four TV-guided grab (GTV) deployments, a number of hydrothermal chimneys and mounds from the TA25 WVF were recovered. We selected four chimneys and six mounds (Fig. 4 and Table 1) that represent different mineralogical types for detailed mineralogical and geochemical analysis. Bulk chemical compositions of selected hydrothermal samples (n = 75) were determined by the “Code 8-AR ICP–OES”, “Au–Ag Fire Assay,” “1D Enhanced INAA,” and “Ultratrace 1 ICP–MS” packages at Actlabs (Ancaster, Ontario, Canada). Detection limits for each element are listed in ESM 2 Table S1. Mineral identification and textural interpretation of sulfides, sulfates, and sulfosalts were undertaken by reflected-light microscopy using 53 polished sections made to distinguish between the exteriors and interiors of the chimney and mound samples (Table 1).

Sampled hydrothermal sulfides from the TA25 WVF. Sulfate-rich chimney: a The major constituents are anhydrite, gypsum, and barite. b Multiple conduits mantled by pyrite. Sulfide-rich chimney: c Sphalerite lines structures around the innermost vent conduit (yellow arrow in inset). d Multiple vent conduits in chimney interiors. Mound samples: e Cu-rich part on the broken surface. f Massive barite zones commonly occurring in exterior parts. g Discrete aggregates of chalcopyrite and pyrite occur in crust-like samples. h A large mound sample showing Cu-rich mineralization. Black scale bars are 5 cm in length. Abbreviations: anh, anhydrite; brt, barite; cp, chalcopyrite; gy, gypsum; mrc, marcasite; py, pyrite; sp, sphalerite
Major-element compositions of individual minerals such as pyrite, marcasite, sphalerite, chalcopyrite, galena, tetrahedrite-tennantite, polybasite-pearceite, and acanthite were determined by energy dispersive spectrometry (EDS) using a JEOL JXA-8600 SX system at Korea University, Seoul, South Korea. The electron microprobe analysis (EPMA) system was operated with an accelerating voltage of 20 kV, a beam current of 2nA, and a beam diameter of 3 μm. The following reference materials were used for calibration using the ZAF correction method in an INCA software platform: ZnS (for Zn, S), CuFeS2 (for Cu), FeS2 (for Fe), PbS (for Pb), CdS (for Cd), Sb2S3 (for Sb), InAs (for As), and pure metal (for Ag). The data are provided in ESM 2 Table S2.
Trace-element analyses of discrete minerals included the determination of 51 V, 55Mn, 57Fe, 59Co, 60Ni, 65Cu, 66Zn, 69 Ga, 74Ge, 75As, 77Se, 95Mo, 109Ag, 111Cd, 115In, 118Sn, 121Sb, 125Te, 182 W, 197Au, 202Hg, 205Tl, 208Pb, 209Bi, and 238U contents by laser ablation–inductively coupled plasma–mass spectrometry (LA–ICP–MS) with a 193 nm excimer LA system (ESI NWR 193, USA) coupled to an Agilent 7700 quadrupole ICP–MS at KIOST, Busan, South Korea. The ablation beam diameter was 15–50 μm, depending on grain size, with a pulse rate of 10 Hz and energy fluence of 5.5 J cm−2. The total analysis time for each spot was 90 s (s), with 40 s of background measurement and 50 s of sample ablation. External calibration was performed using the standard STDGL3 (Belousov et al. 2014). The MASS-1 sulfide reference material (also known as PS-1: Wilson et al. 2002) was analyzed as an unknown sample to assess data quality (ESM 2 Table S3). Results indicate a relatively standard deviation (RSD) of < 5% for most elements, and up to 15% for Tl. The data acquisition time for each element was 0.02 s except for Fe, Zn, Cu, and Pb, when it was 0.01 s. The Fe, Cu, Zn, and Pb determined by EPMA were used as internal standards for the quantification of trace-element concentrations of pyrite and/or marcasite, chalcopyrite, and/or tetrahedrite–tennantite, sphalerite, and galena, respectively. The contents of V, Ga, and Hg were calculated using MASS-1 as a primary standard because STDGL3 does not contain these elements. Data reduction was carried out by using an in-house Excel spreadsheet, applying the method of Longerich et al. (1996). The spectra with spikes of some elements were avoided when calculating the trace element contents of sulfides in order to exclude the effects of impurities. The LA–ICP–MS data are presented in ESM 2 Tables S4–9 and correlation coefficients (R2 values) for bivariate elements are listed in ESM 2 Tables 10–12.
A field emission gun (FEI Quanta 3D FEG) was used to prepare cross-sectional samples for field emission–transmission electron microscopy (FE–TEM) studies at the Korea Basic Science Institute (KBSI), Daejeon, South Korea. A FE–TEM equipped with EDS was used to identify Au–Ag-bearing minerals at a lower scale of < 1 μm (i.e., nano-inclusions or solid solution) at KBSI. High-angle annular dark-field scanning TEM (HAADF–STEM) images and EDS spectra were acquired using a JEOL JEM-2100F system operated at 200 kV.
Sulfur isotopic compositions of pyrite, chalcopyrite, and sphalerite separates were determined by the “Code 10A-δ34S sulfide” package at Actlabs. Hydrothermal samples were crushed to 60 mesh in an agate mortar, and individual sulfide grains were handpicked under a binocular microscope. Twenty sulfide mineral separates were prepared for isotope analysis. δ34S values were calculated against international standards NBS-127 (NIST-RM 8557), IAEA-SO-5 (RM 8533), and IAEA-SO-6 (RM 8554). Reproducibility was < 0.5‰ (1σ).
Results
Mineralogy and paragenesis
Sulfide-rich chimney samples
The sampled TA25 WVF chimneys are classified as sulfate- and sulfide-rich types (Figs. 4a, b, c, d, 5 and Table 1). During early stage I, trace amounts of pyrite (py-Ia) and sphalerite (sp-Ia) replaced barite in the outermost walls of sulfide-rich chimneys (Fig. 5a). As mineralization proceeded, proportions of colloform pyrite (py-Ib), marcasite (mrc), and sphalerite (sp-Ib) increase during the later parts of the stage I mineralization (Fig. 5b, c). Relatively late stage I pyrite commonly contains relics of previously formed pyrite (py-Ia), with the pyrite becoming increasingly more massive through recrystallization (Fig. 5c). Galena (gn-I) occurs either along the grain boundaries of late pyrite or is co-genetic with late sphalerite and chalcopyrite (cp-I; Fig. 5b, d).

Photomicrographs of typical mineral assemblages in chimney. Sulfide-rich chimneys: a early pyrite (py-Ia), sphalerite (sp-Ia), and barite dominate the mineralogy of the outer chimney walls, b colloform pyrite and sphalerite (py-Ib and sp-Ib) indicate rapid cooling of the hydrothermal fluid (Berkenbosch et al. 2012; Keith et al. 2016), with BSE image (inset) showing trace galena inclusions (red arrows) within pyrite, c pyrite containing relic of early formed pyrite, suggesting that recrystallization changed py-Ia to more massive py-Ib, d co-precipitation of galena and sphalerite, e galena and tetrahedrite–tennantite aggregates in sp-II, f dendritic chalcopyrite, galena, and tetrahedrite–tennantite, g sphalerite grain lining the innermost vent conduit; note the distinct gray-scale zonation (inset), and h, i covellite and mimetite occurring in seawater alteration Stage III. Sulfate-rich chimneys; j pyrite replaces anhydrite, k trace galena precipitated along growth boundaries of pyrite (red arrows), and l sphalerite and chalcopyrite fill cavities in pyrite. Red squares in (e) and (g) indicate the areas of focused ion beam (FIB) sample preparation. Abbreviations: anh, anhydrite; ams, amorphous silica; brt, barite; cp, chalcopyrite; cv, covellite; gn, galena; mrc, marcasite; mi, mimetite; py, pyrite; sp, sphalerite; ttr–tnt, tetrahedrite–tennantite solid solution. Roman numerals indicate the mineralization stage; “a” and “b” indicate the early and late minerals in each mineralization stage, respectively
The stage II mineralization of sulfide-rich chimneys is distinguished by abundant coprecipitated sphalerite (sp-IIa), galena (gn-II), and tetrahedrite–tennantite (ttr–tnt), deposited in chimney interiors (Fig. 5e). Galena and tetrahedrite–tennantite rarely form dendritic intergrowths with chalcopyrite (cp-II; Fig. 5f). In particular, stage II sphalerite is characterized by spherulite growth in the innermost part of the chimney, with a distinct color change in backscattered-electron (BSE) images (Figs. 4c and 5g). Galena and tetrahedrite-tennantite are aligned along these color zonation boundaries that distinguish the latest sphalerite (sp-IIb), which has precipitated along the vent conduit (Fig. 5g). Covellite, mimetite (mi), and amorphous silica replaced previously formed minerals during the seawater alteration, as part of stage III (Fig. 5h, i).
Sulfate-rich chimney samples
Sulfate-rich chimneys comprise mainly anhydrite and/or gypsum and barite, with minor pyrite and trace chalcopyrite, sphalerite, and galena (Table 1). Sulfide minerals mainly occur around multiple vent conduits, replacing sulfates (Fig. 5j). Pyrite generally shows a colloform texture, with galena precipitating in growth zones of pyrite (Fig. 5k). Trace chalcopyrite and sphalerite occur rarely in association with pyrite (Fig. 5j, l), commonly filling cavities in pyrite grains.
Mound samples
Mound samples are characterized by mineral assemblages and paragenesis similar to those of sulfide-rich chimneys (Figs. 6 and 7). However, they have a higher proportion of chalcopyrite compared to the chimney samples (Fig. 4e, g, h and Table 1). Stage I mainly comprises chalcopyrite and pyrite and/or marcasite with minor enargite and tetrahedrite–tennantite (Fig. 6; Table 1). Chacopyrite (cp-I) is characterized by sub- to euhedral crystals and surrounds pyrite and marcasite (Fig. 6a, b). Pyrite exhibits two distinct textures, spheroidal and altered massive. The spheroidal pyrite (py-Ia) grains are commonly early stage I aggregates (Fig. 6a). As mineralization proceeded, euhedral marcasite (up to ~ 3 mm in grain size) became a dominant Fe mineral (Figs. 6b and 7). Marcasite is partly transformed to massive pyrite (py-Ib) late in stage I (Fig. 6b) when enargite (eng) and tetrahedrite–tennantite (ttr–tnt-I) replaced chalcopyrite and early pyrite (Fig. 6c).

Photomicrographs of typical mineral assemblages in mound samples. a Pyrite (Py-Ia), interpreted to be early based on spheroidal texture, is predominant in the interior, replaced by chalcopyrite (cp-I). b Euhedral marcasite (mrc-I) forms as mineralization progresses, being transformed to altered porous textured pyrite (py-Ib) in some cases. c Enargite and tetrahedrite–tennantite (ttr–tnt-I) replace chalcopyrite. d Pyrite overgrowths (py-II) on grain boundaries of marcasite. e Dendritic intergrowth of sphalerite (sp-IIa) and chalcopyrite (cp-IIa), with trace galena (gn-IIa). f Sphalerite (sp-IIb) with distinct color zonation (yellow arrows) along grain boundaries. g Sphalerite commonly replaced grain boundaries or cracks of galena (gn-IIb). h Tetrahedrite–tennantite (ttr–tnt-II) and polybasite–pearceite replacing galena. i Covellite replacing galena. Dotted red box (inset) shows that trace amounts of polybasite-pearceite and acanthite precipitated along grain boundaries. j Bornite replacing chalcopyrite. Abbreviations: ac, acanthite; bn, bornite; eng, enargite; pol–pea, polybasite–pearceite solid solution; other abbreviations are as in Fig. 5

Paragenetic sequence of representative mineralization in the TA25 WVF
Early stage II is characterized by overgrowths of pyrite (py-II) and sphalerite (sp-IIa) along grain boundaries of stage I marcasite and/or chalcopyrite (Fig. 6d, e). In this stage, pyrite commonly displays a colloform texture (Fig. 6d), whereas sphalerite forms dendritic intergrowths with chalcopyrite (cp-IIa) (Fig. 6e). Trace amounts of galena (gn-IIa) occur along grain boundaries of sphalerite. As mineralization proceeds, sphalerite (sp-IIb), galena (gn-IIb), and tetrahedrite–tennantite (ttr–tnt-II) are the predominant minerals during late stage II (Fig. 6f, g, h). Galena and tetrahedrite-tennantite are replaced intermittently by fine-grained polybasite–pearceite (pol-pea) and acanthite (ac; Fig. 6h, i). Following the stage II mineralization, mound samples underwent stage III seawater alteration when amorphous silica (ams), bornite (bn), and covellite (cv) replaced previously formed sulfide and/or sulfosalt minerals (Fig. 6i, j).
Bulk chemistry
Average Zn, Cu, and Pb contents are 31.8, 1.3, and 1.9 wt.% in sulfide-rich chimneys, and 8.2, 5.0, and 0.6 wt.% in mounds, respectively (ESM 2 Table S1). Sulfate-rich chimneys are characterized by low Zn, Cu, and Pb contents, generally of < 1 wt.% (ESM 2 Table S1).
Sulfide-rich chimneys and mounds have trace-element contents of 0.5–35 ppm Au, 10–1970 ppm Ag, 514–5260 ppm As, 14–4730 ppm Sb, 1–666 ppm Hg, 0.8–147 ppm Se, and 5–368 ppm Mo (ESM 2 Table S1). These elements are generally more enriched in the sulfide-rich chimney samples than in the mound samples, although there is a noticeable overlap for most elements. Sulfate-rich chimneys are typically less enriched than both the sulfide-rich chimneys and the mounds, though again there is some overlap for a few elements (Fig. 8). Gold and Ag contents are strongly correlated with each other, showing a narrow range for Ag/Au values (Fig. 8a). Gold contents of mounds are positively correlated with Zn, As, Sb, Hg, and Mo, but negatively correlated with Cu and Se (Fig. 8). Similar correlations of these elements are characteristics of sulfide-rich chimneys, with the exception that Cu contents show a weak positive correlation with Au (Fig. 8c). Sulfate-rich chimney samples are generally depleted in Zn, Cu, Mo and Se at a given Au content (Fig. 8b, c, g, h). In particular, mound samples show high values of Cu/Au and Se/Au compared to chimney samples (Fig. 8c, h).

Comparison of the bulk chemistry of hydrothermal sulfides from the TA25 WVF, with log/log plots of a Au–Ag, b Au–Zn, c Au–Cu, d Au–As, e Au–Sb, f Au–Hg, g Au–Mo, and h Au–Se. Black and gray diamonds in (a) indicate Au and Ag concentrations of hydrothermal sulfides from arc-back-arc and MOR settings, respectively (Hannington et al. 2005)
Mineral chemistry
The chemical compositions of sphalerite, pyrite/marcasite, chalcopyrite, galena, and tetrahedrite-tennantite were analyzed taking into account different types of samples and mineralization stages. The results are summarized in ESM 2 Tables S2 and S4.
Sphalerite
Sphalerite from mound and sulfide-rich chimney samples has diverse compositions depending on mineralization stage (Fig. 7 and ESM 2 Tables S2, S4). The results of EPMA analyses show that FeS contents of the sphalerite are gradually lower in later-stage hydrothermal assemblage (ESM 1 Fig S2). Elemental mapping exhibits that most stage II sphalerites in the mounds and sulfide-rich chimneys are characterized by variations in Cu, As, Ag, Sb, and Pb contents (ESM 1 Fig S3).
The trace element contents determined by LA–ICP–MS show that relatively high contents of Sb (1925–13,719 ppm in Sp-Ib), Hg (468–1963 ppm in Sp-Ib), Cu (7594–28,115 ppm in Sp-IIa), Ge (100–142 ppm in Sp-IIb), As (6,281–12,572 ppm in Sp-IIb), Ag (3276–5523 ppm in Sp-IIb), Au (38.6–65.4 ppm in Sp-IIb), and Pb (16,515–22,460 ppm in Sp-IIb) are observed in sphalerite from the sulfide-rich chimneys, whereas those for Ga (114–1094 ppm in Sp-IIa) and Se (14.3–126 ppm in Sp-IIa) are associated with sphalerite from the mounds (ESM 1 Fig S4 and ESM2 Table S4). The LA–ICP–MS time-resolved spectra of sphalerite are generally flat, with spikes of Cu, As, Sb, Ag, Sb, Au, Hg, and Pb occurring in some spectra (ESM 1 Fig. S5a–c).
The Ga/Ge values and Se contents of mound sphalerite are substantially higher in early sphalerite (sp-IIa) than in late sphalerite (sp-IIb), similar to those of sulfide-rich chimneys (Fig. 9a, b). Sphalerites from mounds and sulfide-rich chimneys show no significant difference in Mn contents, but they have widely varying Mn contents (Fig. 9c and ESM 2 Table S4). The Cu, Ge, As, Ag, Sb, Au, and Pb contents of sphalerite are generally positively correlated with each other (Fig. 9d, e, f and ESM 2 Table S10). Most sphalerite samples plot on a As:Ag = 1:1 line (Fig. 9d), but a trend sub-parallel to the Ge:Ag = 1:2 line is limited to relatively Ag-poor (< 30 ppm) sphalerite from mounds (Fig. 9e). The sphalerite As/Sb value typically exhibits a narrow range of fluctuations (ΔAs/Sb = 0.3–0.7) among different mineralization stages, but is variable in early sphalerite (sp-IIa) of stage II in sulfide-rich chimneys (ΔAs/Sb = 1.9; Fig. 9g and ESM 2 Table S5). Mound sphalerite shows a positive correlation between Au and Hg contents (R2Au-Hg = 0.71; Fig. 9h and ESM 2 Table S10). In contrast, Hg contents are lower in stage II sphalerite in sulfide-rich chimneys relative to stage I sphalerite, with no correlation between Hg and Au contents (Fig. 9h).

Pyrite/marcasite
Pyrite from the sulfate- and sulfide-rich chimney samples has similar contents for most trace elements (ESM 1 Fig S4) and is enriched in Mn (114–2465 ppm), Ni (0.2–19.5 ppm), As (207–29,078 ppm), Mo (1.5–139 ppm), Ag (126–1391 ppm), Sb (84–4697 ppm), Au (9.3–61.9 ppm), Hg (0.7–852 ppm), and Pb (802–30,544 ppm) but depleted in Se, and Te relative to mound pyrite and marcasite (Fig. 10 and ESM 2 Table S4). Trace-element compositions of pyrite and/or marcasite in the different mineralization stages are shown in ESM 1 Fig. S4 and ESM 2 Table S4. The Co contents of pyrite and/or marcasite do not appear to differ between chimneys and mounds, but Ni contents are commonly low (< 20 ppm), or below the detection limit, in mound samples (Fig. 10a). High Co/Ni values are therefore confined mainly to mound over chimney pyrite. Selinium contents decrease with increasing Mn content but have a strong positive correlation with Te in stage I mound pyrite and/or marcasite (R2Se-Te = 0.75) and stage II mound pyrite (R2Se-Te = 0.83), respectively (Fig. 10b, c and ESM 2 Table S11). In particular, high contents of Se (20–710 ppm) and Te (0.1–335 ppm) are mainly confined to stage I mound pyrite and/or marcasite compared to other pyrites (Fig. 10b, c and ESM 2 Table S4). Most data for pyrite and/or marcasite commonly indicate positive correlations between As, Sb, Au, Ag, and Pb with Ag/Sb and Pb/Sb values of 1 and 2, respectively (Fig. 10d, e); an exception is the Au contents of chimney pyrite, which are negatively correlated with Pb and Sb (Fig. 10f). Some pyrites from sulfide-rich chimneys (py-Ib) and mounds (py-II) are characterized by high Au contents with high Au/As values (Fig. 10g). Although Mo contents have no correlation with other trace elements, it is higher (up to 139 ppm) in py-Ib from sulfide-rich chimneys than in other pyrites and/or marcasites (Fig. 10h and ESM 2 Table S4).

A detailed investigation of the trace-element distribution in marcasite and stage II pyrite was undertaken for the mound samples (ESM 1 Fig S6a). Results show that trace-element compositions are highly variable and related to Se contents (ESM 1 Fig S6b). In other words, Mn, Ag, Sb, Au, Hg, and Pb are more enriched in Se-poor domains of Stage II pyrite, whereas As is more enriched in Se-rich domains of both marcasite and stage II pyrite.
Chalcopyrite
Chemical compositions of chalcopyrite were obtained only for mound samples because grain sizes of chimney chalcopyrite were too small for EPMA or LA–ICP–MS analyses (ESM 2 Tables S2, S4, S7). Chalcopyrite is enriched in Se (up to 178 ppm), Ag (215 ppm) and As (725 ppm), whereas the contents of other trace elements are generally near, or below, the detection limit for LA–ICP–MS (ESM 2 Table S4). The Se content of chalcopyrite decreases from stage I to stage II (ESM 1 Fig S7a). The Ag content shows a negative correlation with the Se content in stage I chalcopyrite (R2Ag-Se = –0.66) and stage II chalcopyrite (R2Ag-Se = –0.4; ESM 2 Table S12), respectively, together with higher values in the latter (ESM 1 Fig. S7a, b and ESM 2 Table S4). Gold contents of chalcopyrite are generally < 0.1 ppm and do not vary between stage I and stage II mineralization (ESM 1 Fig S7b and ESM 2 Table S4). Chalcopyrite generally displays a positive correlation between As and Sb contents, but some chalcopyrite grains from stage I mineralization are substantially more enriched in As compared to other chalcopyrites (ESM 1 Fig S7c).
Galena
Galena is enriched in Ag (at up to 2.72 wt.%) and Sb (3.07 wt.%) compared to most other trace elements (ESM 2 Tables S2 and S8). The results of LA–ICP–MS analyses for galena were obtained only from mound samples where massive crystals are common (Fig. 6). It shows that galena contains various trace elements, such as As (0.1–12 ppm), Se (2.7–5.76 ppm), Mo (0.1–2.14 ppm), Te (0.1–0.27 ppm), Au (0.1–0.35 ppm) and Hg (0.8–2.9 ppm; ESM 2 Table S4), similar to those of mound pyrite and/or chalcopyrite (ESM 1 Fig. S4).
Tetrahedrite-tennantite
The results of EPMA ananlysis show that early tetrahedrite–tennantite (trt–tnt-I) of mound samples is depleted in Sb and Ag but enriched in Cu and As relative to late tetrahedrite–tennantite (ttr–tnt-II) and chimney tetrahedrite–tennantite (ttr–tnt) (ESM 2 Table S2). The highest Sb and Ag contents measured in late tetrahedrite–tennantite were 19.6 and 16.4 wt.%, respectively (ESM 1 Fig S8a), with a wide range of As–Sb substitution in tetrahedrite–tennantite solid solution (ESM 1 Fig S8b and ESM 2 Table S2). In contrast, trace-element compositions of tetrahedrite–tennantite were only determined for sulfide-rich chimney samples due to the small grain size of tetrahedrite–tennantite from the mounds (Fig. 6). The tetrahedrite–tennantite from sulfide-rich chimney contains Mn (up to 25.8 ppm), Ge (146 ppm), Mo (1372 ppm) and Hg (45.7 ppm), but other elements generally have low concentrations of < 4 ppm (ESM 2 Tables S4, S9).
FE–TEM–EDS analysis
FE–TEM analyses were undertaken for early stage II sphalerite (sp-IIa) of sulfide-rich chimneys to assess the effect of submicroscopic particles on trace-element contents (Fig. 11). The HAADF–STEM images show that the discrete grains of sphalerite are aggregated, which is suggestive of overgrowth and/or recrystallization (Choi et al. 2021; Fig. 11a, b, c). A large number of nanometer-scale inclusions occur along the grain boundaries of sphalerite. EDS analysis indicates that these inclusions are distinguished from sphalerite by their high X-ray counts of As, Ag, and Sb, whereas their semiquantitatively measured Pb contents (up to 1.09 wt.%) are equivocal owing to interference between PbMα and SKα X-rays (Fig. 11d).

Sulfur isotopic compositions of sulfides
Sulfur isotopic signatures of 20 sulfide separates (pyrite, sphalerite, and chalcopyrite) were determined in sulfate- and sulfide-rich chimney and mound samples from the TA25 WVF (Table 2). The δ34S values show no difference among sample types, ranging from 2.1‰ to 4.3‰ (Fig. 12). In particular, the values are within the range for island arc lavas (δ34S = 0.1‰ to 20.7‰; Ueda and Sakai 1984; Woodhead et al. 1987; Alt et al. 1993; Hoog et al. 2001) and sulfides influenced by magmatic volatiles from the arc-related Conical Seamount (δ34S = − 13.0‰ to 6.1‰; Gemmell et al. 2004) and Brothers vent fields (δ34S = − 5.6‰ to 2.8‰; de Ronde et al. 2005, 2011).

Sulfur isotopic compositions of sulfide separates from different types of hydrothermal samples in the TA25 WVF. Fields for sulfides influenced by magmatic volatiles from the arc-related hydrothermal systems (Gemmell et al. 2004; de Ronde et al. 2005, 2011), island arc lavas (Ueda and Sakai 1984; Woodhead et al. 1987; Alt et al. 1993; Hoog et al. 2001), and seawater (Rees et al. 1978)
Discussion
Evolution of hydrothermal fluids during mineralization
Mineral assemblages, abundances, and textures of hydrothermal sulfides in TA25 WVF mounds and sulfide-rich chimneys suggest substantial changes in the mineralization conditions (e.g., fluid temperature and redox state) between stage I and stage II, later overprinted by seawater alteration (stage III) (Figs. 5, 6, and 7). By contrast, the sulfate-rich chimneys represent a simple mineralization process consisting of sulfates with minor sulfides (Fig. 7). This reflects an incipient stage of hydrothermal activity, given that formation of an initial sulfate wall is followed by sulfide deposition during typical chimney growth (Haymon 1983; Berkenbosch et al. 2012).
Mound samples are characterized by Cu–Zn-rich sulfides (Fig. 7 and Table 1). Stage I involved the principal deposition of chalcopyrite (cp-I) followed by early pyrite (py-Ia), late pyrite (py-Ib), and marcasite (mrc-I), indicating high-temperature Cu-rich fluids (~ 300 ℃; Fig. 6a, b; Berkenbosch et al. 2012; Nayak et al. 2014; Wu et al. 2016). As mineralization progressed, the paragenesis of sulfide and/or sulfosalt minerals, particularly the transition from pyrite + chalcopyrite to enargite + tetrahedrite–tennantite (tet–ten-I) assemblages (Fig. 6c), may be attributed mainly to a contribution of acid–sulfate fluids related to magmatic volatiles (Giggenbach 1992; Arribas 1995; Yang and Scott 1996; de Ronde et al. 2011, 2019; Berkenbosch et al. 2019). In contrast to stage I, stage II involved Zn-rich suphide deposition, with most sulfide minerals displaying dendritic and/or colloform textures (Fig. 6d, e). These textures represent disequilibrium mineralization caused by rapid crystallization due to abundant fluid-seawater mixing, indicating immature mineralization (Maslennikov et al. 2009; Berkenbosch et al. 2012; Wohlgemuth-Ueberwasser et al. 2015; Keith et al. 2021). This indicates that hydrothermal fluids decreased temperature and increased ƒO2 and pH conditions in this stage (Haymon 1983; Tivey and McDuff 1990; Berkenbosch et al. 2012).
Sphalerite shows two different generations (sp-IIa and sp-IIb) depending on the mineral assemblage, with early sphalerite associated to chalcopyrite (cp-IIa) + pyrite (py-II) ± galena (gn-IIa), whereas late sphalerite precipitated in a mineral assemblage of galena (gn-IIb) + tetrahedrite–tennantite (ttr–tnt-II) ± chalcopyrite (cp-IIb) (Fig. 6d, e, f, g). Galena and tetrahedrite–tennantite are typical for low-temperature mineralization (< 150 ℃; e.g., Nayak et al. 2014; Wu et al. 2016), and therefore the distinct mineralogical relationships between early and late sphalerite indicate that the fluid temperature decreased during stage II. Such a temperature gradient is more evident in the sphalerite thermometry. Sphalerite Fe/Zn value is temperature-dependent (Barton and Toulmin 1966; Scott and Barnes 1971), and thus it can be used to independently estimate the depositional temperature of sphalerite (Keith et al. 2014). We obtained formation temperature ranges of 229–267 and 229–246 ℃ for sp-IIa and sp-IIb, respectively (ESM 2 Table S2).
Discrete grains of native Au were not observed microscopically (Fig. 6), although hydrothermal sulfides from the mound samples are substantially enriched in Au (ESM 2 Table S1). This suggests that most Au may occur as nanoparticles, or as structurally bound Au incorporated into sulfide lattices in the form of so-called “invisible” Au (Cook and Chryssoulis 1990; Moss and Scott 2001; Bortnikov et al. 2003; Gartman et al. 2018). Unlike Au, however, the occurrence of polybasite–pearceite solid solution and acanthite, which replace galena and tetrahedrite–tennantite, is clear evidence that the relatively low-temperature fluids (< 150 ℃) of stage II were saturated with Ag (Fig. 6h, i). This implies that the difference in solubility of dominant aqueous species for Au (e.g., Au(HS)2−) and Ag (e.g., AgCl2−) in hydrothermal fluids may be one of the important factors controlling the different degrees of saturation between Au and Ag (Seward 1989; Herzig et al. 1993; Fuchs et al. 2019).
Sulfide-rich chimney samples are characterized by abundant sphalerite with trace chalcopyrite (Table 1). Such sulfide assemblage is similar to that of the stage II mound samples (Fig. 7), indicating relatively low-temperature mineralization (Tivey 1995; Nayak et al. 2014; Wu et al. 2016). This is consistent with the calculated formation temperatures (229 ℃–252 ℃) of sphalerite in sulfide-rich chimneys (ESM 2 Table S2).
Stage I assemblages of barite + sphalerite (early sphalerite sp-Ia and late sphalerite sp-Ib) + pyrite (early pyrite py-Ia and late pyrite py-Ib) + marcasite ± galena (gn-I) ± chalcopyrite (cp-I; Fig. 7) display colloform and/or dendritic textures (Fig. 5a, b, c). This indicates the rapid precipitation caused by abundant fluid-seawater mixing under disequilibrium conditions (Berkenbosch et al. 2012; Wohlgemuth-Ueberwasser et al. 2015; Jamieson et al. 2016; Keith et al. 2016). Such a disequilibrium environment may result in the co-precipitation of sphalerite, pyrite, and galena (Fig. 5b, c, d). In contrast to stage I, stage II mineralization is dominated by sphalerite (sp-IIa and sp-IIb), galena (gn-II), and tetrahedrite–tennantite (ttr–tnt), with trace pyrite and marcasite (Fig. 5e, f, g, h). Considering that galena and tetrahedrite-tennantite are typical for low-temperature mineralization (< 150 ℃; Nayak et al. 2014; Wu et al. 2016), the hydrothermal fluid temperature likely decreased as mineralization progressed from stage I to stage II. This is consistent with FeS contents decreasing from sp-Ib through sp-IIa to sp-IIb (ESM 1 Fig S2). In other words, the results of sulfide assemblages, measured fluid temperatures (up to 242 ℃), and sphalerite thermometry (229–252 ℃) indicate that hydrothermal mineralization in sulfide-rich chimneys most likely occurred below about 250 ℃ (Figs. 3d, 5 and ESM 2 Table S2). This is mainly controlled by the influx of seawater, which may produce small amounts of chalcopyrite in sulfide-rich chimneys compared to mounds (Fig. 7 and Table 1). As a result, trace amounts of chalcopyrite (cp-II) intermittently formed unusual intergrowths with galena and tetrahedrite–tennantite (Fig. 5f), with hydrothermal fluid remaining in a metastable, “low-temperature” state during the growth of the sulfide-rich chimneys.
Sulfide-rich chimneys are also significantly concentrated in Au (10.5–35 ppm) and Ag (322–1970 ppm; ESM 2 Table S1), but there is no mineralogical evidence supporting the saturation of Au and Ag throughout the mineralization stages, unlike in the mound samples (Figs. 5, 6, and 7). This suggests that most Au and Ag in sulfide-rich chimneys occur as invisible nanoparticles, or in solid solution, which are not resolvable microscopically.
The latest sulfide minerals in the mound and sulfide-rich chimney samples formed during seawater alteration (stage III). Mineral assemblages, including bornite and covellite replacing chalcopyrite, galena, and sphalerite are commonly reported in other SMS deposits in different geological settings (Figs. 5h and 6i, j; de Ronde et al. 2011; Wang et al. 2014; Yeats et al. 2014; Wu et al. 2016). This indicates more oxidizing conditions that could be achieved readily through increased mixing with seawater (Herzig et al. 1993; de Ronde et al. 2011; Wu et al. 2016). The occurrence of anglesite, mimetite, and Fe-oxyhydroxides in this stage also supports a low-temperature (< 100 ℃) alteration process (Fig. 7; Nayak et al. 2014; Wu et al. 2016).
In summary, the sulfide-rich chimneys and mounds in the TA25 WVF are characterized by three different stages as mineralization proceeded: main-mineralization (stage I), late-mineralization (stage II), and seawater alteration (stage III), as a result of decreasing fluid temperature due to increased fluid-seawater mixing. This may also play an important role in determining the enrichment in precious metals including Au and Ag in the TA25 WVF.
Controls on trace elements in the TA25 WVF sulfides
The distribution of trace elements in sphalerite, pyrite, and tetrahedrite–tennantite was investigated in detail, as they are the main host minerals for the majority of trace elements in the TA25 WVF (ESM 2 Table S4). The trace elements occur as solid solutions or mineral inclusions, and their abundances are mainly controlled by fluid conditions (temperature and redox state) and the effect of seawater mixing (Figs. 9, 10 and ESM 1 S8).
Fluid temperature and redox state
Ga/Ge values and Se contents of sphalerite can be explained as a function of mineralization temperature (Möller 1987; Maslennikov et al. 2009). In both mound and sulfide-rich chimney samples, Ga/Ge values and Se contents decrease in sphalerite (< 10 Ga/Ge, 2.8–33 ppm Se in mounds and < 1 Ga/Ge, 1.3–4.6 ppm Se in sulfide-rich chimneys) from relatively late mineralization stages, possibly indicating that fluid temperatures decreased as mineralization progressed (Fig. 9a, b and ESM 2 Table S4). This is consistent with the fact that the occurrence of low-temperature mineral assemblage of galena and tetrahedrite-tennantite (< 150 ℃; Nayak et al. 2014; Wu et al. 2016) is limited to relatively late mineralization stages in mounds and sulfide-rich chimneys, respectively (Fig. 7).
The Mn contents of sphalerite are comparable between mound and sulfide-rich chimney samples, but they widely vary from 35 to 329 ppm (Fig. 9c and ESM 2 Table S4). Considering that the redox conditions of the hydrothermal fluids are important in controlling the distribution of Mn in sphalerite (Kelley et al. 2004; Maslennikov et al. 2009), the range of Mn contents suggests that the redox state of the mineralizing fluids may undergo substantial changes during sphalerite precipitation (Fig. 9c). This may result from the pulse of hydrothermal fluid with a possible magmatic contribution, given that continuous “pulsing” of gas- and S-rich acidic fluids occurs over minutes and hours in arc-related hydrothermal systems (Ronde et al. 2011; Berkenbosch et al. 2019).
The effects of fluid temperature and redox state are more evident in the geochemistry of pyrite and tetrahedrite-tennantite. It is generally thought that Co and Se are preferentially incorporated into pyrite under relatively high temperature, reducing conditions, whereas Ni and Mn are incorporated in lower temperature, oxidizing conditions (Auclair et al. 1987; Large et al. 2007; Maslennikov et al. 2009; Liu et al. 2012; Grant et al. 2018; Li et al. 2021). Mound pyrite is characterized by high Co/Ni values (> 0.1) and Se contents (9.3–710 ppm), but low Mn contents (0.4–230 ppm) relative to chimney pyrite (Fig. 10a, b, c and ESM 2 Table S4). Thus, pyrite was likely precipitated in the mounds from relatively high-temperature, reduced fluids. In particular, such elevated Co/Ni values and Se contents and low Mn contents of mound pyrite are mainly confined to stage I mineralization (Fig. 10a, b, c), where euhedral to subhedral and medium to large sulfide grains and abundant chalcopyrite reflect more stable high-temperature reduced conditions (~ 300 ℃) with a lesser amount of seawater mixing (Fig. 6a, b; Berkenbosch et al. 2012; Nayak et al. 2014; Wohlgemuth-Ueberwasser et al. 2015). The reduced mineralization conditions also can explain enrichment of Te in mound pyrite (up to 335 ppm) relative to chimney pyrite (mostly below the detection limit of LA–ICP–MS; ESM 2 Table S4), with strong positive correlations (R2Te–Se = 0.75 − 0.83) between Te and Se contents (Fig. 10c and ESM 2 Table S11). This is most likely due to the significant decrease in Te solubility at low ƒO2 conditions in hydrothermal fluids (Grundler et al. 2013), although high As contents (1.1–8654 ppm; ESM 2 Table S4) of mound pyrite may also influence the defect formation in pyrite lattice, contributing to the incorporation of Te (Reich et al. 2005; Keith et al. 2018).
The Cu, As, Sb, and Ag contents of tetrahedrite–tennantite vary between sulfide-rich chimneys and mounds (ESM 2 Table S2). Compared with stage I tetrahedrite–tennantite in mound samples, stage II tetrahedrite–tannantite contains low concentrations of Cu (26.7–38.9 wt.%) and As (5.2–11.4 wt.%) and high Sb (12.4–19.6 wt.%) and Ag (1.1–16.4 wt.%) contents, similar to chimney tetrahedrite–tennantite (ESM 1 Fig S8). This indicates that the abundance of Cu, As, Sb, and Ag in TA25 hydrothermal fluids underwent substantial changes when tetrahedrite–tennantite precipitated. The As/Sb value of tetrahedrite–tennantite is also dependent on the temperature of the mineralizing fluids, with the incorporation of As compared to Sb being favored by relatively high-temperature conditions (Sack and Loucks 1985). The occurrence of As-rich tetrahedrite–tennantite in stage I mound thus indicates precipitation from relatively high-temperature fluids compared with the Sb-rich stage II tetrahedrite–tennantite and chimney tetrahedrite–tennantite (ESM 1 Fig S8). In particular, the Sb-rich tetrahedrite-tennantite contains high Ag contents (0.9–16.4 wt.%), together with paragenetic relationships with galena and sphalerite (Fig. 7 and ESM 2 Table S2). These minerals indicate precipitation from relatively low-temperature, oxidizing environments during the later mineralization stage II in both mound and sulfide-rich chimney samples (Fig. 7). By contrast, the Ag-depleted (< 0.1 wt.%) tetrahedrite–tennantite in stage I mound is mainly associated with chalcopyrite and pyrite (Figs. 6c, 7 and ESM 2 Table S2), reflecting relatively high-temperature environments. These results indicate that Ag-rich mineralization was facilitated by relatively low-temperature fluids in the TA25 WVF.
We conclude that the changes in fluid temperature and redox state play an important role in determining trace element contents of sphalerite (e.g., Ga/Ge, Se, Mn), pyrite (e.g., Co/Ni, Se, Mn, Te), and tetrahedrite-tennantite (e.g., As, Sb, Ag) between mound and sulfide-rich chimney samples in the TA25 WVF.
Effect of seawater mixing
The contents of Mn, As, Ag, Sb, Au, Hg, and Pb vary with Se content in stage II mound pyrite (py-II; ESM 1 Fig S6b), suggesting changes in their solubility in hydrothermal fluids with variable degrees of seawater mixing, as incorporation of Se into pyrite is considered sensitive to seawater influx (Huston et al. 1995). The enrichments in these elements are commonly found in sulfide minerals considered to have formed in temperatures of < 250 ℃ (Maslennikov et al. 2009; Wohlgemuth-Ueberwasser et al. 2015; Meng et al. 2020). This is consistent with the fact that py-II displays colloform textures, reflecting a rapid precipitation due to mixing with seawater (ESM 1 Fig S6a; cf. Berkenbosch et al. 2012; Wohlgemuth-Ueberwasser et al. 2015). A study by Keith et al. (2016) suggested that relatively high concentrations of Pb (i.e., ~ 2000 ppm) may be incorporated into pyrite in solid solution, but it is generally considered that Pb is unlikely to substitute directly into the sulfide lattice due to its large ionic radius (George et al. 2018; Grant et al. 2018). Therefore, the significant enrichment of Pb (average ~ 7600 ppm) in chimney pyrite is most likely due to Pb-bearing mineral inclusions (Fig. 10e, f). The molar ratios of Ag/Sb and Pb/Sb of ~ 1 and ~ 2, respectively, indicate the possible substitution of 2Pb2+ ↔ Ag+ + Sb3+ (Fig. 10d, e; George et al. 2015), with galena inclusions being responsible for Ag–Sb–Pb enrichment in the pyrite grains. As chimney pyrite occurs mainly as colloform textures indicative of disequilibrium mineralization processes (Fig. 5b, c, k), PbCl2 in the hydrothermal fluids may be rapidly oversaturated to form the Ag-Sb-Pb-bearing galena inclusions in the chimney pyrite. Such submicron-sized galena inclusions are also observed in chimney pyrite (Figs. 5b, k and ESM 1 S5d).
It should be noted that colloform pyrite in stage II mounds and chimneys is characterized by high Au contents (0.07–62 ppm) compared to other pyrite types (0.01–9.7 ppm Au) in stage I mound (ESM 2 Table S4). In contrast to Ag, however, Au contents in chimney pyrite are negatively correlated with Pb (R2Au–Pb = − 0.30) and Sb (R2Au–Sb = − 0.24) (Fig. 10e, f and ESM 2 Table S11). This suggests that the mechanism controlling the incorporation of Au into pyrite differs from that of Ag. Some Au-rich colloform pyrites have Au/As values that exceed the upper limit of Au solid solution in pyrite, suggesting the presence of Au0 inclusions (Fig. 10g; Reich et al. 2005). Such pyrite commonly shows high Mo contents (3.5–139 ppm) compared to other pyrite grains (Fig. 10h). Considering that the Au-rich pyrite is characterized by colloform textures (Fig. 5b, c) and that Mo enrichment can be used as a proxy for the influx of seawater (Keith et al. 2016; Meng et al. 2020), hydrothermal fluid–seawater mixing may play an important role in producing the Au-rich pyrite, together with the possible occurrence of Au minerals (Fig. 10g).
Unlike pyrite, sphalerite shows some evidence supporting the role of a coupled substitution process in determining Au and Ag contents. For example, the sub-parallel trend of Ag-depleted (< 100 ppm) sphalerite to the Ge/Ag = 0.5 line (Fig. 9e) reflects the coupled substitution of 3Zn2+ ↔ 2Ag+ + Ge4+ (Belissont et al. 2014). However, Ag-rich (> 100 ppm) sphalerite that has high Au contents (1–246 ppm) deviates from the 0.5 ratio (Fig. 9e, f). This suggests that another mechanism is needed to explain the enrichment of Au and Ag in sphalerite. Considering the positive correlations between Cu, As, Ag, Sb, Au, and Pb contents and a constant ratio for As:Ag of 1 (Fig. 9d, f and ESM 2 Table S10), we suggest that the incorporation of Ag and Au into sphalerite may also be controlled by the substitution of 3Zn2+ ↔ (Cu, Ag, Au)+ + Pb2+ + (As, Sb)3+. This is consistent with the LA–ICP–MS depth profiles exhibiting smooth spectra of these elements in most sphalerite (ESM 1 Fig S5a) and observations based on optical microscopy, EPMA, and FE–TEM, which did not detect any discrete grains of electrum (Figs. 5, 6, and 11). Note that the abundant influx of seawater delays the saturation of gold to very low temperatures (~ 100 ℃) because an increase in the ƒO2 of hydrothermal fluids promotes Au solubility (Fuchs et al. 2019). This may lead to high Au contents (average = 37.1 ppm) in chimney sphalerite compared to mound sphalerite (average = 27.4 ppm) without discrete Au minerals (Fig. 7 and ESM 1 Fig. S4), given that the calculated formation temperatures of sphalerite are higher in mounds (up to 267 ℃) than in chimneys (up to 252 ℃; ESM 2 Table S2).
The homogeneous distribution of As, Sb, Hg, and Pb in LA–ICP–MS time-resolved spectra suggests that these elements mainly occur as solid solutions in sphalerite (ESM 1 Fig S5a; Grammatikopoulos et al. 2006; Wohlgemuth-Ueberwasser et al. 2015). However, chimney sphalerite from early stage II (sp-IIa) shows a range of As/Sb values (0.2–2.1) that are positively correlated with Pb content (Fig. 9g), suggesting that the influence of mineral inclusions (not resolvable in LA–ICP–MS depth profiles) cannot be precluded (Figs. 5e, g and 11). Mineralogical studies show that chimney sphalerite is mainly associated with colloform textures, or contains dendritic intergrowth of galena, tetrahedrite–tennantite, and chalcopyrite (Fig. 5e, f). This suggests that mineralization occurred in a metastable state affected by mixing of hydrothermal fluid with seawater. Such mineralization conditions may facilitate the rapid saturation of As, Sb, Hg, and Pb to form submicroscopic inclusions containing these elements. This is consistent with results of the FE–TEM studies indicating the occurrence of tetrahedrite–tennantite nanoparticles along grain boundaries of chimney sphalerite early in stage II (Fig. 11).
Given the decrease in calculated formation temperatures of mound sphalerite from sp-IIa (229–267 ℃) to sp-IIb (229–246 ℃; ESM 2 Table S1), the overall increase in Hg content from sp-IIa (25.5–1343 ppm) to sp-IIb (38.8–2294 ppm) suggests that Hg contents increase with decreasing temperature (Fig. 9h and ESM 2 Table S4). This is consistent with previous studies that showed the direct substitution of Hg2+ for Zn2+ is facilitated in Fe-poor sphalerite that is in turn associated with relatively low-temperature fluid conditions (Grammatikopoulos et al. 2006; Keith et al. 2014; Frenzel et al. 2022). However, this contrasts with sphalerite from the sulfide-rich chimneys that have decreased Hg concentrations from stage I to stage II (Fig. 9h). In particular, the early stage II chimney sphalerite (sp-IIa), containing nanometer-sized tetrahedrite–tennantite inclusions, shows an Hg content similar to that of tetrahedrite–tennantite (Figs. 11 and ESM 1 S4). The partitioning of Hg into tetrahedrite–tennantite may thus result in sphalerite being depleted in Hg (Fig. 9h). This is supported by previous studies (Grammatikopoulos et al. 2006; George et al. 2017) that suggested tetrahedrite–tennantite can be primary host for Hg.
Potential sulfur source for hydrothermal mineralization.
Sulfide separates from the TA25 WVF show δ34S values of 2.1‰ to 4.3‰ (Table 2), all being lower than those of volcanic rocks from typical island arcs (Fig. 12; δ34S = 0.1‰ to 20.7‰; Ueda and Sakai 1984; Woodhead et al. 1987; Alt et al. 1993; Hoog et al. 2001). This cannot be explained by a simple mixing model between sulfur leached from volcanic rocks and reduced sulfur from seawater sulfate without an additional source of light sulfur. Isotopically light sulfur can be produced in several ways, including fluid boiling, biogenic reduction of seawater sulfate, and magmatic SO2 disproportionation (Ohmoto 1986; Mckibben and Eldridge 1990; Herzig et al. 1998).
Fluid boiling can cause sulfur isotopic fractionation owing to the preferential oxidation of H234S, induced by the loss of H2(g) (Mckibben and Eldridge 1990). However, this is unlikely to play an important role due to the water depths of the TA25 WVF (Fig. 2; 966–1096 m). The maximum measured temperature at the seafloor (Fig. 3d; 242 ℃) is below the boiling temperature of seawater at these pressures (310–321 ℃; Bischoff and Rosenbauer 1987). The Mo contents are enriched in pyrite from stage II mounds and chimneys compared to stage I mound (Fig. 10h) and that Mo enrichment can be used as a proxy for the influx of seawater (Keith et al. 2016; Meng et al. 2020), suggesting the degree of fluid-seawater mixing significantly increased as mineralization progressed. Although there are no fluid samples available to test whether fluid boiling occured in the subseafloor, the recent study suggested that significant amounts of the ore-forming elements (including Au and Ag) may not be concentrated in SMS deposits if fluid boiling occurred in the subseafloor region (Keith et al. 2021). Hence, our results suggest that fluid boiling was not important for sulfur isotopic fractionation in the TA25 WVF.
Sulfide produced by bacterial reduction is enriched in light 32S (Ohmoto 1986), with sulfur isotopic fractionation of up to 40‰ ± 10‰ (Ohmoto 1986). Although the remobilization of biogenic sulfur in marine sediments is an important source of isotopically light sulfur in seafloor hydrothermal systems (Zierenberg 1994; Shanks et al. 1995), its effect on the sulfur composition of hydrothermal sulfides is confined mainly to sediment-covered ridge systems (e.g., Guaymas Basin, Escanaba Trough, and Middle Valley; Goodfellow and Blaise 1988; Peter and Shanks 1992; Zierenberg et al. 1993). In particular, the formation temperatures of sulfide separates analyzed here are > 200 ℃ (Fig. 7), well above the range (below ~ 100 ℃) where biogenic sulfate reduction occurs (Trudinger et al. 1985). This suggests that the biogenic reduction of seawater sulfate may have a minor effect on δ34S values of sulfide separates in the TA25 WVF.
Magmatic volatiles can supply isotopically light sulfur to hydrothermal fluids through disproportionation of SO2 gas when the volcanic gases cool below 400 to 300 ℃;
(Ohmoto and Lasaga 1982). The observed δ34S values of TA25 WVF sulfide separates are all lower than those of island arc volcanic rocks (Fig. 12), but higher than those of sulfides influenced by magmatic volatiles from the arc-related Conical Seamount (δ34S = − 13.0 to 6.1‰; Gemmell et al. 2004) and Brothers vent fields (δ34S = − 5.6 to 2.8‰; de Ronde et al. 2005, 2011). Considering that the occurrence of sulfide minerals includes colloform and/or dendritic textures reflecting disequilibrium mineralization processes (Figs. 5 and 6), the dilution of magmatic sulfur by reduced sulfur from seawater sulfate (34S = ~ 21‰; Rees et al. 1978) is most likely to play an important role in generating the δ34S values of TA25 WVF sulfides. The contribution of magmatic fluids to the sulfur isotopic signatures is also supported by; (1) the occurrence of enargite and tetrahedrite–tennantite (Fig. 7; Petersen et al. 2014; Dekov et al. 2016), (2) high concentrations of magma-derived elements such as As, Sb, Au, Ag, Te and Hg (ESM Tables S1, S4; Schwarz-Schampera et al. 2001; Yeats et al. 2014; Martin et al. 2021), and (3) the distribution of CO2-rich hydrothermal plumes (500 to 1000 ppm) around active vents (ESM 1 Fig S1; de Ronde et al. 2005, 2011). These characteristics are typical of submarine magmatic–hydrothermal systems in arc-back-arc settings.
Au- and Ag-rich mineralization in the TA25 WVF
The TA25 WVF chimneys and mounds show that Au and to some extent Ag contents are higher than those of MOR settings, and more similar to the range of other arc-back-arc settings (Fig. 8a). Most Au in the TA25 WVF hydrothermal sulfides occurs as invisible or submicron phases (Figs. 5, 6, and 11). Dendritic and/or colloform sphalerite and pyrite are the main host minerals for Au (Figs. 5, 6, and ESM 1 S4), suggesting that Au-rich mineralization is controlled mainly by a disequilibrium mineralization process under relatively low-temperature conditions. This is consistent with the bulk compositions, showing that the Au-rich samples are characterized by lower values of Cu/Au and Se/Au compared to the Au-poor counterparts (Fig. 8c, h). In particular, the occurrence of an Fe–Cu–As sulfide assemblage (Fig. 7), Fe-poor sphalerite (< 6 mol.%; ESM 1 Fig. S2), high contents of As, Sb, Au, Ag, Te, and Hg (ESM 2 Table S4), and relatively low δ34S values of sulfide separates (Table 2) suggest that acid–sulfate fluids containing magmatic volatiles may have played an important role in the Au-rich mineralization (Giggenbach 1992; Arribas 1995; Yang and Scott 1996; de Ronde et al. 2011, 2019; Berkenbosch et al. 2019). Combined, these observations suggest that at the TA25 WVF Au was transported mainly as sulfide rather than chloride complexes, as the sulfide complexes have a greater affinity with low-temperature (< 250 ℃), low pH (< 4 to 5), and sulfur-rich fluids (e.g., Seward 1989; Herzig et al. 1993; Fuchs et al. 2019). The precipitation of Au, when transported as reduced sulfide, is sensitive to decreases in H2S activity (Pokrovski et al. 2014);
It is generally considered that rapid cooling (by mixing with seawater) and contemporaneous sulfide precipitation promote rapid loss of H2S from Au-bearing fluids in other Au-rich deposits (e.g., Huston and Large 1989; Herzig et al. 1993; Zhang et al. 2020). The colloform textures and dendritic intergrowths of Au-rich sulfides, together with the occurrence of massive layers of barite in the chimney and mound samples, indicate that marked changes in the fluid chemistry are required to produce Au-rich sulfides (Figs. 4–6). Variations in pH, H2S, and ƒO2 conditions ultimately influence the Au solubility in hydrothermal fluids (ESM 1 Fig S6; Herzig et al. 1993; Zhang et al. 2020) and may thus contribute to the rapid nucleation of Au-rich sulfides under non-equilibrium conditions (Butler and Rickard 2000). This is consistent with colloform pyrite with high Au contents and high Au/As values being included within a field of Au0 saturation (Reich et al. 2005; Fig. 10g). Dilution by ambient seawater and rapid crystallization of sulfides may therefore be major factors controlling a significant decrease in H2S activity, ultimately destabilizing Au sulfide complexes to facilitate Au precipitation.
Previous studies have suggested that such rapid crystallization through non-equilibrium mineralization forms sulfide minerals with abundant lattice defects, thereby promoting the adsorption of trace elements on crystal surfaces (Knipe et al. 1992; Butler and Rickard 2000; Mikhlin and Romanchenko 2007). A notable feature of the TA25 WVF sulfides is that pyrite is commonly enriched in As (ESM 2 Table S4). Arsenian pyrite facilitates the adsorption of Au onto crystal surfaces by the following reaction;
(Reich et al. 2005), which indicates that a substantial decrease in the H2S activity of hydrothermal fluids is important for the adsorption of Au. Considering that seawater mixing plays an important role in reducing H2S activity of the fluids due to rapid crystallization of sulfides, the Au-rich colloform sulfides suggest that the adsorption of Au onto crystal surfaces may be another mechanism controlling Au enrichment in the TA25 WVF (Figs. 5, 6 and ESM 1 S5). Arsenian pyrite also allows Au to exist in lattice-bound solid solution, although such substitution is likely to involve the creation of lattice vacancies to maintain charge balance;
(Deditius et al. 2008). Together, these reactions may also have an impact on the incorporation of other trace elements into sulfide and/or sulfosalt minerals in the TA25 WVF.
The TA25 WVF chimneys and mounds show that most of the Au and Ag contents are positively correlated (Fig. 8a). Unlike Au, however, the precipitation of polybasite–pearceite and acanthite after galena under low-temperature conditions (< 150 ℃) in late stage II mineralization indicates saturation of residual AgCl2− in the hydrothermal fluids (Fig. 7). This may be due to the fact that Ag is transported mainly as a chloride complex (e.g., AgCl2−) over a much wider range of temperatures, pH, and oxidation states of hydrothermal fluids than those of Au complexes (Gammons and Williams-Jones 1995; Pal’yanova 2008). We suggest that the saturation of Au in hydrothermal fluids might be further delayed to lower temperatures owing to the increased solubility of Au(HS)2− by mixing with seawater (Hannington and Scott 1989; Fuchs et al. 2019). The polybasite–pearceite and acanthite, however, may have had little effect on Ag enrichment in the TA25 WVF due to their trace amounts (Table 1). Alternatively, chimney and mound samples indicate that tetrahedrite–tennantite, galena, sphalerite, and colloform pyrite are the main host minerals for Au and Ag (ESM 1 Fig. S4), reflecting the coupled mineralization of these elements.
Conclusions
The TA25 WVF is an example of an arc-related magmatic–hydrothermal system in the Tonga arc. The paragenesis of sulfide and/or sulfosalt minerals in mound samples is divided into three stages of decreasing fluid temperature, interpreted by mineral assemblages, textures, and calculated temperatures (Fe/Zn in sphalerite); (1) stage I, chalcopyrite + pyrite/marcasite ± As-rich tetrahedrite–tennantite ± enargite; (2) stage II, sphalerite + pyrite ± chalcopyrite ± galena ± Ag–Sb-rich tetrahedrite–tennantite; and (3) stage III of amorphous silica + Fe–Mn oxyhydroxides ± bornite ± covellite ± anglesite, interpreted to be a result of alteration with seawater. Chimney samples are classified as sulfate- and sulfide-rich types with respect to major sulfides and sulfosalts. Sulfide-rich chimney samples are characterized by sulfide assemblages and a paragenesis similar to those of stage II mound samples. In contrast, sulfate-rich chimney samples have a simple mineral assemblage and paragenesis including anhydrite/gypsum + barite + pyrite ± chalcopyrite ± sphalerite ± galena assemblage, without sulfosalt minerals.
Bulk chemical analyses of hydrothermal sulfide samples show high Au (average 9.2 ppm), Ag (297 ppm), As (1897 ppm), Sb (689 ppm), Hg (157 ppm), and Se ( 34.6 ppm) contents. Based on mineral chemistry results, most of these elements occur as solid solutions, with some mineral inclusions. Together with the enrichment of trace elements, the occurrence of enargite and tetrahedrite-tennantite, relatively low δ34S values of sulfide separates, and the distribution of a CO2-rich hydrothermal plume around active vents suggest that a magmatic–hydrothermal component is likely the predominant source of metals in the TA25 WVF.
There is significant enrichment of Au–Ag in sulfides of the TA25 WVF, with the Au–Ag-rich mineralization controlled mainly by mixing of seawater with hydrothermal fluids. Mixing ultimately facilitates the precipitation and/or adsorption of Au–Ag-bearing nanoparticles on rapidly crystallized sulfides and, to some extent, the substitution of Au and Ag in sulfides and/or sulfosalts, as well as the saturation of Ag in hydrothermal fluids during the low-temperature mineralization (< 150 °C).
The formation temperature of sphalerite (229–267 ℃) calculated from Fe/Zn values and venting temperatures measured in situ of up to 242 °C are below the depth-to-boiling point for a seawater solution at the depths of the vent field. Therefore, fluid boiling is not thought to be an important factor in Au–Ag enrichment in the TA25 WVF. This differs from some arc-related SMS deposits associated with Au enrichment induced by fluid boiling. Our results should aid the understanding of the principal mechanisms controlling the distribution of Au and Ag in submarine magmatic–hydrothermal systems associated with arc volcanoes.
References
Alt JC, Shanks WC, Jackson MC (1993) Cycling of sulfur in subduction zones: the geochemistry of sulfur in the Mariana Island Arc and back-arc trough. Earth Planet Sci Lett 119:477–494
Arribas A Jr (1995) Characteristics of high-sulfidation epithermal deposits, and their relation to magmatic fluid. In: Thompson JFH (ed) Magmas, fluids, and ore deposits. Mineral Assoc Canada, Short Course Series 23:419–454
Auclair G, Fouquet Y, Bohn M (1987) Distribution of selenium in high-temperature hydrothermal sulfide deposits at 13° North, East Pacific Rise. Can Mineral 25:577–587
Barton PB, Toulmin P III (1966) Phase relations involving in the Fe–Zn–S system. Econ Geol 61:815–849
Belissont R, Boiron MC, Luais B, Cathelineau M (2014) LA-ICP-MS analyses of minor and trace elements and bulk Ge isotopes in zoned Ge-rich sphalerites from the Noailhac – Saint-Salvy deposit (France): insights into incorporation mechanisms and ore deposition processes. Geochim Cosmochim Acta 126:518–540
Belousov I, Danyushevsky LV, Olin PH, Gilbert S, Thompson JM (2014) New calibration standard for LA-ICPMS analysis of sulphides: In AGU Fall Meeting Abstracts
Berkenbosch HA, de Ronde CEJ, Gemmell JB, McNeill AW, Goemann K (2012) Mineralogy and formation of black smoker chimneys from brothers submarine volcano, Kermadec Arc. Econ Geol 107:1613–1633
Berkenbosch HA, de Ronde CEJ, Ryan CG, McNeill AW, Howard DL, Gemmell JB, Danyushevsky LV (2019) Trace element mapping of copper- and zinc-rich black smoker chimneys from brothers volcano, kermadec arc, using synchrotron radiation XFM and LA-ICP-MS. Econ Geol 114:67–92
Bischoff JL, Rosenbauer RJ (1987) Phase separation in seafloor geothermal systems; an experimental study of the effects on metal transport. Am J Sci 287:953–978
Bortnikov NS, Cabri LJ, Vikentiev IV, Tagirov BR, Me Mahon G, Bogdanov YuA, Stavrova OO (2003) Invisible gold in sulfides from seafloor massive sulfide edifices. Geol Ore Depos 45(3):201–212
Butler IB, Rickard D (2000) Framboidal pyrite formation via the oxidation of iron (II) monosulfide by hydrogen sulphide. Geochim Cosmochim Acta 64:2665–2672
Choi SK, Pak SJ, Kim J, Park JW, Son SK (2021) Gold and tin mineralisation in the ultramafic-hosted Cheoeum vent field, Central Indian Ridge. Mineral Deposita 56:885–906
Cook NJ, Chryssoulis SL (1990) Concentrations of “invisible gold” in the common sulfides. Can Mineral 28:1–16
Corliss JB, Dymond J, Gordon LI, Edmond JM, Von Herzen RP, Ballard RD, Green K, Williams D, Bainbridge A, Crane K, Van Andel TH (1979) Submarine thermal springs on the Galápagos Rift. Science 203:1073–1083
de Hoog JCM, Taylor BE, Van Bergen MJ (2001) Sulfur isotope systematics of basaltic lavas from Indonesia: implications for the sulfur cycle in subduction zones. Earth Planet Sci Lett 189:237–252
de Ronde CEJ, Stucker VK (2015) Seafloor hydrothermal venting at volcanic arcs and backarcs. In: Sigurdsson H (ed) The encyclopedia of volcanoes, Second Edi. Academic Press, 823–849
de Ronde CEJ, Faure K, Bray CJ, Chappell DA, Wright IC (2003) Hydrothermal fluids associated with seafloor mineralization at two southern Kermadec arc volcanoes, offshore New Zealand. Mineral Deposita 38:217–233
de Ronde CEJ, Hannington MD, Stoffers P, Wright IC, Ditchburn RG, Reyes AG, Baker ET, Massoth GJ, Lupton JE, Walker SL, Greene RR, Soong CWR, Ishibashi J, Lebon GT, Bray CJ, Resing JA (2005) Evolution of a submarine magmatic–hydrothermal system: Brothers volcano, southern Kermadec arc, New Zealand. Econ Geol 100:1097–1133
de Ronde CEJ, Baker ET, Massoth GJ, Lupton JE, Wright IC, Sparks RJ, Bannister SC, Reyners ME, WalkerSL GRR, Ishibashi J, Faure K, Resing JA, Lebon GT (2007) Submarine hydrothermal activity along the mid-Kermadec Arc, New Zealand: large-scale effects on venting. Geochem Geophys Geosyst 8:Q07007
de Ronde CEJ, Massoth GJ, Butterfield DA, Christenson BW, Ishibashi J, Ditchburn RG, Hannington MD, Brathwaite RL, Lupton JE, Kamenetsky VS, Graham IJ, Zellmer GF, Dziak RP, Embley RW, Dekov VM, Munnik F, Lahr J, Evans LJ, Takai K (2011) Submarine hydrothermal activity and gold-rich mineralization at Brothers volcano, Kermadec arc, New Zealand. Mineral Deposita 46:541–584
de Ronde CEJ, Walker SL, Ditchburn RG, Caratori Tontini F, Hannington MD, Merle SG, Timm C, Handler MR, Wysoczanski RJ, Dekov VM, Kamenov GD, Baker ET, Embley RW, Lupton JE, Stoffers P (2014) The anatomy of a buried submarine hydrothermal system, Clark Volcano, Kermadec Arc, New Zealand. Econ Geol 109:2261–2292
Reich M, Kesler SE, Utsunomiya S, Palenik CS, Chryssoulis SL, Ewing RC (2005) Solubility of gold in arsenian pyrite. Geochim Cosmochim Acta 69:2781–2796
de Ronde CEJ, Humphris SE, Höfig TW, Reyes AG (2019) Critical role of caldera collapse in the formation of seafloor mineralization: the case of Brothers volcano. Geology 47:762–766
Deditius AP, Utsunomiya S, Renock D, Ewing RC, Ramana CV, Becker U, Kesler SE (2008) A proposed new type of arsenian pyrite: composition, nanostructure and geological significance. Geochim Cosmochim Acta 72:2919–2933
Dekov VM, Rouxel O, Kouzmanov K, Bindi L, Asael D, Fouquet Y, Etoubleau J, Burgaud G, Wälle M (2016) Enargite-luzonite hydrothermal vents in Manus Back-Arc Basin: submarine analogues of high-sulfidation epithermal mineralization. Chem Geol 438:36–57
Diehl A, De Ronde CEJ, Bach W (2020) Subcritical phase separation and occurrence of deep-seated brines at the NW Caldera Vent Field, Brothers Volcano: evidence from fluid inclusions in hydrothermal precipitates. Geofluids 2020:1–22
Falkenberg JJ, Keith M, Haase KM, Bach W, Klemd R, Strauss H, Yeo IA, Rubin KH, Storch B, Anderson MO (2021) Effects of fluid boiling on Au and volatile element enrichment in submarine arc-related hydrothermal systems. Geochim Cosmochim Acta 307:105–132
Frenzel M, Voudouris P, Cook NJ et al (2022) Evolution of a hydrothermal ore-forming system recorded by sulfide mineral chemistry: a case study from the Plaka Pb–Zn–Ag Deposit, Lavrion, Greece. Miner Depos 57:417–438
Fuchs S, Hannington MD, Petersen S (2019) Divining gold in seafloor polymetallic massive sulfide systems. Mineral Deposita 54:789–820
Gammons CH, Williams-Jones AE (1995) Hydrothermal geochemistry of electrum; thermodynamic constraints. Econ Geol 90:420–432
Gartman A, Hannington M, Jamieson JW, Peterkin B, Garbe-Schönberg D, Findlay AJ, Fuchs S, Kwasnitschka T (2018) Boiling-induced formation of colloidal gold in black smoker hydrothermal fluids. Geology 46:39–42
Gemmell JB, Sharpe R, Jonasson IR, Herzig PM (2004) Sulfur isotope evidence for magmatic contributions to submarine and subaerial mineralization: conical seamount and the Ladolam gold deposit, Papua New Guinea. Econ Geol 99:1711–1725
George L, Cook NJ, Cristiana C, Wade BP (2015) Trace and minor elements in galena: a reconnaissance LA-ICP-MS study. Am Mineral 100:548–569
George LL, Cook NJ, Ciobanu CL (2017) Minor and trace elements in natural tetrahedrite-tennantite: effects on element partitioning among base metal sulphides. Minerals 7:17
George LL, Cook NJ, Crowe BBP, Ciobanu CL (2018) Trace elements in hydrothermal chalcopyrite. Mineral Mag 82:59–88
Giggenbach WF (1992) Isotopic shifts in waters from geothermal and volcanic systems along convergent plate boundaries and their origin. Earth Planet Sci Lett 113:495–510
Goodfellow WD, Blaise B (1988) Sulfide formation and hydrothermal alteration of hemipelagic sediment in Middle Valley, northern Juan de Fuca Ridge. Can Mineral 26:675–696
Grammatikopoulos TA, Valeyev O, Roth T (2006) Compositional variation in Hg-bearing sphalerite from the polymetallic Eskay Creek deposit, British Columbia, Canada. Geochemistry 66:307–314
Grant HLJ, Hannington MD, Petersen S, Frische M, Fuchs SH (2018) Constraints on the behavior of trace elements in the actively-forming TAG deposit, Mid-Atlantic Ridge, based on LA-ICP-MS analyses of pyrite. Chem Geol 498:45–71
Grundler PV, Brugger J, Etschmann BE, Helm L, Liu W, Spry PG, Tian Y, Testemale D, Pring A (2013) Speciation of aqueous tellurium(IV) in hydrothermal solutions and vapors, and the role of oxidized tellurium species in Te transport and gold deposition. Geochim Cosmochim Acta 120:298–325
Hannington MD, Scott SD (1989) Sulfidation equilibria as guides to gold mineralization in volcanogenic massive sulfides; evidence from sulfide mineralogy and the composition of sphalerite. Econ Geol 84:1978–1995
Hannington M, Jamieson J, Monecke T, Petersen S, Beaulieu S (2011) The abundance of seafloor massive sulfide deposits. Geology 39:1155–1158
Hannington MD, de Ronde CD, Peterse S (2005) Sea-floor tectonics and submarine hydrothermal systems. In: Hedenquist JW, Thompson JFH, Goldfarb RJ, Richards JP (eds) Economic geology 100th anniversary volume. Society of Economic Geologists, Littelton, pp 111–141
Haymon RM (1983) Growth history of hydrothermal black smoker chimneys. Nature 301:695–698
Herzig PM, Hannington MD, Fouquet Y, von Stackelberg U, Petersen S (1993) Gold-rich polymetallic sulfides from the Lau back arc and implications for the geochemistry of gold in sea-floor hydrothermal systems of the Southwest Pacific. Econ Geol 88:2182–2209
Herzig PM, Hannington MD, Arribas A (1998) Sulfur isotopic composition of hydrothermal precipitates from the Lau back-arc: implications for magmatic contributions to seafloor hydrothermal systems. Mineral Deposita 33:226–237
Huston DL, Large RR (1989) A chemical model for the concentration of gold in volcanogenic massive sulphide deposits. Ore Geol Rev 4:171–200
Huston DL, Sie SH, Suter GF, Cooke DR, Both RA (1995) Trace elements in sulfide minerals from eastern Australian volcanic-hosted massive sulfide deposits; Part I, Proton microprobe analyses of pyrite, chalcopyrite, and sphalerite, and Part II, Selenium levels in pyrite; comparison with δ34S values and implications for the source of sulfur in volcanogenic hydrothermal systems. Econ Geol 90:1167–1196
Iizasa K, Asada A, Mizuno K, Katase F, Lee S, Kojima M, Ogawa N (2019) Native gold and gold-rich sulfide deposits in a submarine basaltic caldera, Higashi-Aogashima hydrothermal field, Izu-Ogasawara frontal arc, Japan. Mineral Deposita 54:117–132
Jamieson JW, Hannington MD, Tivey MK, Hansteen T, Williamson NMB, Stewart M, Fietzke J, Butterfield D, Frische M, Allen L, Cousens B, Langer J (2016) Precipitation and growth of barite within hydrothermal vent deposits from the Endeavour Segment, Juan de Fuca Ridge. Geochim Cosmochim Acta 173:64–85
Keith M, Haase KM, Schwarz-Schampera U, Klemd R, Petersen S, Bach W (2014) Effects of temperature, sulfur, and oxygen fugacity on the composition of sphalerite from submarine hydrothermal vents. Geology 42:699–702
Keith M, Häckel F, Haase KM, Schwarz-Schampera U, Klemd R (2016) Trace element systematics of pyrite from submarine hydrothermal vents. Ore Geol Rev 72:728–745
Keith M, Smith DJ, Jenkin GRT, Holwell DA, Dye MD (2018) A review of Te and Se systematics in hydrothermal pyrite from precious metal deposits: insights into ore-forming processes. Ore Geol Rev 96:269–282
Keith M, Haase KM, Häckel F, Schwarz-Schampera U, Klemd R, Hannington M, Strauss H, McConachy T, Anderson M (2021) Trace element fractionation and precipitation in submarine back-arc hydrothermal systems, Nifonea caldera, New Hebrides subduction zone. Ore Geol Rev 135:104211
Kelley KD, Leach DL, Johnson CA, Clark JL, Fayek M, Slack JF, Anderson VM, Ayuso RA, Ridley WI (2004) Textural, compositional, and sulfur isotope variations of sulfide minerals in the Red Dog Zn-Pb-Ag deposits, Brooks Range, Alaska: implications for ore formation. Econ Geol 99:1509–1532
Knight DR, Roberts S, Webber AP (2018) The influence of spreading rate, basement composition, fluid chemistry and chimney morphology on the formation of gold-rich SMS deposits at slow and ultraslow mid-ocean ridges. Mineral Deposita 53:143–152
Knipe SW, Foster RP, Stanley CJ (1992) Role of sulfide surfaces in sorption of precious metals from hydrothermal fluids. Trans Inst Mining Metall 101:83–88
Large RR, Maslennikov VV, Robert F, Danyushevsky LV, Chang Z (2007) Multistage sedimentary and metamorphic origin of pyrite and gold in the giant Sukhoi Log deposit, Lena Gold Province, Russia. Econ Geol 102:1233–1267
Leybourne MI, de Ronde CEJ, Wysoczanski RJ, Walker SL, Timm C, Gibson HL, Layton-Matthews D, Baker ET, Clark MR, Tontini FC, Faure K, Lupton JE, Fornari DJ, Soule SA, Massoth GJ (2012) Geology, hydrothermal activity, and sea-floor massive sulfide mineralization at the Rumble II West Mafic Caldera. Econ Geol 107:1649–1668
Leybourne MI, Schwarz-Schampera U, de Ronde CEJ, Baker ET, Faure K, Walker SL, Butterfield DA, Resing JA, Lupton JE, Hannington MD, Gibson HL, Massoth GJ, Embley RW, Chadwick WW, Clark MR, Timm C, Graham IJ, Wright IC (2012) Submarine magmatic-hydrothermal systems at the Monowai Volcanic Center, Kermadec Arc. Econ Geol 107:1669–1694
Li W, Zhang F, Hu C, Zhang L, Qiao X (2021) Ore genesis and tectonic setting of the Bieluwutu Cu-Pb-Zn volcanogenic massive sulfide deposit in Xing’an-Mongolia orogenic belt. China Ore Geol Rev 130:103951
Liu W, Migdisov A, Williams-Jones A (2012) The stability of aqueous nickel(II) chloride complexes in hydrothermal solutions: results of UV-Visible spectroscopic experiments. Geochim Cosmochim Acta 94:276–290
Longerich HP, Jackson SE, Günther D (1996) Laser ablation inductively coupled plasma mass spectrometric transient signal data acquisition and analyte concentration calculation. J Anal at Spectrom 11:899–904
Martin AJ, McDonald I, Jenkin GRT, McFall KA, Boyce AJ, Jamieson JW, MacLeod CJ (2021) A missing link between ancient and active mafc-hosted seafoor hydrothermal systems – magmatic volatile infux in the exceptionally preserved Mala VMS deposit, Troodos. Cyprus Chem Geol 567:120127
Maslennikov VV, Maslennikova SP, Large RR, Danyushevsky LV (2009) Study of trace element zonation in vent chimneys from the Silurian Yaman-Kasy volcanic-hosted massive sulfide deposit (Southern Urals, Russia) using laser ablation-inductively coupled plasma mass spectrometry (LA-ICPMS). Econ Geol 104:1111–1141
Maslennikov VV, Maslennikova SP, Large RR, Danyushevsky LV, Herrington RJ, Ayupova NR, Zaykov VV, Lein AY, Tseluyko AS, Melekestseva IY, Tessalina SG (2017) Chimneys in Paleozoic massive sulfide mounds of the Urals VMS deposits: mineral and trace element comparison with modern black, gray, white and clear smokers. Ore Geol Rev 85:64–106
McKibben MA, Eldridge CS (1990) Radical sulfur isotope zonation of pyrite accompanying boiling and epithermal gold deposition: a shrimp study of the Valles Caldera, New Mexico. Econ Geol 85:1917–1925
Meng X, Li X, Chu F, Zhu J, Lei J, Li Z, Wang H, Chen L, Zhu Z (2020) Trace element and sulfur isotope compositions for pyrite across the mineralization zones of a sulfide chimney from the East Pacific Rise (1–2°S). Ore Geol Rev 116:103209
Mikhlin YL, Romanchenko AS (2007) Gold deposition on pyrite and the common sulfide minerals: an STM/STS and SR-XPS study of surface reactions and Au nanoparticles. Geochim Cosmochim Acta 71:5985–6001
Möller P (1987) Correlation of homogenization temperatures of accessory minerals from sphalerite-bearing deposits and Ga/Ge model temperatures. Chem Geol 61:153–159
Moss R, Scott SD (2001) Geochemistry and mineralogy of gold-rich hydrothermal precipitates from Eastern Manus Basin, Papua New Guinea. Can Mineral 39:957–978
Nayak B, Halbach P, Pracejus B, Münch U (2014) Massive sulfides of Mount Jourdanne along the super-slow spreading Southwest Indian Ridge and their genesis. Ore Geol Rev 63:115–128
Ohmoto H (1986) Stable isotope geochemistry of ore deposits. In: Valley JW et al (eds) Stable isotopes in high temperature geological processes. Mineralogical Society of America, Washington, D. C, pp 491–570
Ohmoto H, Lasaga AC (1982) Kinetics of reactions between aqueous sulfates and sulfides in hydrothermal systems. Geochim Cosmochim Acta 46:1727–1745
Pak SJ, Kim HS, Choi SK, Lee KY, Moon JW (2018) Hydrothermal chimneys in the subsea TA25 caldera, Tonga Arc: In EGU General Assembly Conference Abstract, p 6085
Pal’yanova G (2008) Physicochemical modeling of the coupled behavior of gold and silver in hydrothermal processes: gold fineness, Au/Ag ratios and their possible implications. Chem Geol 255:399–413
Peter JM, Shanks WC (1992) Sulfur, carbon, and oxygen isotope variations in submarine hydrothermal deposits of Guaymas basin, Gulf of California. Geochim Cosmochim Acta 56:2025–2040
Petersen S, Monecke T, Westhues A, Hannington MD, Gemmell JB, Sharpe R, Peters M, Strauss H, Lackschewitz K, Augustin N, Gibson H, Kleeberg R (2014) Drilling shallow-water massive sulfides at the Palinuro volcanic complex, Aeolian Island arc, Italy. Econ Geol 109:2129–2157
Piccoli F, Hermann J, Pettke T, Connolly JAD, Kempf ED, Vieira Duarte JF (2019) Subducting serpentinites release reduced, not oxidized, aqueous fluids. Sci Rep 9:19573
Pokrovski GS, Akinfiev NN, Borisova AY, Zotov AV, Kouzmanov K (2014) Gold speciation and transport in geological fluids: insights from experiments and physical-chemical modelling. Geol Soc London, Spec Publ 402:9–70
Rees CE, Jenkins WJ, Monster J (1978) The sulphur isotope geochemistry of ocean water sulphate. Geochim Cosmochim Acta 42:377–382
Ruscitto DM, Wallace PJ, Johnson ER, Kent AJR, Bindeman IN (2010) Volatile contents of mafic magmas from cinder cones in the Central Oregon High Cascades: implications for magma formation and mantle conditions in a hot arc. Earth Planet Sci Lett 298:153–161
Sack RO, Loucks RR (1985) Thermodynamic properties of tetrahedrite-tennanites: constraints on the interdependence of the Ag ↔ Cu, Fe↔ Zn, Cu↔ Fe, and As ↔Sb exchange reactions. Am Miner 70:1270–1289
Schwarz-Schampera U, Herzig P, Hannington M, Stoffers P (2001) Shallow submarine epithermal style As-Sb-Hg-Au mineralization in the active Kermadec arc. Swets and Zeitlinger Publishers, New Zealand. Holanda, pp 333–335
Scott SD, Barnes HL (1971) Sphalerite geothermometry and geobarometry. Econ Geol 66:653–669
Seward TM (1989) The hydrothermal chemistry of gold and its implications for ore formation: boiling and conductive cooling as examples. Econ Geol Monogr 6:394–404
Shanks WC III, Bohlke JK, Seal RR II (1995) Stable isotopes in mid-ocean ridge hydrothermal systems: interactions between fluids, minerals, and organisms. Geophys Monogr 91:194–221
Stoffers P, Worthington T, Ackermand D, Fretzdorff S (2003) Cruise Report SONNE 167 Louisville Ridge: dynamics and magmatism of a mantle plume and its influence on the Tonga-Kermadec subduction system. Institut für Geowissenschaften, Christian-Albrechts-Universität, Kiel, Germany, p 276
Stoffers P, Worthington TJ, Schwarz-Schampera U, Hannington MD, Massoth GJ, Hekinian R, Schmidt M, Lundsten LJ, Evans LJ, Vaiomo’unga R, Kerby T (2006) Submarine volcanoes and high-temperature hydrothermal venting on the Tonga arc, southwest Pacific. Geology 34:453–456
Tivey MK (1995) The influence of hydrothermal fluid composition and advection rates on black smoker chimney mineralogy: insights from modeling transport and reaction. Geochim Cosmochim Acta 59:1933–1949
Tivey MK, McDuff RE (1990) Mineral precipitation in the walls of black smoker chimneys: a quantitative model of transport and chemical reaction. J Geophys Res 95:12,617-12,637
Trudinger PA, Chambers LA, Smith JW (1985) Low-temperature sulphate reduction: biological versus abiological. Can J Earth Sci 22:1910–1918
Ueda A, Sakai H (1984) Sulfur isotope study of Quaternary volcanic rocks from the Japanese Islands Arc. Geochim Cosmochim Acta 48:1837–1848
Wallace PJ, Plank T, Edmonds M, Hauri EH (2015) Volatiles in magmas: The encyclopedia of volcanoes. Academic Press, Amsterdam, pp 163–183
Wang Y, Han X, Petersen S, Jin X, Qiu Z, Zhu J (2014) Mineralogy and geochemistry of hydrothermal precipitates from Kairei hydrothermal field, Central Indian Ridge. Mar Geol 354:69–80
Webber AP, Roberts S, Murton BJ, Hodgkinson MRS (2015) Geology, sulfide geochemistry and supercritical venting at the Beebe Hydrothermal Vent Field, Cayman Trough. Geochemistry, Geophys Geosystems 16:2661–2678
Wilson SA, Ridley WI, Koenig AE (2002) Development of sulfide calibration standards for the laser ablation inductively-coupled plasma mass spectrometry technique. J Anal at Spectrom 17:406–409
Wohlgemuth-Ueberwasser CC, Viljoen F, Petersen S, Vorster C (2015) Distribution and solubility limits of trace elements in hydrothermal black smoker sulfides: An in-situ LA-ICP-MS study. Geochim Cosmochim Acta 159:16–41
Woodhead JD, Harmon RS, Fraser DG (1987) O, S, Sr, and Pb isotope variations in volcanic rocks from the Northern Mariana Islands: implications for crustal recycling in intra-oceanic arcs. Earth Planet Sci Lett 83:39–52
Wu Z, Sun X, Xu H, Konishi H, Wang Y, Wang C, Dai Y, Deng X, Yu M (2016) Occurrences and distribution of “invisible” precious metals in sulfide deposits from the Edmond hydrothermal field, Central Indian Ridge. Ore Geol Rev 79:105–132
Yang K, Scott SD (1996) Possible contribution of a metal-rich magmatic fluid to a seafloor hydrothermal system. Nature 383:420–423
Yeats CJ, Parr JM, Binns RA, Gemmell JB, Scott SD (2014) The SuSu Knolls hydrothermal field, Eastern Manus Basin, Papua New Guinea: an active submarine high-sulfidation copper-gold system. Econ Geol 109:2207–2226
Zhang Y, Chu F, Li Z, Dong Y, Wang H, Li X, Long J (2020) Gold enrichment in hydrothermal sulfides from the Okinawa Trough: an in situ LA-ICP-MS study. Ore Geol Rev 116:103255
Zheng Y, Chen R, Xu Z, Zhang S (2016) The transport of water in subduction zones. Sci China Earth Sci 59:651–682
Zhu C, Tao C, Yin R, Liao S, Yang W, Liu J, Barriga FJAS (2020) Seawater versus mantle sources of mercury in sulfide-rich seafloor hydrothermal systems, Southwest Indian Ridge. Geochim Cosmochim Acta 281:91–101
Zierenberg RA, Koski RA, Morton JL, Bouse RM, Shanks WC III (1993) Genesis of massive sulphide deposits on a sediment-covered spreading center, Escanaba trough, southern Gorda Ridge. Econ Geol 88:2069–2098
Zierenberg RA (1994) Data report: sulfur content of sediments and sulfur isotope concentrations of sulfide and sulfate minerals from Middle Valley. In: Mottl MJ, Davis EE, Fisher AT, Slacks JF (eds) Proc ODP 139, Scientific Results, College Station, TX, 739–748
Acknowledgements
The authors thank scientists and crews of the R/V ARAON for their support during sample recovery and data collection. The careful reviews by M. Keith and K. Kelley are greatly appreciated, which improved the quality of this manuscript. The authors also thank chief editor G. Breaudoin for valuable comments on the manuscript. We also thank Dr. J. Seo for her contribution to electron microprobe analyses. This work was financially supported by the Ministry of Oceans and Fisheries of Korea (20210634 and PM 57060), the Korea Institute of Ocean Science and Technology (PE 99924) and the Korea Institute of Geoscience and Mineral Resources (GP2022-008).
Author information
Authors and Affiliations
Corresponding author
Ethics declarations
Conflict of interest
The authors declare no competing interests.
Additional information
Communicated by K. Kelley
Publisher's note
Springer Nature remains neutral with regard to jurisdictional claims in published maps and institutional affiliations.
Supplementary Information
Below is the link to the electronic supplementary material.
Rights and permissions
Open Access This article is licensed under a Creative Commons Attribution 4.0 International License, which permits use, sharing, adaptation, distribution and reproduction in any medium or format, as long as you give appropriate credit to the original author(s) and the source, provide a link to the Creative Commons licence, and indicate if changes were made. The images or other third party material in this article are included in the article's Creative Commons licence, unless indicated otherwise in a credit line to the material. If material is not included in the article's Creative Commons licence and your intended use is not permitted by statutory regulation or exceeds the permitted use, you will need to obtain permission directly from the copyright holder. To view a copy of this licence, visit http://creativecommons.org/licenses/by/4.0/.
About this article

Cite this article
Choi, S.K., Pak, S.J., Park, JW. et al. Trace-element distribution and ore-forming processes in Au–Ag-rich hydrothermal chimneys and mounds in the TA25 West vent field of the Tonga Arc. Miner Deposita 58, 135–160 (2023). https://doi.org/10.1007/s00126-022-01136-w
Received:
Accepted:
Published:
Issue Date:
DOI: https://doi.org/10.1007/s00126-022-01136-w