 Pengyang Feng1†
 Zehua Shao2†Bai Dong3†
 Ting Fang4
 Zhun Huang1
 Ziqiang Li5
 Fangfang Fu6Yaping Wu6
 Wei Wei6
 Jianmin Yuan7Yang Yang8Zhe Wang7
 Meiyun Wang1,4*
- 1Department of Medical Imaging, Henan University People’s Hospital and Henan Provincial People’s Hospital, Zhengzhou, China
- 2Heart Center of Zhengzhou University People's Hospital, Henan Provincial People's Hospital, Zhengzhou, China
- 3Department of Orthopaedics, Henan University People’s Hospital, Zhengzhou, China
- 4Department of Medical Imaging, Zhengzhou University People’s Hospital and Henan Provincial People’s Hospital, Zhengzhou, China
- 5Department of Medical Imaging, Xinxiang Medical University Henan Provincial People’s Hospital, Zhengzhou, China
- 6Department of Medical Imaging, Henan Provincial People’s Hospital, Zhengzhou, China
- 7Central Research Institute, United Imaging Healthcare Group, Shanghai, China
- 8Beijing United Imaging Research Institute of Intelligent Imaging, United Imaging Healthcare Group, Beijing, China
Background: Lung cancer has become one of the deadliest tumors in the world. Non-small cell lung cancer (NSCLC) is the most common type of lung cancer, accounting for approximately 80%-85% of all lung cancer cases. This study aimed to investigate the value of diffusion kurtosis imaging (DKI), diffusion-weighted imaging (DWI) and 2-[18F]-fluoro-2-deoxy-D-glucose positron emission tomography (18F-FDG PET) in differentiating squamous cell carcinoma (SCC) and adenocarcinoma (AC) and to evaluate the correlation of each parameter with stage and proliferative status Ki-67.
Methods: Seventy-seven patients with lung lesions were prospectively scanned by hybrid 3.0-T chest 18F-FDG PET/MR. Mean kurtosis (MK), mean diffusivity (MD), apparent diffusion coefficient (ADC), maximum standard uptake value (SUVmax), metabolic tumor volume (MTV) and total lesion glycolysis (TLG) were measured. The independent samples t test or Mann–Whitney U test was used to compare and analyze the differences in each parameter of SCC and AC. The diagnostic efficacy was evaluated by receiver operating characteristic (ROC) curve analysis and compared with the DeLong test. A logistic regression analysis was used for the evaluation of independent predictors. Bootstrapping (1000 samples) was performed to establish a control model, and calibration curves and ROC curves were used to validate its performance. Pearson’s correlation coefficient and Spearman’s correlation coefficient were calculated for correlation analysis.
Results: The MK and ADC values of the AC group were significantly higher than those of the SCC group (all P< 0.05), and the SUVmax, MTV, and TLG values of the SCC group were significantly higher than those of the AC group (all P<0.05). There was no significant difference in the MD value between the two groups. Moreover, MK, SUVmax, TLG and MTV were independent predictors of the NSCLC subtype, and the combination of these parameters had an optimal diagnostic efficacy (AUC, 0.876; sensitivity, 86.27%; specificity, 80.77%), which was significantly better than that of MK (AUC = 0.758, z = 2.554, P = 0.011), ADC (AUC = 0.679, z = 2.322, P = 0.020), SUVmax (AUC = 0.740, z = 2.584, P = 0.010), MTV (AUC = 0.715, z = 2.530, P = 0.011) or TLG (AUC = 0.716, z = 2.799, P = 0.005). The ROC curve showed that the validation model had high accuracy in identifying AC and SCC (AUC, 0.844; 95% CI, 0.785-0.885);. The SUVmax value was weakly positively correlated with the Ki-67 index (r = 0.340, P< 0.05), the ADC and MD values were weakly negatively correlated with the Ki-67 index (r = -0.256, -0.282, P< 0.05), and the MTV and TLG values were weakly positively correlated with NSCLC stage (r = 0.342, 0.337, P< 0.05).
Conclusion: DKI, DWI and 18F-FDG PET are all effective methods for assessing the NSCLC subtype, and some parameters are correlated with stage and proliferation status.
Introduction
The morbidity and mortality rates of lung cancer have increased rapidly, and now it ranks first in incidence among malignant tumors (1); more than 80% of lung cancer cases are non-small cell lung cancer (NSCLC) (2). In recent years, the treatment of cancer has entered the era of precision medicine, and the subtype of NSCLC can affect the formulation of the treatment plan (3). Targeted therapy has led to significant improvements in adenocarcinoma (AC) patients, but for squamous cell carcinoma (SCC) patients, the treatment effect is poor, and serious complications may occur (4). For example, patients with SCC may be at risk of pulmonary hemorrhage when treated with bevacizumab therapy (5). In addition, clinical treatment is often determined according to the stage of lung cancer (6). Patients with early-stage NSCLC are mainly treated by surgery, followed by postoperative adjuvant radiotherapy and chemotherapy (7). Surgery is not recommended for patients with advanced-stage disease, and radiotherapy and chemotherapy are the main treatments (8, 9). As a nuclear antigen related to cell proliferation, Ki-67 can reflect the proportion of active cells in the cell cycle. Grant et al. (10) confirmed that the level of Ki-67 is closely related to proliferation, invasion, metastasis and prognosis of NSCLC (11). Needle biopsy is still the main method for obtaining histological characterization (12). In the past years, there has been a continuous development of novel technologies to improve diagnostic accuracy, reduce trauma and complications, for instance robot-assisted CT-guided lung biopsy has emerged as a safe technique in clinical practice (13), however, lung biopsies are still invasive and may result in pneumothorax, bleeding and/or other complications. 2-[18F]-Fluoro-2-deoxy-D-glucose positron emission tomography (18F-FDG PET) is a functional imaging technology that can reflect glucose metabolism in biological tissues (14, 15). Diffusion weighted imaging (DWI) is a noninvasive imaging technique widely used in clinical practice to evaluate the movement of water molecules, which can reflect the diffusion ability of water molecules in tissues (16). At present, 18F-FDG PET and DWI have been widely used in the identification of benign and malignant pulmonary nodules (17) and the evaluation of TNM stage of lung cancer (18). As an extension of DWI, diffusion kurtosis imaging (DKI) is a model based on the non-Gaussian distribution of water molecules, which is more sensitive to the diffusion of water molecules and more accurate in detecting tissue microstructure. Due to these advantages, DKI has been increasingly used for the evaluation of various diseases, such as prostate cancer (19), glioma (20), and cervical cancer (21). However, in the field of pulmonary lesion assessment, to our knowledge, only a few studies have explored the value of DKI in differentiating benign and malignant pulmonary nodules (22).
Therefore, this study aimed to investigate the value of DKI, DWI, and 18F-FDG PET in differentiating SCC and AC and to evaluate the correlation of each parameter with stage and proliferative status Ki-67, so as to provide new reference for relevant diagnosis and treatment of NSCLC.
Materials and methods
Study population
This study was approved by the Research Ethics Committee (RCE) of our hospital. After receiving written informed consent from each patient, prospectively surveyed patients who were suspected of having a space-occupying lesion of the lung through CT examination in our hospital from July 6, 2020, to June 29, 2021, were enrolled. A total of 120 patients underwent chest 18F-FDG PET/MR scanning. The exclusion criteria were as follows: ① patients who failed to complete the scan due to claustrophobia or other physical discomfort (5 cases were excluded); ② patients with pathologically confirmed small cell lung cancer (4 cases excluded) or nonlung cancer (9 cases excluded) after 18F-FDG PET/MR; ③ patients with a nodule maximum diameter less than 1 cm (12 cases excluded); ④ patients with lesions not showing well due to artifacts (9 cases excluded) and ⑤ patients with unclear pathological or immunohistochemical results (4 cases were excluded). Ultimately, a total of 77 patients were included in this study. There were 48 males and 29 females, with an age of 62.73 ± 9.06 (range, 39 - 81) years, (Figure 1).
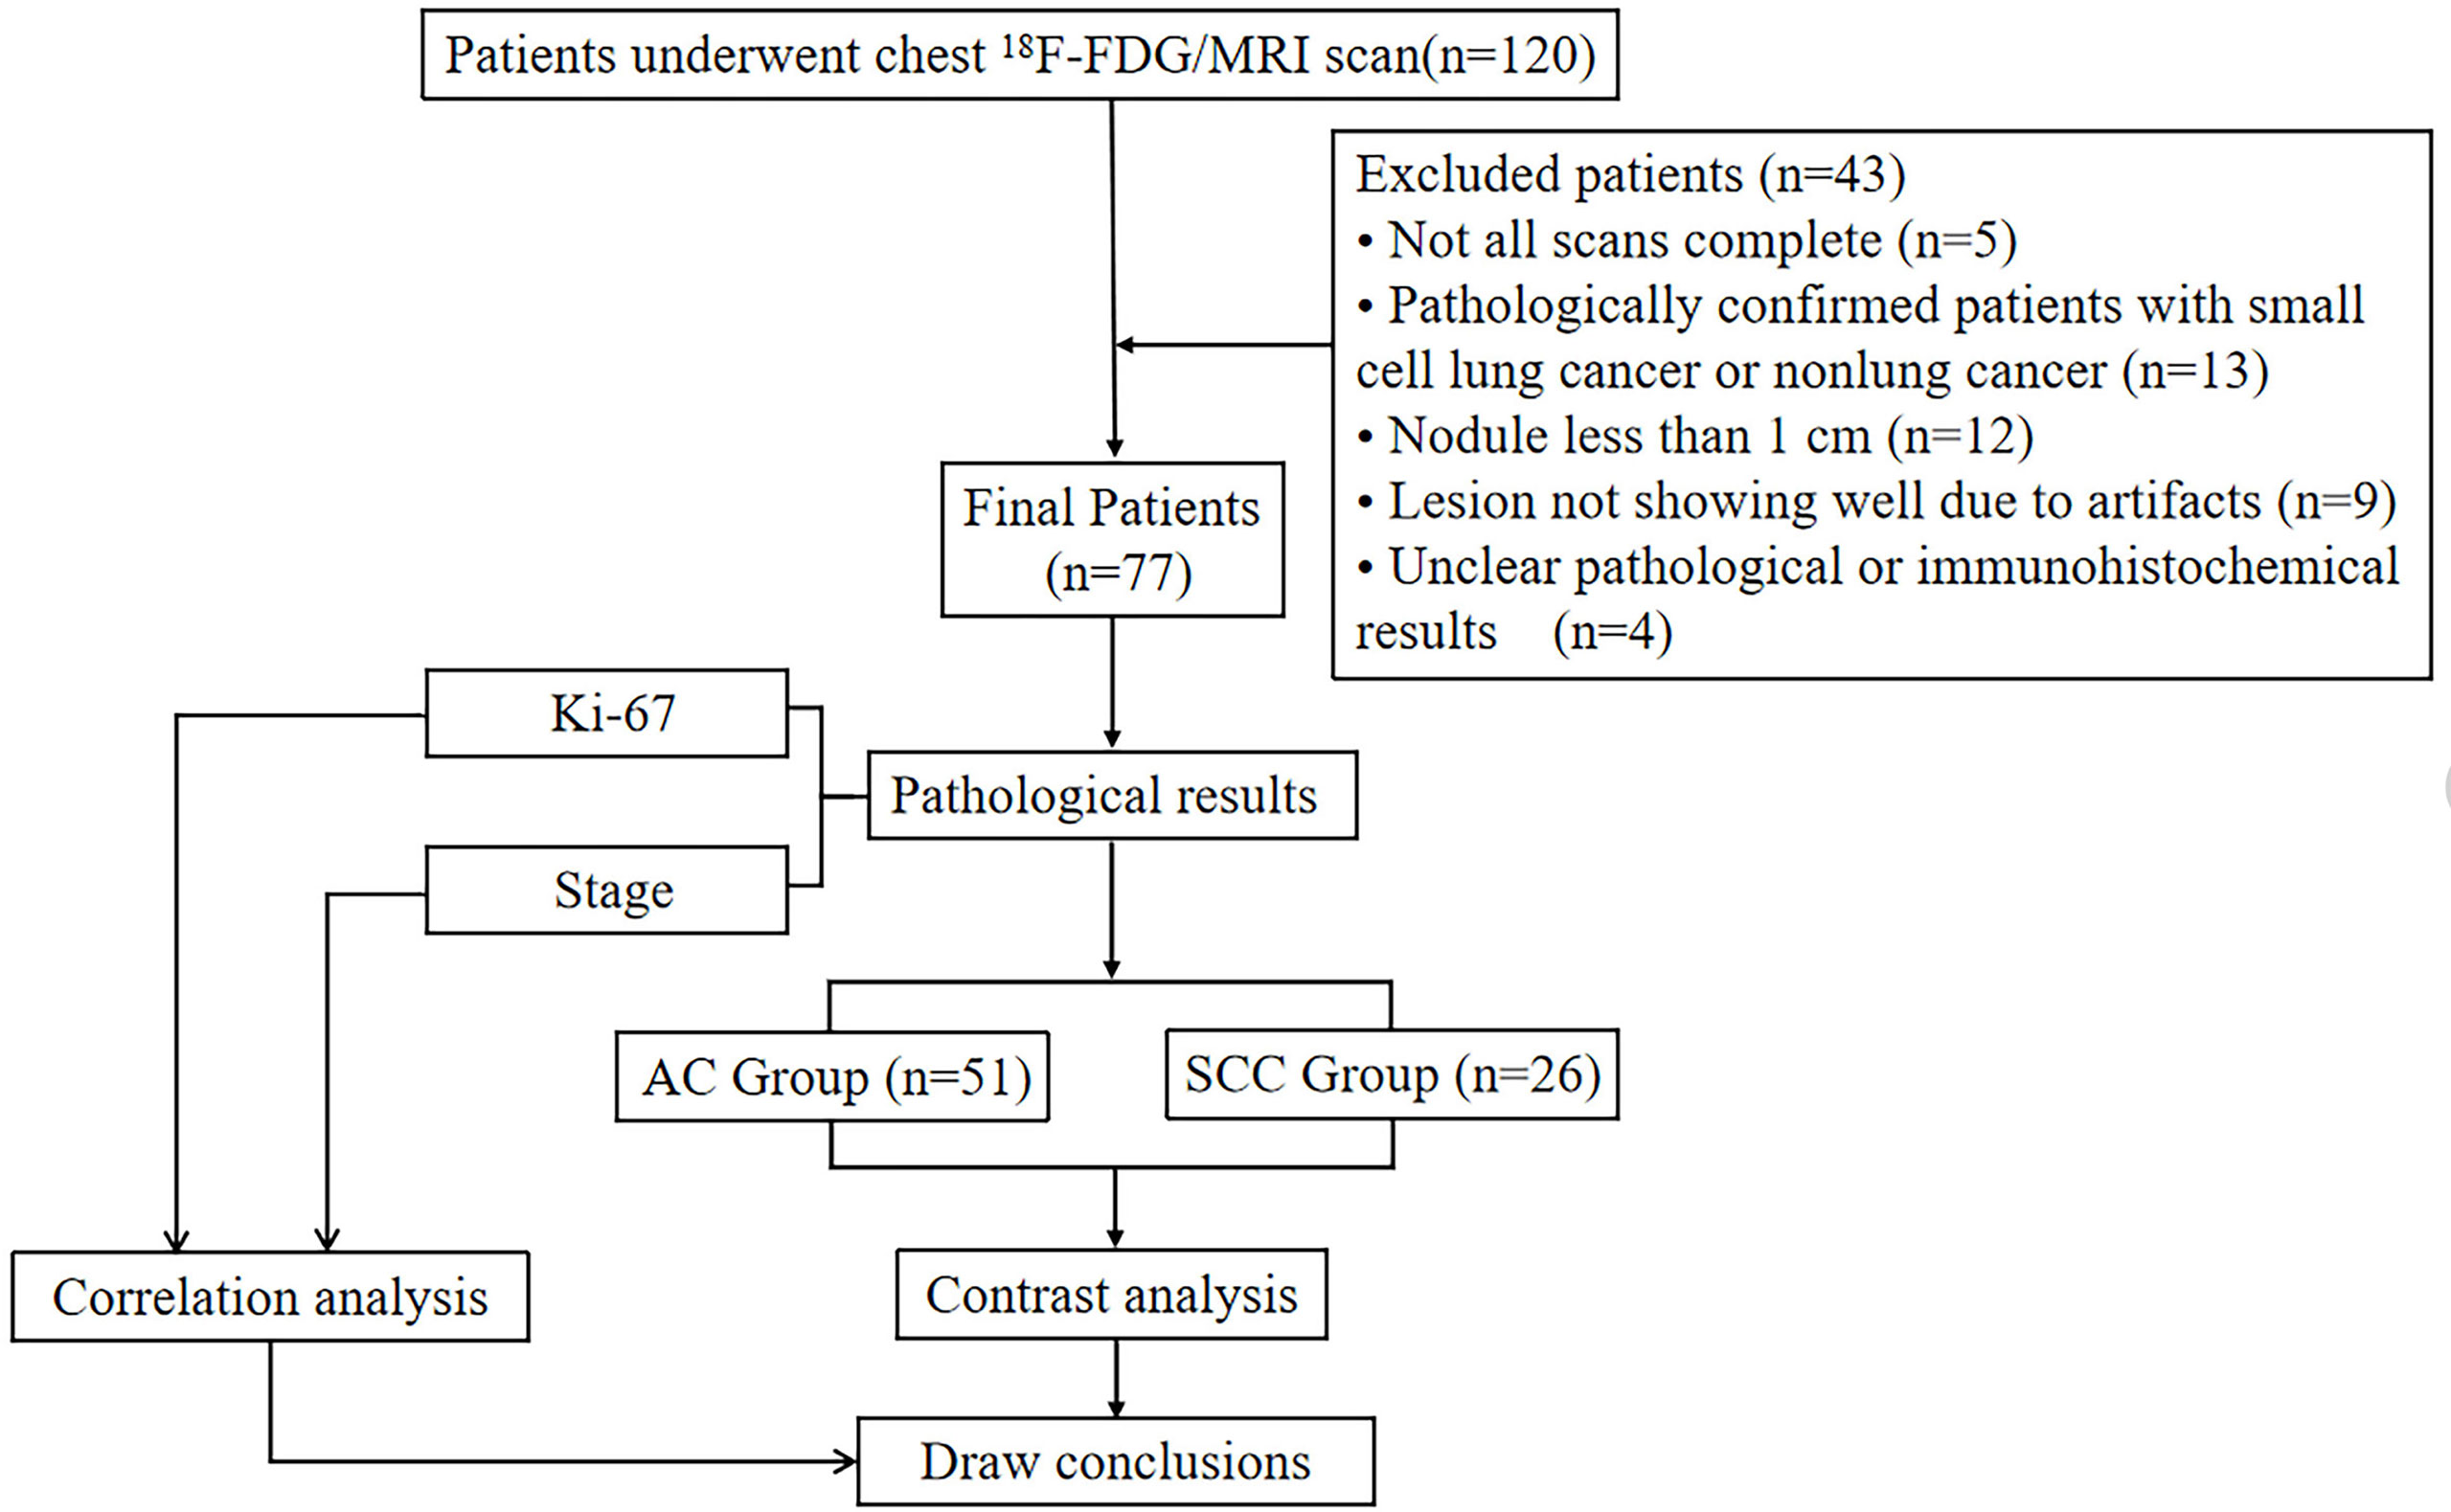
Figure 1 Flow diagram of the patient selection process.
Image acquisition
The study was conducted using a hybrid 3.0 T PET/MR scanner (uPMR790, UIH, Shanghai, China) with a 12-channel phased array body coil. The PET tracer 18F-FDG was produced by a cyclic accelerator and an automatic chemical synthesis system, and the radiochemical purity of the tracer was >95%. It was recommended that patients should not exercise vigorously within 24 hours before the examination and should fast for more than 6 hours to achieve a fasting blood glucose in the morning of< 7 mmol/L. The tracer was injected intravenously at the standard dose of 0.11 mCi per kilogram of body weight, and images were collected at a resting time of approximately 60 minutes (23) after injection. During the examination, the patient was placed in a supine position with his or her arms raised above the head. The scanning range was from the lung tip to the diaphragmatic surface of the lung bottom, and the whole lung was completely covered as the standard. MR-based attenuation correction (MRAC) was performed using a 3D T1-weighted spoiled gradient-echo sequence based on Dixon-based water-fat separation imaging (Wfi3d-trig). In MRAC processing, the corrected image is partitioned into four categories: soft tissue, fat, lung and air (24). PET scans were performed with one bed position and over an acquisition time of 27 minutes each. PET images were reconstructed using an ordered subsets expectation maximization (OSEM) algorithm (20 subsets, two iterations). In parallel with the PET scan, T1-weighted imaging (T1WI), T2-weighted imaging (T2WI), and DWI scans were performed first. Then, all the layers containing the lesions were selected from the DWI images, and their positions, layer thicknesses and layer spacing were copied into DKI for corresponding scanning. The detailed parameters of the MR sequence are shown in Table 1.
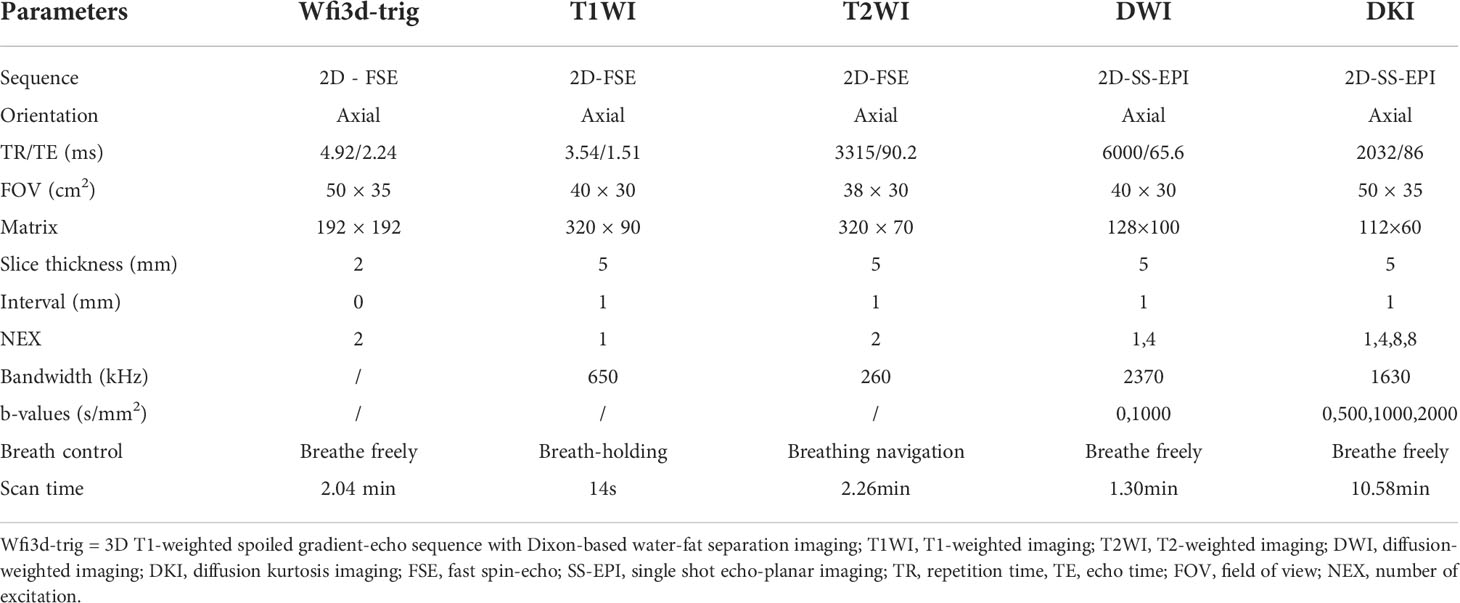
Table 1 MRI acquisition parameters.
Data post-processing
The collected PET/MR images were transferred to the United Imaging Workstation (uWS-MR: R005, UIH, Shanghai, China), and the workstation automatically performed image registration. For PET images, the PET/MR fusion software was used to post-process the metabolic parameters and automatically extract the volume of interest (VOI) of the tumor. Using 40% SUVmax as the threshold, the maximum standard uptake value (SUVmax), metabolic tumor volume (MTV) and total lesion glycolysis (TLG) of the tumor were automatically calculated. For DWI and DKI images, the parameters were processed using the workstation’s advanced analysis toolkit. The DWI parameter was generated using the following formulae:
S0 is the signal strength when the b value is 0 s/m2, Sb is the signal strength at different b values, b is the diffusion sensitivity value, and ADC is the apparent diffusion coefficient. The DKI parameters were generated using the following formulae:
Kapp represents the apparent kurtosis coefficient, Dapp represents the corrected apparent diffusion coefficient, and MD and MK are the mean Dapp and Kapp values of all directions. Using the PET/MRI fusion image as a reference, we manually delineated the ROIs (regions of interests) on the image of each layer containing the tumor on the axial T2WI image while paying attention to avoid places that are prone to artifacts, such as hemorrhage, necrosis and cystic degeneration. The software automatically copied the delineated ROIs to all parameter maps to calculate the average values based on the gross tumor volume (GTV). All the above quantitative parameters were independently processed and measured by two radiologists (PY.F and FF.F, 5 years and 14 years of experience) without any clinical or pathological information using a double-blind method.
Histopathologic analysis
All patients in the study provided pathological specimens, which were obtained by focal biopsy or surgical procedures within 4.19 ± 2.06, (range 1-7) days after the PET/MR scan. The tumor tissue was isolated and sent to the pathology department of our hospital to determine the NSCLC subtype. Formalin fixation, dehydration, wax immersion, embedding, sectioning and routine HE staining were performed. The eighth edition of International Association for the Study of Lung Cancer (IASLC) was used for staging classification (25). The expression of Ki-67 was analyzed by immunohistochemistry with a mouse anti-human Ki-67 monoclonal antibody (MIB-1, DAKO, Denmark). Brown−yellow granules or brown granules in the nucleus were regarded as positive cells, 5 high-power fields were selected, and 500 cells were randomly detected in each section for observation.
Statistical analysis
SPSS 23.0 software and MedCalc 15.0 software were used for data analysis. The intraclass correlation coefficient (ICC) was used to assess the consistency of each parameter by two radiologists, as follows: r ≥ 0.75, excellent agreement; 0.60 ≤ r< 0.75, good agreement; 0.40 ≤ r< 0.60, fair agreement; and r< 0.40, poor agreement (26). The Shapiro–Wilk test was used to test whether the data in each group conformed to a normal distribution. The Mann–Whitney U test or independent samples t test was used to compare the differences in each parameter between the AC and SCC groups. Parameters conforming to normal distribution were expressed as mean ± standard deviation, and parameters conforming to non-normal distribution were expressed as median (interquartile range). The Bonferroni method was used for correction analysis. Receiver operating characteristic (ROC) curves were used to assess the diagnostic efficacy of each parameter value (alone or in combination). The Delong test was used to determine whether the area under the ROC curve (AUC) of each parameter (alone or in combination) was different. Logistic regression analysis was used for the evaluation of independent predictors. A control model was built by bootstrapping (1000 samples); the model was tested with multiple regressions, and its performed was verified with calibration curves, decision curve analysis (DCA), and ROC curves. The correlation between each parameter and Ki-67 index was analyzed according to the Pearson correlation coefficient. Spearman’s correlation coefficient was used to analyze the correlation between each parameter and NSCLC stage. The test standard was set to 0.05, and the difference was considered statistically significant at P< 0.05.
Results
Features of all patients
The clinical and pathological characteristics of all the patients are shown in Table 2.
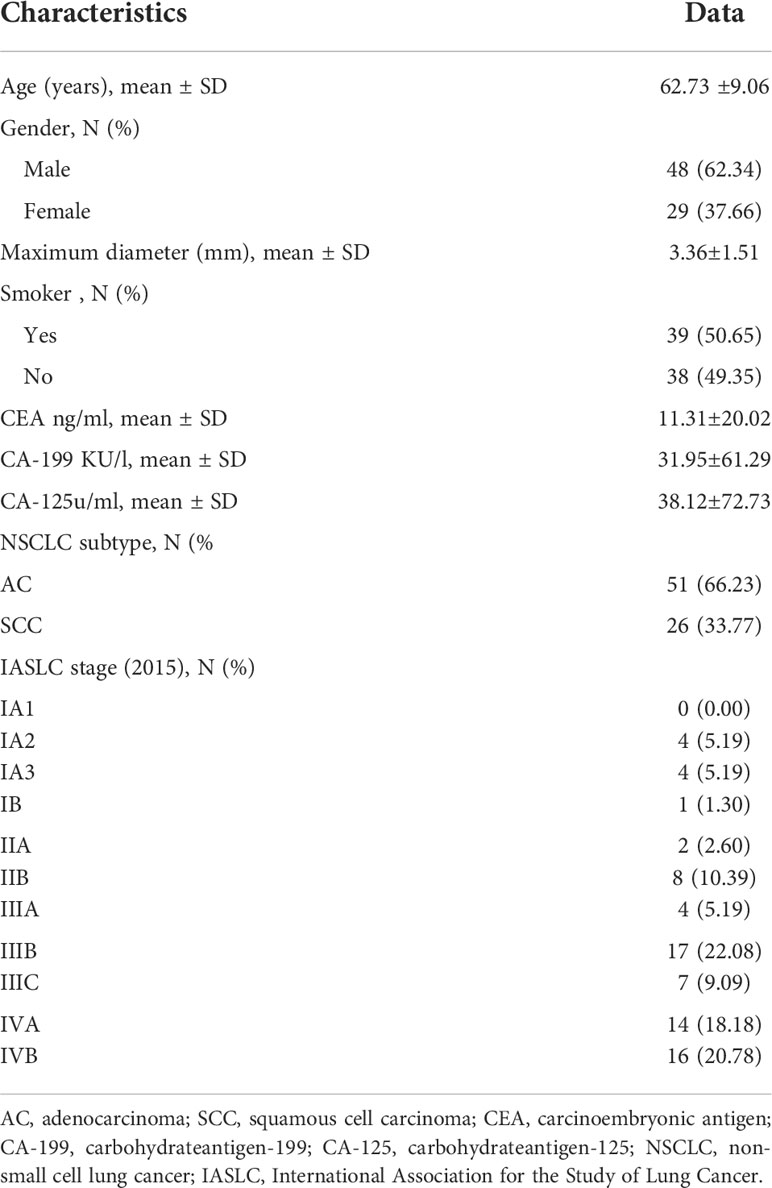
Table 2 Clinicopathologic features of the patients.
Consistency test
The MK, MD, ADC, SUVmax, MTV and TLG values measured by the two observers all had high consistency, and the ICCs were 0.826, 0.799, 0.819, 0.823, 0.869 and 0.757, respectively. The average of the two observers’ parameter values was taken as the final result and included in this study.
Differences in parameters
Figure 2 shows the pseudocolor diagram of DKI, DWI and 18F-FDG PET parameters. The MK and ADC values in the AC group were significantly higher than those in the SCC group [0.55 (0.47, 0.73) (range, 0.22 - 2.14) vs. 0.42 (0.32, 0.53) (range, 0.23 - 0.71), 95% CI (0.080 - 0.228); (1.39 ± 0.16) (range, 1.05 - 1.77)×10-3 mm2/s vs. (1.26 ± 0.21) (range, 0.83 - 1.66)×10-3 mm2/s, 95% CI (0.032 - 0.294); (P< 0.001, P = 0.008)], while the values of SUVmax, MTV and TLG in the SCC group were significantly higher than those in the AC group [12.00 (8.39, 15.00) (range, 4.87 - 28.77) g/cm3 vs. 7.25 (5.03, 11.26) (range, 0.84 - 19.48)g/cm3, 95% CI (1.830 - 6.440); 14.84 (7.65, 35.83) (range, 2.39 - 96.64) cm3 vs. 6.50 (1.99, 14.65) (range, 0.40 - 86.98) cm3, 95% CI (2.878 - 13.000); 83.97 (40.85, 140.08) (range, 1.90 - 661.98) g vs. 27.17 (5.32, 77.00) (range, 0.37 - 447.96) g, 95% CI (19.770 - 74.248); (all P = 0.001, 0.002 and 0.002, respectively)]. There was no significant difference in the MD value between the AC group and SCC group [3.45 (2.95, 4.28) (range, 1.31 - 10.62) ×10-3 mm2/s vs. 3.26 (2.01, 3.84) (range, 1.12 - 8.68) ×10-3 mm2/s, 95% CI (0.116 - 1.060); (P = 0.122)], (Table 3).
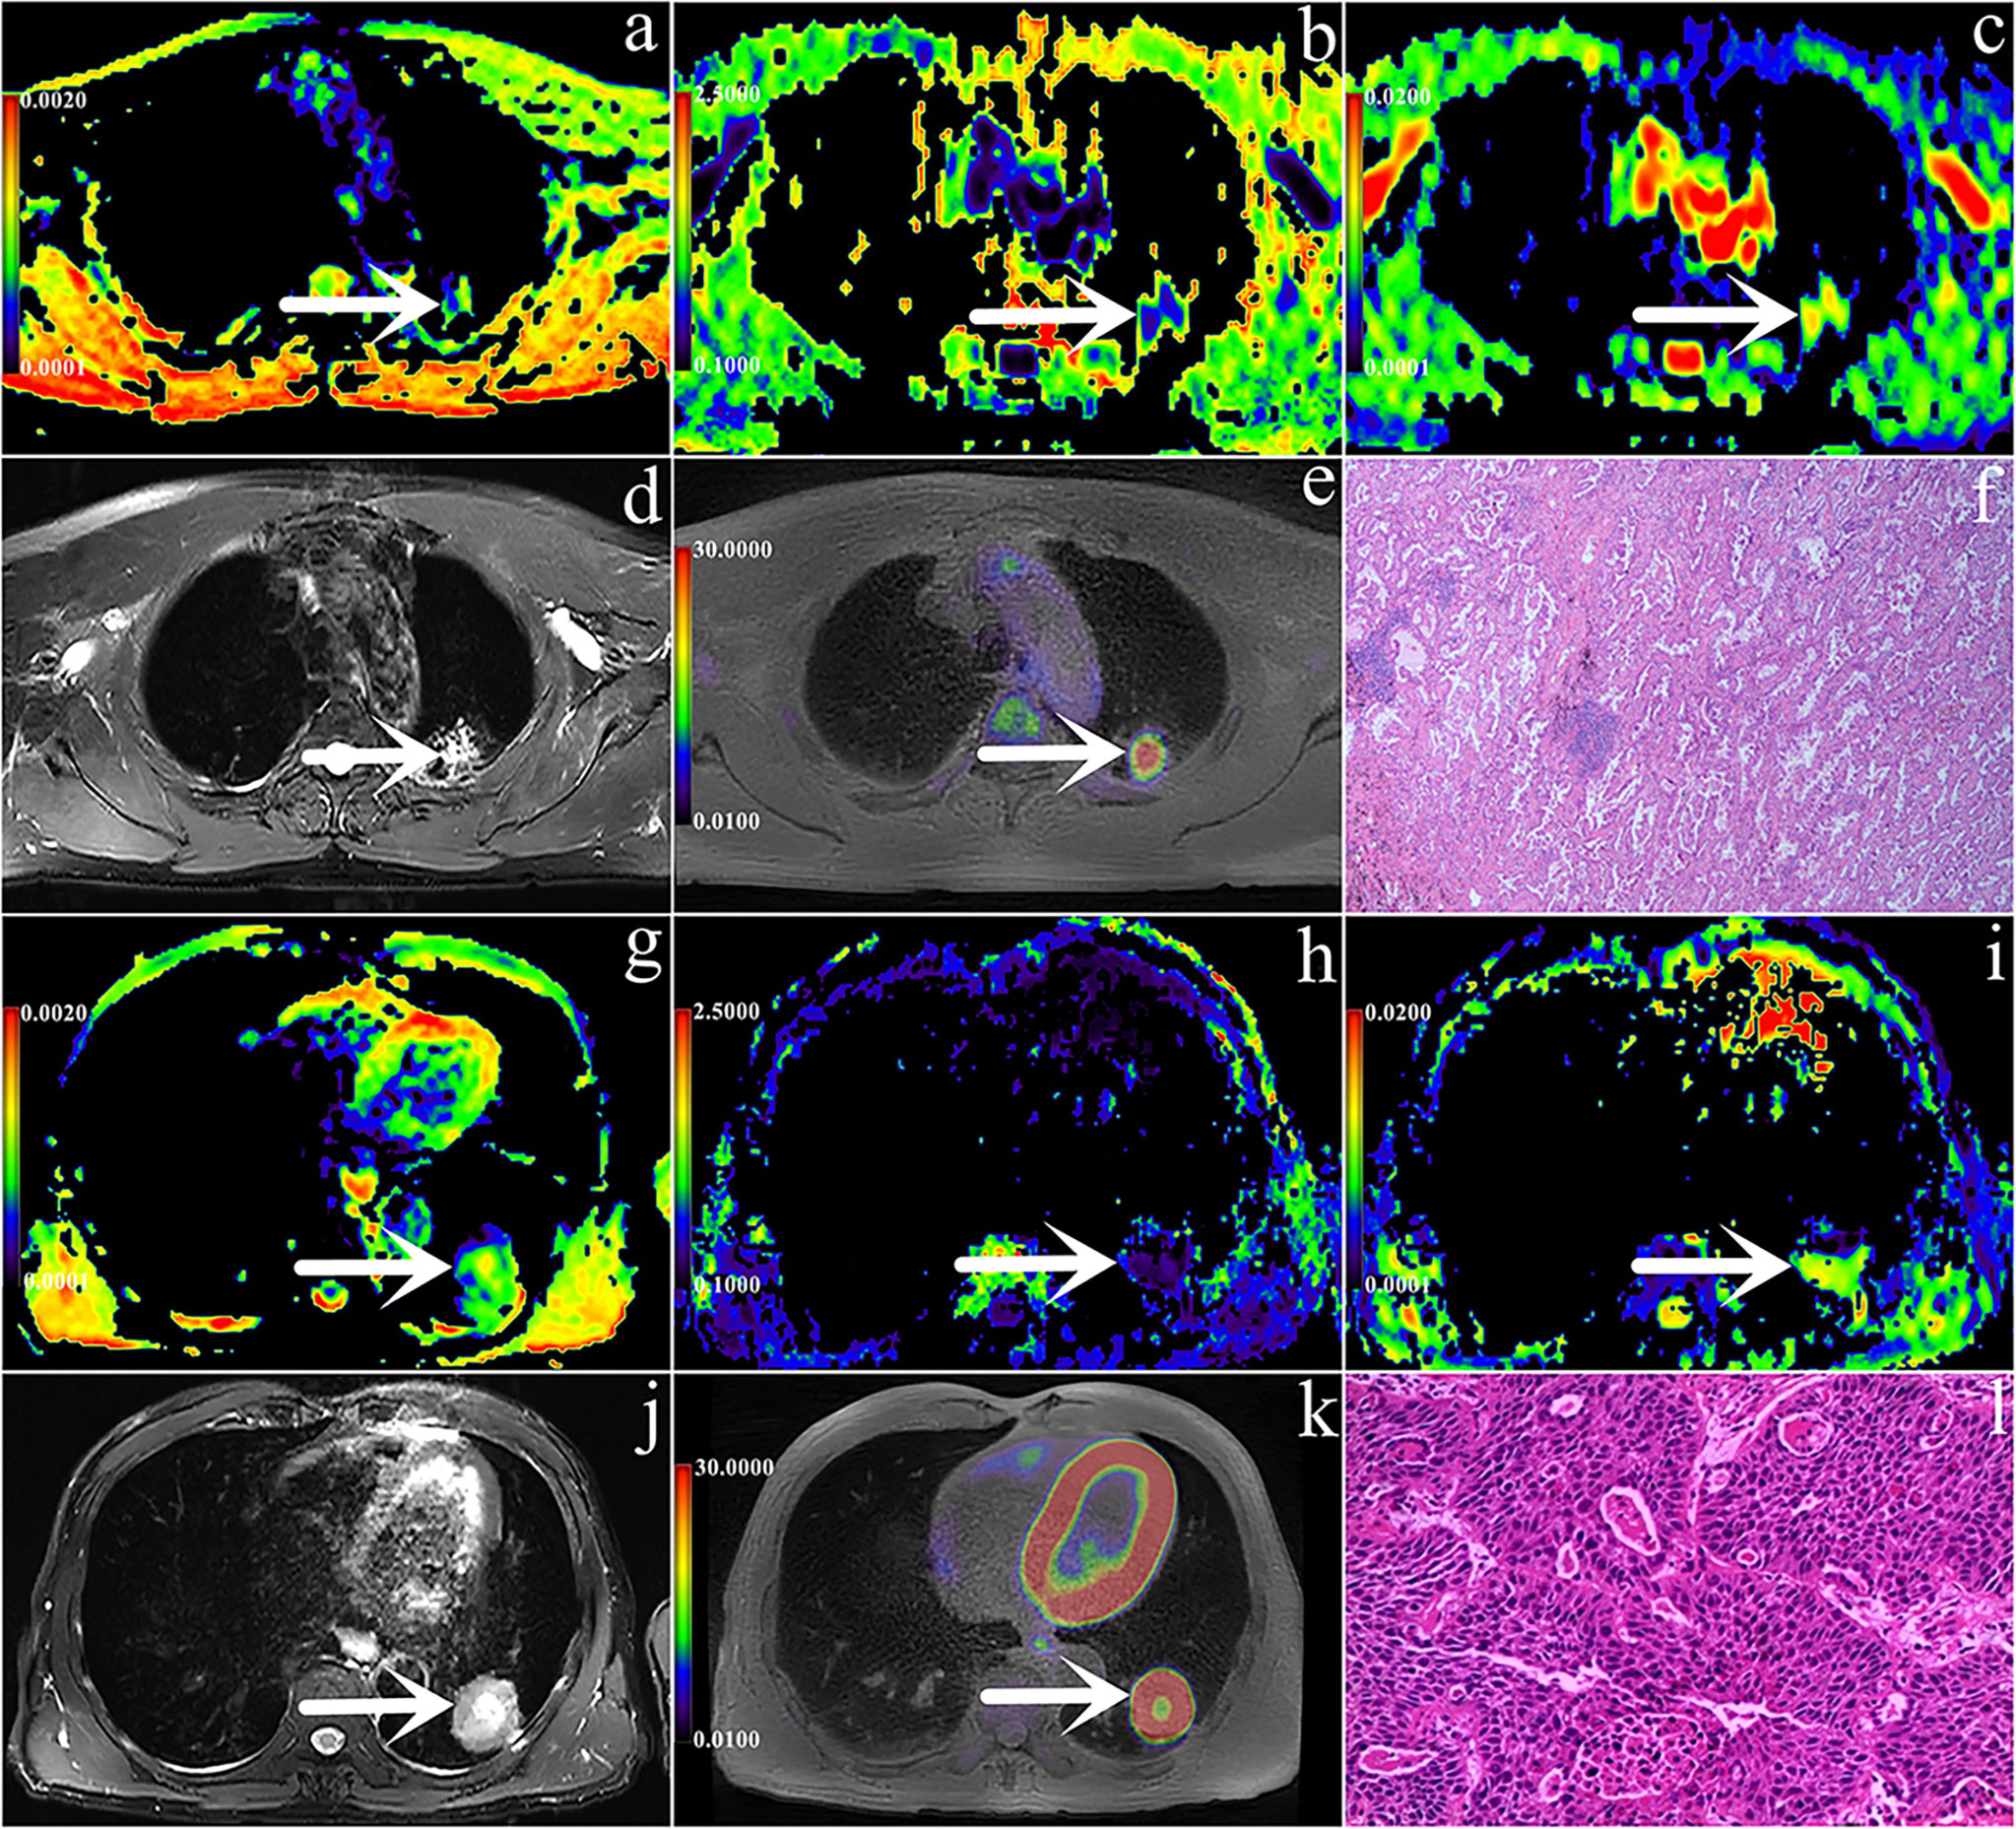
Figure 2 (A–L) are PET/MR images and pathological images. (A–F) Male, 56 years, with staging IIB, AC (shown by white arrows), Ki-67 is 30%, ADC = 1.505 × 10⁻³mm2/s, MK = 0.652, MD = 2.768 × 10⁻³mm2/s, SUVmax = 5.08 g/cm3, MTV = 2.44 cm3, TLG = 7.28 g; g-l Male, 58 years, with staging IIIB, SCC(shown by white arrows), Ki-67 is 70%, ADC = 1.068 × 10⁻³mm2/s, MK = 0.291, MD = 2.622 × 10⁻³mm2/s, SUVmax =11.84 g/cm3, MTV = 12.248 cm3, TLG = 83.408 g. In these images, a/g are ADC pseudo-colored maps, b/h are MK pseudo-colored maps, c/i are MD pseudo-colored maps, d/j are T2WI images, e/k are PET images and f/l are pathological images (magnification=100).
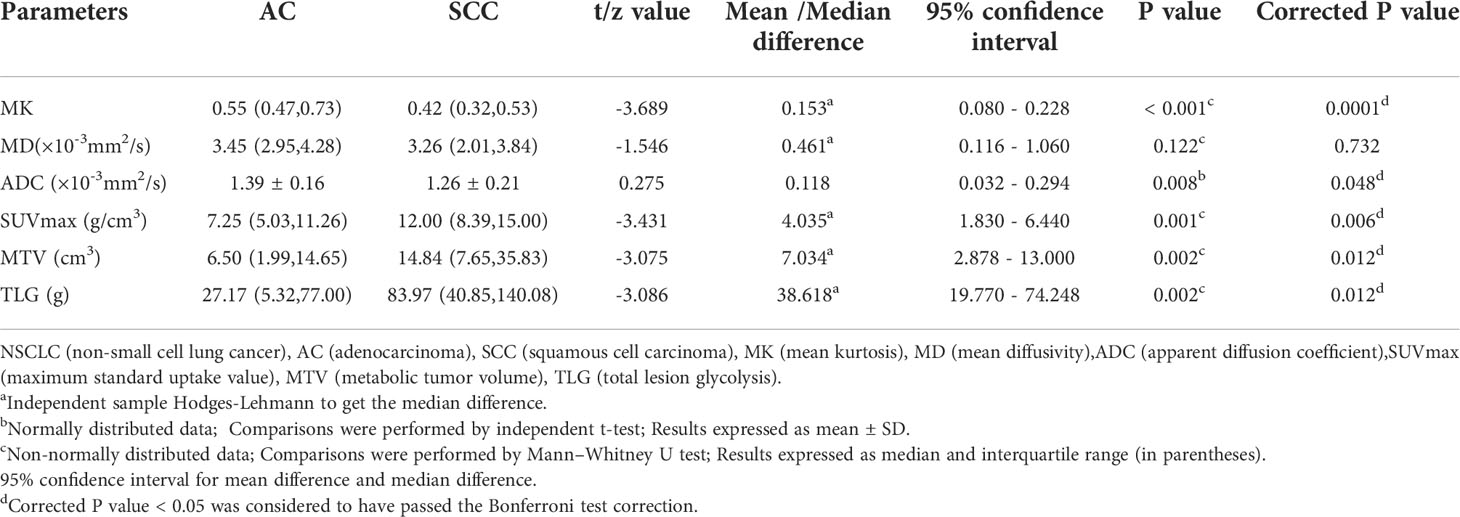
Table 3 Comparison of different parameters in subtypes of NSCLC.
Regression analyses
Age, sex, smoking, maximum diameter, location, lobulation sign, spicule sign, pleural depression sign, stage, CEA, CA-199, C-125 and related parameters were included in logistic regression analysis. Univariate analysis showed that sex, smoking, maximum diameter, stage, MK, ADC, SUVmax, TLG, and MTV were predictors of NSCLC subtype (all P< 0.1). Multivariate analysis showed that MK, SUVmax, TLG and MTV were independent predictors of NSCLC subtype (P = 0.005, 0.014, 0.025 and 0.015, respectively) (Table 4).
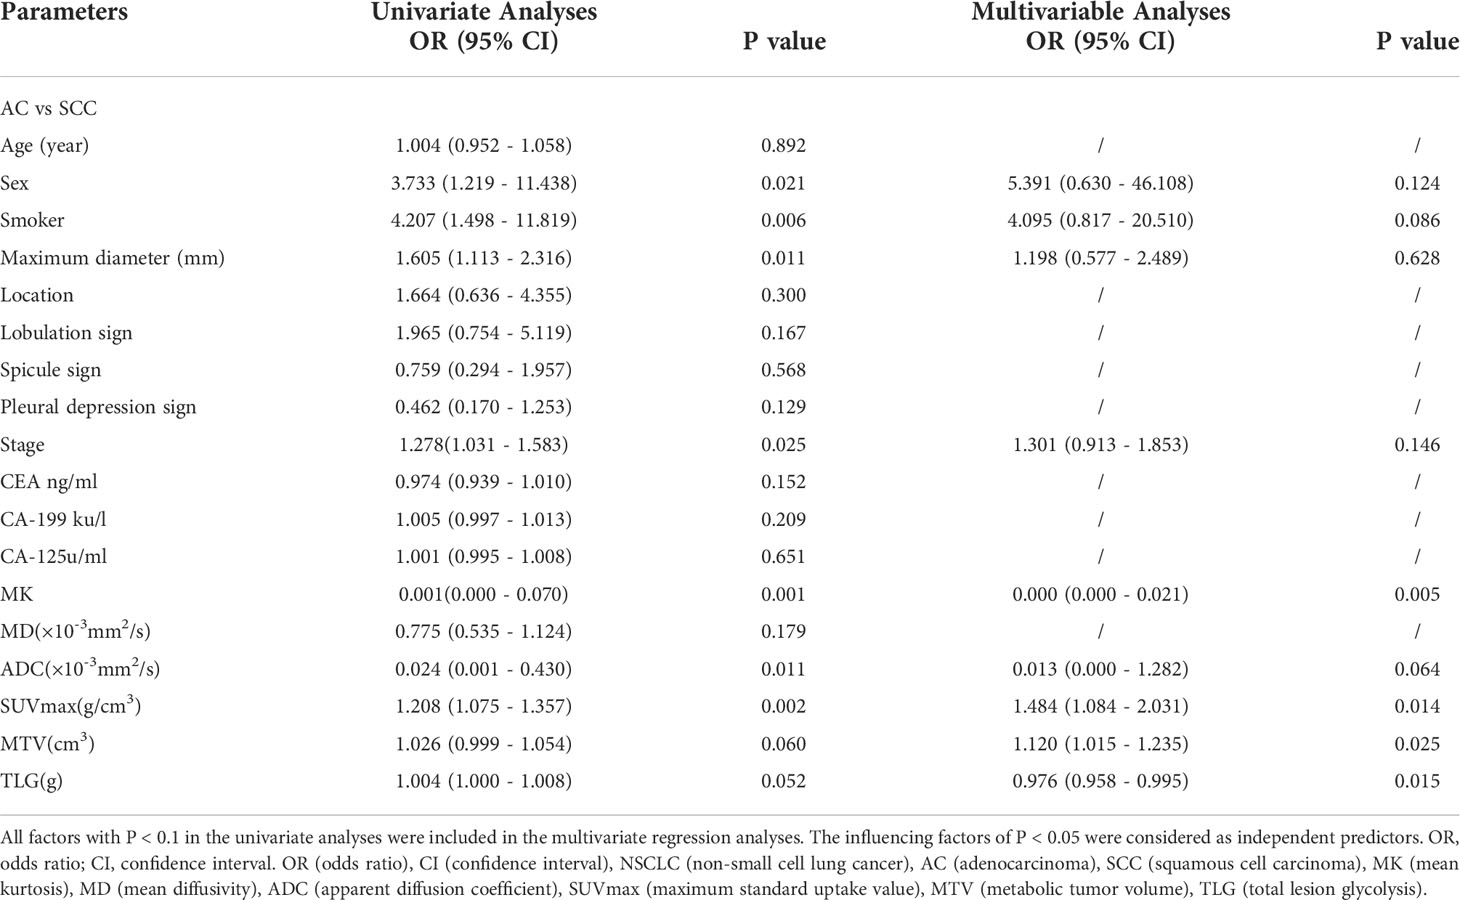
Table 4 Univariate and multivariate analyses were performed on factors associated with NSCLC.
Comparison of diagnostic efficacy
The AUCs of MK, SUVmax, TLG, MTV and ADC used to diagnose SCC and AC were 0.758, 0.740, 0.716, 0.715 and 0.679, respectively (all P< 0.05), but there was no statistically significant difference in the diagnostic efficacy among these parameters (all P > 0.05). The cutoff values for each parameter were as follows: MK: 0.43, ADC: 1.270 ×10⁻³ mm2/s, SUVmax: 7.27 g/cm3, TLG: 19.11 g and MTV: 5.05 cm3.
Independent predictors MK, SUVmax, TLG and MTV were used for combined diagnosis, and the AUC (MK + SUVmax + TLG + MTV) was 0.876 (sensitivity, 86.27%; specificity, 80.77%; P< 0.001). Moreover, the difference between AUC (MK + SUVmax + TLG + MTV) and AUC (MK), AUC (ADC), AUC (SUVmax), AUC (MTV), AUC (TLG) was significant (Z = 2.554, 3.322, 2.584, 2.530, 2.799; all P< 0.05) (Figure 3, Table 5).
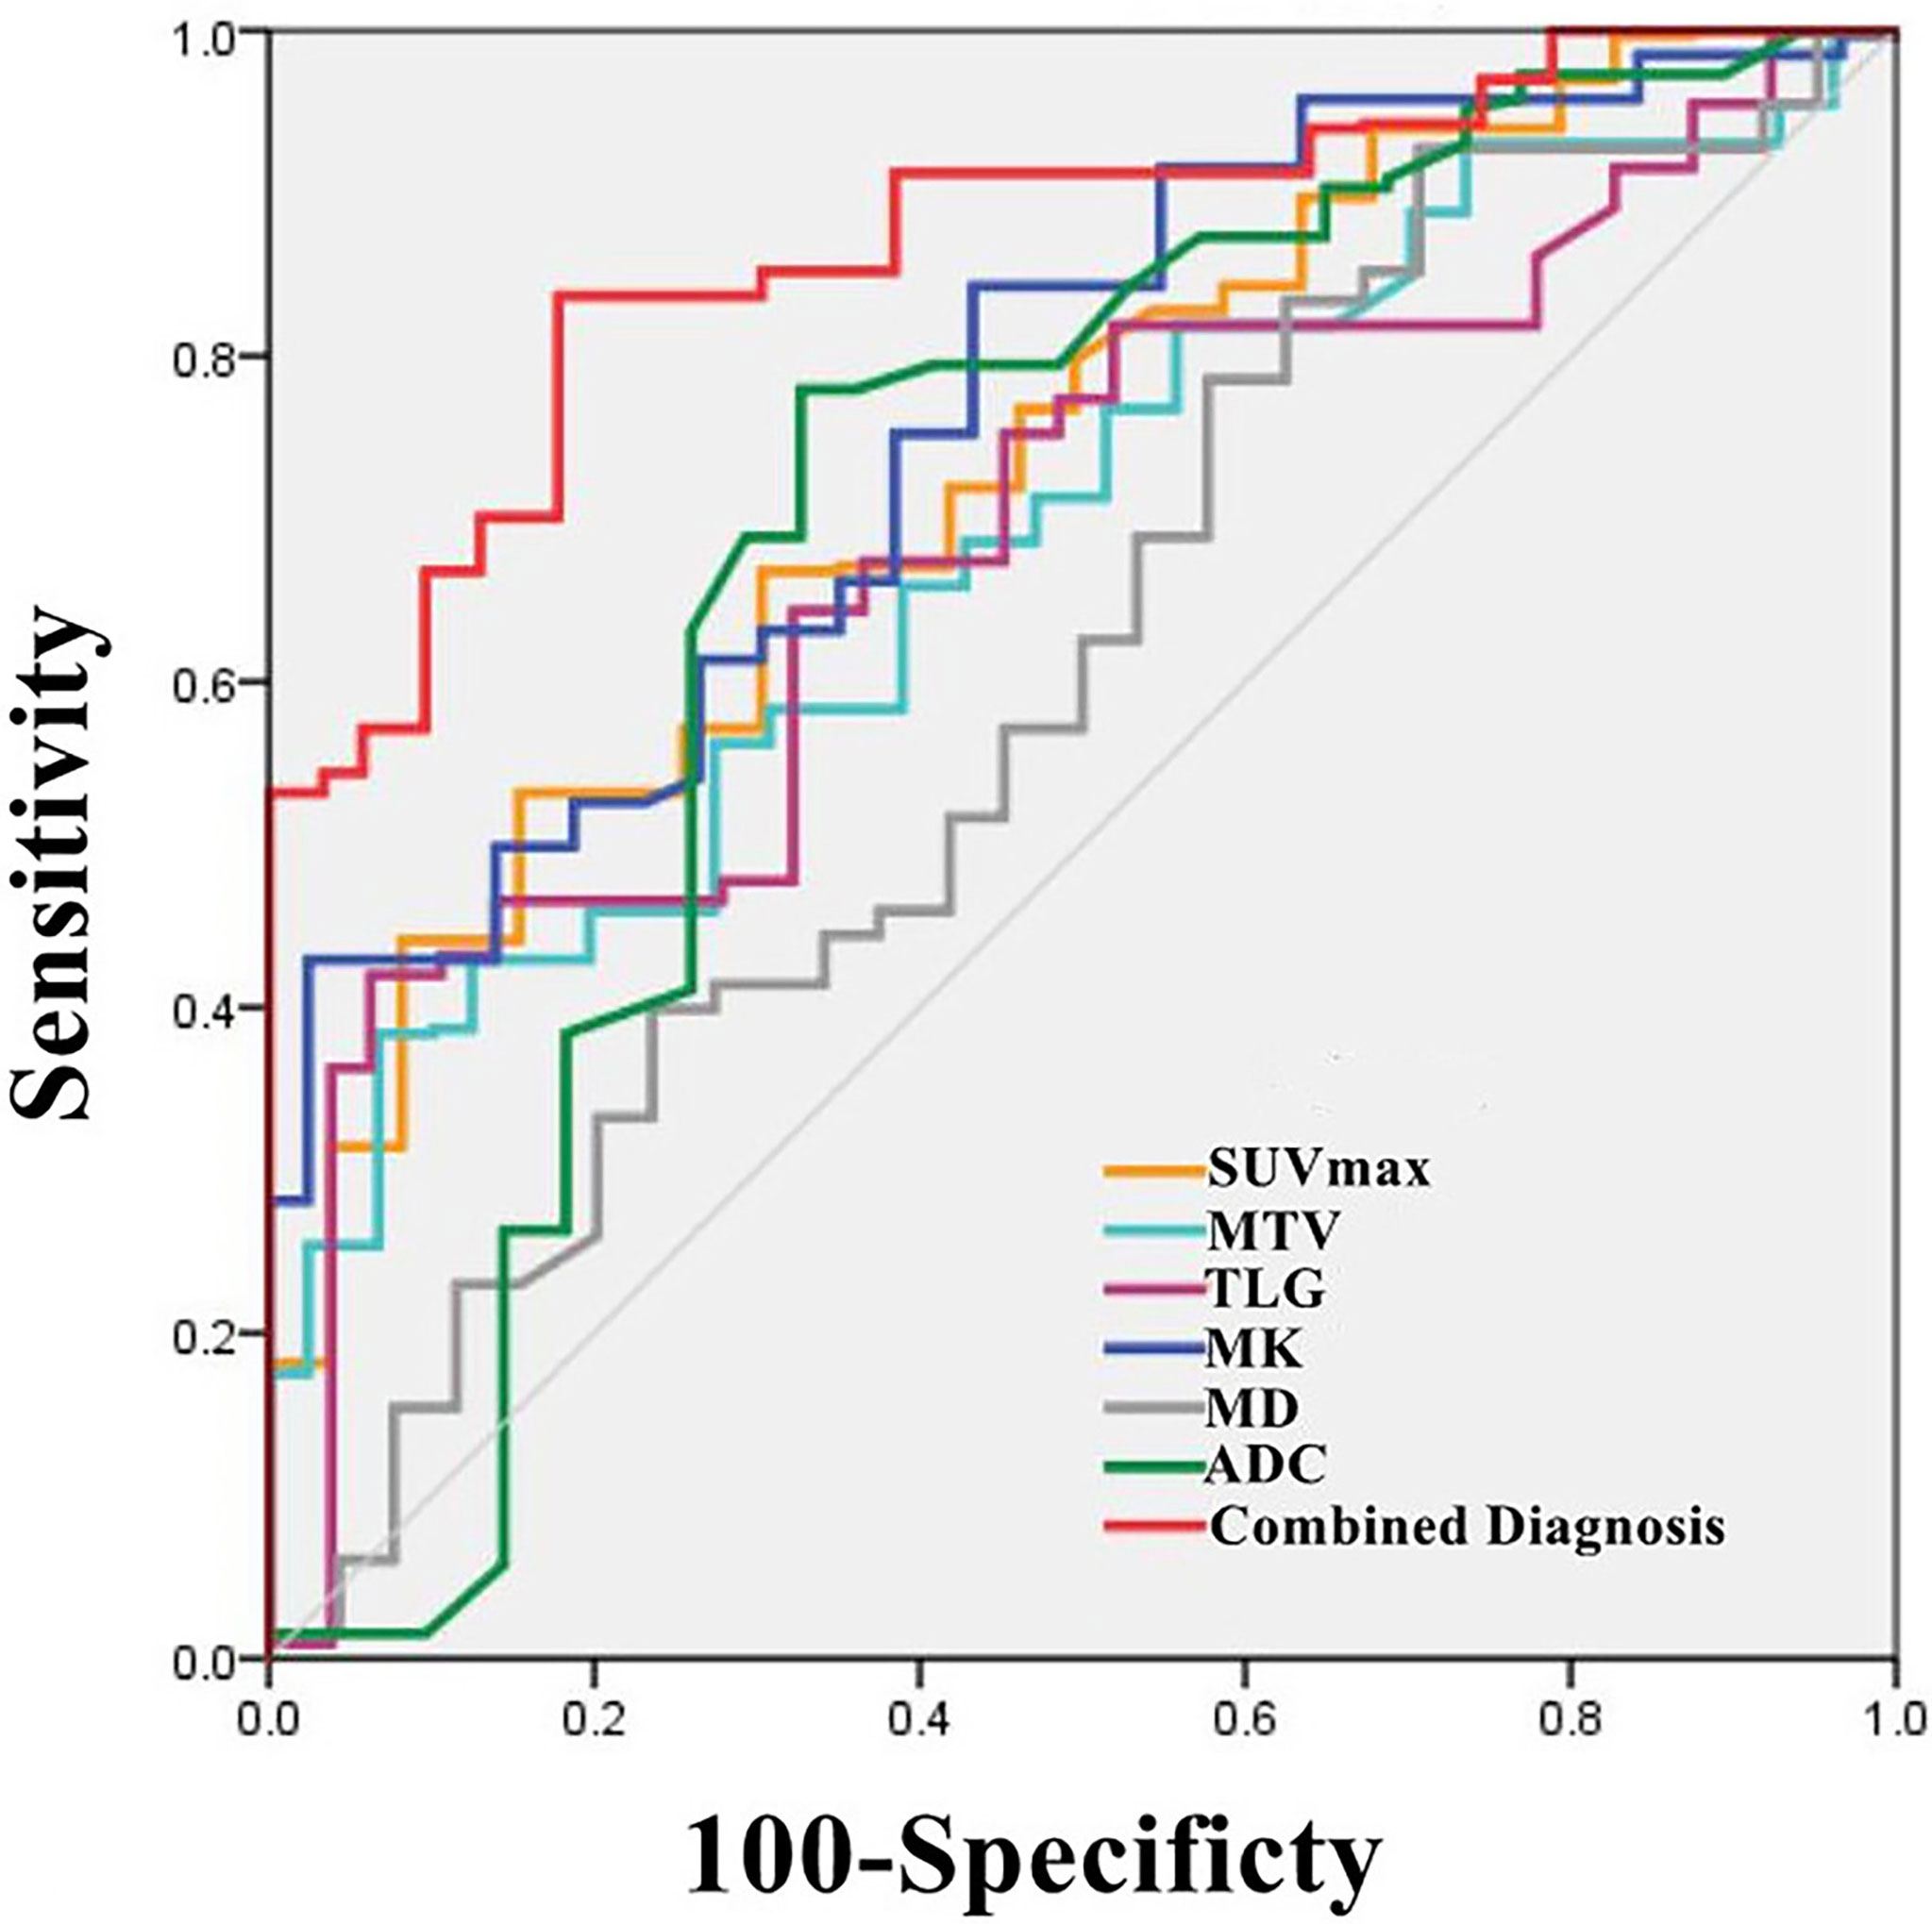
Figure 3 Graph shows ROC curves of different parameters (SUVmax, MTV, TLG, MK, MD and ADC) and the combination of independent predictors (MK+SUVmax+MTV+TLG) for discriminating AC group and SCC group (AUC was 0.740, 0.715, 0.716, 0.758, 0.608, 0.679 and 0.876 respectively).
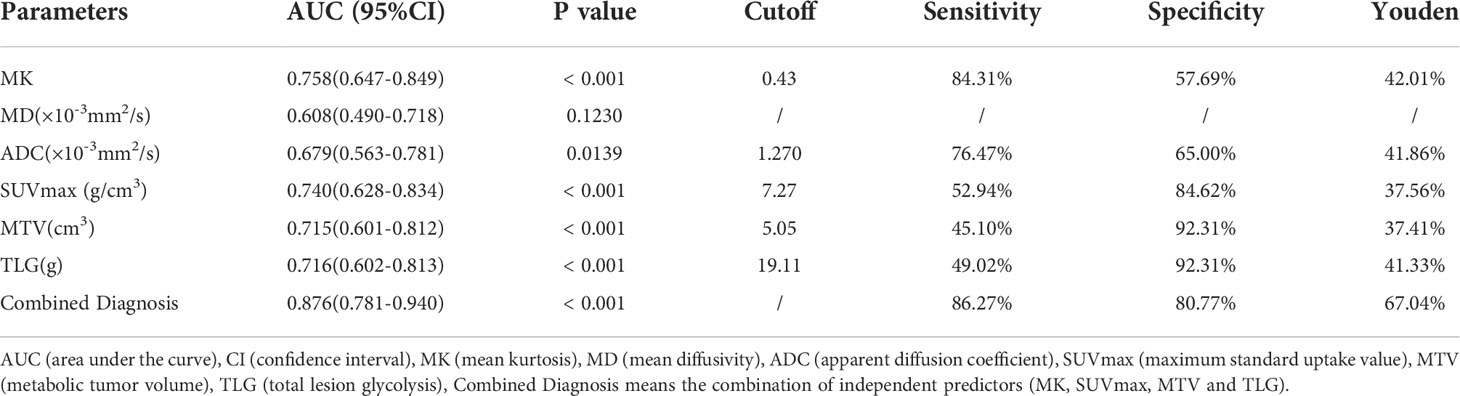
Table 5 ROC Analysis of the diagnostic performance for different parameters and methods alone or in combination for differentiating Adenocarcinoma (AC) from Squamous Cell Carcinoma (SCC).
Model validation
Bootstrapping with 1000 samples was used to validate the multivariate regression model. The ROC showed that the validation model had high accuracy in identifying AC and SCC (AUC, 0.844; 95% CI, 0.785-0.885; Figure 4A). The calibration curves indicated that the validation model was highly consistent with the original model (C-statistic, 0.864, Figure 4B). DCA showed that the model could provide a high net benefit for relevant patients (Figure 4C).
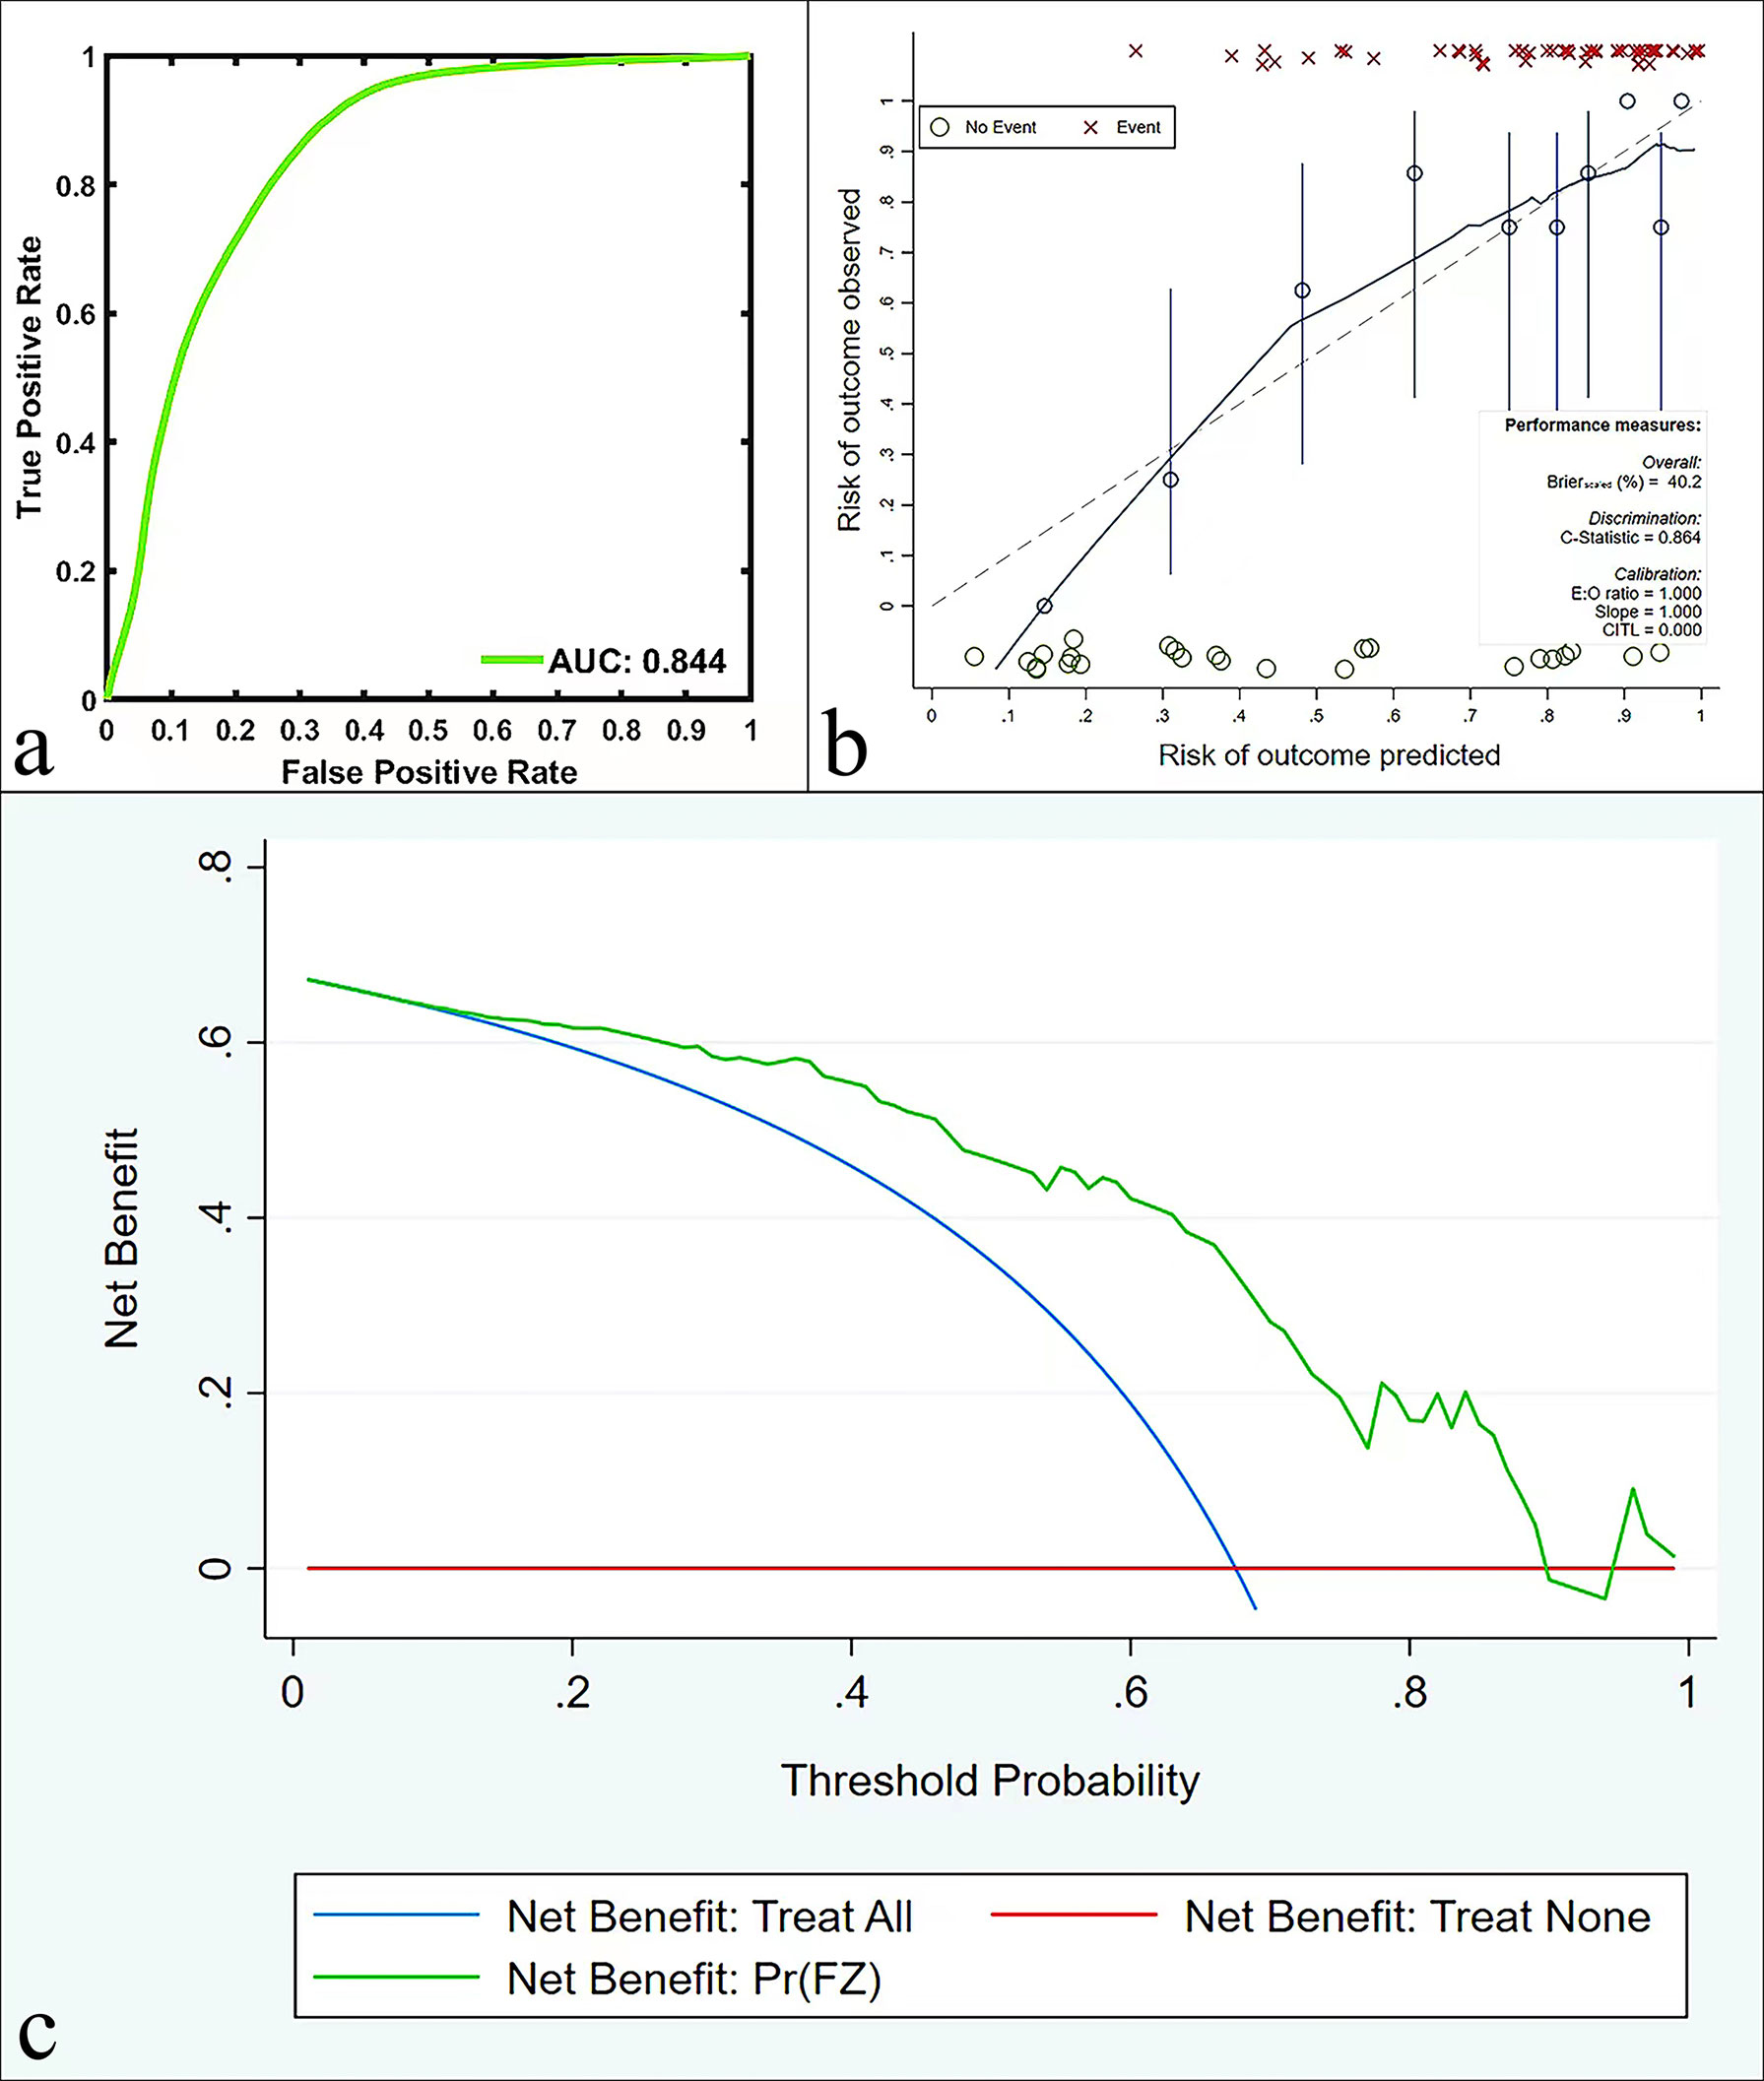
Figure 4 ROC curves (A), calibration curves (B), and DCA (C) in the validation model for predicting AC and SCC.
Correlation analysis
There was a weak positive correlation between the SUVmax value and the Ki-67 index (r1 = 0.340, P< 0.05). ADC and MD values were weakly negatively correlated with the Ki-67 index (r2 = -0.256, r3 = -0.282, all P< 0.05). There was no significant correlation between MTV, TLG, MK and the Ki-67 index (all P > 0.05). The differences between r1 and r2, r2 and r3, and r1 and r3 were not significant (Z = 0.561, 0.171, 0.391, all P > 0.05) (Table 6).

Table 6 Correlation of each parameter with Ki-67 and stage.
There was a weak positive correlation between the MTV and TLG values and NSCLC stage (r4 = 0.342, r5 = 0.337, all P< 0.05), and there was no significant difference between r4 and r5 (Z = 0.034, P > 0.05). There was no significant correlation between the SUVmax, ADC, MK, and MD values and NSCLC stage (all P > 0.05) (Table 6).
Discussion
Diffusion-related parameters to assess the NSCLC subtype, stage, and proliferative status
ADC and MD all reflect the restricted diffusion of water molecules in the tissue and are closely related to the cell density, intracellular matrix and number of organelles (27). In this study, both ADC and MD values were weakly negatively correlated with the Ki-67 index, and these results are similar to those of Peng et al. (28), further indicating that ADC and MD can be used for the assessment of Ki-67. One explanation is that the higher the Ki-67 index is, the stronger the tumor invasive ability, the higher the cell density, and the higher the nucleocytoplasmic ratio (29), which leads to the restricted diffusion of intracellular and extracellular water molecules, which in turn leads to a decrease in ADC and MD values (30). This study further explored the value of ADC and MD in evaluating NSCLC stage, and the results showed that there was no significant correlation between ADC, MD and NSCLC stage, which was similar to the results of Paul’s study (31). The reason may be that NSCLC stage is comprehensively judged by many factors, such as the size of the primary focus, the depth of infiltration, the adjacent tissue involvement range, and the presence or absence of lymph node metastasis. ADC and MD mainly reflect cell density, so it seems unlikely that tumor stage could be accurately predicted only according to ADC and MD values. In terms of identification between SCC and AC, previous studies have shown that the cells are more densely packed in SCC than in AC (32), so the diffusion of water molecules in SCC is more restricted and the ADC is reduced, which is consistent with the results of this study. However, in terms of MD, SCC and AC showed no significant difference. We speculate that this may be because MD reflects the average value of ADC in all directions, so the variation in different lesions is not as significant as ADC in a single direction. In addition, the choice of b values and number of different b values applied in DKI may also affect the diagnostic performance of MD (33).
MK is the most representative parameter of DKI (34), and its value is closely related to the complexity of the tumor tissue structure. The more complex the structure is, the more significant the deviation of the water molecule diffusion motion from the Gaussian distribution, and the larger the MK value (35). In a report on cervical cancer, Meng et al. (21) proposed that the MK value of SCC was significantly higher than that of AC, perhaps because cervical SCC has a compact structure and less mucus secretion capacity than AC. However, our results showed that lung AC had a higher MK value than lung SCC. This may be related to the high number of AC cases in this study, and advanced-stage AC accounted for the majority of AC cases. Advanced tumor tissue structure is more complex and heterogeneous (21), thus leading to higher MK in AC. In addition, more air-containing tissues in the lungs may also be one of the reasons for the differences in the above research results. In the assessment of Ki-67, our study showed no correlation between the MK value and the Ki-67 index. However, a study by Peng et al. (28) for advanced-stage lung adenocarcinoma suggested that with the increase in Ki-67 expression, the tumor cell atypia and the complexity of the tissue structure increased, and the MK value increased. The reason for the above differences may be that this study includes both SCC and AC, and the b value parameters of DKI are different from those used by Peng et al. (28). In the future, we will optimize the research and scanning parameters and further explore the value of MK and Ki-67 in NSCLC. In addition, this study also found no correlation between MK and stage, suggesting that MK may not be used for the evaluation of NSCLC.
Metabolic-related parameters to assess the NSCLC subtype, stage, and proliferative status
SUVmax is the most commonly used semiquantitative diagnostic index in clinical practice and reflects the level of glucose metabolism in the most active part of the tissue (36). For tumor lesions, previous studies have shown that the higher the malignant degree of tumor cells is, the faster the proliferation rate, and the higher the uptake of 18F-FDG is, the greater the SUVmax value (37). In this study, SUVmax was significantly different between the SCC group and the AC group (30), which is basically consistent with the research results of Port et al. (38). Compared with AC, SCC cells have a shorter doubling time, a faster proliferation rate (39, 40), and increased 18FDG uptake, which leads to increased SUVmax. Higher GLUT-1 protein expression in SCC (41) and differences in blood perfusion (42, 43) may also contribute to the increased SUVmax. MTV mainly reflects the metabolic volume of the tumor, and TLG mainly reflects the metabolic activity of the overall tumor (44). This study revealed that there were significant differences in MTV and TLG values between the SCC group and AC group, which was similar to the results of Koh et al. (40). On the one hand, this result may be related to the differences in cell proliferation, GLUT-1 expression and blood perfusion between SCC and AC (42, 43); on the other hand, the larger lesion volume of patients with SCC in this study may have contributed to the change in MTV and TLG values. In this study, NSCLC stage showed a weak positive correlation with MTV and TLG but no correlation with SUVmax, indicating that MTV and TLG values can better predict NSCLC stage. Although SUVmax is the most commonly used parameter, it only represents the biological characteristics of a single dimension of the tumor and is highly sensitive to noise (44). In fact, for advanced-stage tumors, the composition, shape, and uptake of 18F-FDG are uneven. Recent studies have also confirmed that MTV and TLG reflect the biological information of tumors more comprehensively, especially in the assessment of lung cancer stage (45). We also found that the SUVmax value was weakly positively correlated with the Ki-67 index, indicating that SUVmax can initially predict proliferation status. The reason may be that a high Ki-67 index often means that tumor cells have strong proliferation ability and vigorous metabolism (29), so their glucose uptake increases and SUVmax value increases. This study further analyzed the correlation between MTV, TLG and Ki-67, but the results showed that there was no significant correlation between them and Ki-67 expression. This is inconsistent with previous studies (46, 47). We speculate that this may be because there is still a difference between the tumor volume calculated by 18F-FDG PET/MR and the actual volume in this experiment, so it is difficult to accurately reflect the tumor metabolic burden.
Diagnostic efficacy comparison
In terms of comparison of diagnostic efficacy, we found that the AUC of the combined model of independent predictors MK, SUVmax, MTV and TLG was higher than that of any single parameter. We speculate that this may be because the combined model integrates the advantages of each parameter, so it can better evaluate the characteristics of lesions. Therefore, if conditions permit, the comprehensive use of multiple imaging methods to evaluate patients may yield the greatest benefit.
Limitations
There are several limitations to this study. First, sample size of this study was limited, and AC and advanced-stage samples accounted for a large proportion. Second, patients with tumors less than 1 cm in diameter and respiratory motion artifacts that made the image unclear were excluded. Third, there are currently few studies on DKI sequences in the lungs. No standards have yet been established for choosing a suitable b-value and ensuring a suitable signal-to-noise ratio at a high b-value, so it is still challenging to determine the best values for lesion evaluation.
Conclusion
DKI, DWI, and metabolism-related parameters can be used to evaluate the NSCLC subtype, stage, and Ki-67 index. The combination of MK, SUV, MTV and TLG may be a potential imaging marker to differentiate SCC from AC.
Data availability statement
The raw data supporting the conclusions of this article will be made available by the authors, without undue reservation.
Ethics statement
The studies involving human participants were reviewed and approved by ethics committee of Henan Provincial People’s Hospital, Approval No. 2020116. The patients/participants provided their written informed consent to participate in this study.
Author contributions
Study concepts and design, MW. Literature research, PF, TF,and ZS. Clinical studies, ZH, ZL and BD. Data analysis, FF, YW, ZS and ZW. Manuscript preparation, PF, WW and BD. Manuscript editing, JY, YY and ZS. All authors contributed to the article and approved the submitted version.
Funding
This work was supported by the National Key R&D Program of China (2017YFE0103600), the National Natural Science Foundation of China (81720108021 and 31470047), the Zhengzhou Collaborative Innovation Major Project (20XTZX05015), Zhongyuan Thousand Talents Plan Project - Basic Research Leader Talent (ZYQR201810117), the Key Project of Henan Province Medical Science and Technology Project (LHGJ20210001 and LHGJ20210005) and Henan provincial science and technology research projects (212102310689).
Acknowledgments
We acknowledge financial support by the National Natural Science Foundation of China.
Conflict of interest
Authors JY, YY, and ZW were employed by United Imaging Healthcare (UIH).
The remaining authors declare that the research was conducted in the absence of any commercial or financial relationships that could be construed as a potential conflict of interest.
Publisher’s note
All claims expressed in this article are solely those of the authors and do not necessarily represent those of their affiliated organizations, or those of the publisher, the editors and the reviewers. Any product that may be evaluated in this article, or claim that may be made by its manufacturer, is not guaranteed or endorsed by the publisher.
References
1. Siegel RL, Miller KD, Fuchs HE, Jemal A. Cancer statistics, 2021. CA Cancer J Clin (2021) 71(1):7–33. doi: 10.3322/caac.21654
2. Detterbeck FC, Boffa DJ, Kim AW, Tanoue LT. The eighth edition lung cancer stage classification. Ches (2017) 151:193–203. doi: 10.1016/j.chest.2016.10.010
3. Hill A, Gupta R, Zhao D, Vankina R, Amanam I, Salgia R. Targeted therapies in non-small-Cell lung cancer. Cancer Treat Res (2019) 178:3–43. doi: 10.1007/978-3-030-16391-4_1
4. Rao S, Sigl V, Wimmer RA, Novatchkova M, Jais A, Wagner G, et al. RANK rewires energy homeostasis in lung cancer cells and drives primary lung cancer. Genes Dev (2017) 31(20):2099–112. doi: 10.1101/gad.304162.117
5. Perez-Moreno P, Brambilla E, Thomas R, Soria JC. Squamous cell carcinoma of the lung: molecular subtypes and therapeutic opportunities. Clin Cancer Res (2012) 18(9):2443–51. doi: 10.1158/1078-0432.CCR-11-2370
6. Fraioli F, Screaton NJ, Janes SM, Win T, Menezes L, Kayani I, et al. Non-small-cell lung cancer resectability: diagnostic value of PET/MR. Eur J Nucl Med Mol Imaging (2015) 42(1):49–55. doi: 10.1007/s00259-014-2873-9
7. Bogart JA, Aronowitz JN. Localized non-small cell lung cancer: adjuvant radiotherapy in the era of effective systemic therapy. Clin Cancer Res (2005) 11(13 Pt 2):5004s–10s. doi: 10.1158/1078-0432.CCR-05-901
8. Bryant AS, Cerfolio RJ. Diagnosis, staging and treatment of patients with non-small cell lung cancer for the surgeon. Indian J Surg (2009) 71(6):310–6. doi: 10.1007/s12262-009-0086-4
9. Walker S. Updates in non-small cell lung cancer. Clin J Oncol Nurs (2008) 12(4):587–96. doi: 10.1188/08.CJON.587-596
10. Grant L, Banerji S, Murphy L, Dawe DE, Harlos C, Myal Y, et al. Androgen receptor and Ki67 expression and survival outcomes in non-small cell lung cancer. Horm Cancer (2018) 9(4):288–94. doi: 10.1007/s12672-018-0336-7
11. Wen S, Zhou W, Li CM, Hu J, Hu XM, Chen P, et al. Ki-67 as a prognostic marker in early-stage non-small cell lung cancer in Asian patients: a meta-analysis of published studies involving 32 studies. BMC Cancer (2015) 15:520. doi: 10.1186/s12885-015-1524-2
12. Zhang H, Tian S, Wang S, Liu S, Liao M. CT-guided percutaneous core needle biopsy in typing and subtyping lung cancer: A comparison to surgery. Technol Cancer Res Treat (2022) 21:15330338221086411. doi: 10.1177/15330338221086411
13. Anzidei M, Argirò R, Porfiri A, Boni F, Anile M, Zaccagna F, et al. Preliminary clinical experience with a dedicated interventional robotic system for CT-guided biopsies of lung lesions: a comparison with the conventional manual technique. Eur Radiol (2015) 25(5):1310–6. doi: 10.1007/s00330-014-3508-z
14. Vansteenkiste JF. PET scan in the staging of non-small cell lung cancer. Lung Cancer (2003) 42(1):S27–37. doi: 10.1016/s0169-5002(03)00302-7
15. Gould MK, Maclean CC, Kuschner WG, Rydzak CE, Owens DK. Accuracy of positron emission tomography for diagnosis of pulmonary nodules and mass lesions: a meta-analysis. JAMA (2001) 285(7):914–24. doi: 10.1001/jama.285.7.914
16. Le Bihan D, Breton E, Lallemand D, Grenier P, Cabanis E, Laval-Jeantet M. MR imaging of intravoxel incoherent motions: application to diffusion and perfusion in neurologic disorders. Radiology (1986) 161(2):401–7. doi: 10.1148/radiology.161.2.3763909
17. Yilmaz F, Tastekin G. Sensitivity of (18)F-FDG PET in evaluation of solitary pulmonary nodules. Int J Clin Exp Med (2015) 8(1):45–51. doi: 10.2174/1874471013666191223153755
18. Farsad M. FDG PET/CT in the staging of lung cancer. Curr Radiopharm (2020) 13(3):195–203. doi: 10.2174/1874471013666191223153755
19. Tamura C, Shinmoto H, Soga S, Okamura T, Sato H, Okuaki T, et al. Diffusion kurtosis imaging study of prostate cancer: preliminary findings. J Magn Reson Imaging. (2014) 40(3):723–9. doi: 10.1002/jmri.24379
20. Bai Y, Lin Y, Tian J, Shi D, Cheng J, Haacke EM, et al. Grading of gliomas by using monoexponential, biexponential, and stretched exponential diffusion-weighted MR imaging and diffusion kurtosis MR imaging. Radiology (2016) 278(2):496–504. doi: 10.1148/radiol.2015142173
21. Meng N, Wang X, Sun J, Han D, Ma X, Wang K, et al. Application of the amide proton transfer-weighted imaging and diffusion kurtosis imaging in the study of cervical cancer. Eur Radiol (2020) 30(10):5758–67. doi: 10.1007/s00330-020-06884-9
22. Das SK, Yang DJ, Wang JL, Zhang C, Yang HF. Non-Gaussian diffusion imaging for malignant and benign pulmonary nodule differentiation: a preliminary study. Acta Radiol (2017) 58(1):19–26. doi: 10.1177/0284185116639763
23. von Schulthess GK, V eit-Haibach P. Workflow considerations in PET/MR imaging. J Nucl Med (2014) 55(Supplement 2):19S–24S. doi: 10.2967/jnumed.113.129239
24. Chen S, Gu Y, Yu H, Chen X, Cao T, Hu L, et al. NEMA NU2-2012 performance measurements of the united imaging uPMR790: an integrated PET/MR system. Eur J Nucl Med Mol Imaging (2021) 48(6):1726–35. doi: 10.1007/s00259-020-05135-9
25. Rami-Porta R, Bolejack V, Crowley J, Crowley J, Ball D, Kim J, et al. The IASLC lung cancer staging project: Proposals for the revisions of the T descriptors in the forthcoming eighth edition of the TNM classification for lung cancer. J Thorac Oncol (2015) 10(7):990–1003. doi: 10.1097/JTO.0000000000000559
26. Shieh G. Choosing the best index for the average score intraclass correlation coefficient. Behav Res Methods (2016) 48(3):994–1003. doi: 10.3758/s13428-015-0623-y
27. Meng N, Fang T, Feng P, Huang Z, Sun J, Wang X, et al. Amide proton transfer-weighted imaging and multiple models diffusion-weighted imaging facilitates preoperative risk stratification of early-stage endometrial carcinoma. J Magn Reson Imaging (2021) 54(4):1200–11. doi: 10.1002/jmri.27684
28. Peng Q, Tang W, Huang Y, Wu N, Yang L, Li N. Diffusion kurtosis imaging: correlation analysis of quantitative model parameters with molecular features in advanced lung adenocarcinoma. Chin Med J (Engl) (2020) 133(20):2403–9. doi: 10.1097/CM9.0000000000001074
29. Huang Z, Li X, Wang Z, Meng N, Fu F, Han H, et al. Application of simultaneous 18 f-FDG PET with monoexponential, biexponential, and stretched exponential model-based diffusion-weighted MR imaging in assessing the proliferation status of lung adenocarcinoma. J Magn Reson Imaging (2022) 56(1):63–74. doi: 10.1002/jmri.28010
30. Zheng Y, Huang W, Zhang X, Lu C, Fu C, Li S, et al. A noninvasive assessment of tumor proliferation in lung cancer patients using intravoxel incoherent motion magnetic resonance imaging. J Cancer (2021) 12(1):190–7. doi: 10.7150/jca.48589
31. Pauls S, Schmidt SA, Juchems MS, Klass O, Luster M, Reske SN, et al. Diffusion-weighted MR imaging in comparison to integrated [18F]-FDG PET/CT for n-staging in patients with lung cancer. Eur J Radiol (2012) 81(1):178–82. doi: 10.1016/j.ejrad.2010.09.001
32. Matoba M, Tonami H, Kondou T, Yokota H, Higashi K, Toga H, et al. Lung carcinoma: diffusion-weighted mr imaging–preliminary evaluation with apparent diffusion coefficient. Radiology (2007) 243(2):570–7. doi: 10.1148/radiol
33. Zheng Y, Li J, Chen K, Zhang X, Sun H, Li S, et al. Comparison of conventional DWI, intravoxel incoherent motion imaging, and diffusion kurtosis imaging in differentiating lung lesions. Front Oncol (2022) 11:815967. doi: 10.3389/fonc.2021.815967
34. Cao L, Chen J, Duan T, Wang M, Jiang H, Wei Y, et al. Diffusion kurtosis imaging (DKI) of hepatocellular carcinoma: correlation with microvascular invasion and histologic grade. Quant Imaging Med Surg (2019) 9(4):590–602. doi: 10.21037/qims.2019.02.14
35. Van Cauter S, De Keyzer F, Sima DM, Sava AC, D'Arco F, Veraart J, et al. Integrating diffusion kurtosis imaging, dynamic susceptibility-weighted contrast-enhanced MRI, and short echo time chemical shift imaging for grading gliomas. Neuro Oncol (2014) 16(7):1010–21. doi: 10.1093/neuonc/not304
36. Sager O, Dincoglan F, Demiral S, Uysal B, Gamsiz H, Elcim Y, et al. Utility of molecular imaging with 2-Deoxy-2-[Fluorine-18] fluoro-DGlucose positron emission tomography (18F-FDG PET) for small cell lung cancer (SCLC): A radiation oncology perspective. Curr Radiopharm (2019) 12(1):4–10. doi: 10.2174/1874471012666181120162434
37. Fang T, Meng N, Feng P, Huang Z, Li Z, Fu F, et al. A comparative study of amide proton transfer weighted imaging and intravoxel incoherent motion MRI techniques versus (18) f-FDG PET to distinguish solitary pulmonary lesions and their subtypes. J Magn Reson Imaging (2022) 55(5):1376–90. doi: 10.1002/jmri.27977
38. Port JL, Andrade RS, Levin MA, Korst RJ, Lee PC, Becker DE, et al. Positron emission tomographic scanning in the diagnosis and staging of non-small cell lung cancer 2 cm in size or less. J Thorac Cardiovasc Surg (2005) 130(6):1611–5. doi: 10.1016/j.jtcvs.2005.07.014
39. Brown RS, Leung JY, Kison PV, Zasadny KR, Flint A, Wahl RL. Glucose transporters and FDG uptake in untreated primary human non-small cell lung cancer. J Nucl Med (1999) 40(4):556–65. doi: 10.1007/s00259-020-05134-9
40. Koh YW, Lee SJ, Park SY. Differential expression and prognostic significance of GLUT1 according to histologic type of non-small-cell lung cancer and its association with volume-dependent parameters. Lung Cancer (2017) 104:31–7. doi: 10.1016/j.lungcan.2016.12.003
41. Ong LC, Jin Y, Song IC, Yu S, Zhang K, Chow PK. 2-[18F]-2-deoxy-D-glucose (FDG) uptake in human tumor cells is related to the expression of GLUT-1 and hexokinase II. Acta Radiol (2008) 49(10):1145–53. doi: 10.1080/02841850802482486
42. Fraioli F, Anzidei M, Serra G, Liberali S, Fiorelli A, Zaccagna F, et al. Whole-tumour CT-perfusion of unresectable lung cancer for the monitoring of anti-angiogenetic chemotherapy effects. Br J Radiol (2013) 86(1029):20120174. doi: 10.1259/bjr.20120174
43. Fraioli F, Anzidei M, Zaccagna F, Mennini ML, Serra G, Gori B, et al. Whole-tumor perfusion CT in patients with advanced lung adenocarcinoma treated with conventional and antiangiogenetic chemotherapy: initial experience. Radiology. (2011) 259(2):574–82. doi: 10.1148/radiol.11100600
44. Boellaard R, Krak NC, Hoekstra OS, Lammertsma AA. Effects of noise, image resolution, and ROI definition on the accuracy of standard uptake values: a simulation study. J Nucl Med (2004) 45(9):1519–27. doi: 10.1007/s02159-020-05125-6
45. Hyun SH, Ahn HK, Kim H, Ahn MJ, Park K, Ahn YC, et al. Volume-based assessment by (18)F-FDG PET/CT predicts survival in patients with stage III non-small-cell lung cancer. Eur J Nucl Med Mol Imaging (2014) 41(1):50–8. doi: 10.1007/s00259-013-2530-8
46. Ege Aktas G, Taştekin E, Sarikaya A, Cho J, Choi S, Lee S. Assessment of biological and clinical aggressiveness of invasive ductal breast cancer using baseline 18F-FDG PET/CT-derived volumetric parameters. Nucl Med Commun (2018) 39(1):83–93. doi: 10.1097/MNM.0000000000000779
Keywords: diffusion kurtosis imaging, diffusion-weighted imaging, 18F-FDG PET, non-small cell lung cancer, Ki-67
Citation: Feng P, Shao Z, Dong B, Fang T, Huang Z, Li Z, Fu F, Wu Y, Wei W, Yuan J, Yang Y, Wang Z and Wang M (2022) Application of diffusion kurtosis imaging and 18F-FDG PET in evaluating the subtype, stage and proliferation status of non-small cell lung cancer. Front. Oncol. 12:989131. doi: 10.3389/fonc.2022.989131
Received: 08 July 2022; Accepted: 14 September 2022;
Published: 30 September 2022.
Edited by:
Long Jiang Zhang, Nanjing General Hospital of Nanjing Military Command, ChinaReviewed by:
Lian-Ming Wu, Shanghai Jiao Tong University, ChinaFulvio Zaccagna, University of Bologna, Italy
Copyright © 2022 Feng, Shao, Dong, Fang, Huang, Li, Fu, Wu, Wei, Yuan, Yang, Wang and Wang. This is an open-access article distributed under the terms of the Creative Commons Attribution License (CC BY). The use, distribution or reproduction in other forums is permitted, provided the original author(s) and the copyright owner(s) are credited and that the original publication in this journal is cited, in accordance with accepted academic practice. No use, distribution or reproduction is permitted which does not comply with these terms.
*Correspondence: Meiyun Wang, mywang@zzu.edu.cn
†These authors have contributed equally to this work and share first authorship