 Manisha du Plessis1*
 Tanja Andrea Davis1
 Daniel Wilhelm Olivier1Willem Johan Simon de Villiers2
 Anna-Mart Engelbrecht1,3
- 1Department of Physiological Sciences, Stellenbosch University, Stellenbosch, South Africa
- 2Department of Internal Medicine, Faculty of Medicine and Health Sciences, Stellenbosch University, Cape Town, South Africa
- 3African Cancer Institute (ACI), Department of Global Health, Faculty of Medicine and Health Sciences, Stellenbosch University, Stellenbosch, South Africa
It has been established that the acute phase protein, Serum amyloid A (SAA), which is usually synthesized by the liver, is also synthesized by cancer cells and cancer-associated cells in the tumor microenvironment. SAA also activates modulators of autophagy, such as the PI3K/Akt and MAPK signaling pathways. However, the role of SAA in autophagy in breast cancer still remains to be elucidated. The aim of this study was to investigate the role of SAA in the regulation of signaling pathways and autophagy in in vitro and in vivo models of breast cancer. The MDA-MB-231 and MCF7 cell lines were transiently transfected to overexpress SAA1. A tumor-bearing SAA1/2 knockout mouse model was also utilized in this study. SAA1 overexpression activated ERK signaling in the MDA-MB-231 cells, downregulated the PI3K pathway protein, PKB/Akt, in the MCF7 cell line, while SAA1/2 knockout also inhibited Akt. Furthermore, SAA1 overexpression in vitro downregulated autophagy, while the expression of SQSTM1/p62 was increased in the MCF7 cells, and SAA1/2 knockout induced autophagy in vivo. SAA overexpression in the MDA-MB-231 and MCF7 cells resulted in an increase in cell viability and increased the expression of the proliferation marker, MCM2, in the MCF7 cells. Furthermore, knockout of SAA1/2 resulted in an altered inflammatory profile, evident in the decrease of plasma IL-1β, IL-6 and IL-10, while increasing the plasma levels of MCP-1 and TNF-α. Lastly, SAA1/2 knockout promoted resistance to apoptosis and necrosis through the regulation of autophagy. SAA thus regulates autophagy in breast cancer cells to promote tumorigenesis.
Introduction
Tumor cells regulate the tumor microenvironment (TME) through the secretion of pro-inflammatory cytokines, which links tumor progression to inflammation (1). Infection, injury or changes in physiological tissue homeostasis elicits systemic responses such as the acute phase response to ensure the return to homeostasis. The acute phase response consists of a cascade of local or systemic reactions in response to inflammation, coordinated by cytokines, which are secreted by macrophages and other immune cells (2). Production of pro-inflammatory cytokines, mainly interleukins-1β (IL-1β) and -6 (IL-6) and tumor necrosis factor- α (TNF-α), at the site of injury stimulates the production of acute phase proteins (APPs) locally or by the liver. One such APP known to be synthesized primarily by the liver is serum amyloid A (SAA). SAA belongs to a family of evolutionary conserved proteins which is involved in inflammation (3, 4). The SAA isoforms are expressed at different levels in response to inflammatory stimuli. SAA1 and SAA2 are inducible APPs and share 96% nucleotide sequence homology. Human SAA3 is considered a pseudogene, producing a non-coding RNA molecule, while SAA4 is constitutively expressed (5). The murine SAA gene family consists of 5 variants, of which Saa1, Saa2 and Saa3 are all acute phase genes, Saa5 is constitutively expressed and Saa4 is a pseudogene (6). However, it has been reported that cancer and cancer-associated cells can also produce SAA in the TME, which adds a new dimension of complexity to the regulation of cancer by the TME (7). Elevated serum levels of SAA present in the TME are associated with poor prognosis. Additionally, various studies have shown that SAA contributes to cancer progression through the promotion of proliferation, metastasis, inflammation and angiogenesis in breast, lung, prostate, ovarian and renal cell cancers (4, 8–11). It has also been reported that SAA can activate the phosphatidylinositol-4,5-bisphosphate 3-kinase (PI3K)/Akt and mitogen-activated protein kinase (MAPK) pathway, including the MAPK components ERK1/2 and p38 (12–19). These pathways are known modulators of the intracellular degradation process, macroautophagy, hereafter referred to as autophagy (12, 20, 21).
Autophagy maintains homeostasis of non-malignant and cancer cells during metabolic and cellular stress. It is characterized by the sequestration of cytoplasm, long-lived proteins and cellular organelles in double-membrane vesicles called autophagosomes. These are delivered to and degraded in lysosomes, therefore this process is characterized as cellular self-consumption or self-eating. Defective autophagy induces metabolic stress which manifests as oxidative stress, endoplasmic reticulum stress, DNA damage and cytokine production, ultimately culminating in excessive inflammation (22). Autophagy can also regulate apoptosis and necrosis in solid tumors. As such, impaired autophagy is often associated with tumorigenesis (23).
It is clear from the literature that the pathogenesis of cancer is governed by multiple signaling pathways often induced by a pro-inflammatory TME. However, the complexity of the crosstalk between these pathways poses a challenge in understanding the role of SAA during cancer development. We identified a novel role for SAA, where it regulates the activation of intracellular signaling pathways and promotes cancer cell proliferation. Furthermore, our findings indicate that the overexpression of SAA1 promotes breast cancer progression by downregulating autophagy in vitro, while the double knockout of Saa1 and Saa2 in vivo induces autophagy as a protective mechanism against cell death. In line with this, autophagy protected against apoptosis and necrosis in vivo, as well as inducing an altered plasma inflammatory profile in SAA1/2 double knockout mice.
Materials and methods
Cell lines and treatments
The human estrogen and progesterone receptor positive cell line, MCF7, and the triple negative, MDA-MB-231, human breast adenocarcinoma cell line were used in the in vitro study. The murine breast adenocarcinoma cell line, EO771, was used in the in vivo study. The MCF7 and the MDA-MB-231 cell lines were cultured in growth medium consisting of Dulbecco’s Modified Eagle Medium (DMEM) (41965062, Gibco®, ThermoFisher Scientific, MA, USA) supplemented with 10% fetal bovine serum (FBS) (FBS-GI-12A, Capricorn Scientific, Germany) and 1% Penicillin Streptomycin (15140122, ThermoFisher Scientific, MA, USA). The EO771 cell line was cultured in DMEM (Gibco®, ThermoFisher Scientific, MA, USA) supplemented with 10% FBS and 1% Penicillin Streptomycin. It was confirmed that cells were clear from mycoplasma infection. The cells were maintained in a humidified incubator set at 5% CO2 and 37°C. MCF7 and MDA-MB-231 cells were treated with the autophagy inhibitor, Bafilomycin A1 (Baf [B0025, LKT Laboratories]), 200 nM for 6 hours and 400 nM for 4 hours respectively. Autophagy was induced by using Rapamycin (Rapa [R0161, LKT Laboratories]), 50 nM for 24 hours in the MCF7 cell line, or serum starvation with 1% FBS for 8 hours in the MDA-MB-231 cell line.
Transfections
The pcDNA3.1 (+) plasmid, kindly provided by Prof Sharon Prince (University of Cape Town, Cape Town, South Africa), was used as the control vector and was used as a backbone for the overexpression cDNA sequence for SAA1 (pcDNA3-hSAA1). The MCF7 and MDA-MB-231 cell lines were transfected at a confluency of approximately 80%. A total of 2 µg (6-well plate), 1 µg (12-well plate) or 0.3 µg (48-well plate) pDNA was transfected per well in a ratio of 1:3 with the X-tremeGENE™ HP DNA transfection reagent (6366236001, Roche, Sigma-Aldrich). The transfection complex was prepared in DMEM and the following volumes were added per well in the appropriate culture plates: 200 µl (6-well plate), 100 µl (12-well plate) or 30 µl (48-well plate). The pDNA:transfection reagent complexes were incubated for 30 minutes at room temperature (RT) and was added to the culture wells in a drop-wise manner. Transfection experiments were performed over 48 and 72 hours.
WST-1 assay
The WST-1 Cell Proliferation Assay (11644807001, Roche, Sigma-Aldrich) measures cell viability based on mitochondrial reductive capacity. A 1:10 ratio of WST-1 (11644807001, Roche, Sigma-Aldrich) to volume per well was added to the growth medium. Following incubation at 37°C for 60 minutes, the colorimetric readings were measured at a wavelength of 450 nm with an EL800 universal microplate reader (BioTek Instruments Inc., VT, USA) and the KC Junior software (BioTek Instrument Inc., USA).
Immunofluorescence
Cells were grown on sterile glass coverslips. Following transfections and autophagy modulation, the cells were fixed with 4% Paraformaldehyde (PFA) before being blocked in 5% goat serum for 1 hour at RT. The cells were incubated overnight at 4°C with anti-LC3-II primary antibody (1:200; 83506S; Cell Signalling Technology). The anti-mouse AlexaFluor-647 secondary antibody (1:500; A21236; ThermoFisher Scientific), prepared in PBS, was added to the cells, and incubated for 1 hour at RT. Cells were counterstained with 10 µg/ml Hoechst 33342 (14533, Sigma-Aldrich, MO, USA) for 10 minutes and mounted onto glass microscope slides with Dako Fluorescent Mounting Medium (Dako). Images were acquired on a LSM780 ELYRA PS1 confocal microscope (Carl Zeiss, Germany), using the Zeiss Zen Lite Black Edition Imaging Software v.2.3 (Carl Zeiss, Germany), as well as the Zeiss Axio Observer 7 fluorescent microscope (Carl Zeiss Microscopy, Munich, Germany). Images were acquired using the 63x oil immersion objective, using the same exposure times, and were captured in Z-stacks. The images were deconvoluted using the Icy software (24) and were analyzed using the Fiji® (ImageJ) (Java 1.6_0 24 [64-bit]) software. The images were subjected to thresholding and quantified using the default ‘Analyze particles’ plugin with the Fiji® (ImageJ) software.
Animal model
Ethical clearance was obtained from Stellenbosch University Ethics Committee to assess tumor growth and the role of SAA in C57BL/6J wild-type (WT) mice and mice lacking the genes Saa1 and Saa2 (SAADKO, SAA Double Knock Out) (25) according to the approved protocol (ACU-2019-6426). Twenty-nine-week-old female SAADKO and 20 age-matched C57BL/6J control mice were used in this study. The syngeneic murine mammary carcinoma cell line, EO771, was used to inoculate breast tumors in vivo. A total of 1.5 x 10⁶/100 μl EO771 cells in Hanks Balanced Salt Solution (HBSS, Sigma Aldrich) were subcutaneously injected with 25-gauge needles into 9-week-old WT and SAADKO mice under 3% isoflurane (Isofor, Safeline Pharmaceuticals) sedation at the fourth mammary fat pad of each mouse. Control mice received 100 μl injections of HBSS at the same site and under the same conditions. Ten mice from the SAADKO and WT groups respectively were injected with 0.1mg/g chloroquine (CQ) dissolved in autoclaved water at the tumor site 6 hours prior to euthanasia. One half of the tumor was snap frozen in liquid nitrogen for use in western blot analysis. The other half was stored in formalin for use in hematoxylin and eosin staining. Furthermore, whole blood was collected into citrate tubes through means of cardiac puncture. The blood was centrifuged at 1000 x g for 10 minutes, using a Labnet Prism Microcentrifuge, to obtain plasma which was aliquoted and stored at -80°C for use in a milliplex assay. The tumor growth and survival curves are shown in Supplementary Figure S1.
Western blot
Breast tumors were harvested, snap frozen in liquid nitrogen and stored at -80°C for use in western blot analysis. Tumor samples were cut into smaller pieces and incubated in modified radioimmunoprecipitation assay (RIPA) buffer with protease inhibitor cocktail. The samples were homogenized (Fisher Scientific) and were incubated on ice for 2 hours, where after the tumor lysates were centrifuged. The supernatant containing extracted protein from tumors and protein lysates from cell culture was quantified with a standard Bradford assay to determine total protein concentration, after which the samples were mixed with Laemmli’s sample buffer. Gel electrophoresis was performed to separate protein samples on 12% TGX FastCast gels (Bio-Rad, CA). Proteins were transferred onto polyvinylidene difluoride (PVDF) membranes and were blocked in 5% fat free milk, or in 5% bovine serum albumin for phosphorylated proteins, for 1 hour and subsequently incubated in primary antibodies overnight. The following primary antibodies were used: LC3-II (83506S; Cell Signalling Technology), SQSTM1/p62 (Sequestosome 1 [ab109012; Abcam]), MCM2 (ab108935; Abcam), Caspase 3 (ab184787; Abcam), PARP (ab191217; Abcam), phospho-ERK (4370; Cell Signalling Technology), total ERK (ab184699; Abcam), phospho-Akt (4060; Cell Signalling Technology), total Akt (9272; Cell Signalling Technology), phospho-p38 (9211; Cell Signalling Technology) and total p38 (9212; Cell Signalling Technology). The membranes were incubated in either anti-rabbit (7074S; Cell Signalling Technology) or anti-mouse secondary antibody (7076S; Cell Signalling Technology) for 60 minutes the following day. The membranes were developed with clarity ECL (Bio-Rad) and imaged on the ChemiDocTM MP System (Bio-Rad). Analyses were performed with Image Lab Software (Bio-Rad), using the total protein content of each membrane and a standard protein sample for normalization.
Milliplex cytokine analyses
Plasma concentrations of the pro-inflammatory cytokines, IL-1β, IL-6, MCP-1 and TNF-α and the anti-inflammatory cytokine IL-10 was assessed by means of Milliplex assay. This assay was performed per manufacturer’s instructions and was detected by Luminex. The plasma samples were diluted with the kit constituent. Diluted samples were then loaded onto the Milliplex MAP Mouse cytokine/chemokine magnetic bead panel (MCYTOMAG-70K, Merck) plate, alongside standard curve samples. The beads were identified with flow cytometry and the results were quantified based on the florescent reporter signals.
Histology, immunohistochemistry and image analysis
The formalin fixed tumor samples were processed using the Leica HistoCORE PEARL automated tissue processor, following a 20-hour pre-programmed time-schedule. The tumor samples were wax embedded using the Leica EG1150H tissue embedder. The samples were sectioned into 3 μm sections and were used for hematoxylin and eosin staining (H&E) to assess tissue morphology. Images were acquired on an ImageXpress® Pico (Molecular Devices) and CellReporterXpress® software (Molecular devices) and whole-slide acquisition was performed using the 4X objective.
Statistical analyses
All data is represented as means ± SEM. Data was assessed for normality with the Shapiro-Wilk normality test. Statistical significance was determined with unpaired Student’s t-test, a one-way analysis of variance (ANOVA) with Bonferroni correction or a Kruskal-Wallis test. A value of p<0.05 was considered statistically significant. Analyses were performed with GraphPad Prism version 7 (San Diego, CA).
Results
The overexpression of SAA1 in vitro
The overexpression of SAA1 was confirmed with western blot analysis (Figures 1A, B), where little to no SAA1 expression was detected in cells transfected with the empty pcDNA3 control vector.
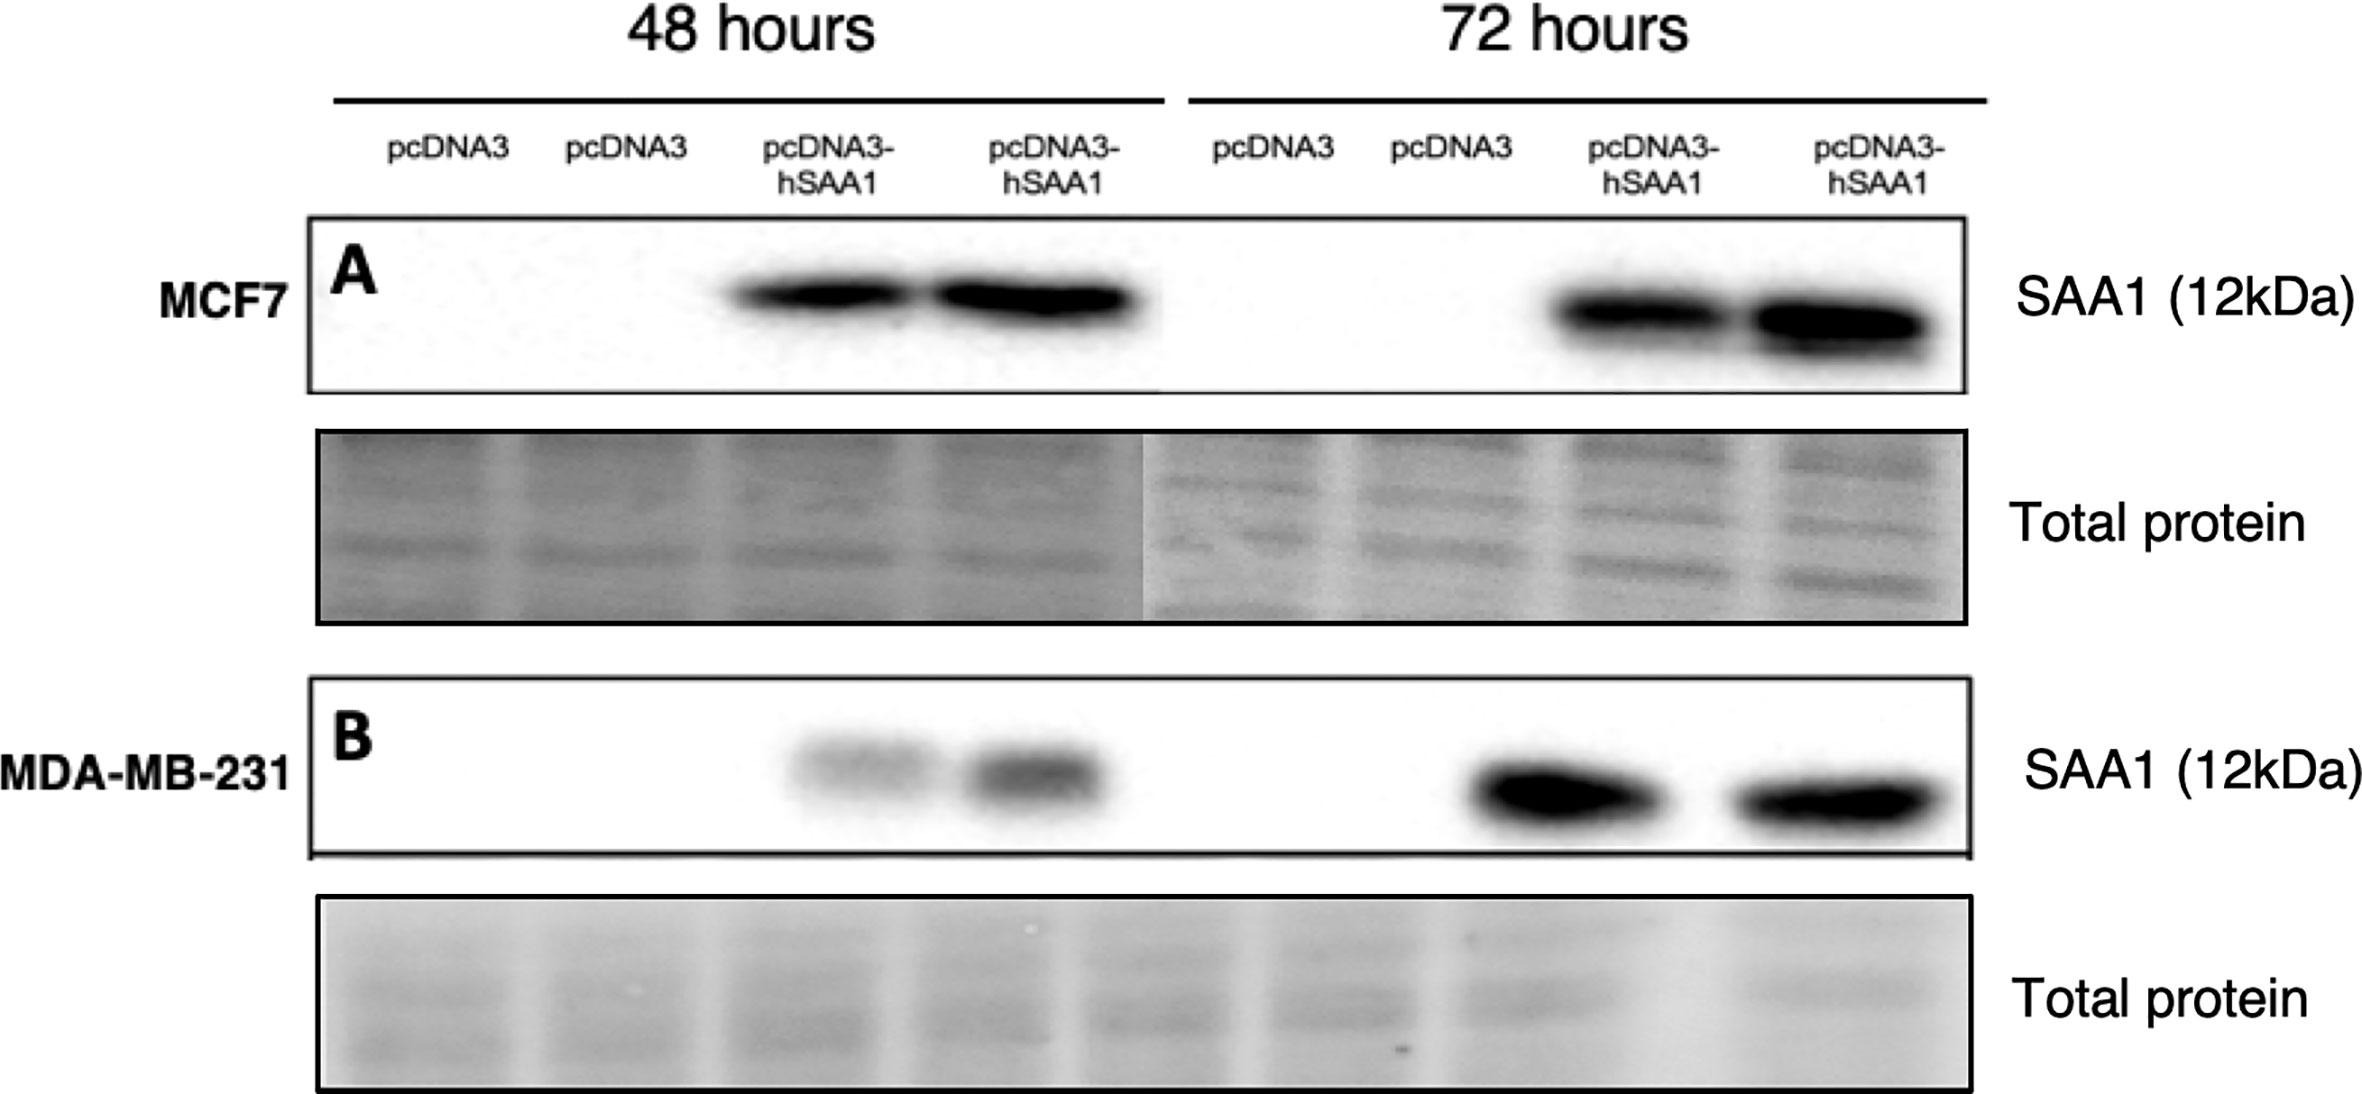
Figure 1 Representative western blot images confirming SAA1 overexpression in vitro. (A) SAA1 overexpression for 48 and 72 hours in the MCF7 cell line. (B) SAA1 overexpression for 48 and 72 hours in the MDA-MB-231 cell line.
SAA regulates MAPK and PI3K signaling pathway activation in vitro and in vivo
The overexpression of SAA1 did not influence the activation of the MAPK, p38, in the MCF7 cell line (Figure 2A). However, SAA1 overexpression with autophagy inhibition increased the activation of p38 following 72 hours in the MDA-MB-231 cell line (Figure 2B). Furthermore, the knockout of SAA1/2 in vivo did not influence the activation of p38 in SAA1/2 double-knockout (SAADKO) tumors when compared to the wild-type (WT) tumors (Figure 2C). The overexpression of SAA1 increased the activation of ERK1/2 significantly in the triple-negative breast cancer cell line, MDA-MB-231, following 72-hour transfections (Figure 3B). No changes in the activation of ERK1/2 were observed in tumors from SAADKO mice (Figure 3C). However, the inhibition of autophagy significantly increased the activation of ERK1/2 when comparing to the SAADKO and WT tumor groups (Figures 3A–C). Interestingly, the overexpression of SAA1, as well as autophagy downregulation, significantly decreased the activation of Akt in the MCF7 cells. The knockout of SAA1/2 in vivo significantly decreased the activation of Akt when compared to the WT group. Lastly, the inhibition of autophagy in the SAADKO tumors significantly decreased the activation of Akt when compared to the WT control, however, this change was not significant when compared to the untreated SAADKO group (Figures 4A–C).
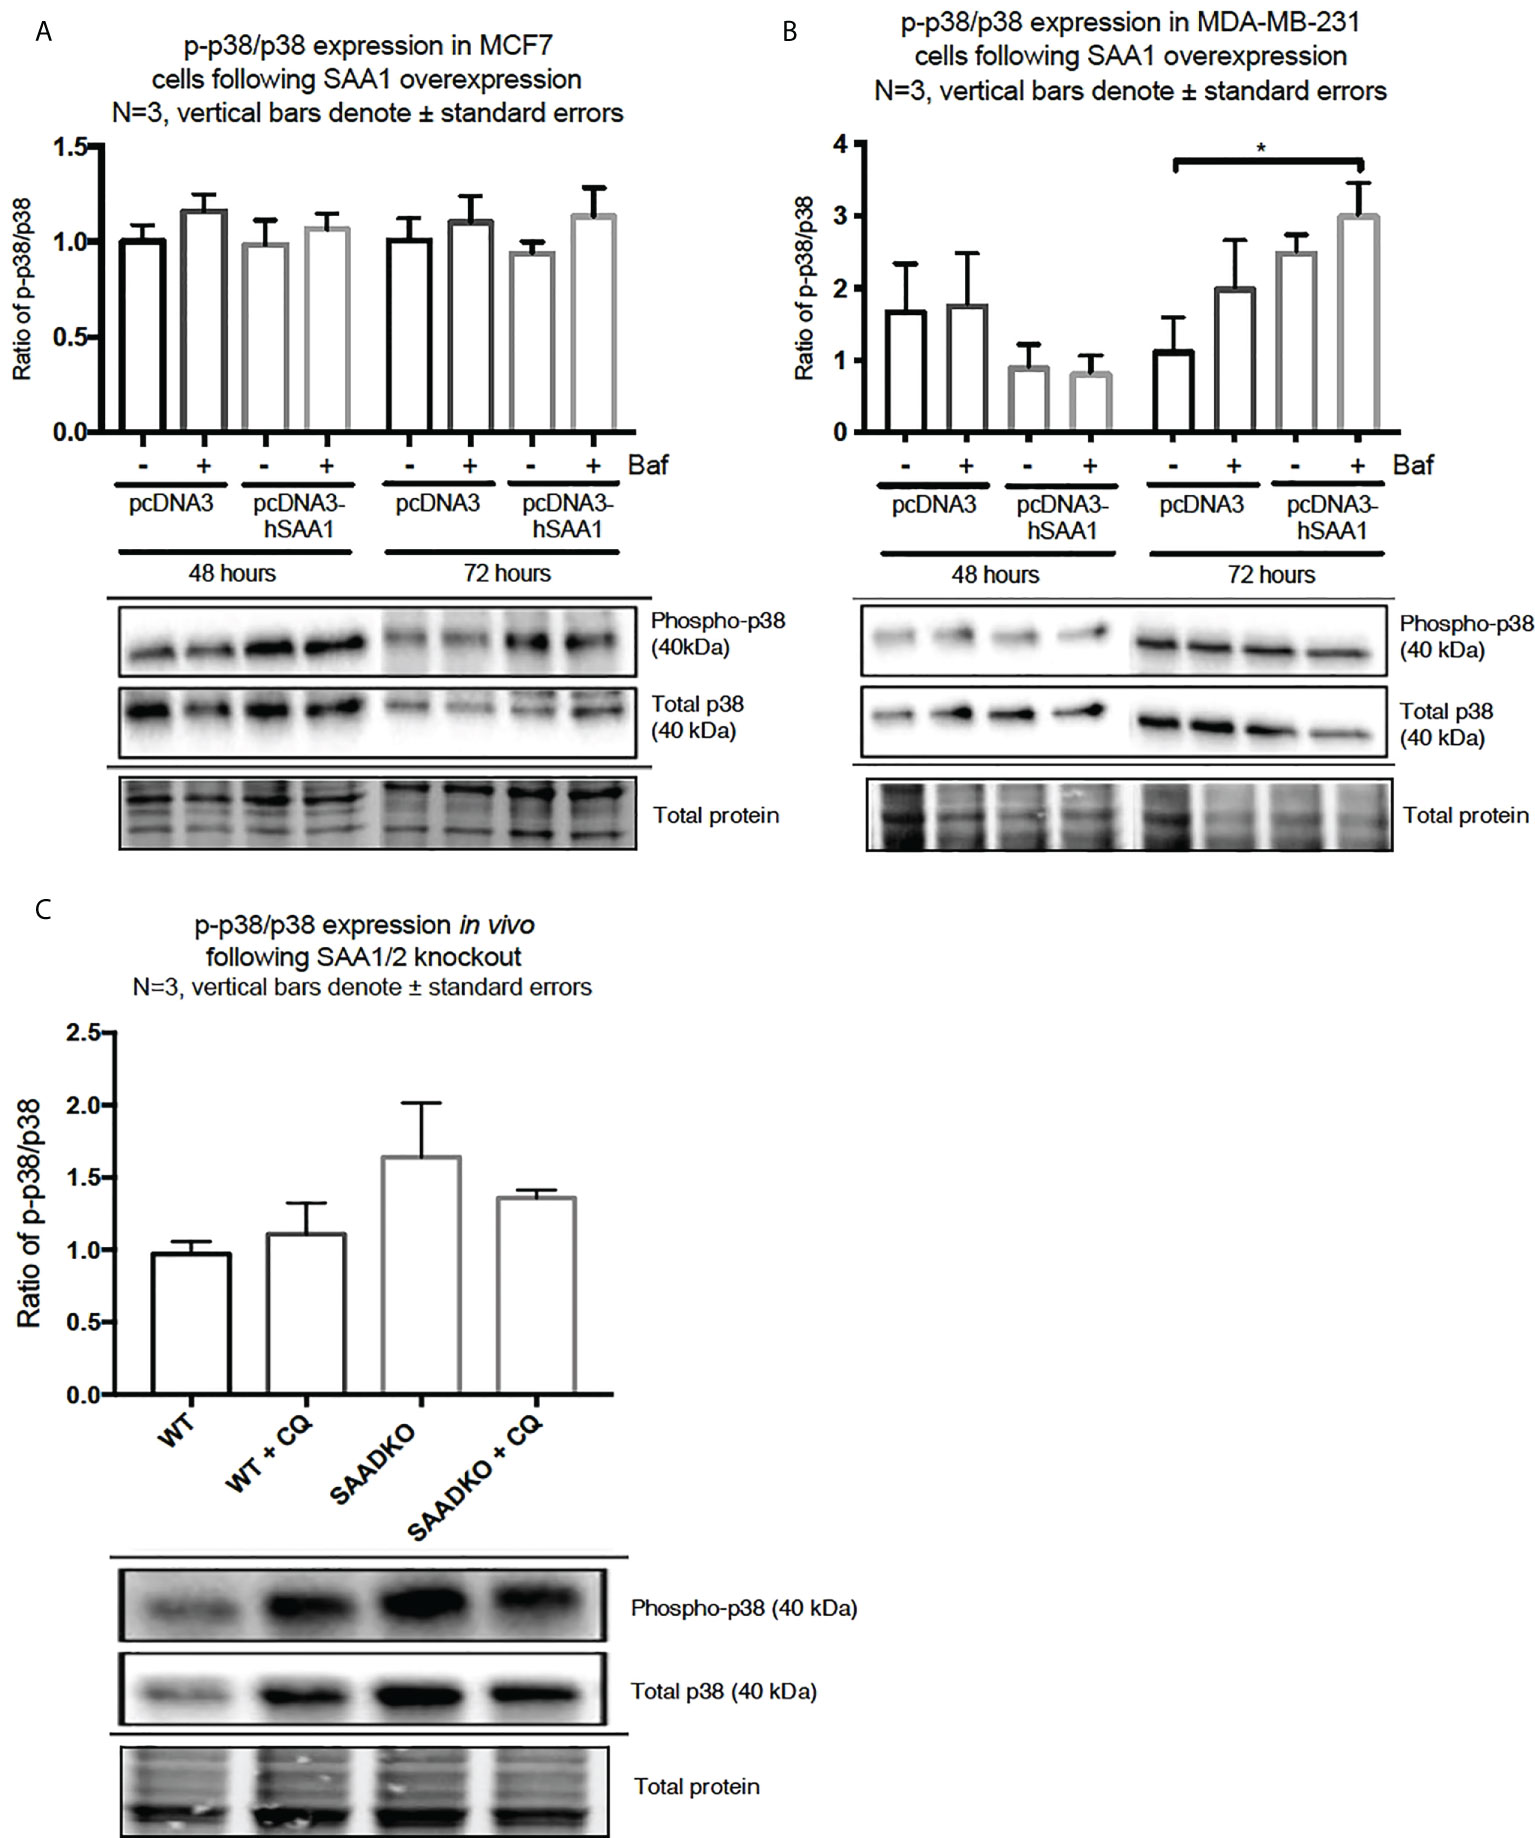
Figure 2 The activation of the p38 MAPK signaling pathway following SAA1 overexpression in human breast cancer cells, or in tumors from WT and SAADKO mice, as indicated by western blot analysis. (A) The activation of p38 following SAA1 overexpression for 48 and 72 hours in MCF7 cells. (B) The activation of p38 following SAA1 overexpression for 48 and 72 hours in MDA-MB-231 cells. (C) The activation of p38 in vivo. *p < 0.05.
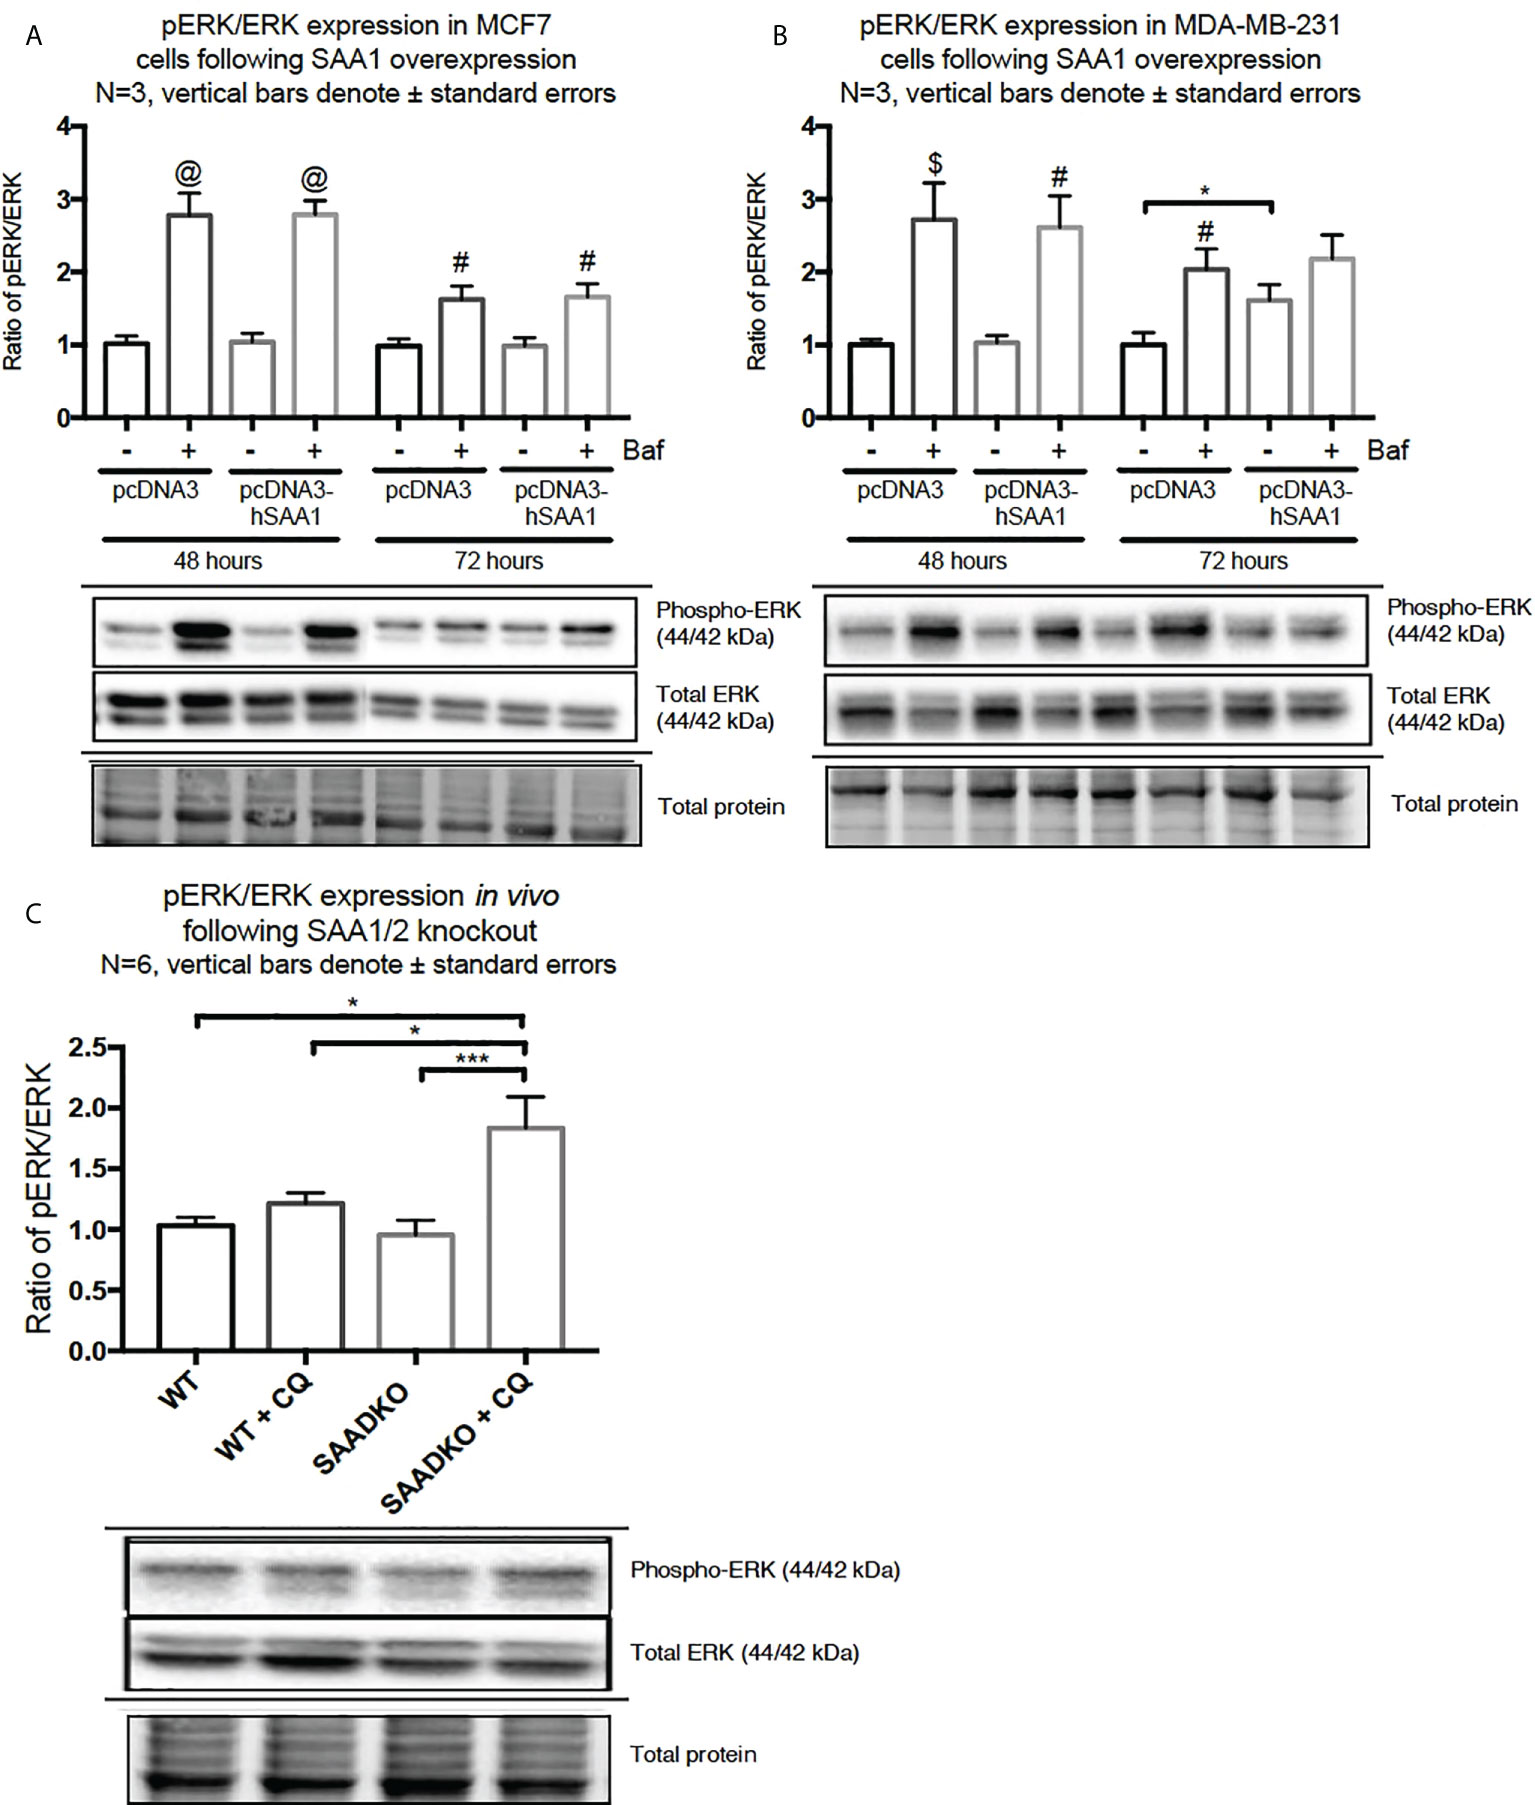
Figure 3 The activation of the ERK1/2 MAPK signaling pathway following SAA1 overexpression in human breast cancer cells, or in tumors from WT and SAADKO mice, as indicated by western blot analysis. (A) The activation of ERK1/2 following SAA1 overexpression for 48 and 72 hours in MCF7 cells. (B) The activation of ERK1/2 following SAA1 overexpression for 48 and 72 hours in MDA-MB-231 cells. (C) The activation of ERK1/2 in vivo. *p < 0.05, ***p < 0.001 when compared to the control groups. # Indicates p < 0.05, & indicates p < 0.01 and @ indicates p < 0. 0001 when comparing a group with its respective Baf treated group.
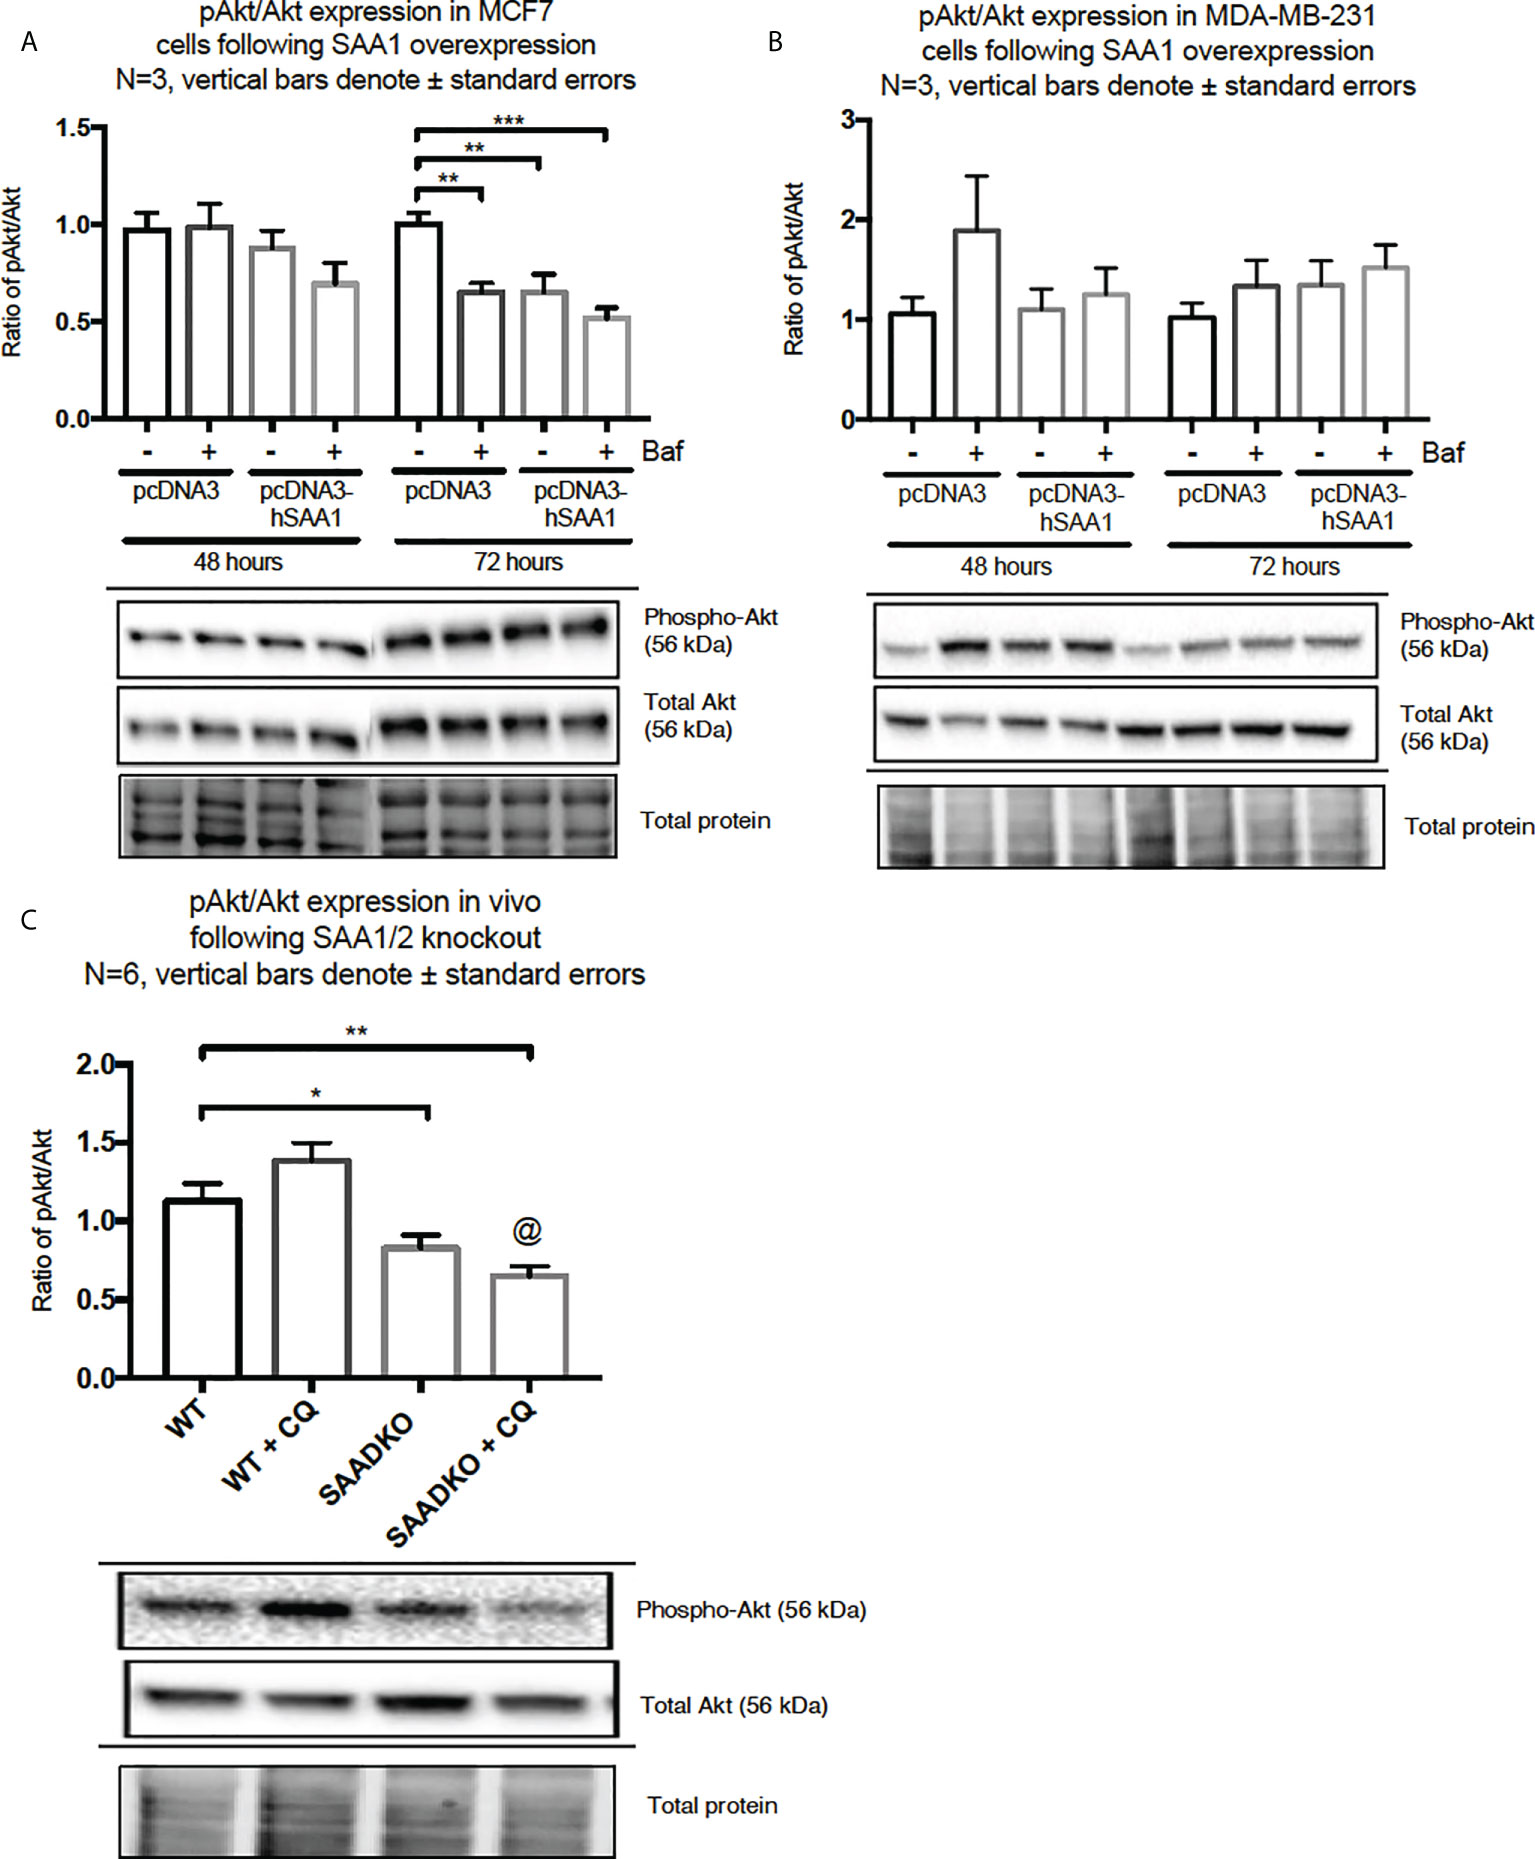
Figure 4 The activation of the Akt signaling pathway following SAA1 overexpression in human breast cancer cells, or in tumors from WT and SAADKO mice, as indicated by western blot analysis. (A) The activation of Akt/PKB following SAA overexpression for 48 and 72 hours in MCF7 cells. (B) The activation of Akt/PKB following SAA overexpression for 48 and 72 hours in MDA-MB-231 cells. (C) The activation of Akt/PKB in vivo. *p < 0.05, **p < 0.01, ***p < 0.001 when compared to the control groups. @ Indicates p < 0.0001 when comparing the WT+CQ and SAADKO+CQ groups.
Serum amyloid A regulates autophagy
Western blot and immunocytochemistry experiments were performed to assess whether SAA regulates autophagy in vitro and in vivo (Figures 5–8). SAA1 overexpression in the MCF7 cell line downregulated autophagy following 48 and 72 hours as indicated by immunofluorescence (Figure 6), while western blot analyses showed that autophagy was downregulated following SAA1 overexpression for 72 hours (Figure 5A). Autophagy was significantly downregulated following SAA1 overexpression in the MDA-MB-231 cell line for 72 hours indicated by western blot analysis (Figure 5B). Furthermore, immunofluorescence results showed that the overexpression of SAA1 downregulated autophagy following 48 and 72 hours in the MDA-MB-231 (Figure 7). Knockout of SAA1/2 in vivo resulted in a significant increase in the accumulation of LC3-II positive autophagosomes in tumors when compared to the WT control (Figure 5C).
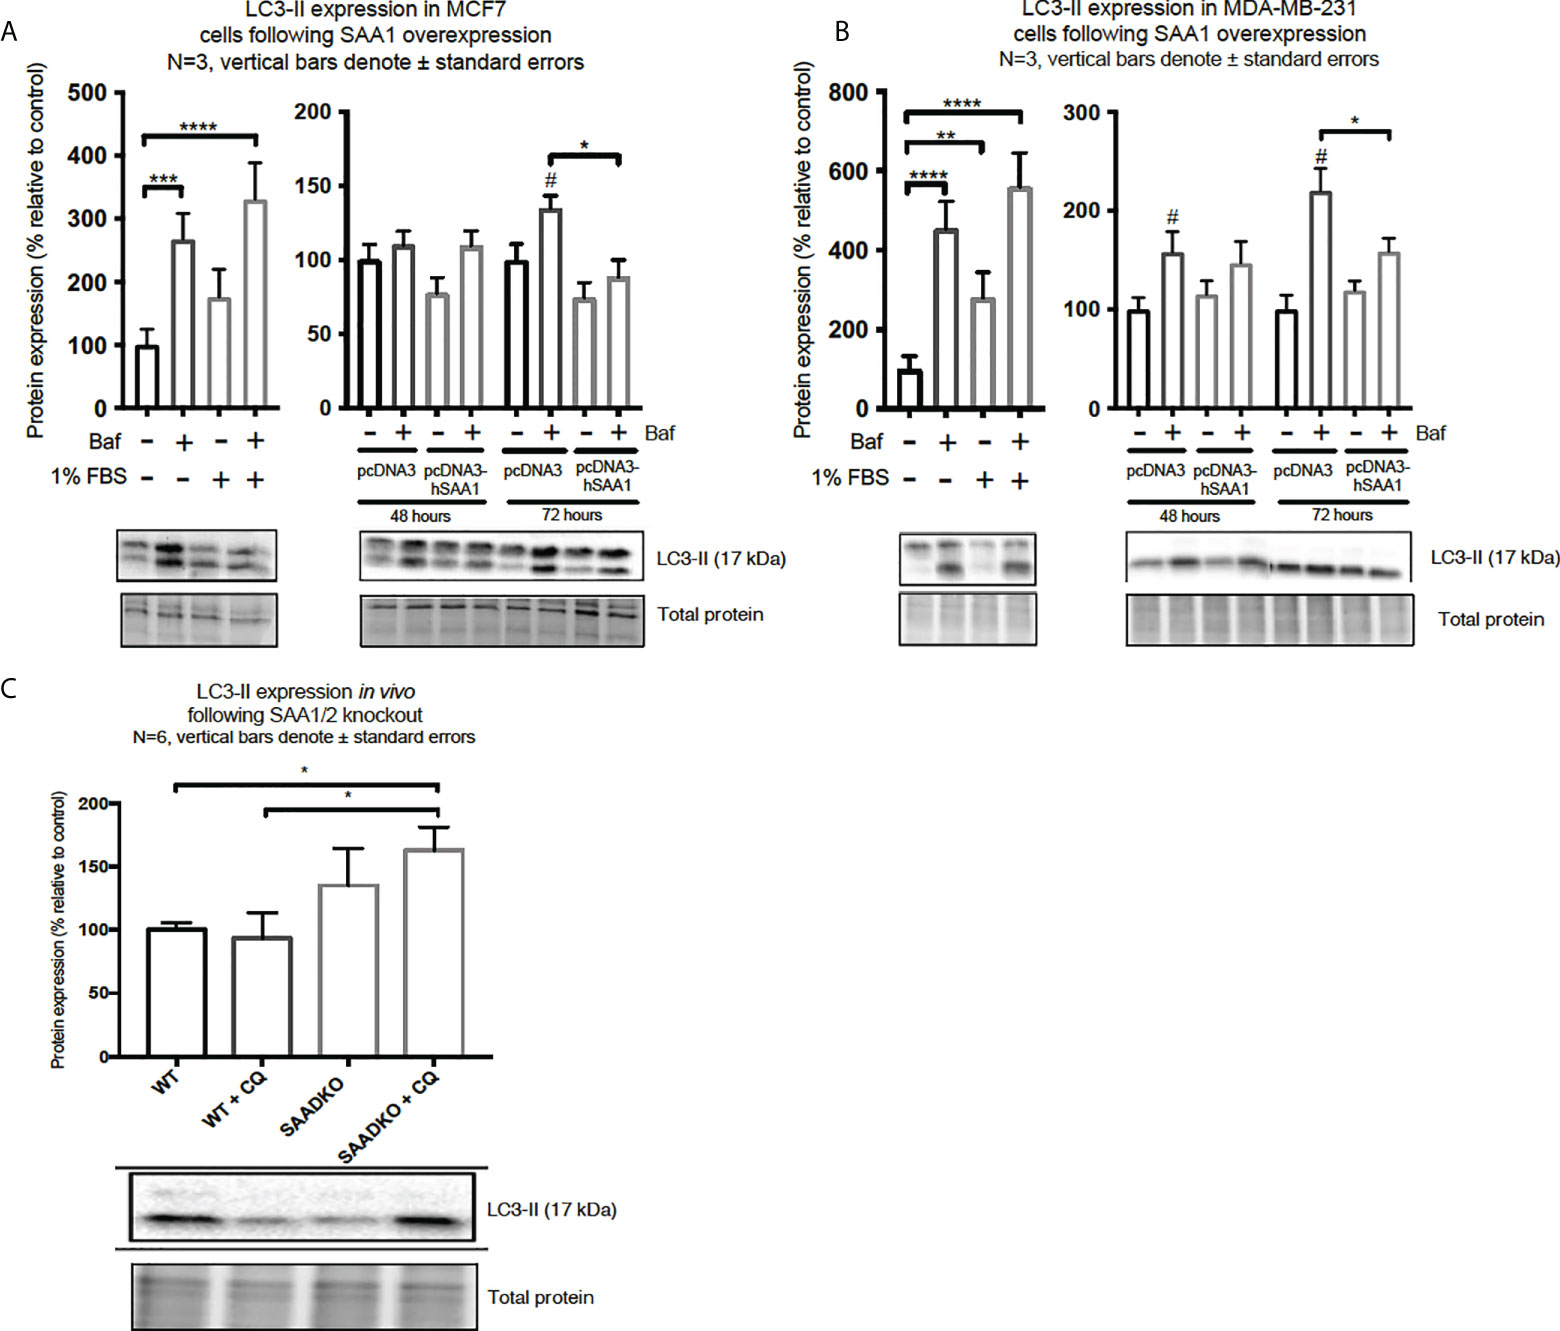
Figure 5 The expression of the autophagy marker, LC3-II, following SAA1 overexpression in human breast cancer cells, or in tumors from WT and SAADKO mice, as indicated by western blot analysis. (A) LC3-II expression following SAA1 overexpression for 48 and 72 hours in MCF7 cells. (B) LC3-II expression following SAA1 overexpression for 48 and 72 hours in MDA-MB-231 cells. (C) LC3-II expression in vivo. *p < 0.05, **p < 0.01, ***p < 0.001, ****p < 0.001 when compared to the control groups. # Indicates p < 0.05 when comparing a group with its respective Baf treated group.
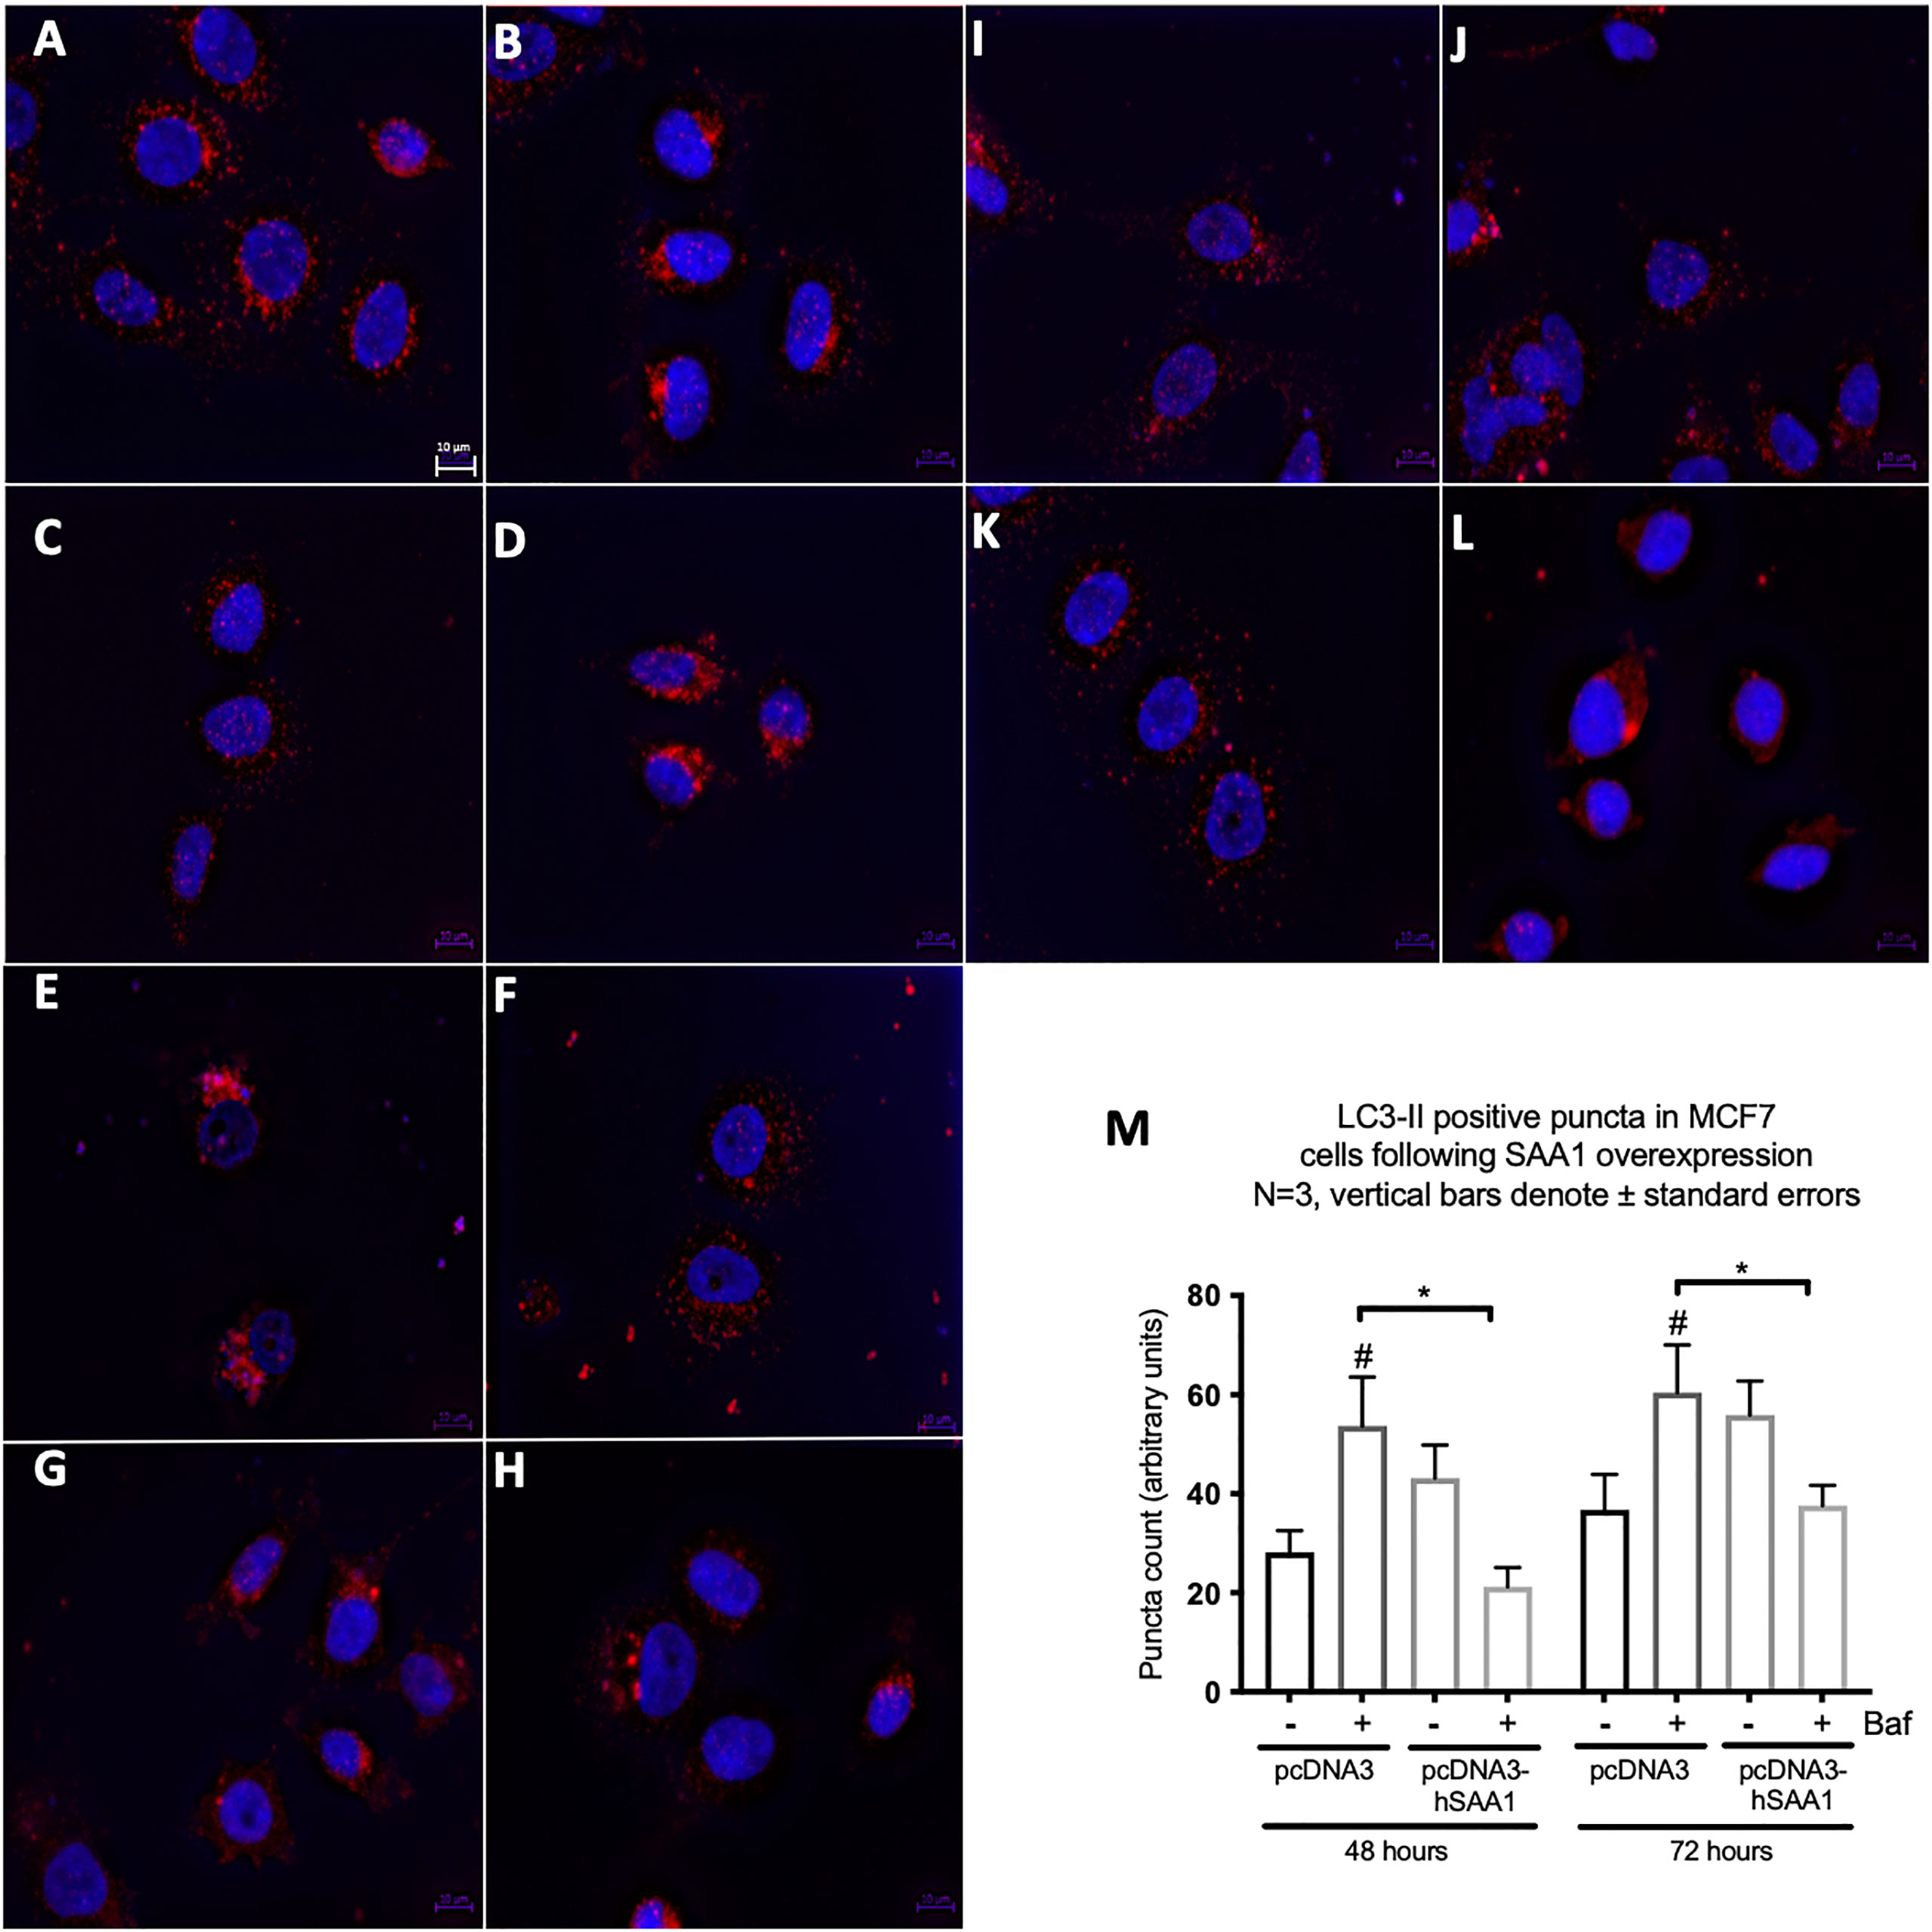
Figure 6 The expression of the autophagy marker, LC3-II, following SAA1 overexpression in the MCF7 cell line indicated by immunofluorescence and represented as mean fluorescent intensity. (A) Control. (B) 200 nM Bafilomycin for 6 hours. (C) 50 nM Rapamycin for 24 hours. (D) 200 nM Bafilomycin with 50 nM Rapamycin. (E) pcDNA for 48 hours. (F) pcDNA with Bafilomycin for 48 hours. (G) SAA1 overexpression for 48 hours. (H) SAA1 overexpression with Bafilomycin for 48 hours. (I) pcDNA3 for 72 hours. (J) pcDNA3 with Bafilomycin for 72 hours. (K) SAA1 overexpression for 72 hours. (L) SAA1 overexpression with Bafilomycin for 72 hours. (M) Mean fluorescent intensity of LC3-II following SAA overexpression for 48 and 72 hours. *p < 0.05, # Indicates p < 0.05 when comparing a group with its respective Baf treated group.
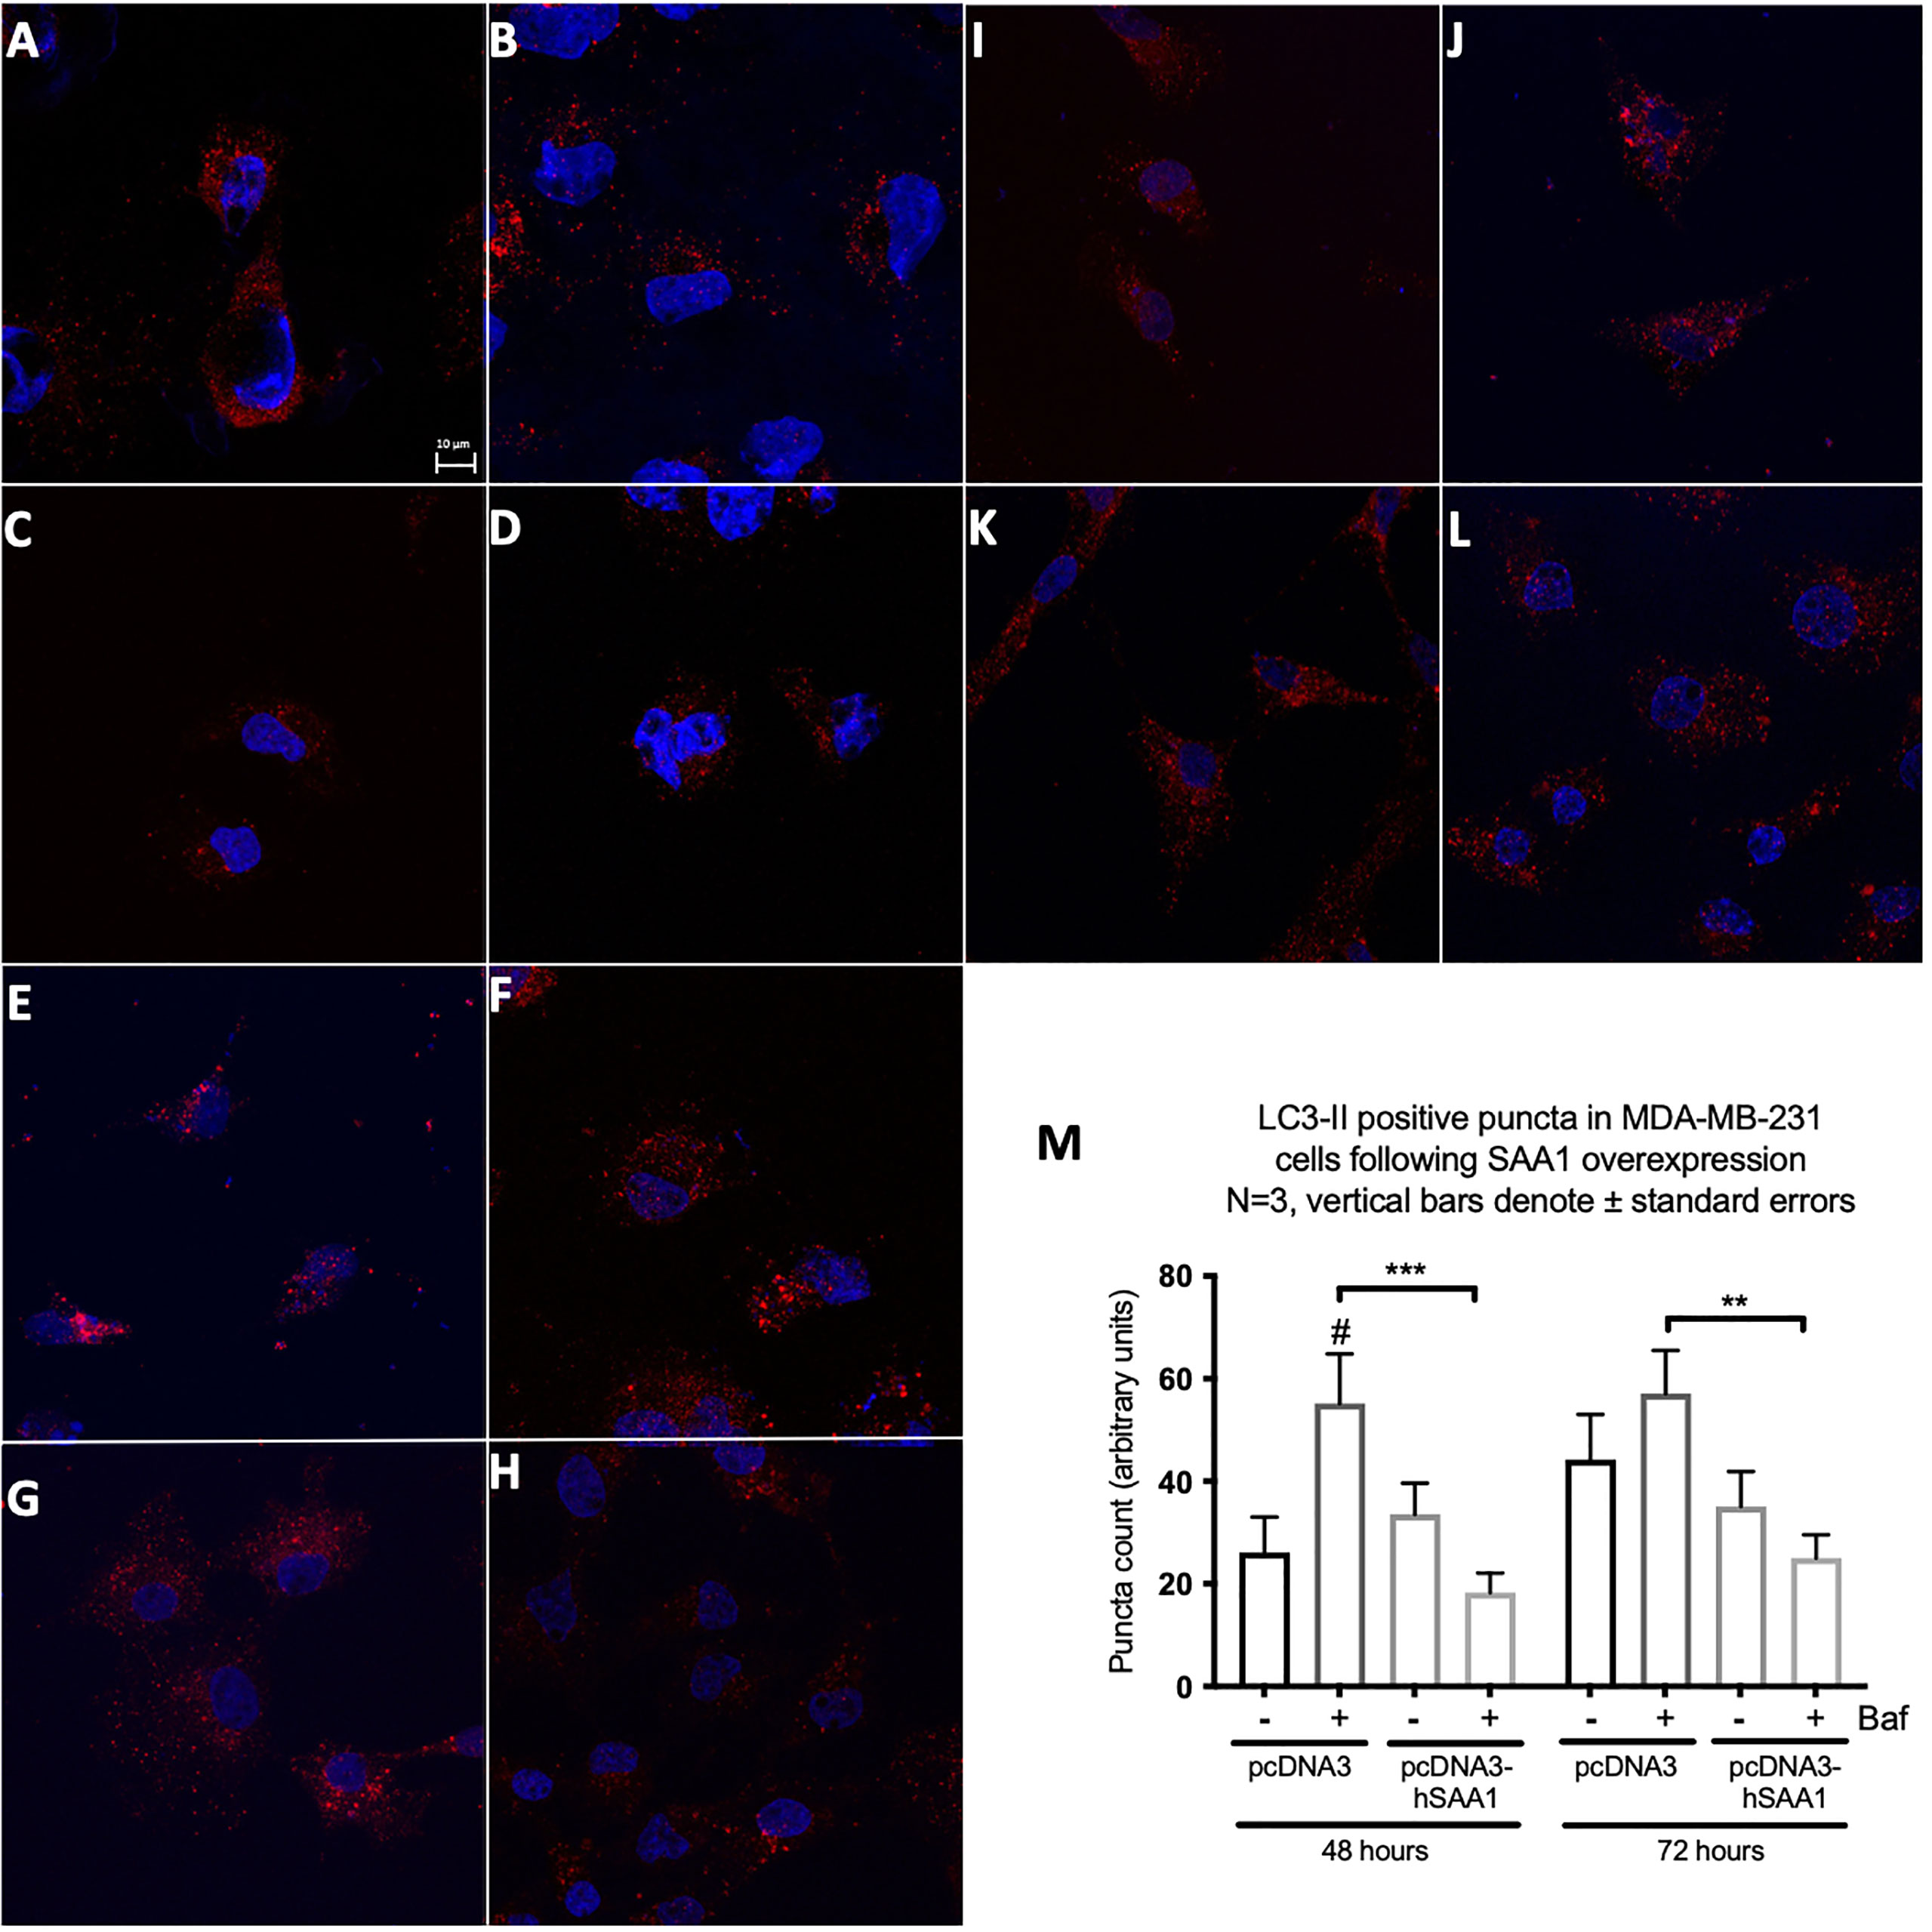
Figure 7 The expression of the autophagy marker, LC3-II, following SAA overexpression in the MDA-MB-231 cell line indicated by immunofluorescence and represented as mean fluorescent intensity. (A) Control. (B) 400 nM Bafilomycin for 4 hours. (C) 1% FBS for 8 hours. (D) 400 nM Bafilomycin with 1% FBS. (E) pcDNA for 48 hours. (F) pcDNA with Bafilomycin for 48 hours. (G) SAA overexpression for 48 hours. (H) SAA overexpression with Bafilomycin for 48 hours. (I) pcDNA3 for 72 hours. (J) pcDNA3 with Bafilomycin for 72 hours. (K) SAA overexpression for 72 hours. (L) SAA overexpression with Bafilomycin for 72 hours. (M) Mean fluorescent intensity of LC3-II following SAA overexpression for 48 and 72 hours. ***p < 0.001, # Indicates p < 0.05 when comparing a group with its respective Baf treated group. **p < 0.01.
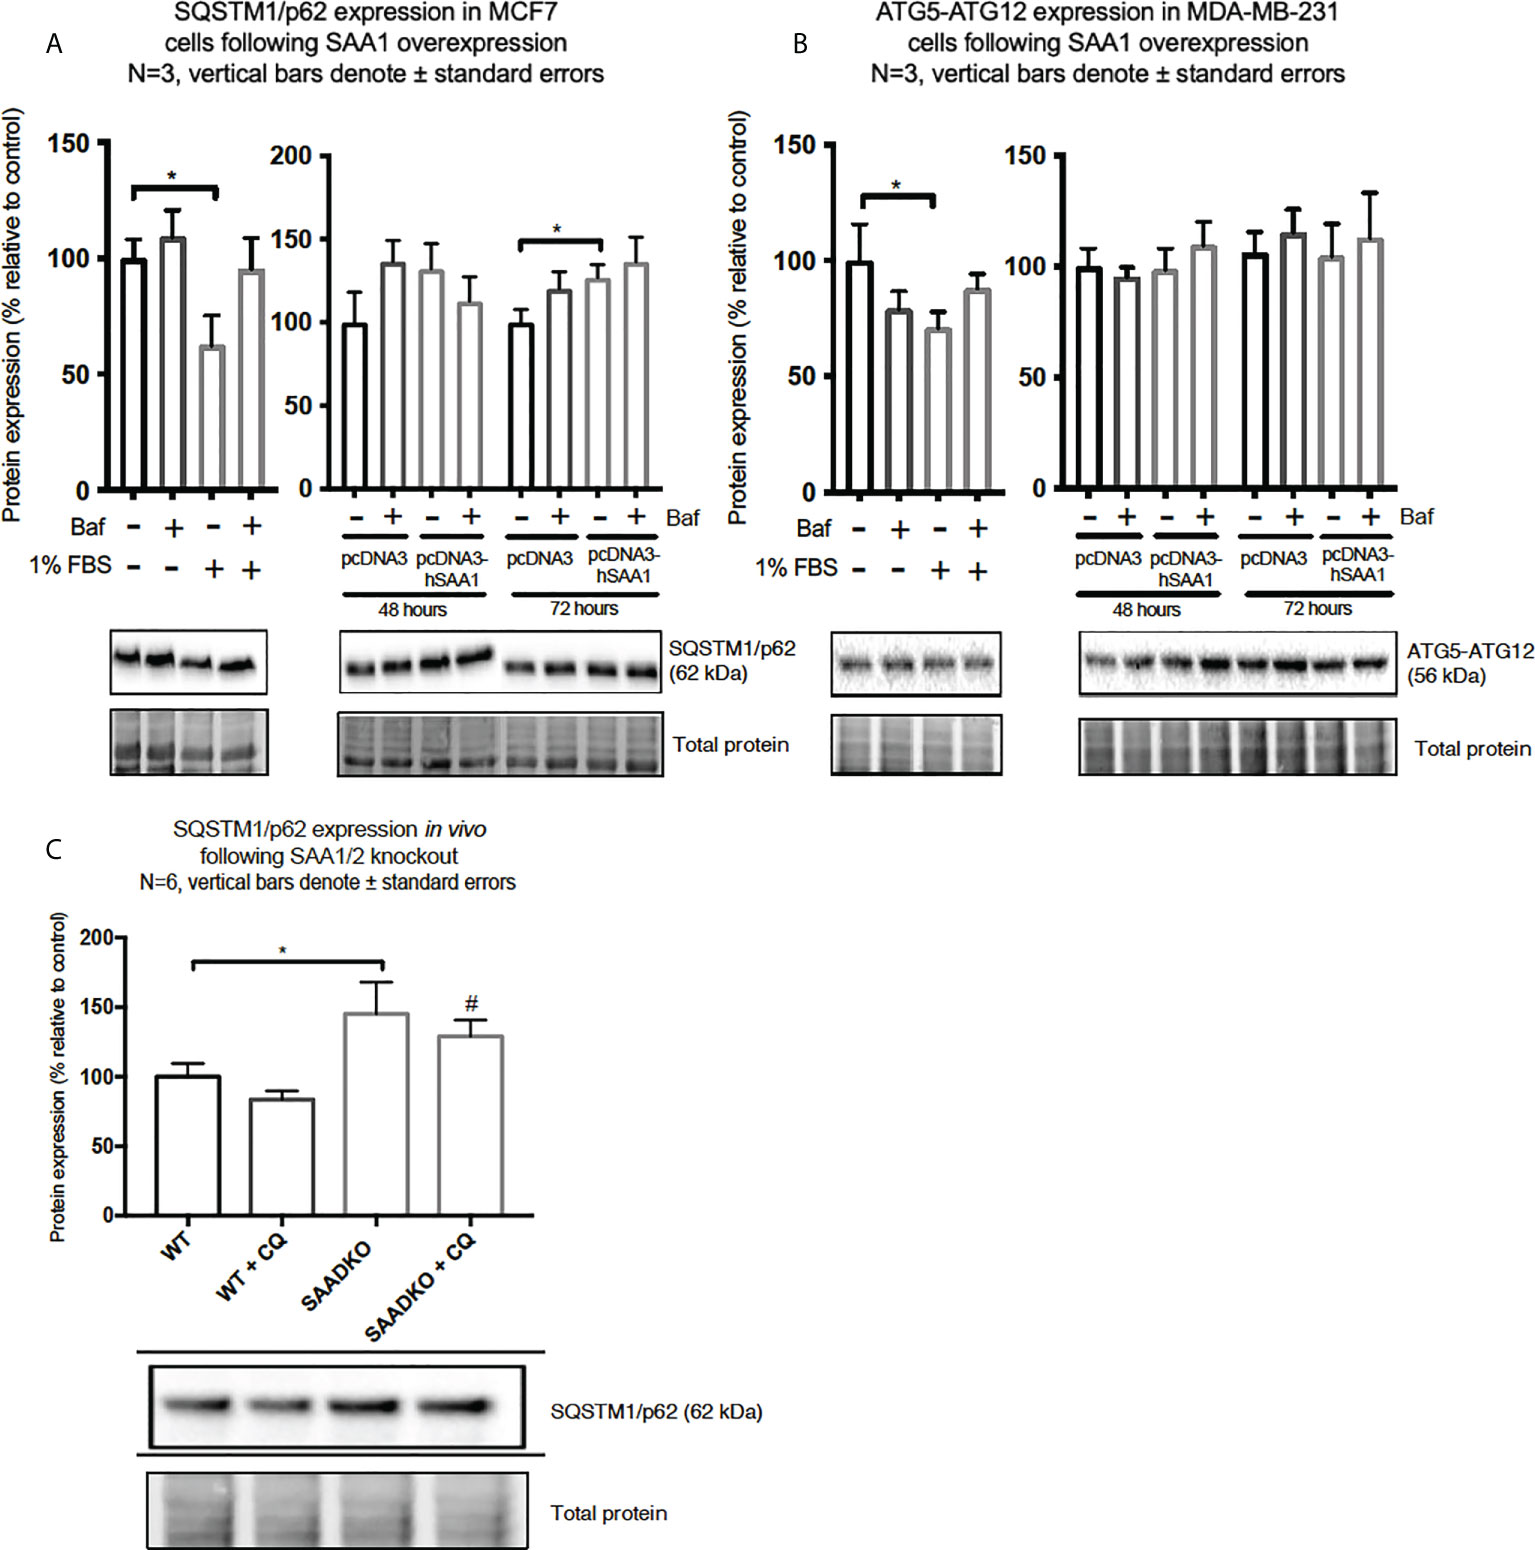
Figure 8 The expression of the autophagy markers, SQSTM1/p62 and ATG5-ATG12, following SAA1 overexpression in human breast cancer cells, or in tumors from WT and SAADKO mice, as indicated by western blot analysis. (A) SQSTM1/p62 expression following SAA overexpression for 48 and 72 hours in MCF7 cells. (B) ATG7-ATG12 expression following SAA overexpression for 48 and 72 hours in MDA-MB-231 cells. (C) SQSTM1/p62 expression in vivo. *p<0.05, # indicates p<0.05 when comparing the WT+CQ and SAADKO+CQ groups.
The expression of the cargo recruiter, SQSTM1/p62, was assessed to determine whether SAA influences autophagy in breast cancer cells (Figures 8A–C). The expression of SQSTM1/p62 was significantly increased following 72-hour SAA1 overexpression in the MCF7 cells (Figure 8A). However, no expression of SQSTM1/p62 was detected for the MDA-MB-231 cell line, therefore western blot experiments was performed to assess the autophagy machinery component, conjugated ATG5-ATG12 (Figure 8B). No significant changes were observed for ATG5-ATG12 in the MDA-MB-231 cell line. Knockout of SAA1/2 in vivo resulted in a significant increase in the accumulation of LC3-II positive autophagosomes in tumors when compared to the WT control (Figure 8C). Furthermore, the knockout of SAA1/2 resulted in a significant increase in the cargo recruiter, SQSTM1/p62, in tumors when compared to the WT control. Additionally, a significant increase in SQSTM1/p62 levels were observed when comparing the CQ treated WT and SAADKO tumor groups.
SAA promotes proliferation in vitro
SAA1 overexpression increased cell viability in MCF7 cells following 48 hour and 72 hours (Figure 9A). Furthermore, autophagy inhibition significantly increased cell viability in the MCF7 cell line in the 48-hour control Baf-treated group and the 72-hour control Baf-treated group when compared to their respective controls (Figure 9A). When compared to the control groups, SAA1 overexpression increased cell viability in MDA-MB-231 cells following 48-hour transfections (Figure 9B).
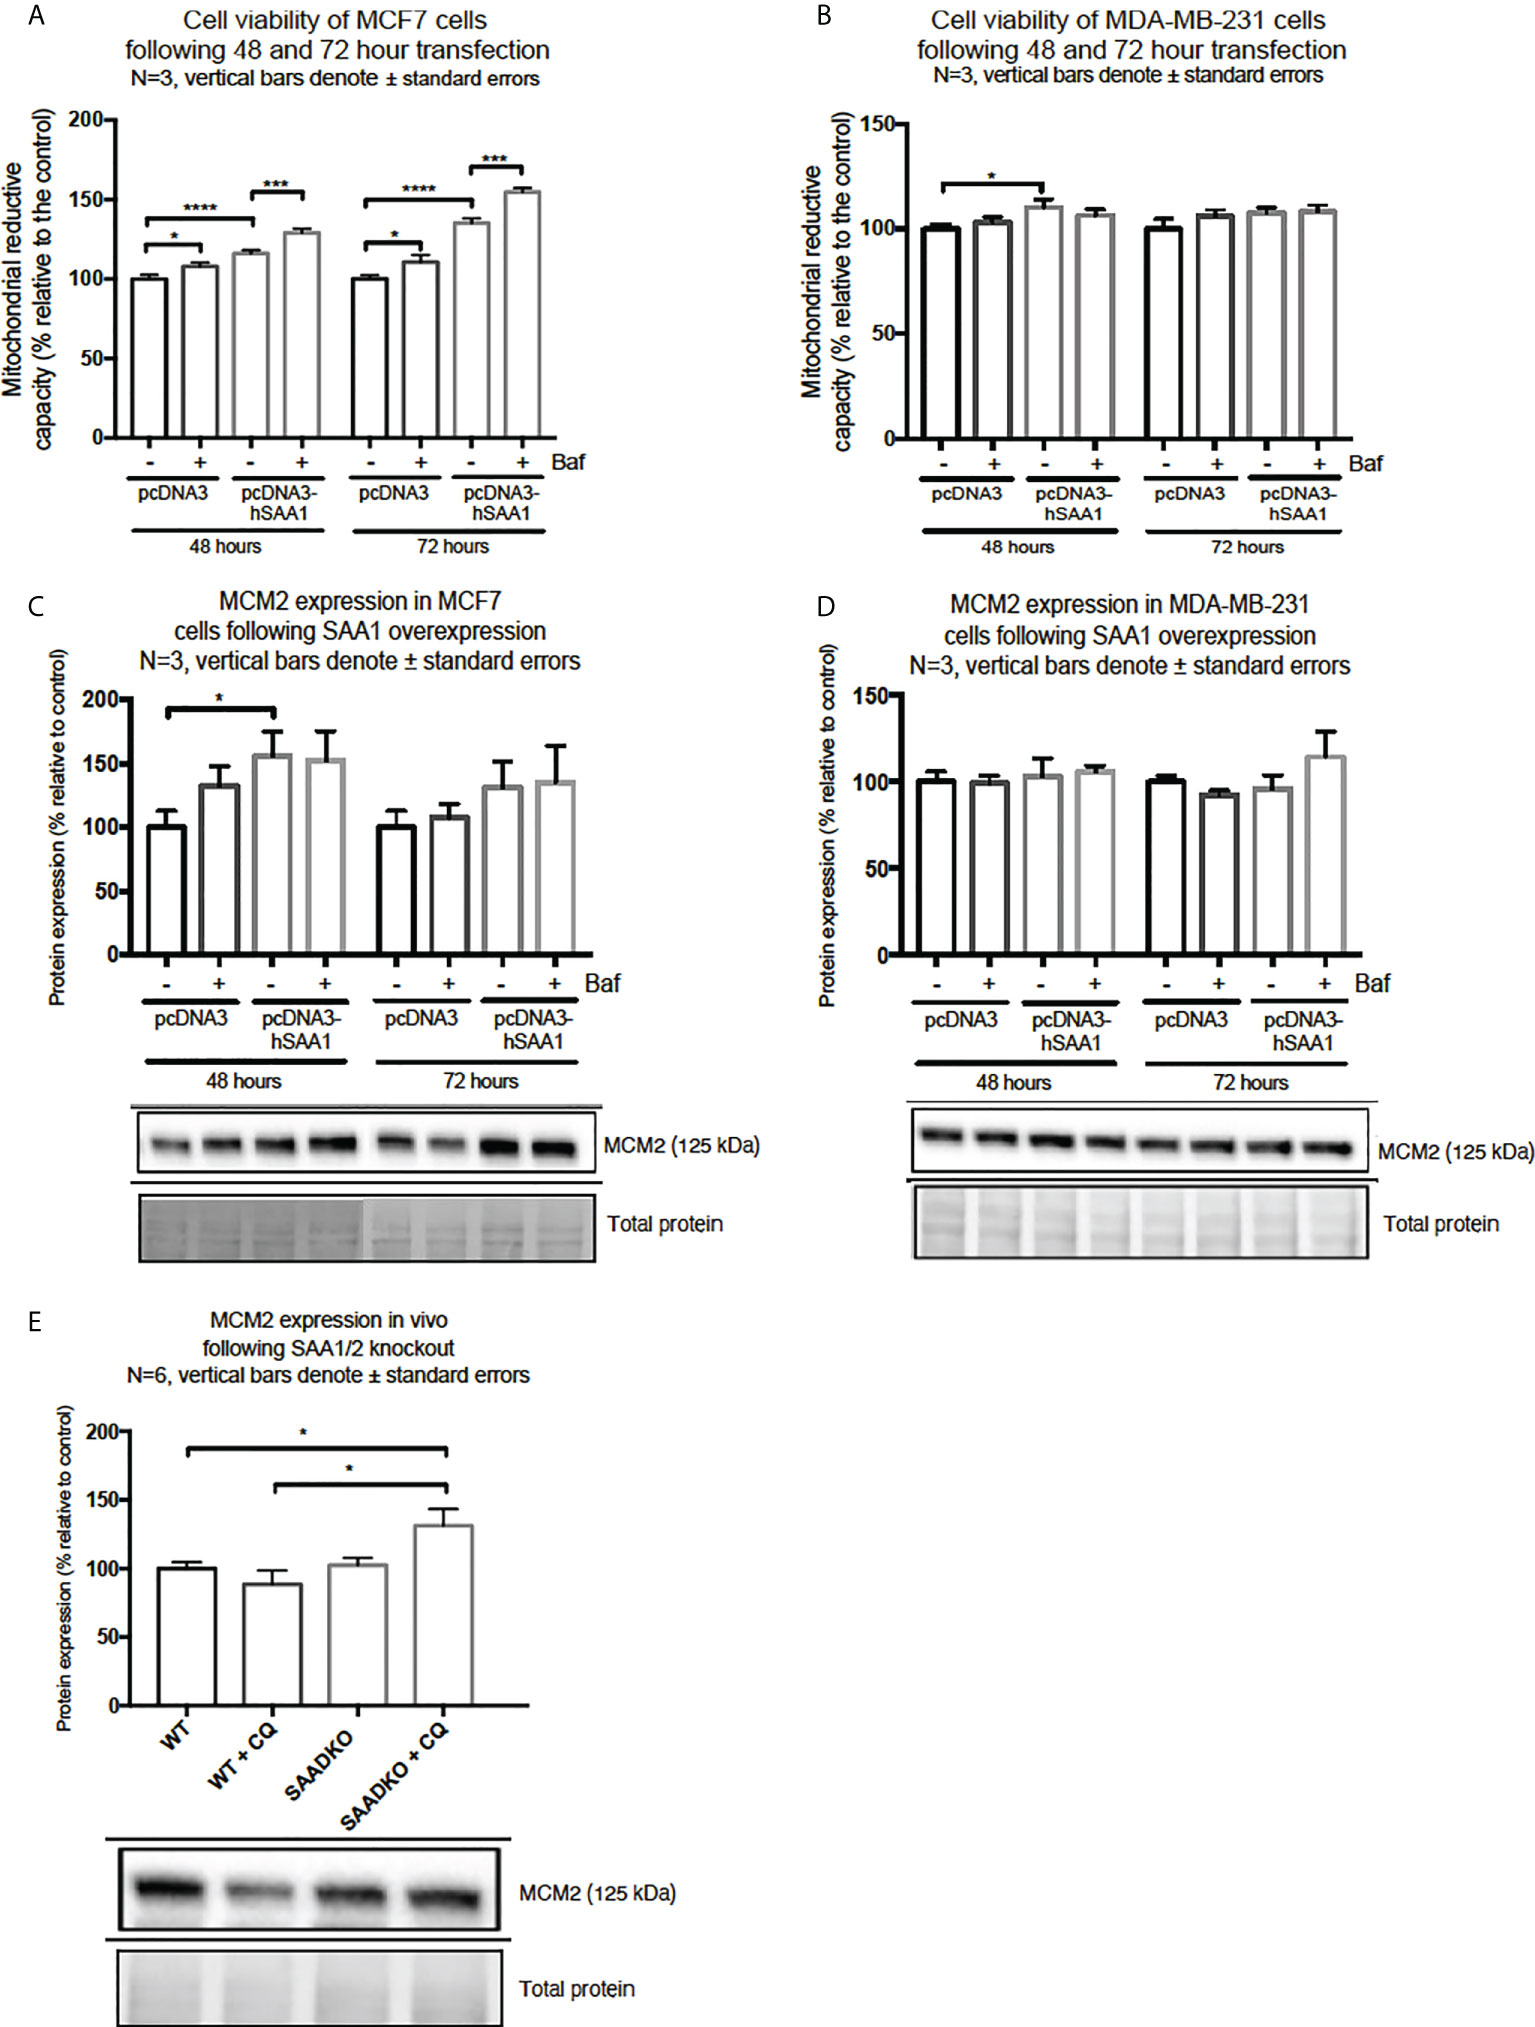
Figure 9 Cell viability and expression of the proliferation marker, MCM2, following SAA1 overexpression in human breast cancer cells, or in tumors from WT and SAADKO mice, as indicated by western blot analysis. (A) Cell viability following SAA overexpression for 48 and 72 hours in MCF7 cells. (B) Cell viability expression following SAA overexpression for 48 and 72 hours in MDA-MB-231 cells. (C) MCM2 expression following SAA overexpression for 48 and 72 hours in MCF7 cells. (D) MCM2 expression following SAA overexpression for 48 and 72 hours in MDA-MB-231 cells. (E) MCM2 expression in vivo. *p<0.05, ***p<0.001, ****p<0.0001.
Next, we investigated the expression of the proliferation marker, MCM2 (Figures 9C–E). SAA1 overexpression resulted in a significant increase in the proliferation marker MCM2 following 48-hour transfections in the MCF7 cell line (Figure 9C). Furthermore, the expression of MCM2 was significantly upregulated when autophagy was inhibited in the control and SAA1 overexpression groups in the MCF7 cell line. For the MDA-MB-231 cell line, no significant changes in MCM2 expression were observed (Figure 9D). Lastly, the proliferation marker MCM2 did not significantly change following double knock out of SAA1/2 in vivo, however, the inhibition of autophagy with CQ significantly increased the expression of MCM2 in the SAADKO group when compared to the untreated WT and SAADKO tumor groups (Figure 9E).
Double knockout of Saa1 and Saa2 protects against apoptosis in an autophagy-dependent manner in vivo
To assess whether double knockout of SAA1/2 can regulate apoptosis, we measured the expression levels of cleaved and total caspase 3 as well as cleaved and total PARP (Figures 10A, B). The ratio of cleaved caspase 3 to total caspase 3 was significantly decreased in the SAADKO group when compared to the WT control group, indicating that apoptosis was inhibited, which has been confirmed by other members of our group. However, the inhibition of autophagy with chloroquine significantly increased the cleaved caspase 3 to total caspase 3 ratio in the SAADKO group when compared to the untreated SAADKO group. Interestingly, the ratio of cleaved caspase 3 to total caspase 3 in the SAADKO with CQ group is increased to the same level of expression as the WT control (Figure 10A). The ratio of cleaved PARP to total PARP was significantly decreased in the SAADKO group when compared to the WT control group, indicating that apoptosis was inhibited (Figure 10B).
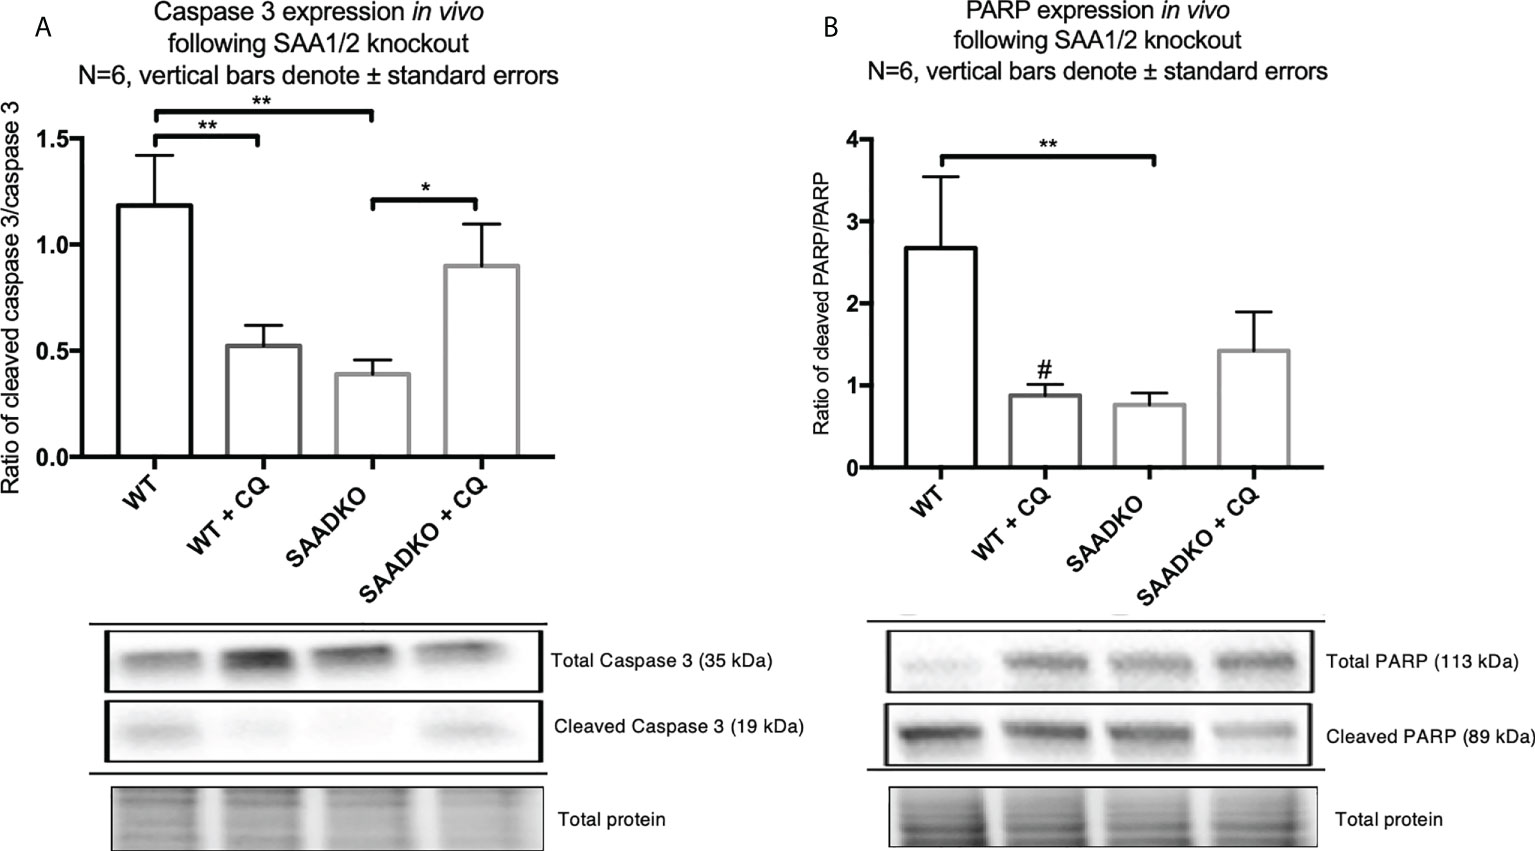
Figure 10 The expression of the apoptosis markers, caspase 3 and PARP, following double knockout of SAA1/2 overexpression indicated by western blot analysis. (A) Cleaved over total caspase 3 expression following double knockout of SAA1/2 in vivo. (B) Cleaved over total PARP expression following double knockout of SAA1/2 in vivo. *p<0.05, **p<0.01. # Indicates p<0.05 when comparing the WT and WT+CQ groups.
Double knockout of Saa1 and Saa2 mediates necrosis
The analysis of the tumor histology with hematoxylin and eosin stains showed that WT tumors had larger regions of tumor necrosis when compared to the SAADKO groups. Subsequently, SAADKO tumors showed larger areas of viable tissue (Figures 11A–E).
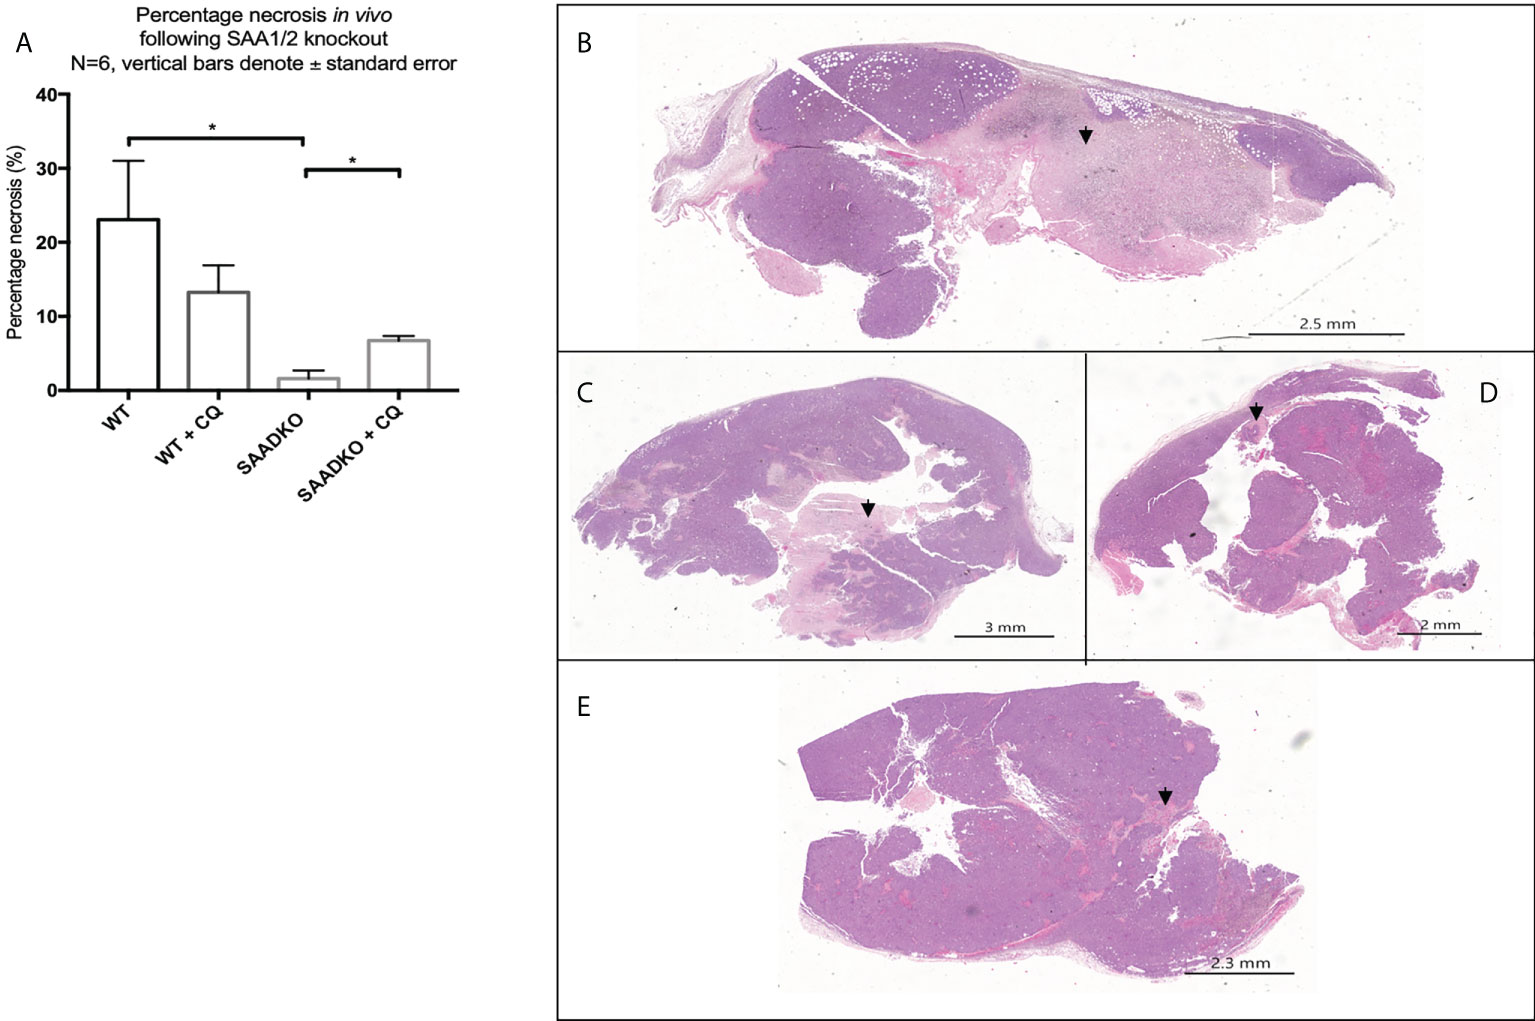
Figure 11 (A) The percentage necrosis following double knockout of SAA1/2 overexpression indicated by hematoxylin and eosin staining. Representative images for the Hematoxylin and Eosin staining to indicate necrosis. (B) Wild Type. (C) Wild type with chloroquine. (D) Double knockout of SAA1/2. (E) Double knockout of SAA1/2 with chloroquine. Arrows indicate areas of necrosis. *p<0.05.
Double knockout of Saa1 and Saa2 alters the cytokine profile in vivo
Next, we assessed whether the double knockout of SAA1/2 alters the expression of pro-inflammatory and anti-inflammatory cytokines in vivo (Figures 12A–F). The levels of anti-inflammatory, IL-10, and the pro-inflammatory, IL-1β and IL-6, was significantly decreased in the WT group following autophagy inhibition, in the SAADKO group and in the SAADKO group following autophagy inhibition when compared to the WT control. In contrast, the knockout of SAA1/2 significantly increased the blood plasma levels of the pro-inflammatory markers, MCP-1 and TNF-α when compared to the WT control. Autophagy inhibition in the WT group significantly increased plasma MCP-1 levels when compared to the WT control, while autophagy inhibition in the SAADKO group significantly decreased plasma MCP-1 levels in the SAADKO group when compared to untreated SAADKO group. Autophagy inhibition also significantly decreased TNF-α levels in the SAADKO group when compared to the untreated SAADKO group.
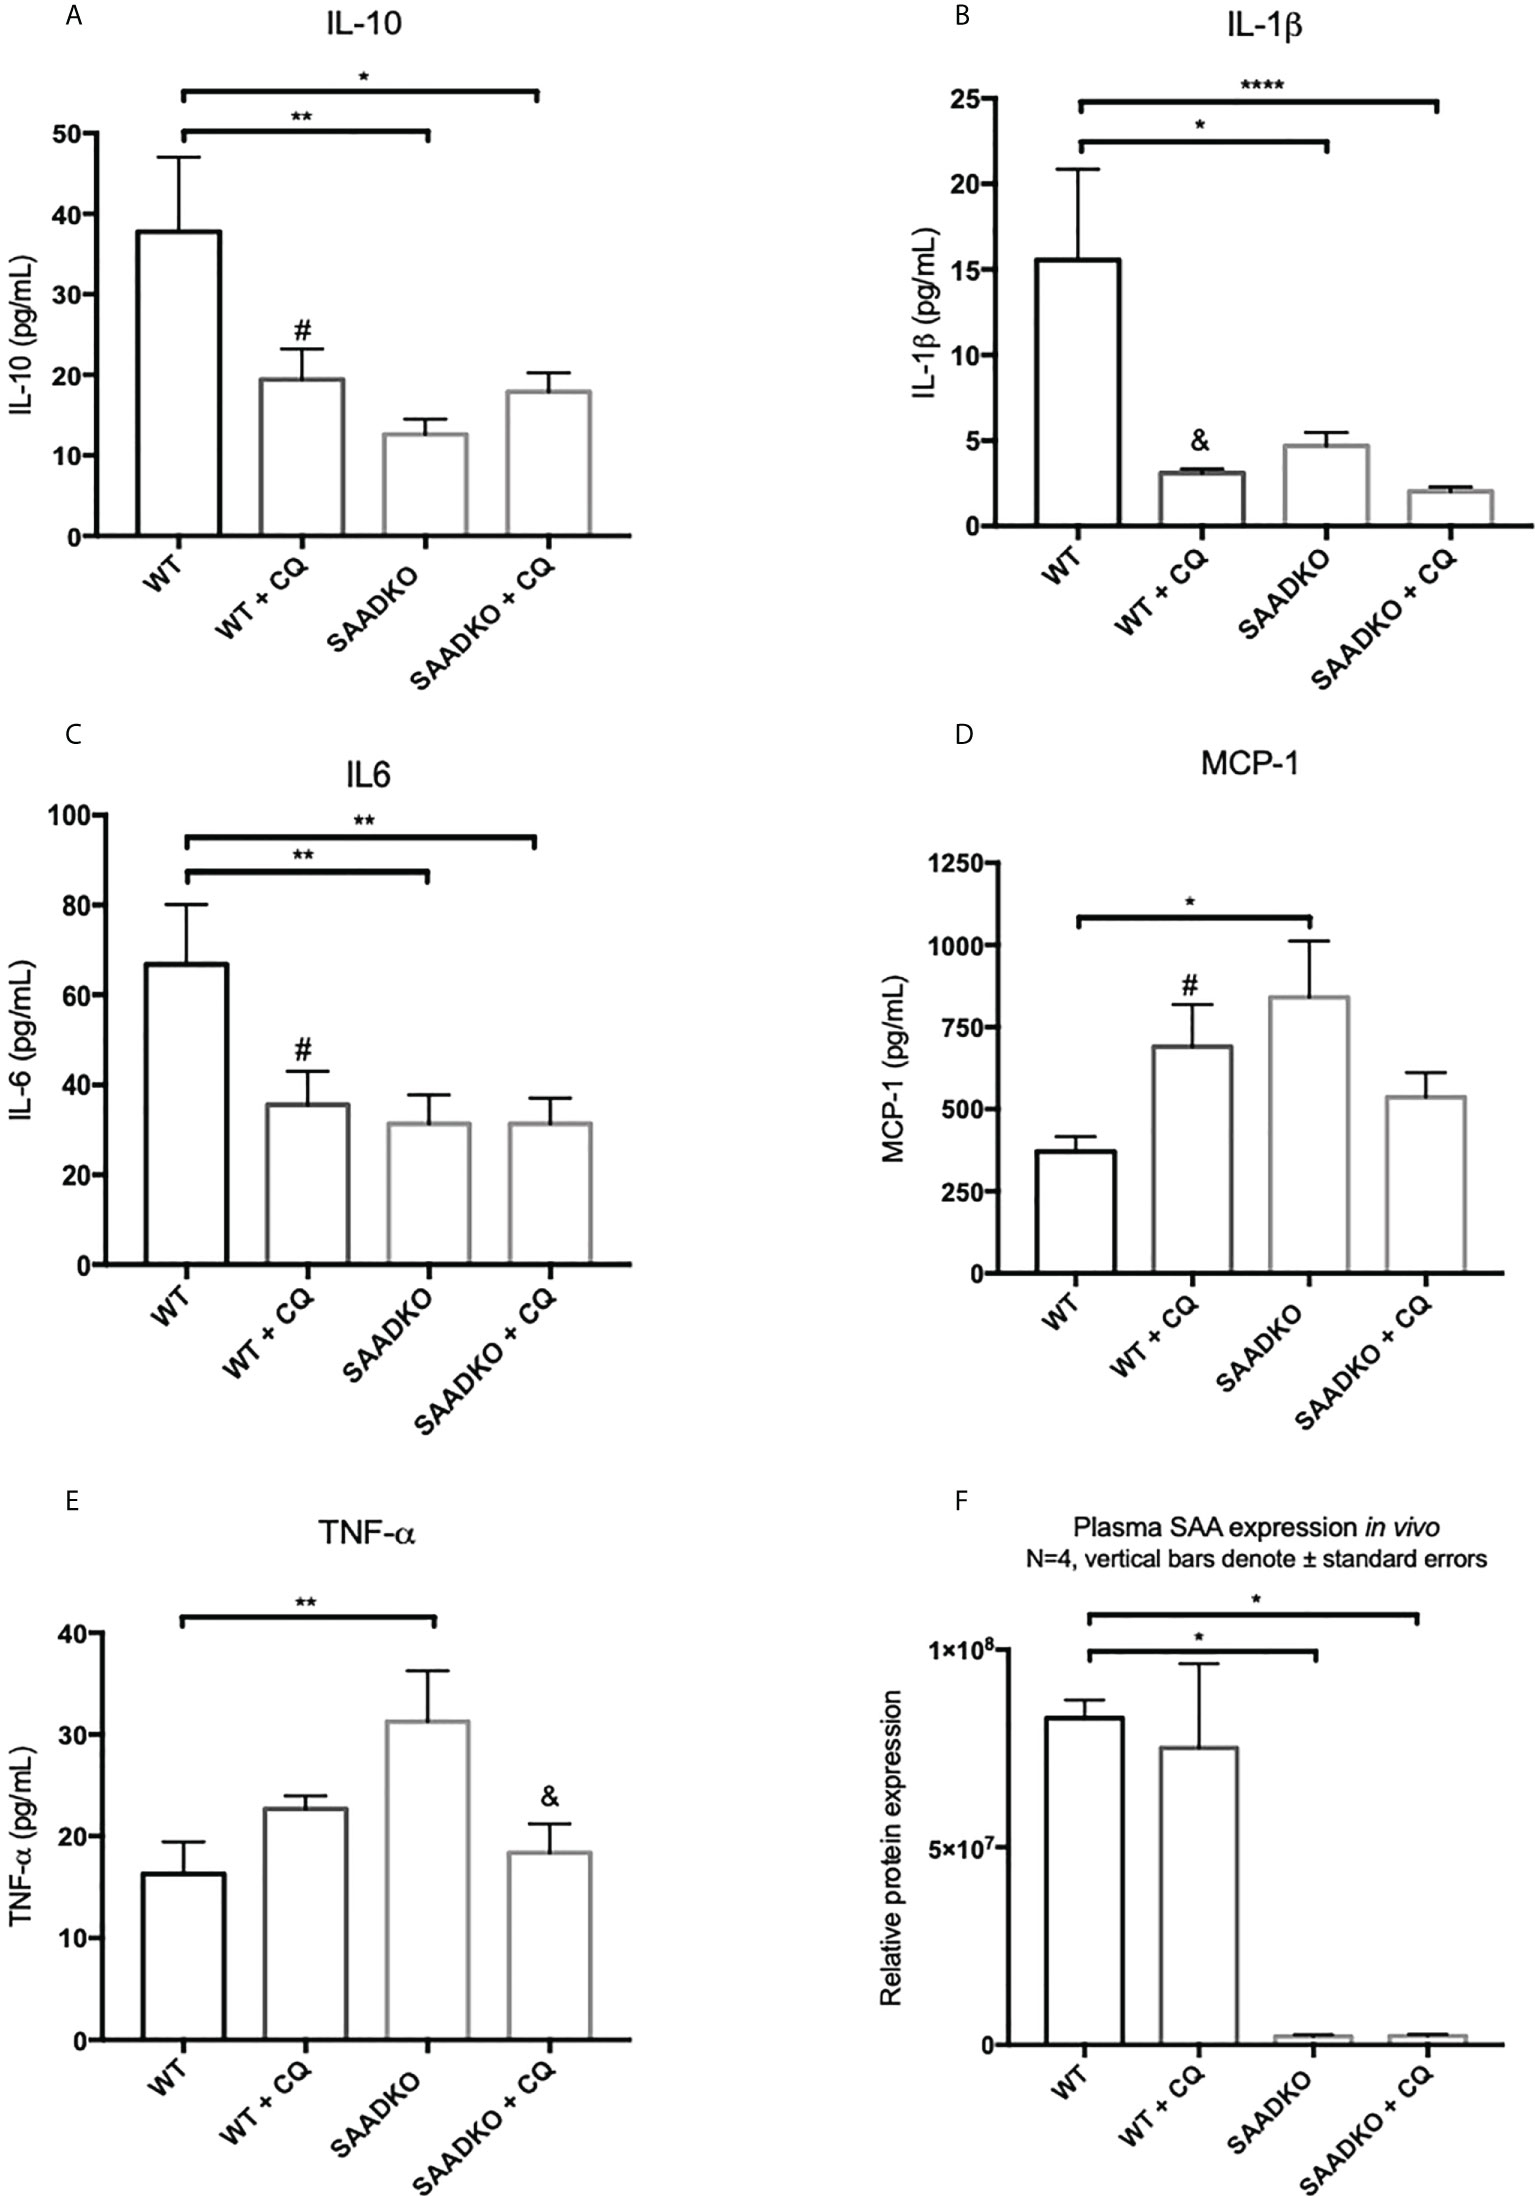
Figure 12 The cytokine profile of WT and SAADKO tumors. (A) Plasma levels of IL-10. (B) Plasma levels of IL-1β. (C) Plasma levels of IL-6. (D) Plasma levels of MCP-1. (E) Plasma levels of TNF-α. (F) Plasma levels SAA. *p<0.05, **p<0.01, ****p<0.0001. # Indicates p<0.05 when comparing a group with its respective chloroquine treated group. & Indicates p<0.01 when comparing a group with its respective chloroquine treated group.
Discussion
In vitro
In recent years, SAA has emerged as an important contributor to tumorigenesis, and is currently considered a clinical biomarker for breast cancer (9, 26). However, the exact mechanisms of action by which SAA promotes tumorigenesis still remain unclear. SAA has been reported to promote the activation of the mitogen activated protein kinases (MAPK), p38, ERK1/2 and JNK, as well as the phosphatidylinositol-3-kinase (PI3K) pathway component, Akt, in non-transformed cells such leukocytes, endothelial cells and adipocytes. These were mediated through the binding of SAA to various receptors, such as the formyl peptide receptor like 1 (FPRL-1), scavenger receptor class B type 1 (SR-BI), receptor for advanced glycation end products (RAGE) and toll-like receptors (TLR) 2/4 (12–19).
The activation of the p38, ERK1/2 and Akt signaling pathways play an important role in linking cellular responses and inflammatory stimuli, including SAA (27). Interestingly, the overexpression of SAA1 resulted in decreased Akt activation in the estrogen and progesterone receptor positive breast cancer cell line (MCF7) (Figure 4A). Furthermore, the overexpression of SAA1 with the inhibition of autophagy resulted in increased p38 activation (Figure 2B). The p38 MAPK can be activated by various factors such stress and inflammatory signals, such as SAA. The nature and strength of the stimulus determines the activation of p38, which can include the stimulation with SAA1 and concurrent autophagy inhibition (28). In addition, in line with previous literature (29, 30), the overexpression of SAA1 increased the activation of ERK in the triple-negative breast cancer cell line (Figure 3B). ERK is activated through Ras/Raf/MEK signaling cascades, where Ras activates the kinase activity of Raf, which activates MEK 1/2 through phosphorylation, which is subsequently activates ERK 1/2. These results indicate that the SAA-dependent activation or inhibition of these signaling pathways may be cell-type and context dependent. As such, tumors bearing the oncogenic Ras transformation is dependent on autophagy for metabolic fitness. Therefore, the role of autophagy induced by Ras depends strongly on the type of stimulus (31). More importantly, these signaling pathways are well known regulators of downstream processes, such as proliferation, autophagy, apoptosis and necrosis (32–34).
A functional relationship between SAA and autophagy has not yet been investigated, however we found that the overexpression of SAA1 downregulated autophagy in vitro (Figures 5A, B, 6, 7). It is also well established that Akt is a strong inhibitor of downstream autophagy, while p38 and ERK1/2 can either induce or inhibit autophagy based on the cellular context (35–37). The decreased activation of the autophagy inhibitor, Akt, in the MCF7 cell line (Figure 4A) could indicate that autophagy was downregulated by SAA1 in an Akt-independent manner, however further investigation is needed to confirm this. Furthermore, it has been reported that the ERK1/2 signaling pathway can act to either induce or inhibit autophagy, where this study reported that SAA1 can activate ERK1/2 as an inhibitor of autophagy in triple negative breast cancer cells (Figures 3B, 5B). It is clear from literature that basal autophagy is an important mediator of homeostasis (38, 39). The activation of the PI3K/Akt signaling pathway inhibits autophagy through direct activation of mTOR via the phosphorylation of the mTORC1 subunit at S2448, or indirectly through the inhibition of the TSC1-TSC2 complex by phosphorylating the TSC2 subunit, destabilizing the interaction between TSC1 and TSC2 (40). Furthermore, ERK1/2 activation can induce the dissociation of the beclin-1 and Bcl-2, enabling autophagy induction or ERK-dependent phosphorylation of TSC2 leading to the dissociation of the TSC1-TSC2 complex, which can promote the inhibition of autophagy (41, 42). However, it may also be true that SAA regulates other signaling mechanisms, such as JAK/STAT3, that can regulate autophagy in cancer cells (43).
We have further also investigated whether SAA can regulate the cargo recruiter, SQSTM1/p62. The accumulation of SQSTM1/p62 is indicative of defective autophagy where SQSTM1/p62 and its tagged cargo cannot be degraded. In line with this, the expression of SQSTM1/p62 was increased in the MCF7 cell line when autophagy was downregulated by SAA1 (Figure 8A). Aberrant SQSTM1/p62 overexpression is implicated in breast cancer progression (44–46). Guo and Pei (47) reported that high expression of SQSTM1/p62 and low expression of Beclin1 and LC3-II/LC3-I in MDA-MB-231 cells lead to autophagy and apoptosis defects, accelerating breast cancer progression. SQSTM1/p62 also plays an important role at the crossroads of autophagy, apoptosis, and cancer (48, 49). Furthermore, Yu and co-authors (50) reported that the accumulation of SQSTM1/p62 in tumor cells in vitro was characterized by cell cycle initiation, which resulted in an increase in MCM2 expression, and enhanced proliferative ability, which is supported by our findings. Therefore, the inhibition of autophagy provides cancer cells with the means to sustain increased levels of proliferation and cell growth (34). Moreover, the overexpression of SAA1 and the resulting inhibition of autophagy promoted proliferation in the two breast cancer cell lines, evident in our results for the DNA replication licensing factor, MCM2 (Figure 9C), and cell viability (Figures 9A, B) as an indication of proliferation.
In vivo
The in vivo findings indicate that the double knockout of SAA1/2 resulted in decreased activation of Akt (Figure 4C), which is consistent with previous literature (29, 30). We found that the double knockout of SAA1/2 promoted autophagy induction in vivo (Figure 5C), which is in line with our findings for Akt activation. Akt is a strong downstream inhibitor of autophagy, and here the decreased activation of Akt in the double knockout of SAA1/2 group correlates with increased autophagy. Furthermore, the in vivo results showed that SQSTM1/p62 is upregulated in SAADKO tumors, indicating that both autophagy and cargo recruitment is increased (Figure 8C). As such, SQSTM1/p62 is also a notoriously multifunctional protein, and in its role as an adapter protein, it contains a range of motifs which enable its interaction with various selective signal transduction pathways involved in cell proliferation and survival/death through regulation of transcription factor activities (51). In addition, homeostatic regulation may affect SQSTM1/p62 levels independent of autophagy.
Autophagy can also regulate apoptosis and necrosis (52). When cancer cells have deficient apoptosis, autophagy acts to sustain cell viability (22). The in vivo findings indicated that SAA1/2 knockout resulted in apoptosis resistance (Figures 10A, B), which is mediated through the induction of autophagy, where treatment of the knockout tumors with the autophagy inhibitor chloroquine increased apoptosis levels to that of the WT control, evident in our findings for caspase 3. As such, the time duration of the chloroquine treatment is optimal to detect changes in autophagy but not full completion of apoptosis, evident in our findings for PARP (Figures 10A, B). We also found that autophagy inhibition in WT tumors elicits a pro-tumorigenic response as it promotes apoptosis resistance, evident in the decreased levels of cleaved caspase-3 and PARP (Figures 10A, B). In contrast, tumor cells may be more prone to cellular stress in the absence of SAA1/2 and may upregulate autophagy as a cell protective response for survival. Furthermore, the double knockout of SAA1/2 tumors showed reduced levels of necrosis when compared to the WT controls (Figures 11A–E). The inhibition of autophagy in the SAADKO group significantly increased the percentage necrosis when compared to the untreated SAADKO group (Figures 11A–E). However, the assessment of other necrosis markers is required to validate these findings. In line with this, Degenhardt and co-authors (22) reported that autophagy deficiency promotes tumor necrosis, which supports our findings that autophagy, as a result of SAA deficiency, inhibits tumor necrosis in vivo. However, the decrease in necrosis was not entirely dependent on autophagy regulation alone and was partially facilitated by the knockout of SAA1/2, which also resulted in an altered cytokine profile.
Tissue necrosis stimulates a potent inflammatory response, while a fine balance exists between autophagy and inflammation, where autophagy can regulate inflammatory processes and inflammation can in turn regulate autophagy pathways (53–56). This is supported by our findings that SAADKO tumors are characterized by a smaller percentage of necrotic tumor tissue than the WT controls. As such, the levels of the pro-inflammatory IL-1β and IL-6 was significantly decreased in the SAADKO group when compared to the WT control (Figures 12B, C). However, it is also evident from our study that the expression of the interleukins is finely regulated by both knockout of SAA1/2 and autophagy inhibition in breast tumors. Other studies have reported that autophagy reduced the secretion of IL-1β in vivo and in vitro (57, 58). However, the inhibition of autophagy with 3-MA increased the expression of IL-1β and Il-6 (59). The inhibition of autophagy resulted in a similar decreased in pro-inflammatory cytokine levels than that of the SAADKO group, which displayed elevated levels of autophagy. Furthermore, the levels of the anti-inflammatory interleukin, IL-10, was also significantly lower in the SAADKO group and when autophagy was inhibited in both the WT and SAADKO groups (Figure 12A). In contrast, an interesting finding was that the levels of pro-inflammatory TNF-α and MCP-1 was increased in SAADKO tumors (Figures 12D, E). TNF-α can upregulate the expression of autophagy genes MAP1LC3B and BECN1, coding for LC3 and beclin-1 respectively, while also inhibiting Akt activation, while it can also induce autophagy through the ERK1/2 pathway (53, 54). Furthermore, Liu and co-authors (60) reported that autophagy can induce TNF-α production. Autophagy inhibition, similar to the results of cleaved caspase-3, increased MCP-1 levels in the WT group, while autophagy inhibition decreased MCP-1 levels in the SAADKO group. Therefore, the altered cytokine profile as a result of SAA1/2 knockout can, in turn, promote autophagy.
We reported various differences and similarities between the MCF7 and MDA-MB-231 cell lines in response to SAA overexpression. SAA downregulated the activation of Akt in the MCF7 cell line and promoted ERK activation in the MDA-MB-231 cell line, while downregulating autophagy and promoting proliferation in both cell lines. Following the double knockout of SAA1/2, the activation of Akt was decreased, autophagy was induced, while promoting apoptosis resistance and decreased necrosis. Finally, the double knockout of SAA1/2 contributed to an altered cytokine profile in vivo by reducing the circulating levels of IL-1β, IL-6 and IL-10 and increasing TNF-α and MCP-1. It is well established that cancer is closely associated with inflammation, including SAA, evident in the high rates of proliferation and elevated levels of pro-inflammatory cytokines present in the TME. Furthermore, from our results it is clear that the intracellular degradation process, autophagy, remains central in tumorigenesis depending on the cellular context. In conclusion, it is evident that some SAA-dependent mechanisms of tumorigenesis still remains unclear such as genetic perturbations of autophagy, however the findings of this study clearly indicate the significance of the role of SAA in models of breast cancer (Figure 13).
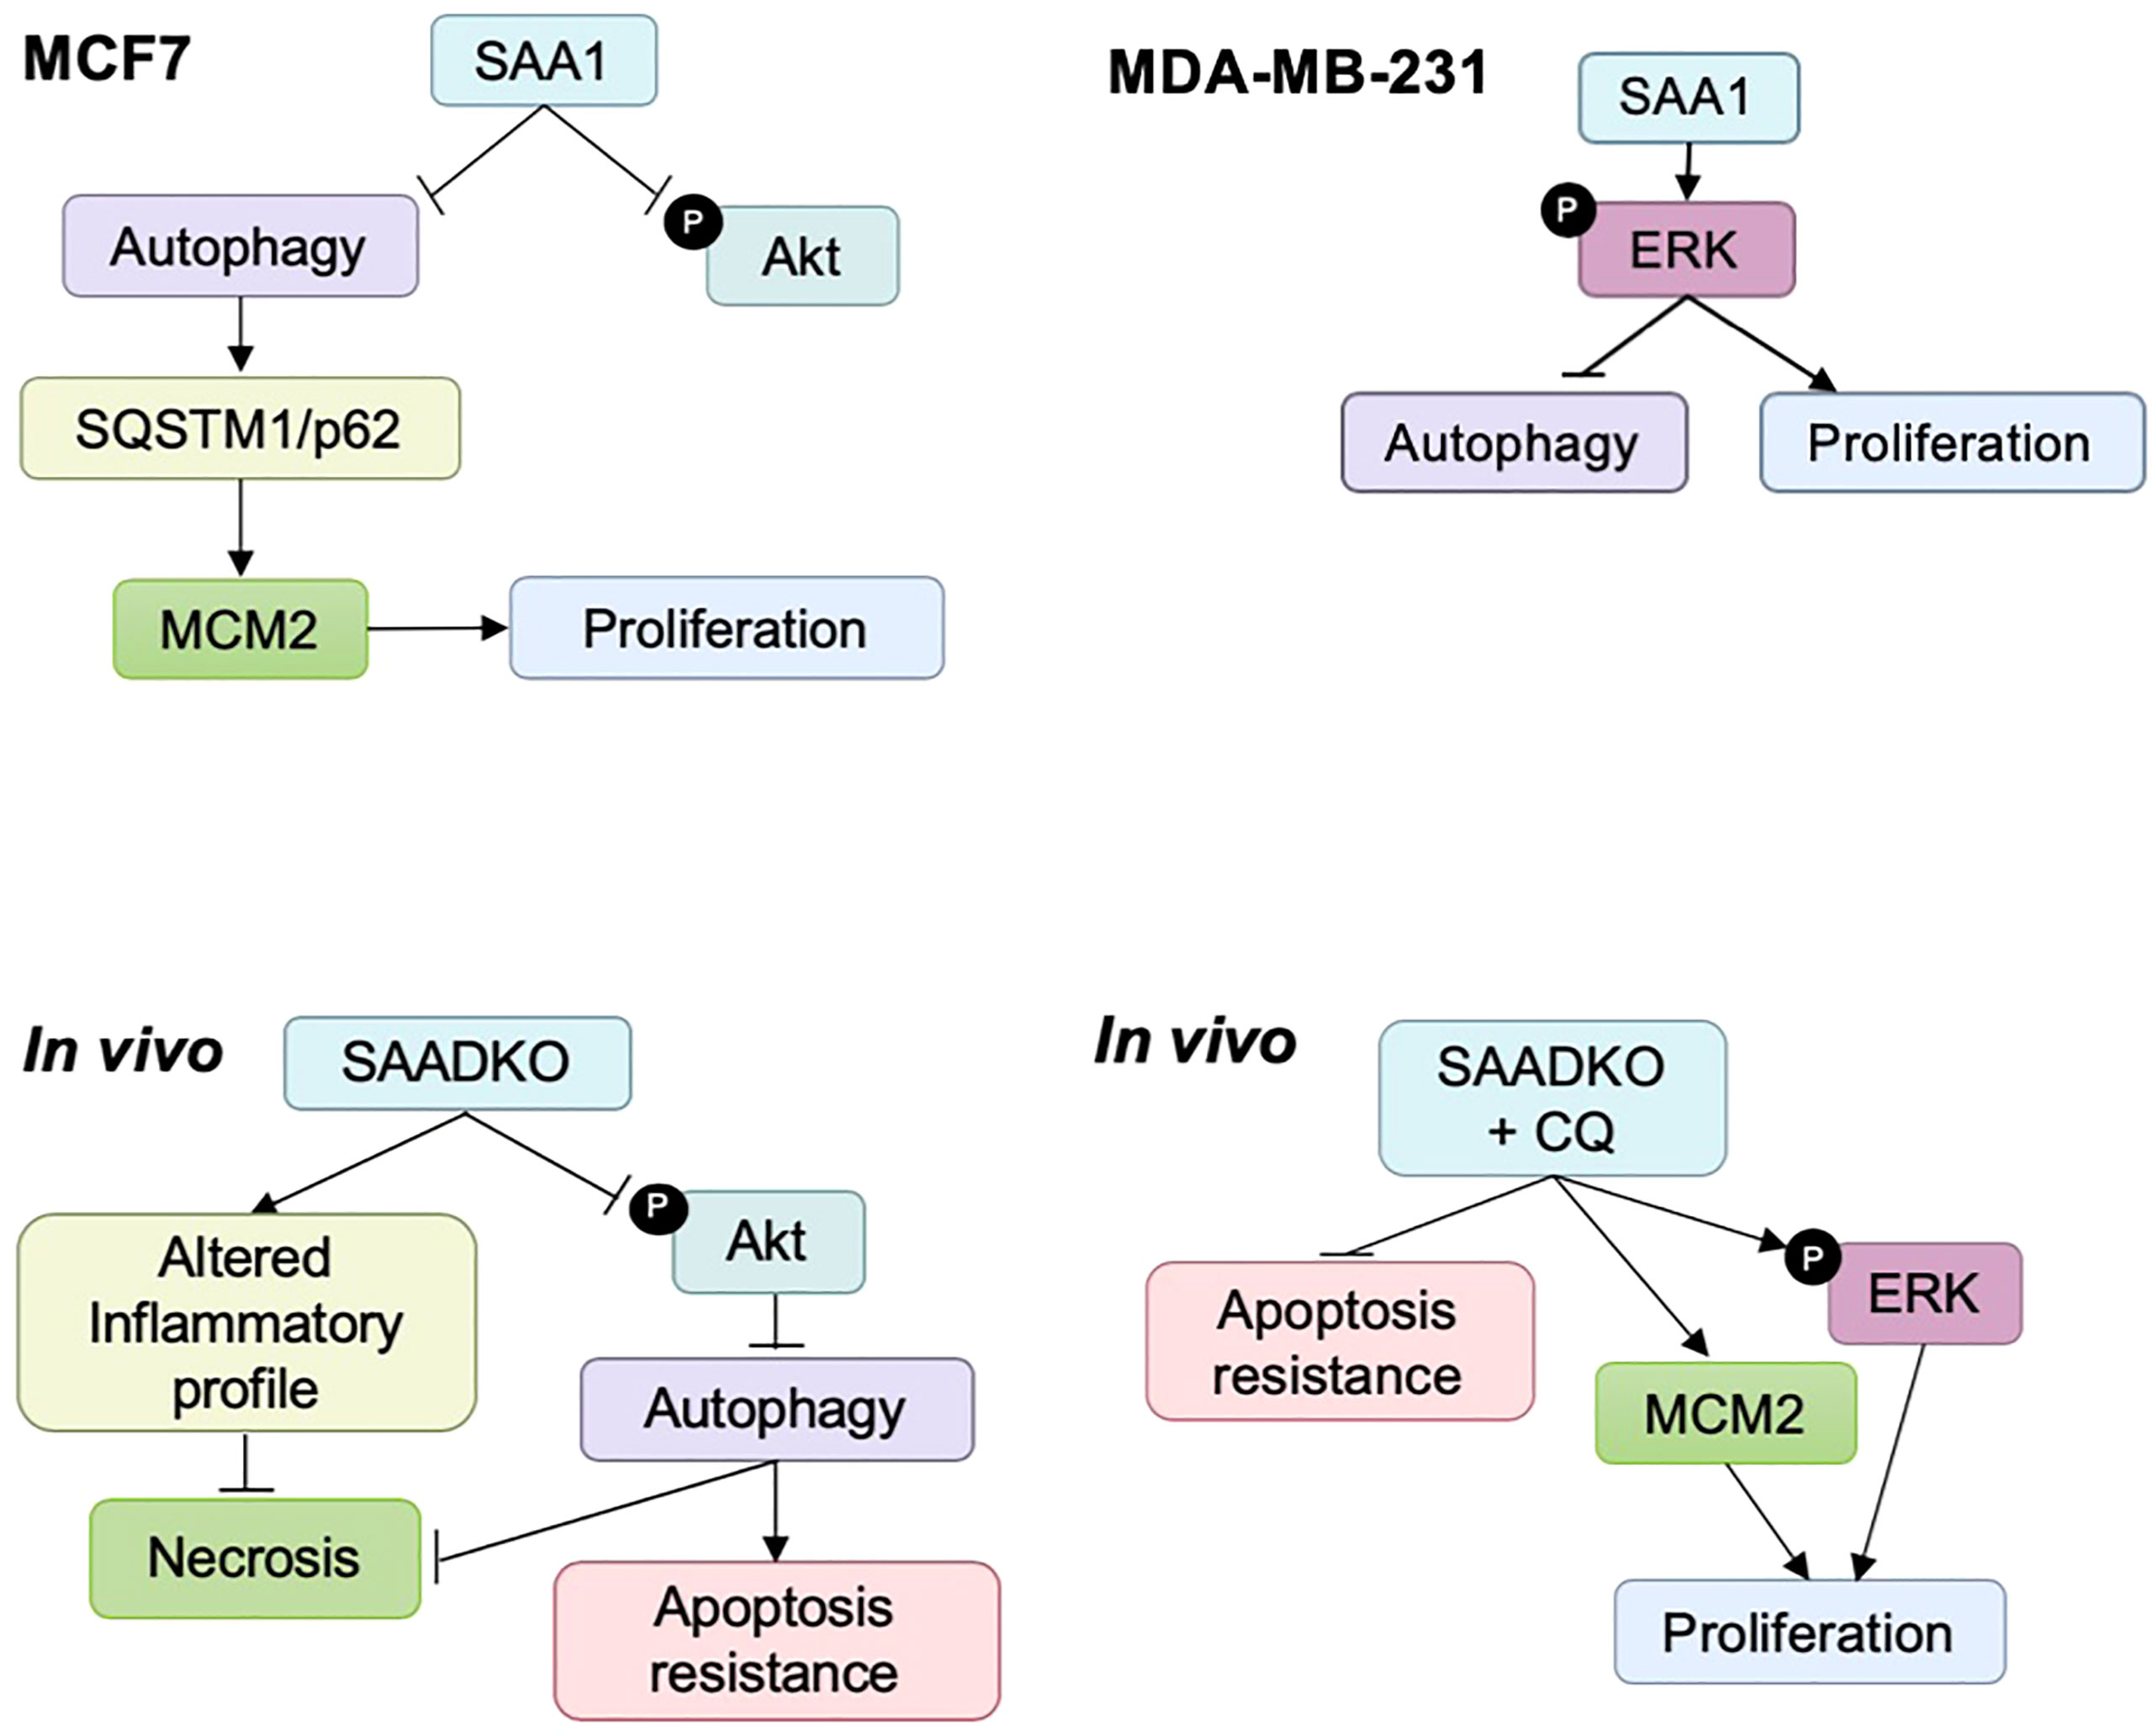
Figure 13 Summary diagrams of the in vitro and in vivo results.
Data availability statement
The original contributions presented in the study are included in the article/Supplementary Material. Further inquiries can be directed to the corresponding author.
Author contributions
MdP was responsible for the conceptualization, methodology, validation, formal analysis, investigation, writing the original draft, review and editing, visualization and project administration. TD was responsible for conceptualization, methodology, review and editing and supervision. DWO was responsible for methodology, review and editing. WJSdV was responsible for review and editing. AME was responsible for the conceptualization, resources, review and editing and supervision. All authors contributed to the article and approved the submitted version.
Funding
Funding was obtained from the National Research Foundation of South Africa (NRF) (grant number 118566), the Cancer Association of South Africa (CANSA) and the South African Medical Research Council (SAMRC).
Conflict of interest
The authors declare that the research was conducted in the absence of any commercial or financial relationships that could be construed as a potential conflict of interest.
Publisher’s note
All claims expressed in this article are solely those of the authors and do not necessarily represent those of their affiliated organizations, or those of the publisher, the editors and the reviewers. Any product that may be evaluated in this article, or claim that may be made by its manufacturer, is not guaranteed or endorsed by the publisher.
Supplementary material
The Supplementary Material for this article can be found online at: https://www.frontiersin.org/articles/10.3389/fonc.2022.1000925/full#supplementary-material
Supplementary Figure 1 | (A) The tumour growth of WT and SAADKO tumours over time. (B) The Kaplan-Meier survival analysis showing the cumulative proportion of surviving mice throughout the study.
References
1. Medzhitov R. Origin and physiological roles of inflammation. Nature (2008) 454:428–35. doi: 10.1038/nature07201
2. Bode JG, Albrecht U, Haussinger D, Heinrich PC, Shaper F, et al. Hepatic acute phase proteins – regulation by IL-6 and IL-1-type cytokines involving STAT3 and its crosstalk with NF-kB-dependent signalling. Eur J Cell Biol (2012) 91(6–7):496–505. doi: 10.1016/j.ejcb.2011.09.008
3. Benditt EP, Eriksen N, Hanson RH. Amyloid protein SAA is an apoprotein of mouse plasma high density lipoprotein. Proc Natl Acad Sci USA (1979) 76(8):4092–6. doi: 10.1073/pnas.76.8.4092
4. Djurec M, Grana O, Lee A, Troulé K, Espinet E, Cabras L, et al. Saa3 is a key mediator of the protumorigenic properties of cancer-associated fibroblasts in pancreatic tumours. PNAS (2018) 115:E1147–56. doi: 10.1073/pnas.1717802115
5. Rossmann C, Windpassinger C, Brunner D, Kovacevic A, Schweighofer N, Malli R, et al. Characterization of rat serum amyloid A4 (SAA4): a novel member of the SAA superfamily. Biochem Biophys Res Commun (2014) 450(4):1643 1649. doi: 10.1016/j.bbrc.2014.07.054
6. Butler A, Whitehead AS. Mapping of the mouse serum amyloid a gene cluster by long-range polymerase chain reaction. Immunogenet (1996) 44:468–74. doi: 10.1007/BF02602809
7. Malle E, Sodin-Semrl S, Kovacevic A. Serum amyloid a: An acute-phase protein involved in tumour pathogenesis. Cell Mol Life (2009) 66(1):9–26. doi: 10.1007/s00018-008-8321-x
8. Zhang G, Sun X, Lv H, Yang X, Kang X, et al. Serum amyloid a: A new potential serum marker correlated with the stage of breast cancer. Oncol Lett (2012) 3:940–4. doi: 10.3892/ol.2012.584
9. Ignacio RMC, Gibbs CR, Kim S, Lee ES, Adunyah SE, Son DS, et al. Serum amyloid a predisposes inflammatory tumor microenvironment in triple negative breast cancer. Oncotarget (2019) 10(4):511–26. doi: 10.18632/oncotarget.26566
10. Choi H, Ignacio RMC, Lee ES, Wilson AJ, Khabele D, Son DS, et al. Augmented serum amyloid A1/2 mediated by TNF-induced NF-kappaB in human serous ovarian epithelial tumors. Immune Netw (2017) 17:121–7. doi: 10.4110/in.2017.17.2.121
11. De Buck M, Gouwy M, Wang JM, Van Snick J, Opdenakker G, Struyf S, et al. Structure and expression of different serum amyloid a (SAA) variants and their concentration-dependent functions during host insults. Curr Medicinal Chem (2016) 23(17):1725–55. doi: 10.2174/0929867323666160418114600
12. El Kebir D, Jozsef L, Khreiss T, Pan W, Petasis NA, Serhan CN, et al. Aspirin triggered lipoxins override the apoptosis-delaying action of serum amyloid a in human neutrophils: A novel mechanism for resolution of inflammation. J ImmunoI (2007) 179:616–22. doi: 10.4049/jimmunol.179.1.616
13. Baranova IN, Vishnyakova TG, Bocharov AV, Kurlander R, Chen Z, Kimelman ML, et al. Serum amyloid a binding to CLA-1 (CD36 and LIMPII analogous-1) mediates serum amyloid a protein-induced activation of ERk1/2 and p38 mitogen activated protein kinases. J Biol Chem (2005) 280(9):8031–40. doi: 10.1074/jbc.M405009200
14. Lee HY, Kim SD, Shim JW, Lee SY, Lee H, Cho KH, et al. Serum amyloid a induces CCL2 production via formyl peptide receptor-like 1-mediated signaling in human monocytes. J Immunol (2008) 181(6):4332–9. doi: 10.4049/jimmunol.181.6.4332
15. Cai H, Song C, Endoh I, Goyette J, Jessup W, Freedman SB, et al. Serum amyloid a induces monocyte tissue factor. J Immunol (2007) 178(3):1852–60. doi: 10.4049/jimmunol.178.3.1852
16. Sandri S, Rodriguez D, Gomes E, Monteiro HP, Russo M, Campa A, et al. Is serum amyloid a an endogenous TLR4 agonist? J Leukocyte Biol (2008) 83:1174–80. doi: 10.1189/jlb.0407203
17. Cheng N, He R, Tian J, Ye PP, Ye RD. Cutting edge: TLR2 is a functional receptor for acute phase serum amyloid a. J Immunol (2008) 181:22–6. doi: 10.4049/jimmunol.181.1.22
18. Zhang X, Chen J, Wang S. Serum amyloid a induces a vascular smooth muscle cell phenotype switch through the p38 MAPK signalling pathway. BioMed Res Int (2017) 2017:4941379. doi: 10.1155/2017/4941379
19. Ren P, Sun D, Xin D, Ma W, Chen P, Gao H, et al. Serum amyloid a promotes osteosarcoma invasion via upregulating avB3 integrin. Mol Med Rep (2014) 10:3106–12. doi: 10.3892/mmr.2014.2635
20. Lee HY, Kim MK, Park KS, Bae YH, Yun J, Park JI, et al. Serum amyloid a stimulates matrix-metalloproteinase-9 upregulation via formyl peptide receptor like-1-mediated signaling in human monocytic cells. Biochem Biophys Res Commun (2005) 330:989–98. doi: 10.1016/j.bbrc.2005.03.069
21. Yu N, Zhang S, Lu J, Li Y, Yi X, Tang L, et al. Serum amyloid A, an acute phase protein, stimulates proliferative and proinflammatory responses of keratinocytes. Cell proliferation (2017) 50(3):12320. doi: 10.1111/cpr.12320
22. Degenhardt K, Mathew R, Beaudoin B, Bray K, Anderson D, Chen G, et al. Autophagy promotes tumor cell survival and restricts necrosis, inflammation, and tumorigenesis. Cancer Cell (2006) 10:51–64. doi: 10.1016/j.ccr.2006.06.001
23. Mathew R, Karantza-Wadsworth V, White E. Role of autophagy in cancer. Nat Rev Cancer (2007) 7:961–7. doi: 10.1038/nrc2254
24. de Chaumont F, Dallongeville S, Chenouard N, Hervé N, Pop S, Provoost T, et al. Icy: an open bioimage informatics platform for extended reproducible research. Nat Methods (2012) 9(7):690–6. doi: 10.1038/nmeth.2075
25. de Beer MC, Webb NR, Wroblewski JM, Noffsinger VP, Rateri DL, Ji A, et al. Impact of serum amyloid a on high density lipoprotein composition and levels. J Lipid Res (2010) 51:3117–25. doi: 10.1194/jlr.M005413
26. Chan DC, Chen CJ, Chu HC, Chang WK, Yu JC, Chen YJ, et al. Evaluation of serum amyloid a as a biomarker for gastric cancer. Ann Surg Oncol (2007) 14(1):84–93. doi: 10.1245/s10434-006-9091-z
27. Kim C, Sano Y, Todorova K, Carlson BA, Arpa L, Celada A, et al. The kinase p38 alpha served cell-type specific inflammatory functions in skin injury and coordinates pro- and anti-inflammatory gene expression. Nat Immunol (2008) 9(9):1019–27. doi: 10.1038/ni.1640
28. Webber JL, Tooze SA. Coordinated regulation of autophagy by p38alpha MAPK through mAtg9 and p38IP. EMBO J (2010) 29:27–40. doi: 10.1038/emboj.2009.321
29. Jijon HB, Madsen KL, Walker JW, Allard B, Jobin C. Serum amyloid a activates NF-kappaB and proinflammatory gene expression in human and murine intestinal epithelial cells. Eur J Immunol (2005) 35:718–26. doi: 10.1002/eji.200425688
30. Belmokhtar K, Robert T, Ortillon J, Braconnier A, Vuiblet V, Boulagnon- Rombi C, et al. Signaling of serum amyloid a through receptor for advanced glycation end products as a possible mechanism for uremia-related atherosclerosis. Arterioscler Thromb Vasc Biol (2016) 36(5):800–9. doi: 10.1161/ATVBAHA.115.306349
31. Lock R, Roy S, Kenific CM, Su JS, Salas E, Ronen SM, et al. Autophagy facilitates glycolysis during ras mediated oncogenic transformation. Mol Biol Cell (2011) 22(2):165–78. doi: 10.1091/mbc.e10-06-0500
32. Liu Y, Shepherd EG, Nelin LD. MAPK phosphatases–regulating the immune response. Nat Rev Immunol (2007) 7:202–12. doi: 10.1038/nri2035
33. Arthur JSC, Ley SC. Mitogen-activated protein kinases in innate immunity. Nat Rev Immunol (2013) 13:679–92. doi: 10.1038/nri3495
34. Laplante M, Sabatini DM. mTOR signaling in growth control and disease. Cell (2012) 149:274–93. doi: 10.1016/j.cell.2012.03.017
35. Rabanal-Ruiz Y, Otten EG, Korolchuk VI. mTORC1 as the main gateway to autophagy. Essays Biochem (2017) 61(6):565–84. doi: 10.1042/EBC20170027
36. Mammucari C, Schiaffino S, Sandri M. Downstream of akt: FoxO3 and mTOR in the regulation of autophagy in skeletal muscle. Autophagy (2008) 4(4):524–6. doi: 10.4161/auto.5905
37. Zheng YH, Tian C, Meng Y, Qin YW, Du YH, Du J, et al. Osteopontin stimulates autophagy via integrin/cd44 and p38 MAPK signalling pathways in vascular smooth muscle cells. J Cell Physiol (2012) 227:127–35. doi: 10.1002/jcp.22709
38. Ravikumar B, Duden R, Rubinsztein DC. Aggregate-prone proteins with polyglutamine and polyalanine expansions are degraded by autophagy. Hum Mol Genet (2002) 11:1107–17. doi: 10.1093/hmg/11.9.1107
39. Shibata M, Lu T, Furuya T, Degterev A, Mizushima N, Yoshimori T, et al. Regulation of intracellular accumulation of mutant huntingtin by beclin 1. J Biol Chem (2006) 281:14474–85. doi: 10.1074/jbc.M600364200
40. Huang J, Manning BD. A complex interplay between akt, TSC2 and the two mTOR complexes. Biochem Soc Trans (2009) 37:217–22. doi: 10.1042/BST0370217
41. Ma L, Chen Z, Erdjument-Bromage H, Tempst P, Pandolf PP. Phosphorylation and functional inactivation of TSC2 by erk: Implications for tuberous sclerosis and cancer pathogenesis. Cell (2005) 121:179–93. doi: 10.1016/j.cell.2005.02.031
42. Feng W, Huang S, Wu H, Zhang M. Molecular basis of bcl-xL’s target recognition versatility revealed by the structure of bcl-xL in complex with the BH3 domain of beclin-1. J Mol Biol (2007) 371(1):223–35. doi: 10.1016/j.jmb.2007.06.069
43. Hagihara K, Kagawa S, Kishida Y, Arimitsy J. Anti-cytokine therapy for AA amyloidosis. Intechopen (2013). doi: 10.5772/53315
44. Rolland P, Madjd Z, Durrant L, Ellis IO, Layfield R, Spendlove I. The ubiquitin-binding protein p62 is expressed in breast cancers showing features of aggressive disease. Endocr Relat Cancer (2007) 14:73–80. doi: 10.1677/erc.1.01312
45. Luo RZ, Yuan ZY, Li M, Xi SY, Fu J, He J. Accumulation of p62 is associated with poor prognosis in patients with triple-negative breast cancer. Onco Targets Ther (2013) 6:883–8. doi: 10.2147/OTT.S46222
46. Inami Y, Waguri S, Sakamoto A, Kouno T, Nakada K, Hino O, et al. Persistent activation of Nrf2 through p62 in hepatocellular carcinoma cells. J Cell Biol (2011) 193:275–84. doi: 10.1083/jcb.201102031
47. Guo Y, Pei X. Tetrandrine-induced autophagy in MDA-MB-231 triple-negative breast cancer cell through the inhibition of PI3K/AKT/mTOR signaling. Evid Based Complement Alternat Med (2019) 2019:7517431. doi: 10.1155/2019/7517431
48. Rubinsztein DC, Codogno P, Levine B. Autophagy modulation as a potential therapeutic target for diverse diseases. Nat Rev Drug Discovery (2012) 11(9):709–30. doi: 10.1038/nrd3802
49. White E. Deconvoluting the context-dependent role for autophagy in cancer. Nat Rev Cancer (2012) 12:401–10. doi: 10.1038/nrc3262
50. Yu F, Ma R, Liu C, Zhang L, Feng K, Wang M, et al. SQSTM1/p62 promotes cell growth and triggers autophagy in papillary thyroid cancer by regulating the Akt/AMPK/mTOR signalling pathway. Front Oncol (2021) 11. doi: 10.3389/fonc.2021.638701
51. Alegre F, Moragrega ÁB, Polo M, Marti-Rodrigo A, Esplugues JV, Blas-Garcia A, et al. Role of p62/SQSTM1 beyond autophagy: a lesson learned from drug-induced toxicity in vitro. Br J Pharmacol (2018) 175(3):440–55. doi: 10.1111/bph.14093
52. Yonekawa T, Thorburn A. Autophagy and cell death. Essays Biochem (2013) 55:105–17. doi: 10.1042/bse0550105
53. Sivaprasad U, Basu A. Inhibition of ERK attenuates autophagy and potentiates tumour necrosis factor-alpha-induced cell death in MCF-7 cells. J Cell Mol Med (2008) 12(4):1265–71. doi: 10.1111/j.1582-4934.2008.00282.x
54. Venkatesan T, Choi YW, Mun SP, Kim YK. Pinus radiata bark extract induces caspase independent apoptosis-like cell death in MCF7 human breast cancer cells. Cell Biol Toxicol (2016) 32:451–64. doi: 10.1007/s10565-016-9346-9
55. Martinez-Outschoorn UE, Whitaker-Menezes D, Pavlides S, Chiavarina B, Bonuccelli G, Casey T, et al. The autophagic tumor stroma model of cancer or “battery-operated tumor growth": A simple solution to the autophagy paradox. Cell Cycle (2010) 9:4297–306. doi: 10.4161/cc.9.21.13817
56. Lee DF, Kuo HP, Chen CT, Hsu JM, Chou CK, Wei Y, et al. IKK beta suppression of TSC1 links inflammation and tumor angiogenesis via the mTOR pathway. Cell (2007) 130:440–55. doi: 10.1016/j.cell.2007.05.058
57. Gabrion A, Hmitou I, Moshous D, Neven B, Lefevre A, Diana JS, et al. Mammalian target of rapamycin inhibition counterbalances the inflammatory status of immune cells in patients with chronic granulomatous disease. J Allergy Clin Immunol (2017) 139(5):1641–9. doi: 10.1016/j.jaci.2016.08.033
58. Crisan TO, Plantinga TS, van de Veerdonk FL, Farcas MF, Stoffels M, Kullberg BJ, et al. Inflammasome-independent modulation of cytokine response by autophagy in human cells. PloS One (2011) 6:e18666. doi: 10.1371/journal.pone.0018666
59. Jansen HJ, van Essen P, Koenen T, Joosten LA, Netea MG, Tack CJ, et al. Autophagy is up-regulated in adipose tissue of obese individuals and modulates pro-inflammatory cytokine expression. Endocrinology (2012) 153:58866–5874. doi: 10.1210/en.2012-1625
Keywords: autophagy, breast cancer, inflammation, cell signalling, serum amyloid A, proliferation
Citation: du Plessis M, Davis TA, Olivier DW, de Villiers WJS and Engelbrecht A-M (2022) A functional role for Serum Amyloid A in the molecular regulation of autophagy in breast cancer. Front. Oncol. 12:1000925. doi: 10.3389/fonc.2022.1000925
Received: 22 July 2022; Accepted: 07 September 2022;
Published: 30 September 2022.
Edited by:
Dirk Geerts, University of Amsterdam, NetherlandsReviewed by:
Zhiru Xiu, Changchun University of Chinese Medicine, ChinaMazhar Salim Al Zoubi, Yarmouk University, Jordan
Copyright © 2022 du Plessis, Davis, Olivier, de Villiers and Engelbrecht. This is an open-access article distributed under the terms of the Creative Commons Attribution License (CC BY). The use, distribution or reproduction in other forums is permitted, provided the original author(s) and the copyright owner(s) are credited and that the original publication in this journal is cited, in accordance with accepted academic practice. No use, distribution or reproduction is permitted which does not comply with these terms.
*Correspondence: Manisha du Plessis, manishadup@sun.ac.za