1. Introduction
Technological progress has meant a significant change in all sectors. However, the medical sector is one of the fields where the most significant change has been seen. The development of new detection devices, as well as data analysis and an improvement in the techniques used up to now for sample processing [
1], highlights the need to continue implementing new networks that allow for monitoring and control of the patient.
In recent years, the union of the science of technology with the knowledge of basic health science, always under the supervision of a specialized person, has allowed an advance in medicine. This area is known under the term e-health and not only aims to help in the early detection of diseases but also to improve the quality of life of the patient and improve clinical practice, hence the need to fully exploit the devices available to the patient at home. In this way, the communication and exchange of information between health professionals and patients can be strengthened, generating a two-way process of communication. It provides opportunities for patient self-care without the need to travel to the medical center [
2]. This allows faster responses to any alteration of the patient that, if detected early, can even prevent death in some cases.
Although the need to establish systems that would help medical personnel to be able to screen patients quickly and efficiently has been known for years, since the severe acute respiratory syndrome coronavirus 2 (SARS-CoV-2), these monitoring devices have increased in relevance. This virus was first reported in late-2019 in China and is the causative agent of the coronavirus disease 2019 (COVID-19) pandemic. This is the last known pandemic so far [
3]. With the appearance of this virus, the health system had to make very rapid progress in controlling this microorganism and its containment, due to its fast transmission and high mortality, as well as developing new vaccines. On the other hand, some studies show the consequences that this type of virus can have. They have detected as ranging from mild symptoms such as fatigue to long-term loss of smell. Currently, chronic COVID patients have been established. These patients present with a persistent post-COVID syndrome, also known as prolonged COVID. People affected by this type of syndrome have current cognitive problems, physical and medical sequelae, and show vascular, pulmonary, and cardiac fibrosis [
4]. Hence, it is essential to control this type of patient, whose disease has no cure, from their own homes.
However, although this latest pandemic has been the cause for accelerating the engine of knowledge, according to the WHO, five types of diseases are considered chronic diseases (diabetes, cardiovascular diseases, cancer, chronic respiratory diseases, and mental disorders). Hence, the great importance of this type of disease leads the WHO/Europe to address risk factors and develop tools and public health guidance to help countries with less access to healthcare [
5]. On the other hand, it should be noted that these chronic diseases, on many occasions, require continuous patient monitoring. This is detrimental on many occasions for the patient but also causes a collapse in the medical area, often preventing excess patients from care and leading to poor management of some diseases due to lack of time. In addition, the economic cost that it incurs both for the patient and for the health management are significant [
6].
Although currently, in most diseases, the presence of the patient during the consultation is necessary, it is known that, in others, on many occasions, they could be controlled by monitoring from home. This monitoring system is called remote health care (RHMS), and it is presented as a promising solution for older people suffering from chronic diseases. It is a system of three levels: an intelligent portable sensor collects the patient’s physiological data; then, usually, the data are sent by Bluetooth Low Energy (BLE); and finally, they are uploaded to a system where the doctor or any authorized person can see them [
7].
Among the most common systems that we find at the domestic level are the thermometer, which measures body temperature [
8]; the blood pressure monitor, which allows us to control the patient’s blood pressure [
9]; and the pulse oximeter, which indicates not only the saturation of oxygen in the blood but also the heart and respiratory rate [
10]. On the other hand, we find glucometers, which serve the patient to measure blood glucose levels in addition to a relatively high number of tests such as urine strips, pregnancy tests, SARS-CoV 2 antigen tests, and antibody detection tests, among others. All these values can be taken by the patient himself at home, and the union of all these parameters can give us an initial idea of the patient’s current situation.
Between the aforementioned devices, it is worth highlighting the use of the pulse oximeter during the COVID pandemic, which allowed the first screening when the patient arrived at the hospital for the first time, as well as a control during their stay. In addition, its easy use and low cost, together with the blood pressure meter and the thermometer, have meant that many people now have this device at home, not only COVID patients but also for respiratory diseases such as chronic obstructive pulmonary disease (COPD).
Considering the aforementioned issues, this paper presents the analysis and adaptation of a commercial pulse oximeter to collect the data in a conventional smartphone. The starting point of this work is a commercial device that offers limited vital signs, and we performed inverse engineering to decode the information provided to extract that information. From that, an android application was designed to analyze each received frame and calculate important parameters in health diagnoses, such as SpO2, PR/min, RR/min, PI, photo-plethysmography wave, the dicrotic fissure shape, and the area under the curve. The application is also able to analyze the series of collected data to determine important aspects in patients such as the right and left slopes of the captured signals and the dicrotic fissure through the shape and the area under the curve. This fact makes it different from commercial devices and provides it the necessary characteristics to be used as a quick diagnostic device in hospital, domestic, or geriatric environments. The entire system has been tested by different people to check its correct operation, and the results have been analyzed by a doctor to validate the results.
The rest of the paper is structured as follows:
Section 2 presents the related work. The description of our proposal as well as its principles of operation are explained in
Section 3.
Section 4 shows the results measured for our system and how to understand the values offered. Finally,
Section 5 exposes the main conclusion and directions for future work.
2. Related Work
This section presents different works related mainly to pulse oximetry. Various experts carry out these works where low-cost pulse oximeters and mobile applications are used to monitor oxygen saturation and other highly relevant parameters such as body temperature and heart rate, among others. With the presentation of these works, the importance of establishing low-cost systems that allow patient-monitoring is shown to alert the doctor of any mishap so that a user without any apparent disease can have their vital signs controlled.
In 2016, Uysal et al. [
11] developed a system of wireless sensor networks (WSN) because they are low-power and low-cost systems. This architecture supports grid, mesh, star, and hybrid star-mesh. This work has designed a heart rate monitoring system using a Bluetooth-based WSN. To do this, the patient’s SpO
2 data are received wirelessly through the Arduino to the personal computer using HC-05 Bluetooth. A graphical user interface (GUI) designed with the MATLAB program has been used to simultaneously observe the heart rate data. In 2018, Adiputra et al. [
12] implemented a system in which a device designed to measure SpO
2 and heart rate is connected to an MCU node as a data processor and Internet network gateway to support the internet of things (IoT) applications. This allows online and real-time data to be viewed by both patient and doctor, and the hospital itself due to the website. In addition, these data are recorded in the cloud allowing them to be analyzed later. This enables us to see the evolution of the patient. An oxygen saturation error of ±1.5% and a heart rate error of ±2.8 bpm were obtained. After doing the test 15 times, a delayed result of 3 s was obtained.
In 2019, Niswar et al. [
13] presented the design of a low-cost portable medical device. This device allows the patient to measure their heart rate, blood oxygen saturation level (SpO2), and respiratory rate. To do this, the device includes two biomedical sensors and a microcontroller. In addition, it has a sensor that establishes the temperature of the airflow; it is a thermal sensor. This device enables wireless patient monitoring from a smartphone through IEEE802.11 using a web browser. This way, a portable device is developed with reliability that can be achieved with a standard commercial device for measuring these parameters. In addition, the elements used are low-cost. These are available in the market within reach of low-resource settings.
In 2020, Bakhri et al. [
14] also developed a low-cost pulse oximeter using two LEDs, one red (660 nm) and one infrared (940 nm). This way, they could quantify the total hemoglobin saturation using the captured wavelength. In addition, they added a light that passes through the blood vessels captured by a photodiode. After the assembly of this system, the photodiode signal is sent to Raspberry pi. After processing the signal, an oxygen saturation value is obtained. The objective of this study, in addition to the low-cost assembly of a pulse oximeter, was to compare the accuracy of the error with a commercial pulse oximeter. The sensor used is a MAX30100 IC oximetry sensor. Finally, after testing the pulse oximeter with five volunteers, an error of 1.29% was obtained. These data are comparable with the commercial pulse oximeter, and its cost is low. The same year, Ali et al. [
15] established a health technology monitoring system comparing it to the ChoiceMMed pulse oximeter. This system measures heart rate, body temperature, and oxygen saturation levels. These data will be displayed on an LCD screen. In addition, the values obtained for oxygen saturation have been improved, taking into account the different skin tones of the person, as well as the width of the finger. Light emitting diode control circuits and sample and hold circuits have been used for this. Regarding the design of the system, the data obtained are transmitted to the mobile phone through Bluetooth and the mobile device through the use of the Wi-Fi module to the Internet. Due to its plug-and-play capability, this entire system is based on an Arduino system. The developed method can be used both at the hospital level and at home, and it can also be wireless. It shows that the proposed sensor device is exact, and the maximum deviation is 2%.
In 2018, Shanin et al. [
16] proposed a portable electronic device to record the patient’s health. This system was lightweight and inexpensive. Among the parameters subsequently monitored were the ECG, temperature, pressure, and heart rate. For this, different types of sensors were used. After obtaining the data, they are sent to the cloud through the Internet of Things (IoT). In addition, it has GPS, which helps track the patient’s location during an emergency. It also includes the medical reports of each patient stored in the cloud.
Marathe et al. [
17] also designed and developed a portable system to monitor patients. To do this, he used four different types of sensors integrated into a single system. This system is made up of an electrocardiogram (ECG) module, a blood pressure sensor, a temperature sensor, and a pulse oximeter module. Arduino has been used for system integration. The system collected the data obtained from the patient and obtained them via Wi-Fi to upload them to the cloud.
Finally, in 2021, Fachrurazi et al. [
18] created a portable device that was as small as possible (5.3 cm × 4 cm × 3 cm) to be able to monitor SpO
2 and heart rate (in bpm) at any time, even during sport. The user can view the collected data through the Android application. These data are transmitted through Bluetooth Low Energy (BLE). The sensor used as an oximeter was the MAX30100, and nRF52832 was used as a microprocessor and communication module. The obtained results of the average accuracy of SpO
2 and bpm were 99.59% and 97.14%, respectively. In addition, it was tested after waking up and exercising, getting an accuracy of Sp02 of 99.72% and bpm of 98.34%. The battery of the device lasts 8 h and 33 min.
In addition to these systems based on monitoring oxygen saturation and heart rate, in 2017, Ramirez-Alaminos et al. [
19] presented a low-cost system to monitor patients with epilepsy, a neurological disease. It is a glove with sensors that allow data to be captured on parameters such as temperature, heart rate, and limb movements. They highlighted the importance of the early detection of this disease, which can even cause death. For this, the developed device transmits the occurrences of the seizures to the mobile phone. This way, the medical personnel and the relative are notified using a call or SMS. In addition, the parameters can be saved to have a patient follow-up. The system is based on the Arduino LilyPad board. In this prototype, the board is responsible for collecting data, monitoring information, and transmitting it to the smartphone via Bluetooth. In this case, the system collects data every 30 s.
In 2020, Botella-Campos et al. [
20], after the appearance of the pandemic caused by COVID, developed a non-invasive wireless mobile system for the monitoring and follow-up of elderly people in residences. In addition to measuring oxygen saturation, this system can measure cough, temperature, heart rate, and shortness of breath, among other vital signs. The data management is done through an Android application. These data can be saved in a local system of the residence so that the doctor can store them and monitor the patient. Finally, the application has an alarm system to alert the doctor and family members of critical and anomalous situations that may arise—classifying the patient according to the level of urgency.
Finally, the use of this kind of devices are usually combined with the use of neural networks of modern techniques of machine learning. This is the case with Daskalos et al. [
21], who developed a wearable device to monitor patient body temperature and environmental conditions. In this way, the presence of COVID could be alerted through the developed application and the established alarm system. To rule out that the rise in body temperature was due to physical exercise, a “continuous displacement algorithm” based on an accelerometer was used. They used the BLE 5.0 Protocol for wireless data transmission and low power consumption. On the other hand, a 1D convolutional neural network (CNN) was used to classify whether the user had a fever or not while considering if they were engaged in physical activity.
As the presented works show, the development of low-cost devices for health monitoring is an important topic. However, these systems have been developed as new products. Our proposal is based on the use of commercial devices and adapting them to be used for monitoring patients. The presented devices present limited ranges of measurements and in most cases, they use their own application. On the other hand, the applications developed are not normally open-access, and specific licenses are needed to be able to use them. Our application is capable of processing the waveforms to interpret them and extract parameters such as the photo-plethysmography wave, the dicrotic fissure shape, and the area under the curve, which are important parameters to detect many diseases, especially in problems related to the heart or respiratory system.
3. Proposal Descriptions
This section presents the proposed system, as well as the hardware and software used to develop it. This section also includes the process followed to extract the data from the commercial oximeter and the different parameters it can measure.
3.1. System Description
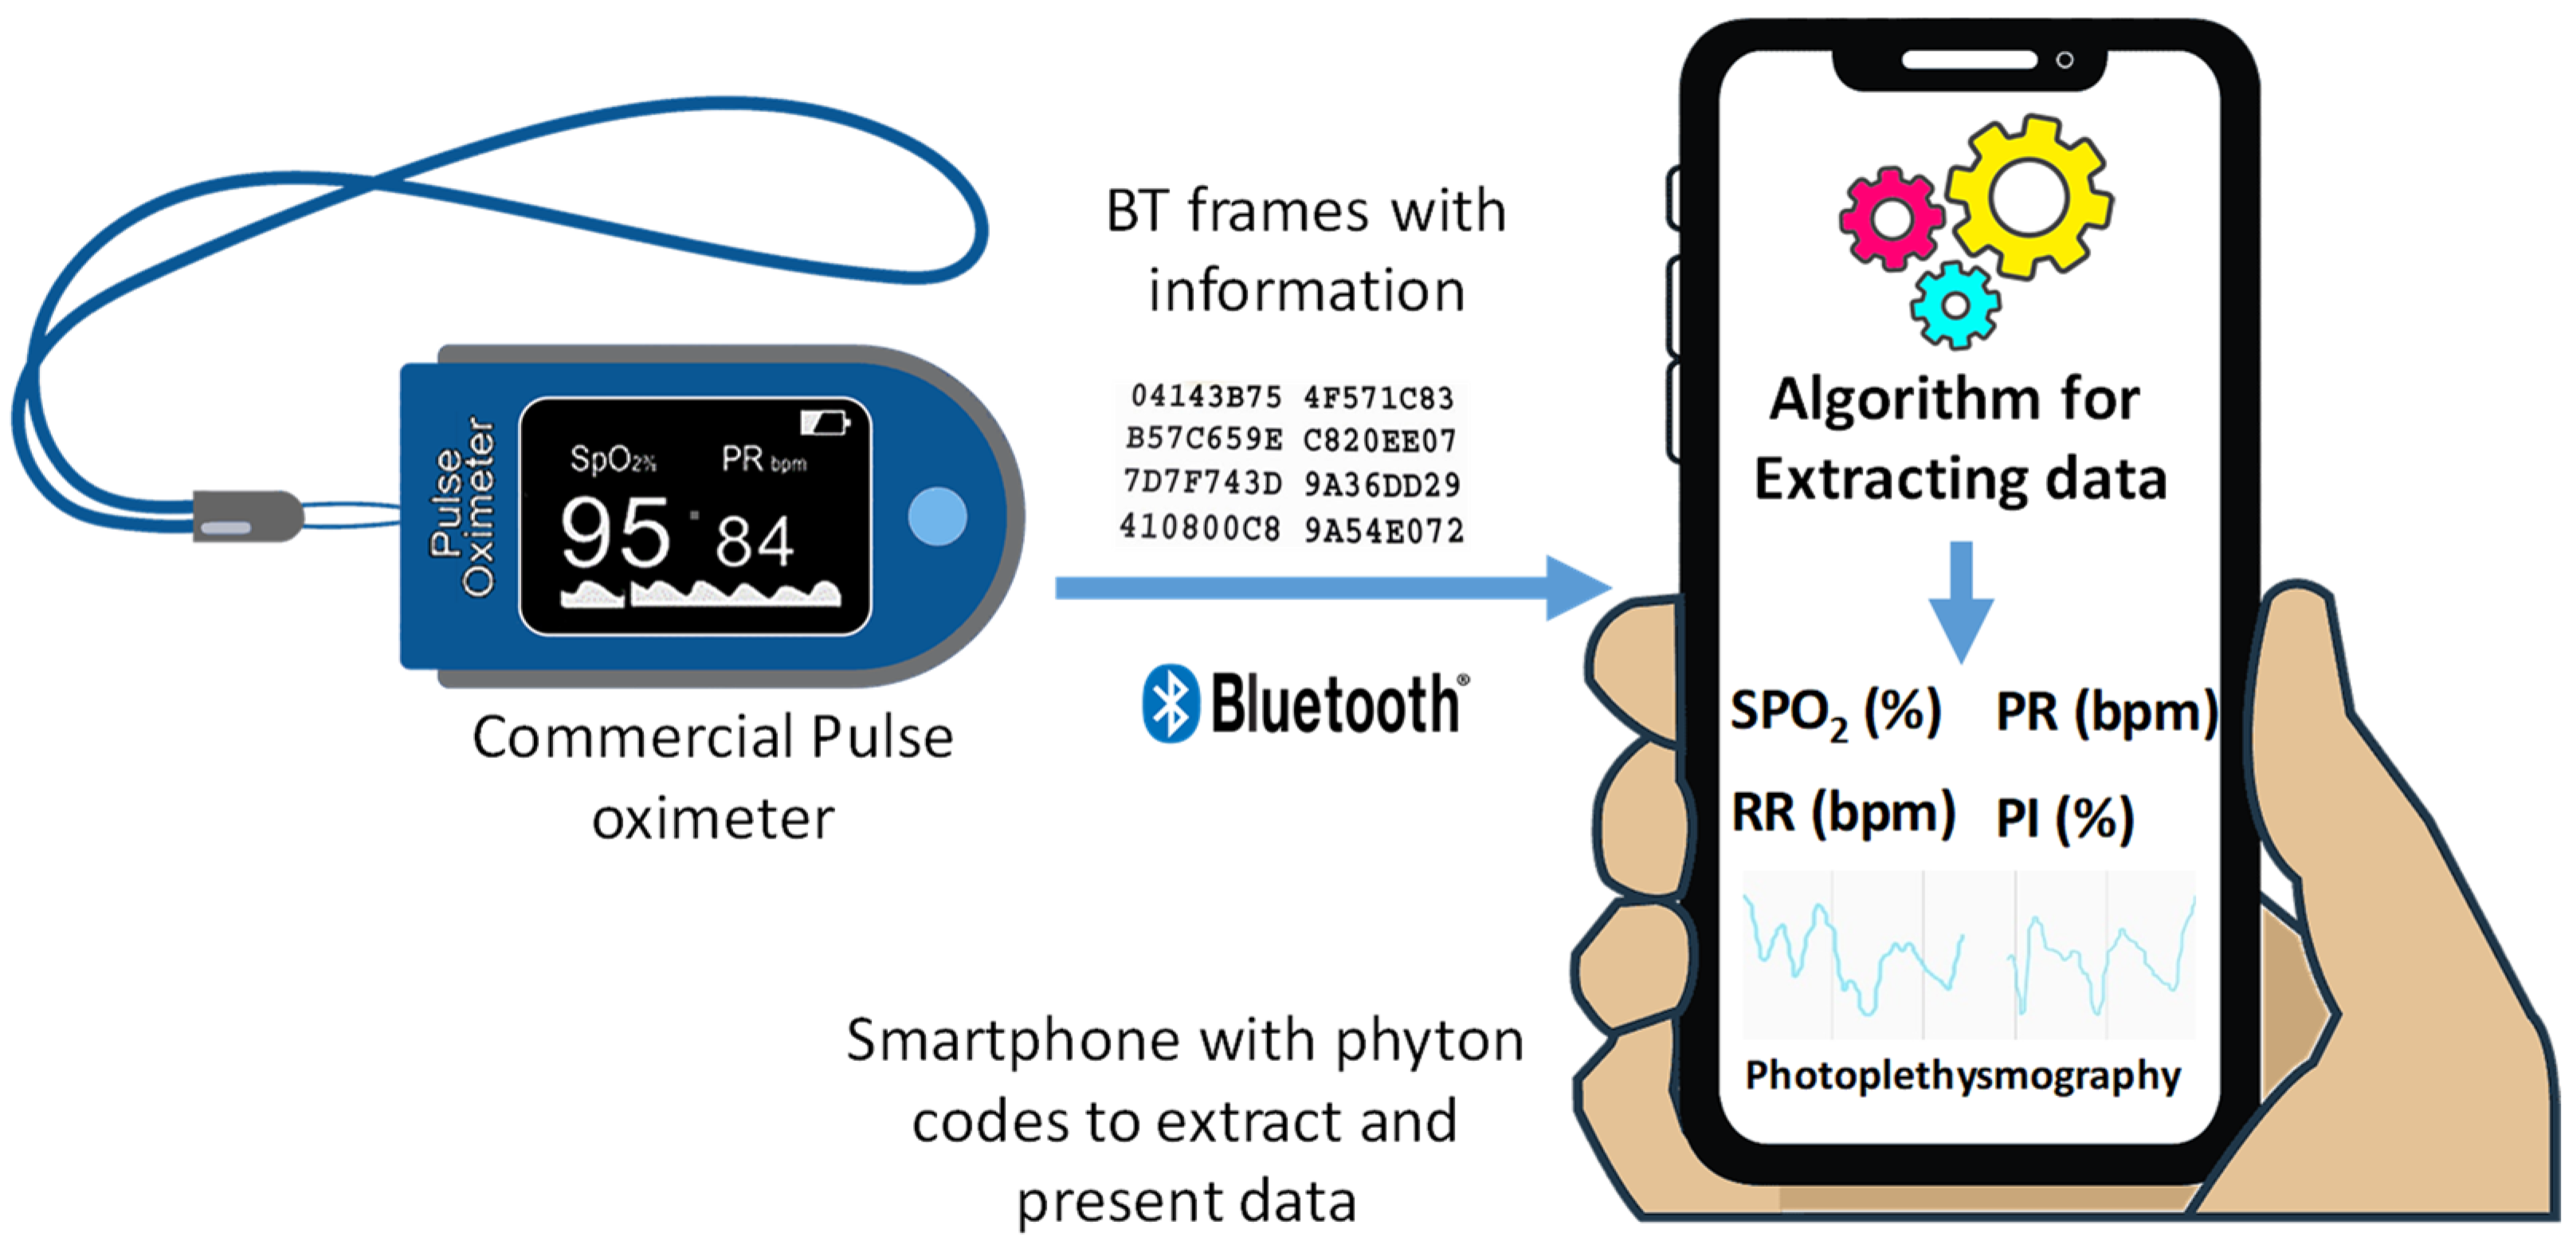
As we have analyzed in the introduction section, one of the most important facts in hospitals and nursing homes is the possibility of having cheap monitoring devices that can quickly detect abnormal episodes and thus provide the patient with the required care. Therefore, this proposal is based on the use of a commercial pulse oximeter from which we collect the data measured to be analyzed in a smartphone. The smartphone contains a customized application able to decode the data from the pulse oximeter to finally represent it in a graphical format.
Figure 1 shows the diagram of our proposal.
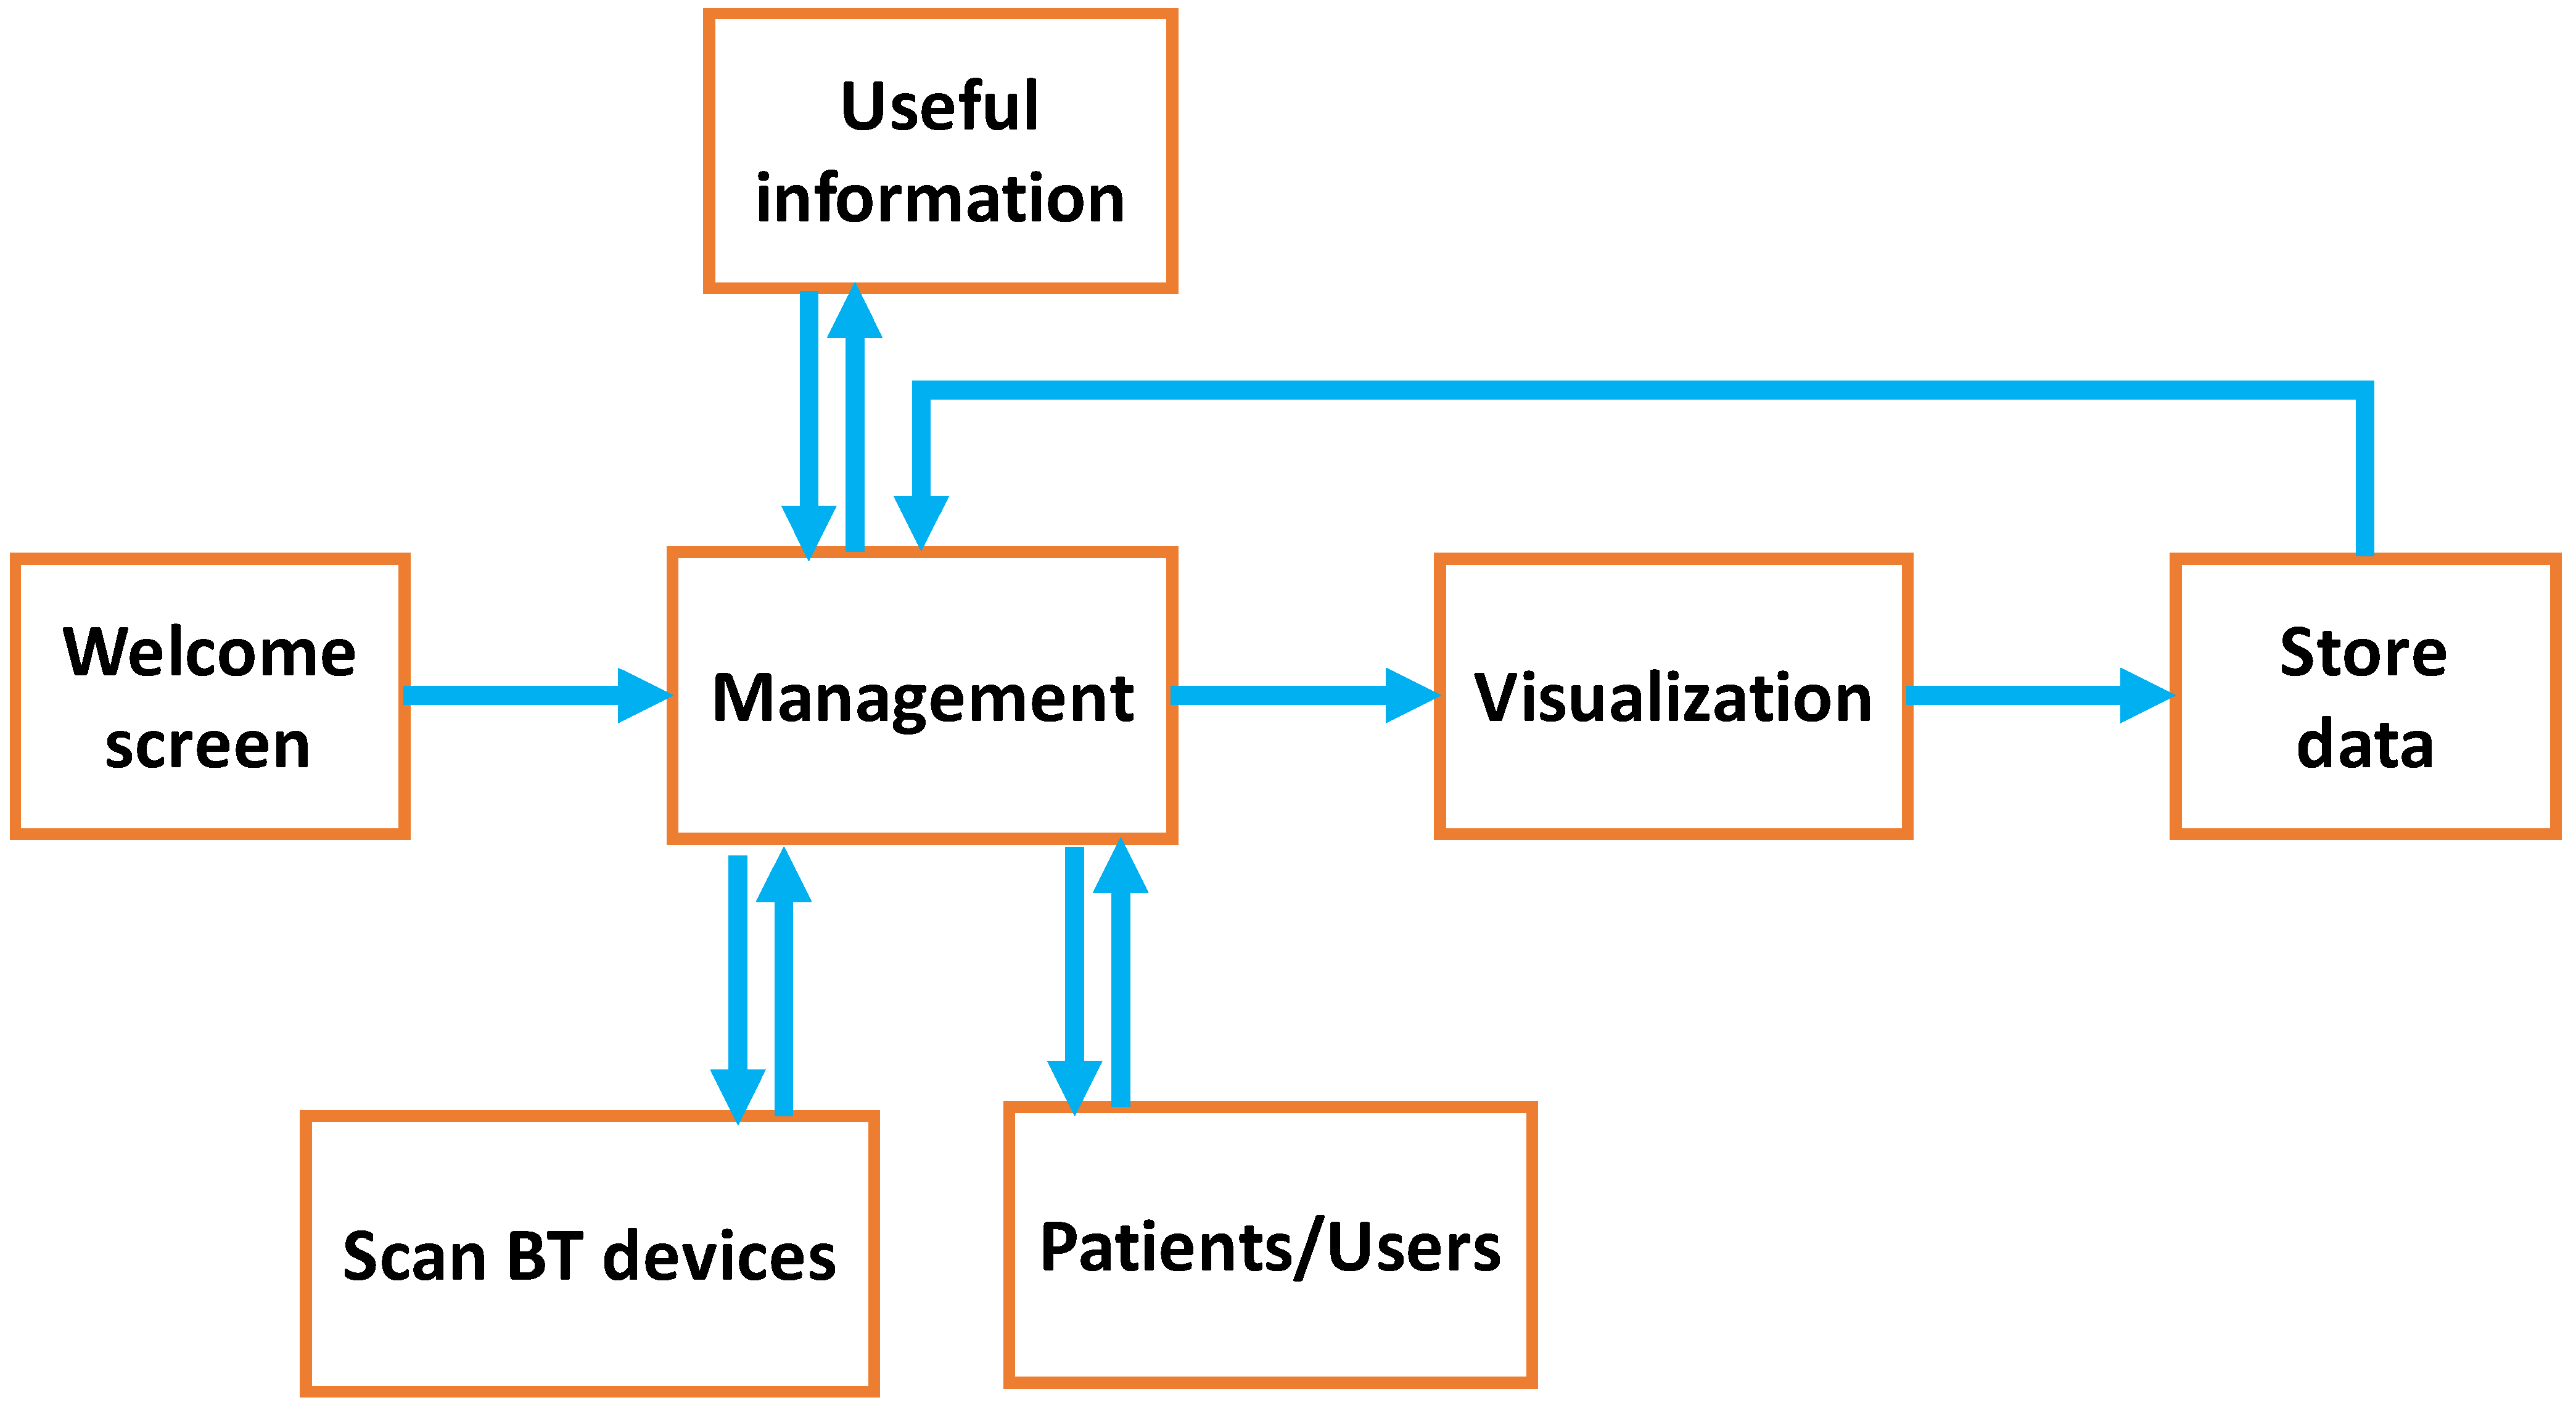
The design of the application (see
Figure 2) is based on six screens through which the user can manage different patients, read information about the correct way to take the measurements, and save the data.
Welcome window: When the application starts, we will see a loading screen with the application logo. After 4 s, the application redirects the user to the main page;
Management: This is the main page of the application. In it we find different accesses to sub-tasks. The first option allows the scanning of nearby Bluetooth devices. The second option allows access to the monitored users while the third option takes us to the useful information window;
Patients/users: This window allows us to see all the patients for whom data has been saved and consult them;
Scan BT devices: This window allows scanning available devices and selecting one of them to connect. When the device is successfully connected, we will be redirected to the visualization screen. If not, we will remain on this screen until the user closes the application or a valid connection is registered;
Useful Information: This window shows relevant information regarding the use of the device and how to take the measurements;
Visualization: This is the important window of this application since the collected and processed data are shown in a simple way to permit the correct understanding of them;
Data Store: When we finish the process of collecting the data, the data can be stored by pushing the button. To save the data, we will specify the name of the patient. Finally, when data are already saved, the application we will return to the main page.
Packets generated by our commercial pulse oximeter are encapsulated into Bluetooth BLE frames. Those frames are sent to the smartphone which contains an android application developed to extract the frames’ payload, process it, and show the average values of SpO2, PR/min, RR/min, and PI. Additionally, the application is able to show the photo plethysmography wave where light absorption is measured, as well as the dicrotic fissure shape and the area under the curve from which important information can be extracted.
3.2. Pulse Oximeter Used in Our Proposal
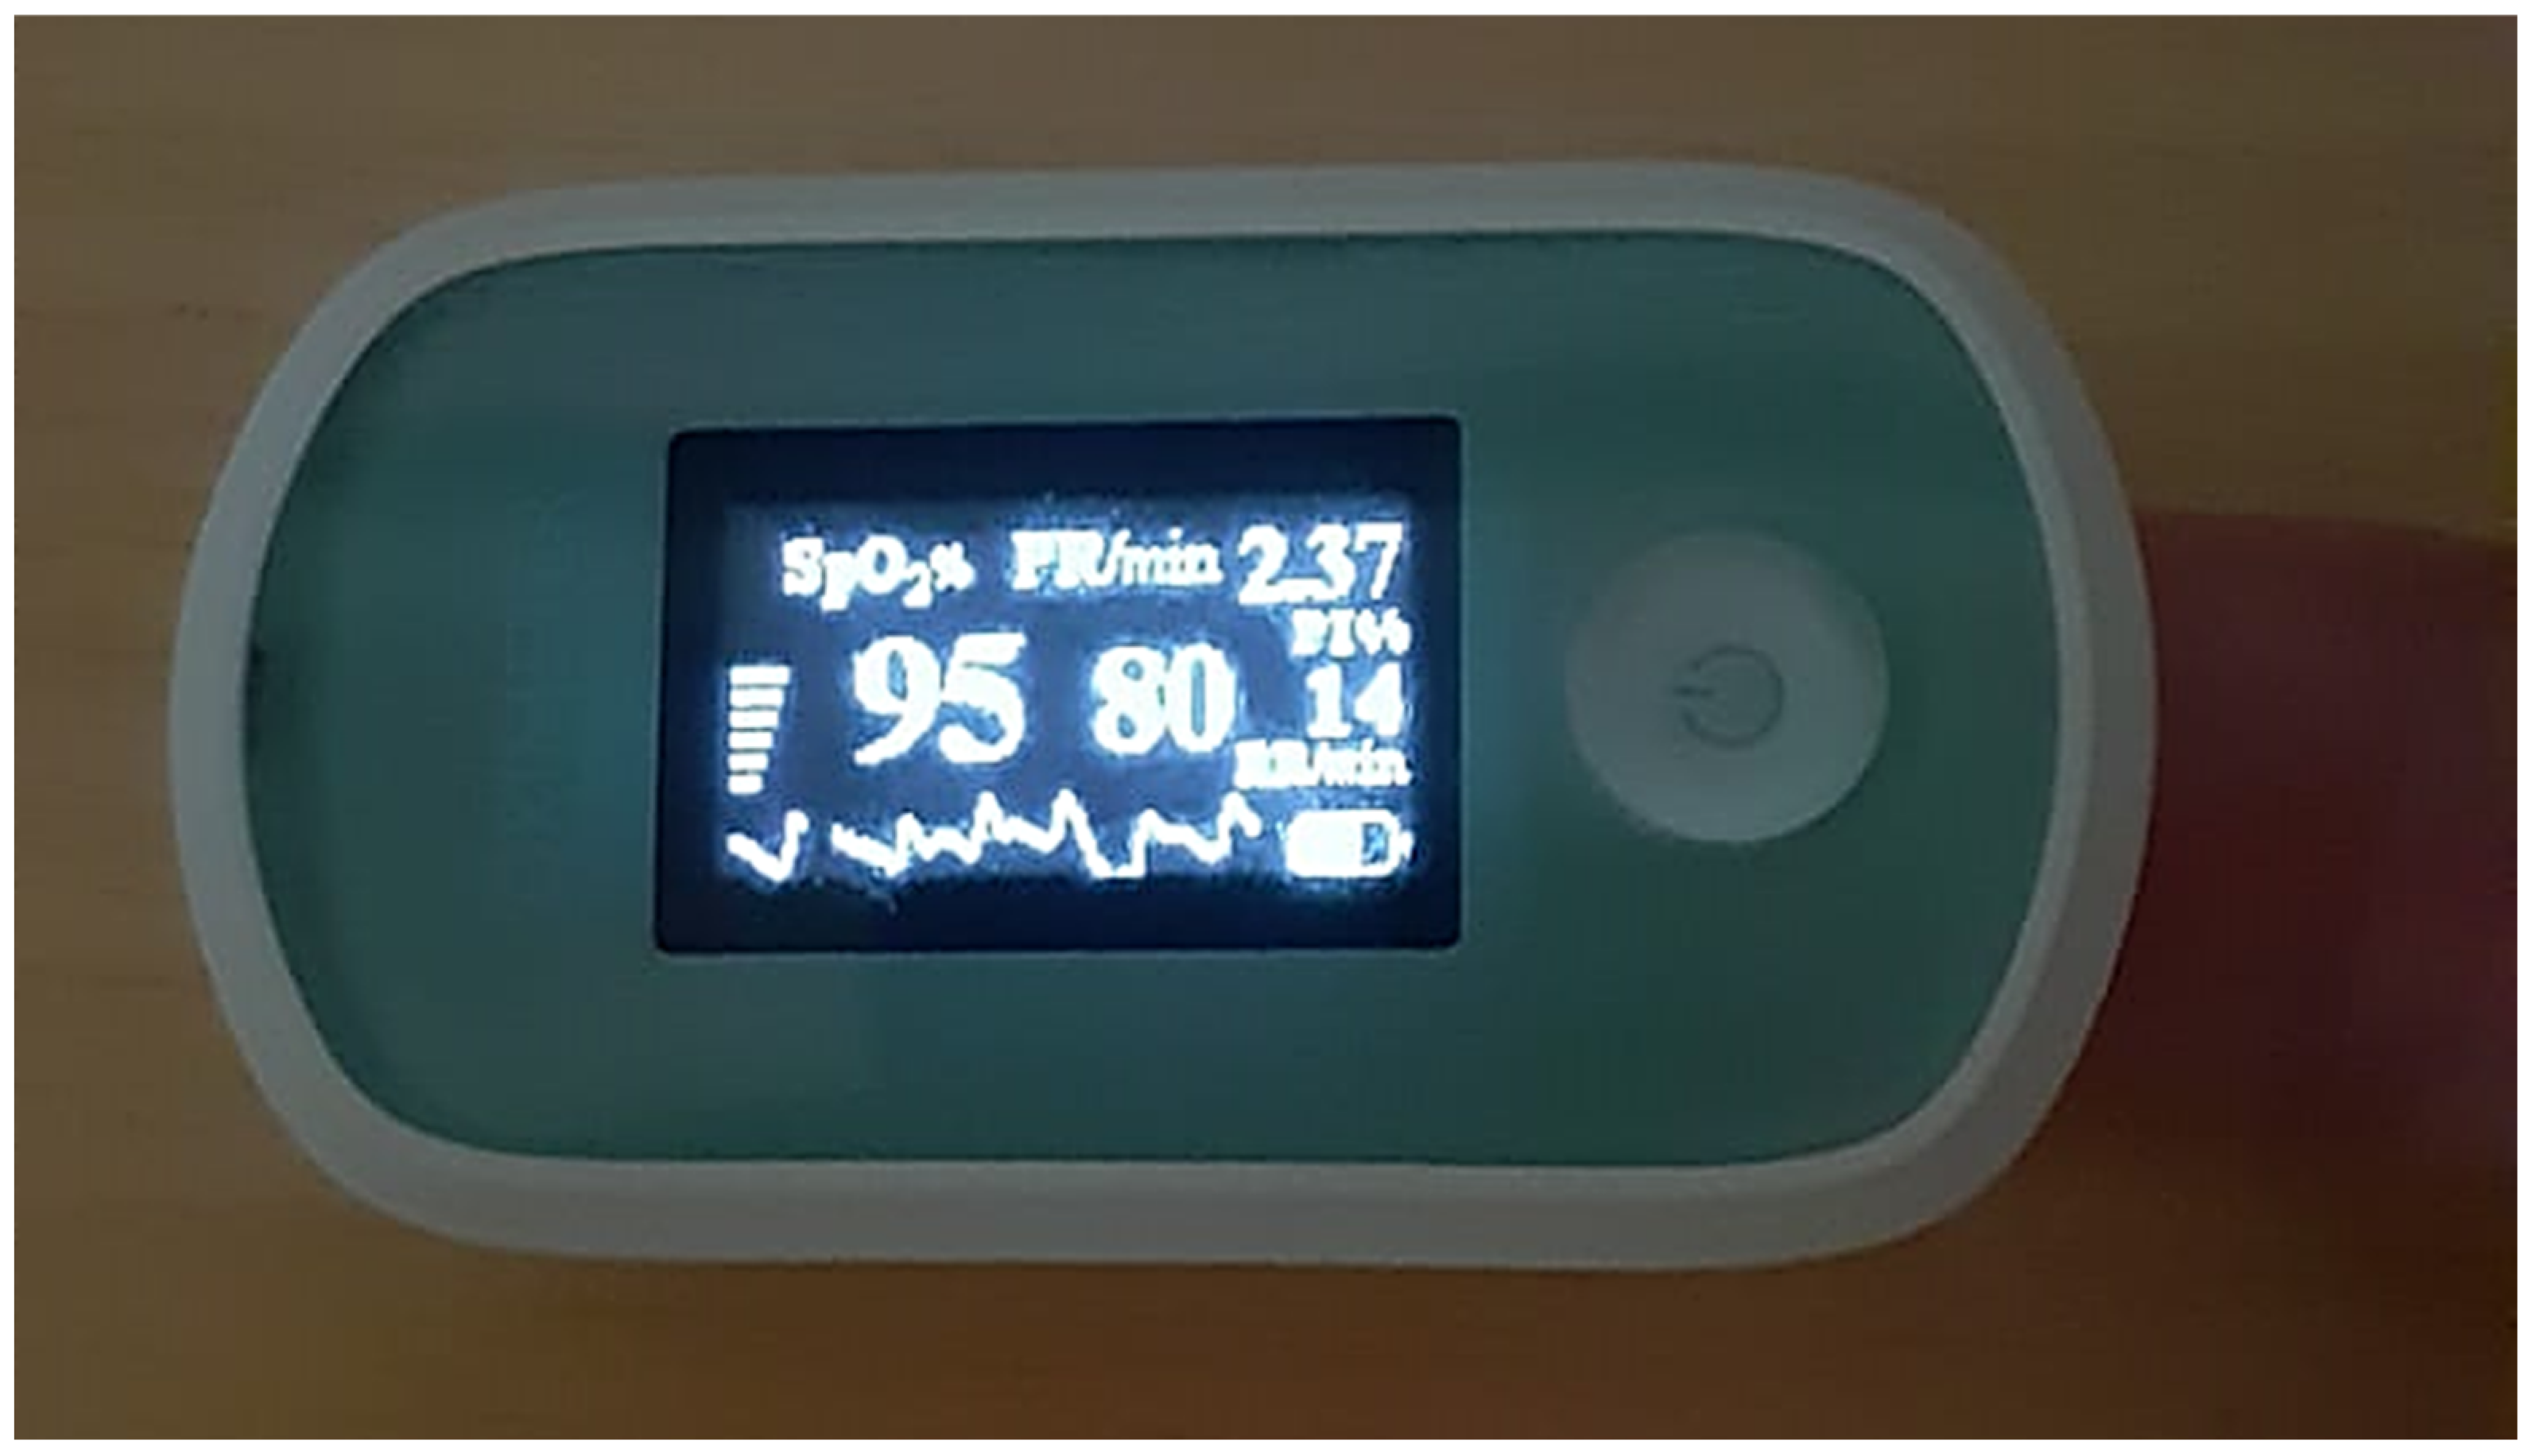
In order to develop our low-cost monitoring system, we selected a commercial pulse oximeter with a Bluetooth BLE connection, compatible with the Android operating system. It has a size of 58 mm × 32 mm × 34 mm, and it is capable of measuring the following parameters:
SpO2 (%): Blood oxygen saturation measured in %;
PR/min: Beats per minute;
RR/min: RR interval;
PI (%): The perfusion index, measured in %.
The SpO
2 (%) measurement range is between 70% and 100% with an error of ±2%, while the pulse measurement range is between 25 bpm and 250 bpm with an error of ±2 bpm. Finally, the weak perfusion performance is 0.025%, being possible to measure values within the range of 70 to 100%, with an error of ±2%. This model is capable of compensating for movements of 0 to 3 cm. It also contains an OLED screen where the user can observe the measured mean values.
Figure 3 shows the pulse oximeter used.
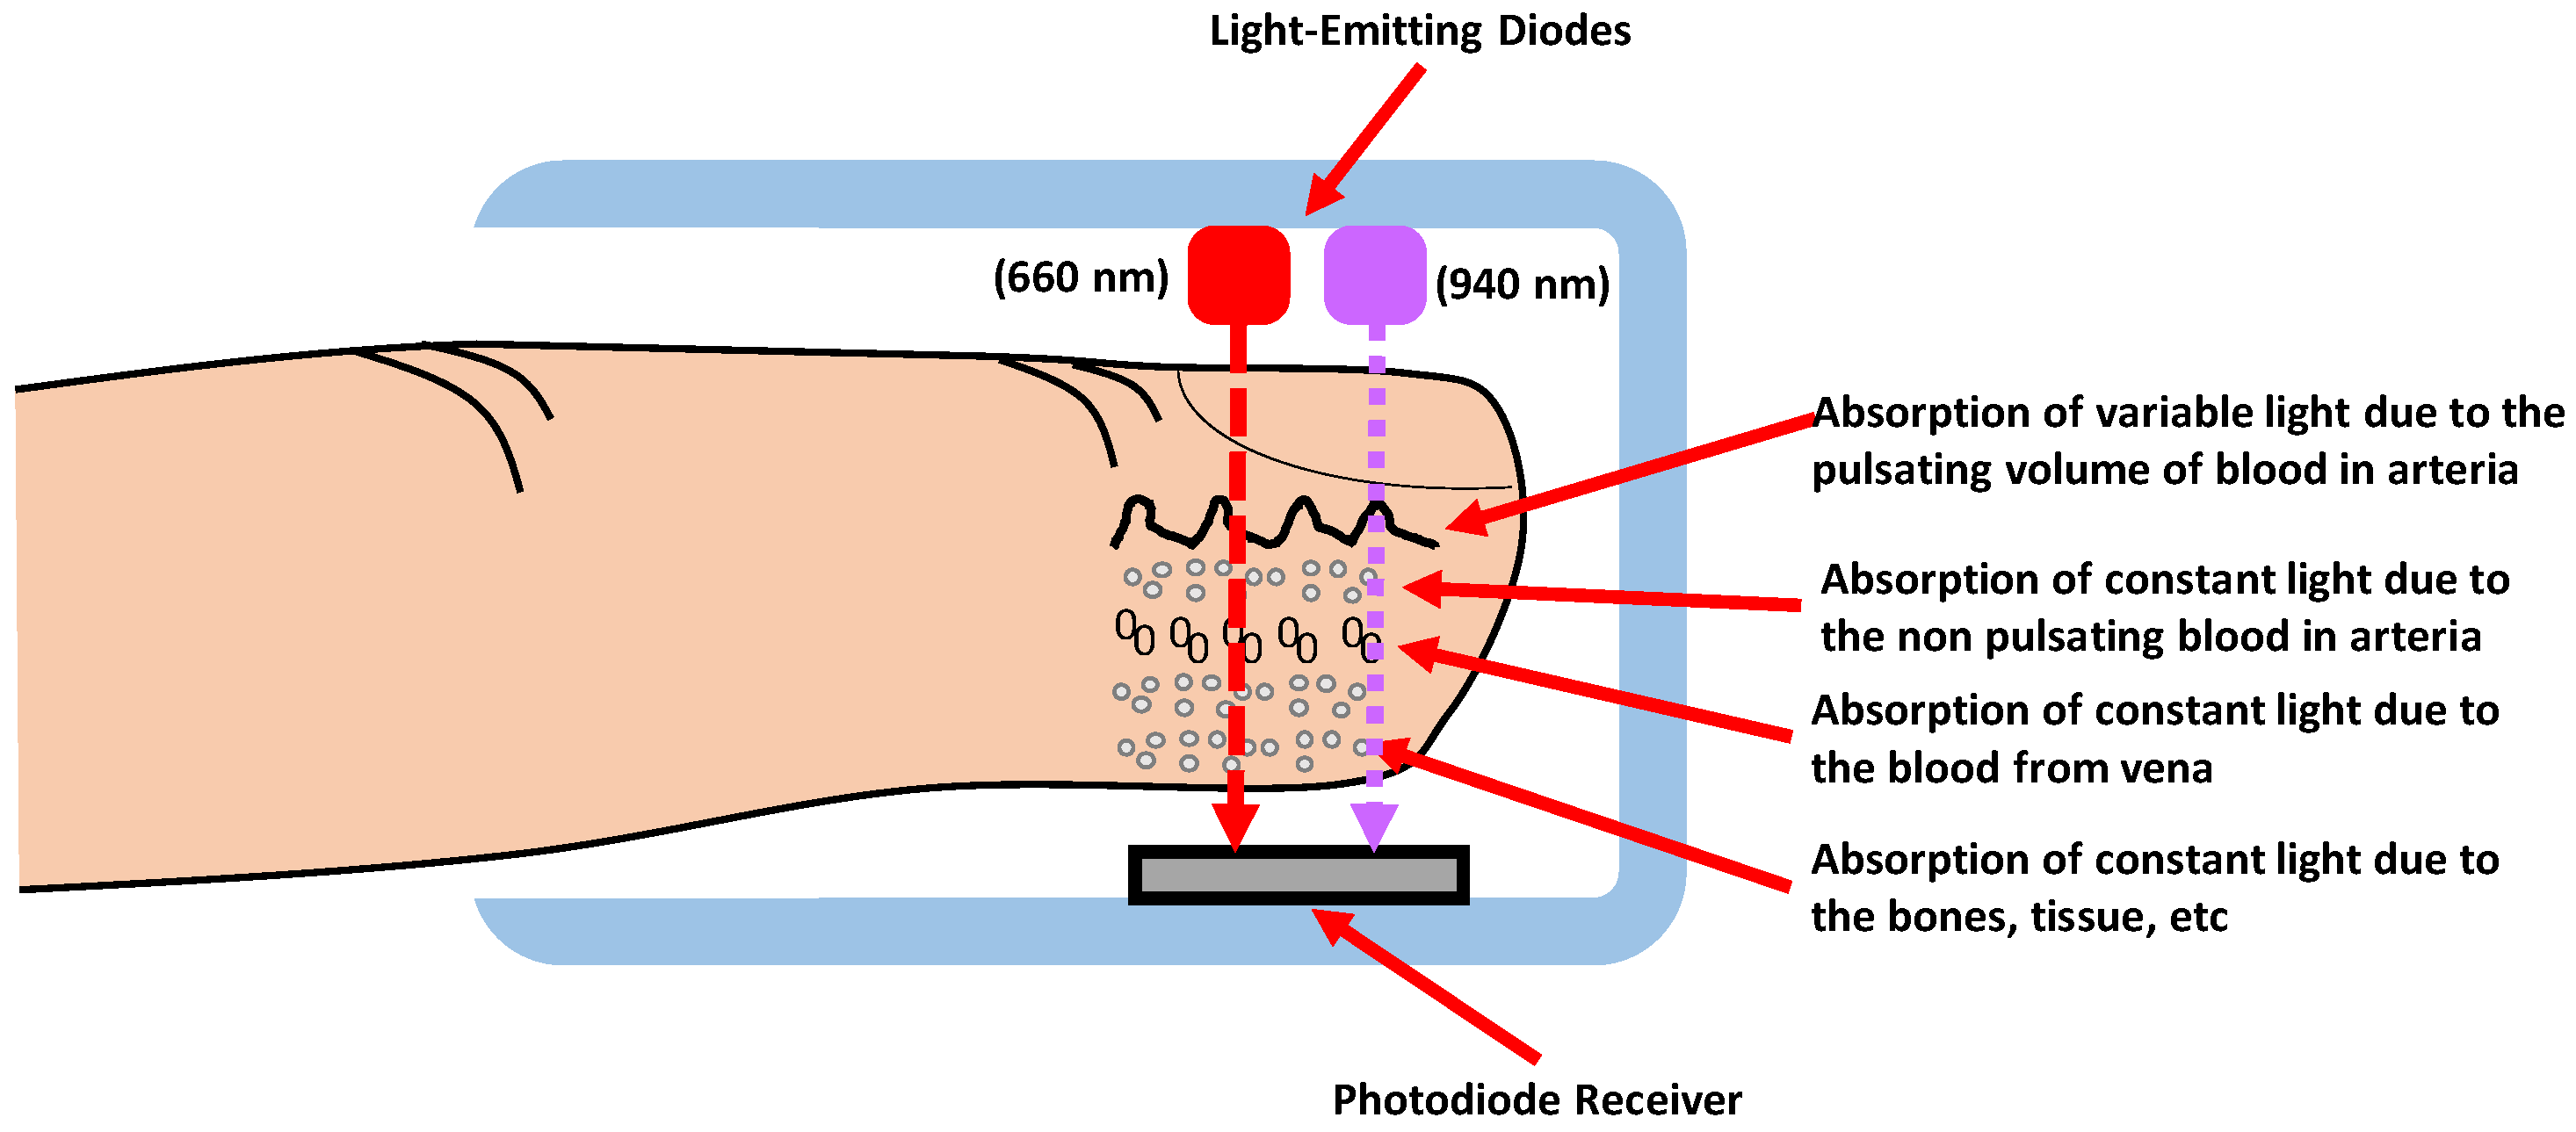
Pulse oximetry is based on the estimation of oxygen saturation in the blood using spectrophotometry. This measurement refers to the measurement of the amount of radiant energy that an element can absorb, in this case, the hemoglobin present in the blood.
The hemoglobin that carries O
2 is called Oxyhemoglobin. Oxyhemoglobin absorbs red light (640–660 nm) and lets infrared light (910–940 nm) pass through. On the other hand, deoxyhemoglobin carries CO
2. It absorbs infrared light; however, it lets red light pass through. The operation of the pulse oximeter is based on this principle, and it uses two light emitters, i.e., light diodes with wavelengths of 660 nm (red) and 940 nm (infrared). The emitter’s LEDs will be controlled by a pulse synchronized with the photodiode, which will be in charge of measuring the amount of light absorbed.
Figure 4 shows the diagram of the placement of the emitting diodes and the photodiodes, in which the light waves of each length pass through the finger. These light waves will vary according to the hemoglobin.
3.3. Reverse Engineering Process Used to Read and Extract Data from the Pulse Oximeter
A commercial device usually preserves the code and technology by using closed protocols to avoid debugging itself and copying the product. This fact makes the extraction of data, in any other way different from its application, difficult. Therefore, the Bluetooth traffic is captured by a specific sniffer for smartphones. The values are compared with real shapes to identify which parameters are represented. In addition to this, it is also important to know how services in BLE are used to encapsulate the information.
3.3.1. Bluetooth Low Energy
Nowadays, it is possible to buy pulse oximeters at very low prices with quite good performance. In some cases, they contain a wireless interface such as Bluetooth Low Energy (BLE) [
22], also known as Bluetooth Smart, which was introduced as part of the Bluetooth 4.0 specification.
BLE permits the exchanging of information through the use of Generic Access Profile (GAP) services. GAP is in charge of controlling the connections and announcements in BLE and permits a device to be public to the outside. GAP also determines how two devices can interact with each other. There are two ways of sending information through GAP, i.e., the advertising data payload and the scan response payload. Both payloads are identical and can contain up to 31 bytes. Nevertheless, only the first case is mandatory because this payload is continuously transmitted from the peripheral device to allow the central nodes in the coverage range to know about its presence. When a peripheral device wants to transmit, it emits its advertising data payload at periodic configurable intervals in which the peripheral device emits an advertising data payload.
When two BLE devices want to communicate using the Services and Characteristics, these devices should use the Generic Attribute Profile (GATT). GATT ensures that a dedicated and exclusive connection has been established between two devices that were previously connected through the GAP.
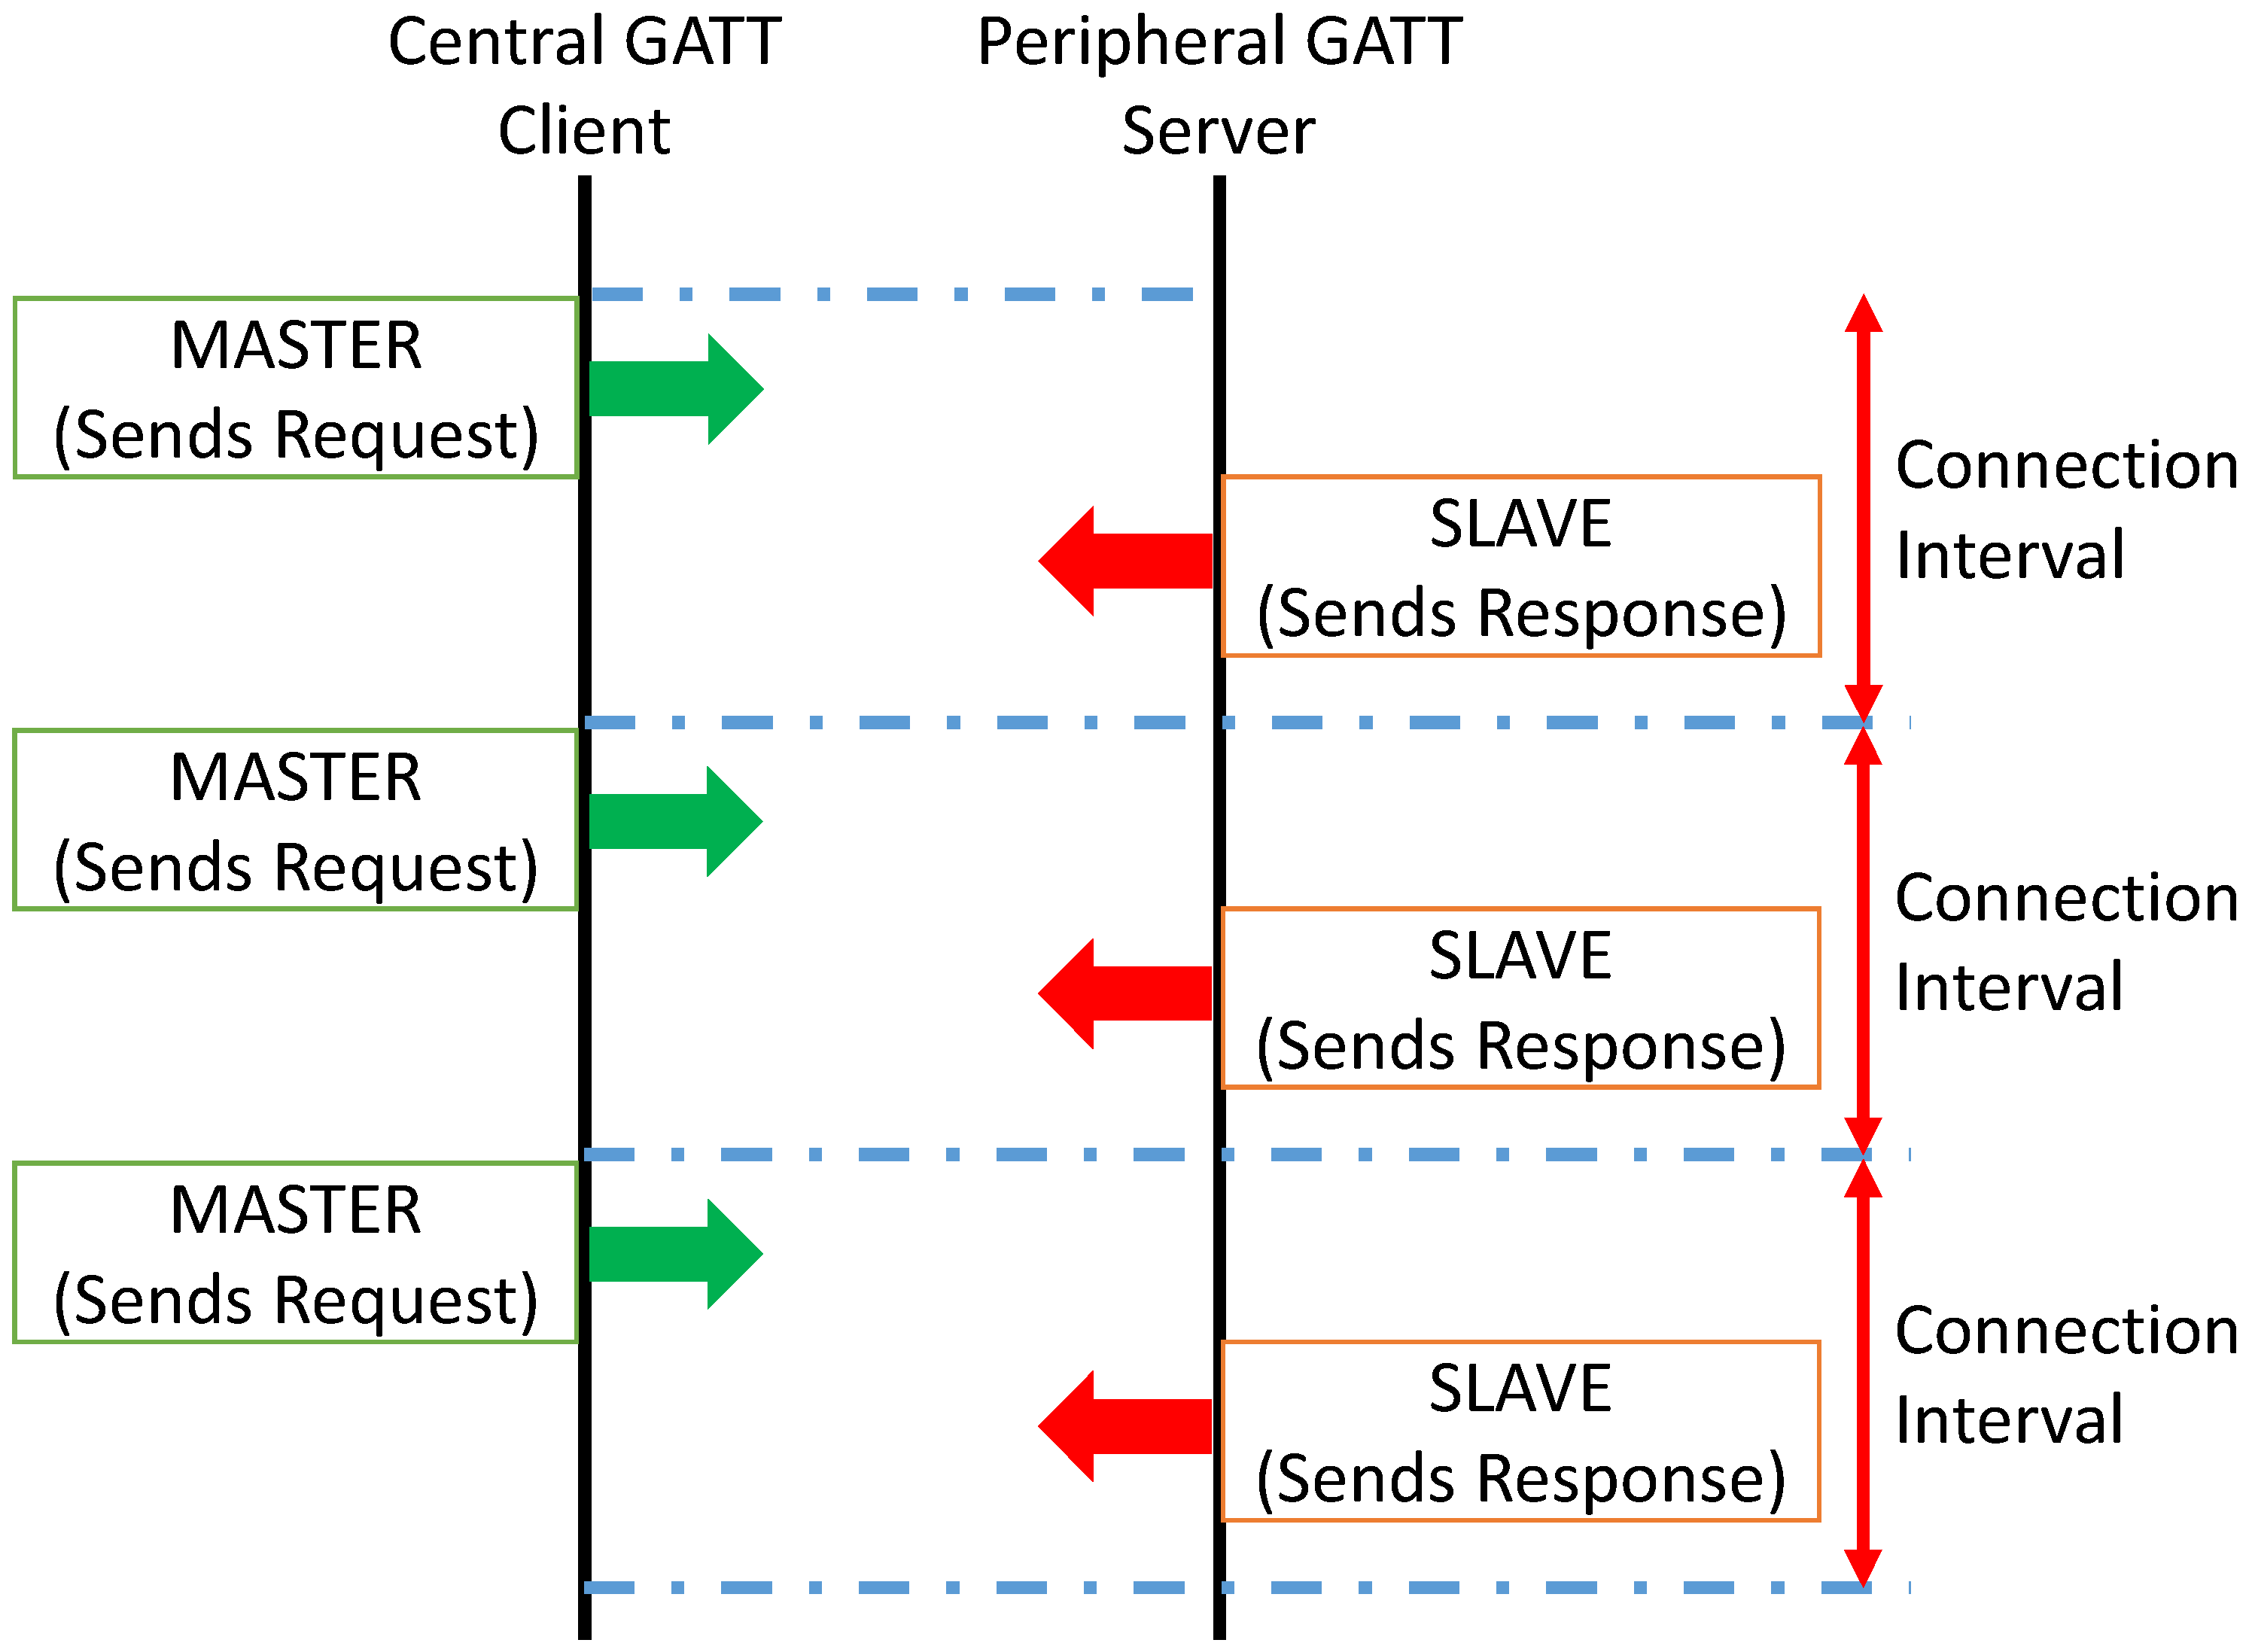
GATT transactions are based on the server–client paradigm. The peripheral device that acts as the GATT server contains the ATT protocol lookup data and the service and characteristic definitions, while the GATT client (typically a phone/tablet/gadget/etc.) is in charge of sending requests to this server. The ATT protocol is used to store related services, characteristics, and data in a table using 16-bit identifiers for each entry in the table.
Transactions should be initiated by the master device, i.e., the GATT Client which receives the response from the slave device, that is, the GATT Server (peripheral). The following diagram (See
Figure 5) shows the process of exchanging data between a peripheral and a central device.
BLE peripheral does not have a profile. Instead, it exists a predefined collection of Services specified by Bluetooth SIG or by the manufacturer. For example, the heart rate profile combines the heart rate service and the device information service.
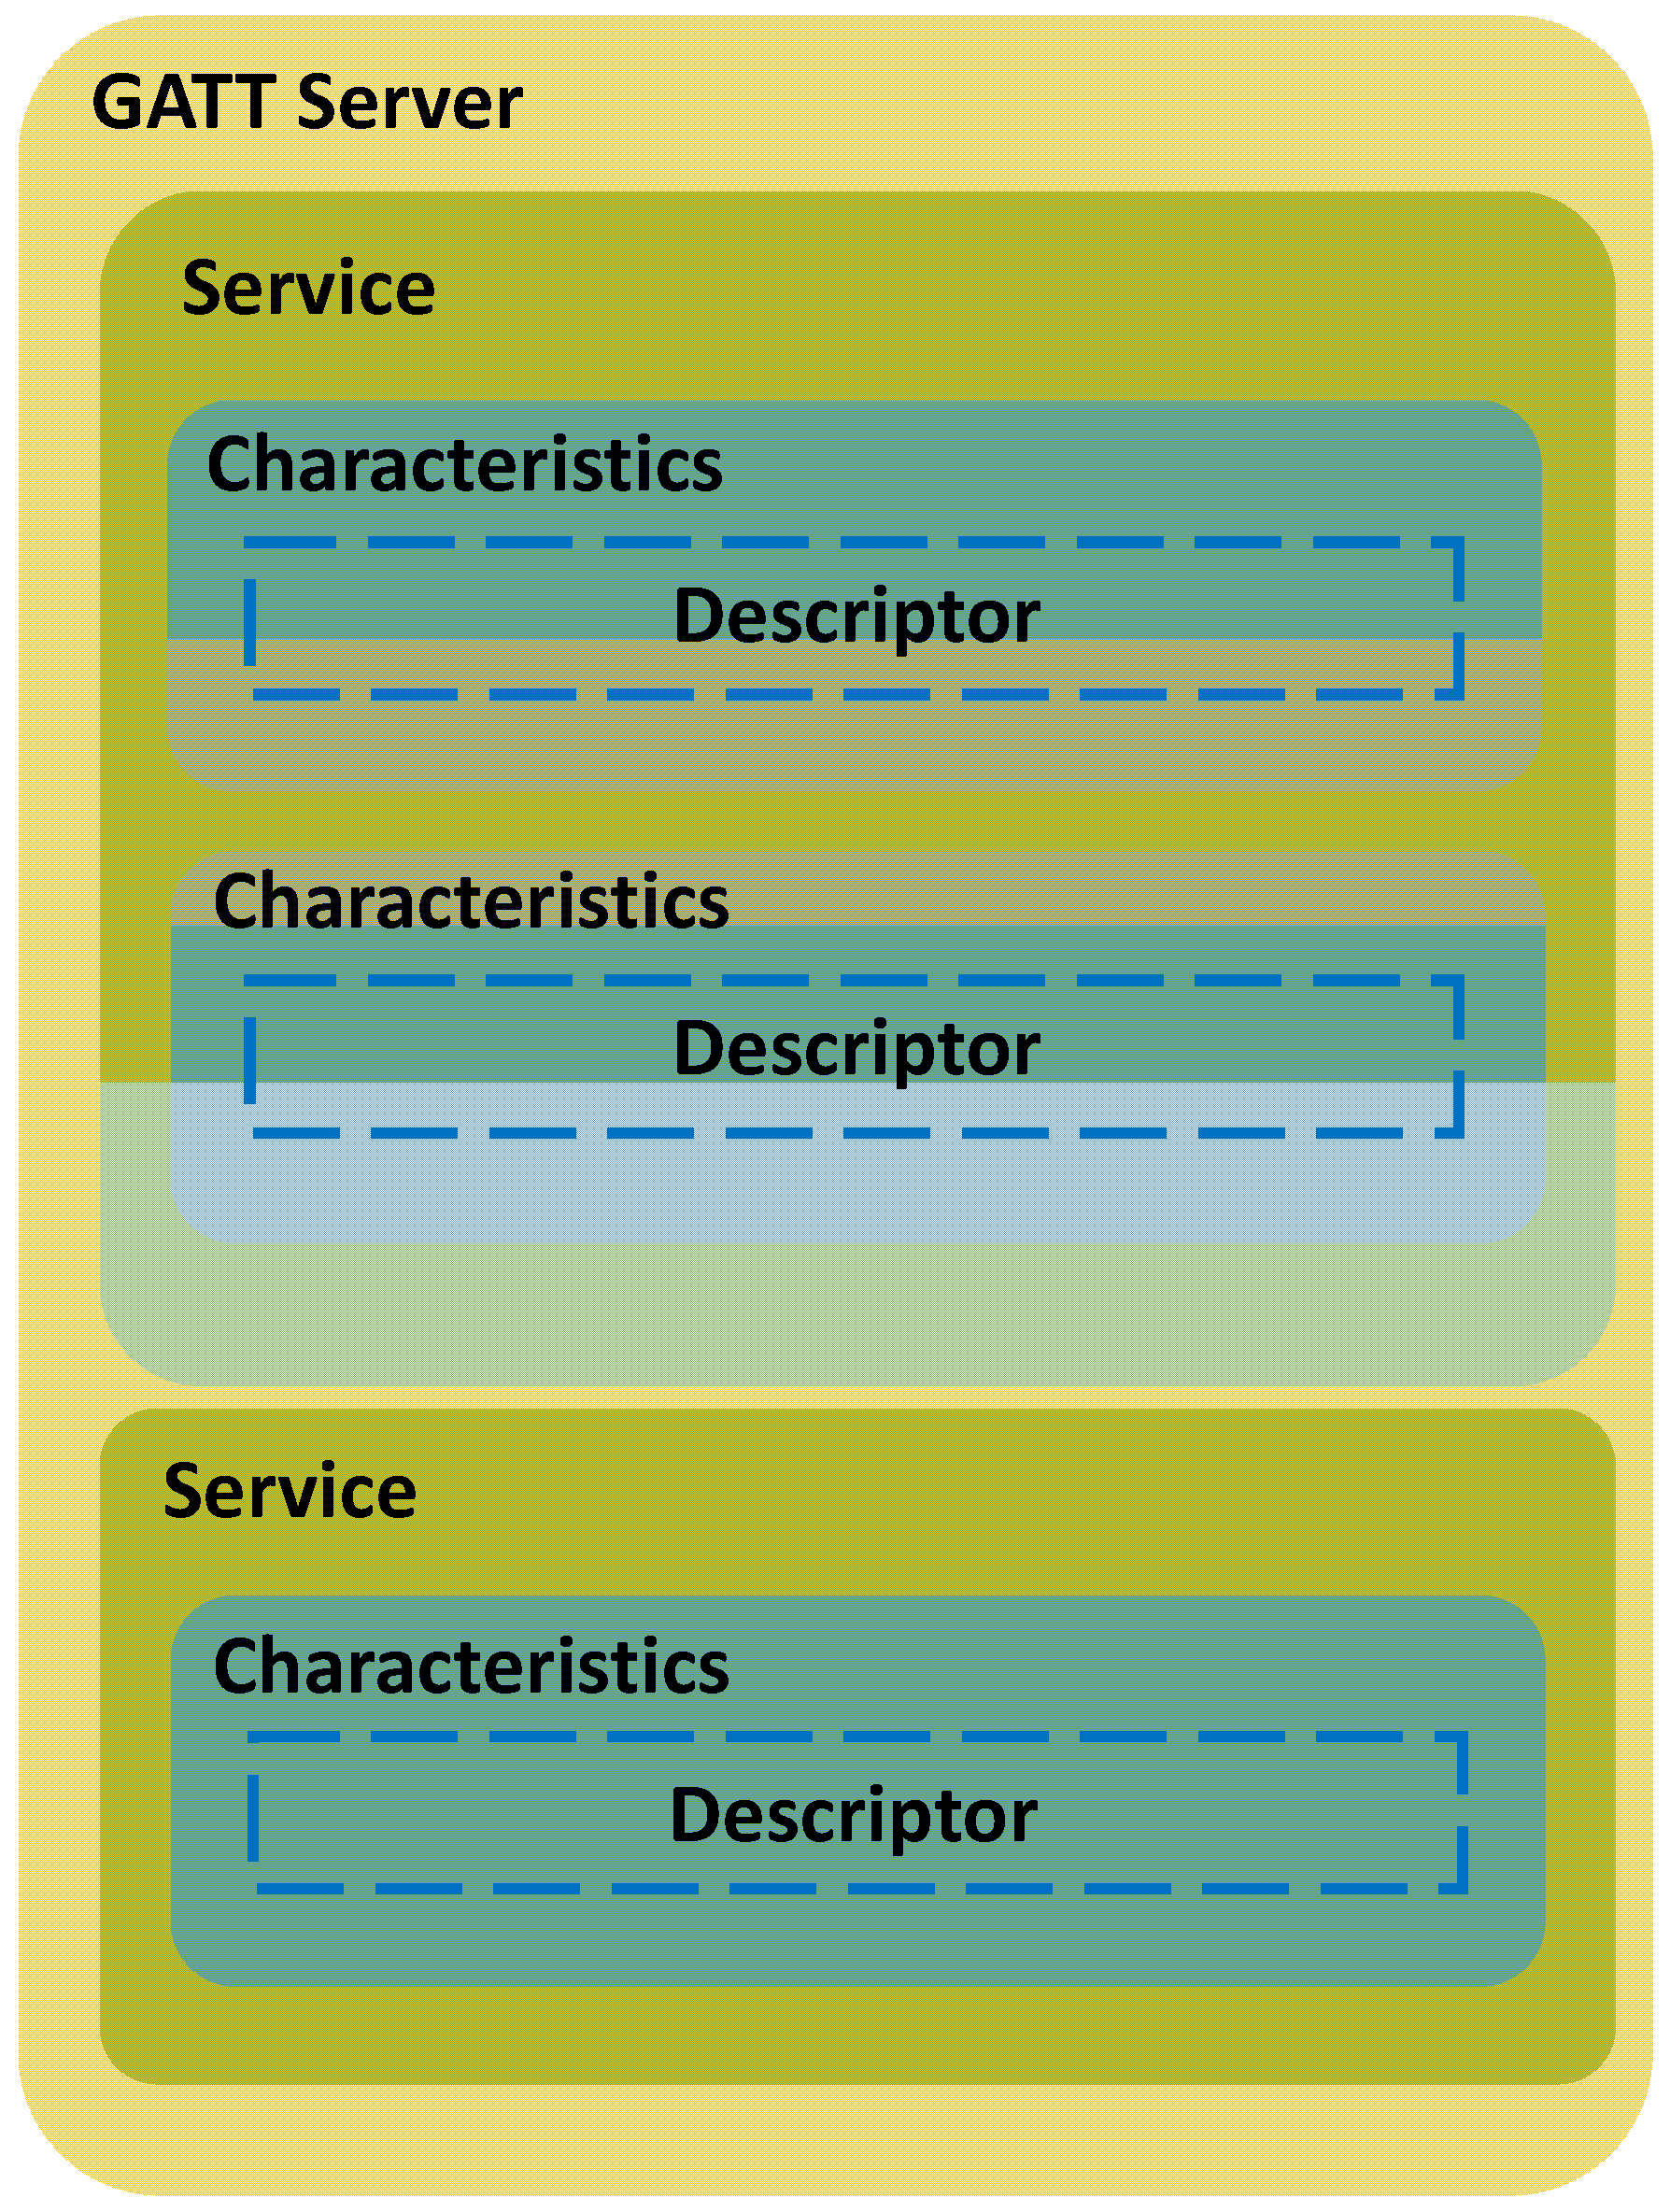
Services are used to divide data into logical entities and contain specific pieces of data called characteristics. Finally, Characteristics encapsulate a single data type; however, it can contain an array of related data, such as the X-Y-Z values of a 3-axis accelerometer.
GATT transactions in BLE are based on the nested high-level objects called Profiles, Services, and Characteristics, which are related as follows (see
Figure 6):
3.3.2. Application Developed to Extract Data from a Commercial Pulse Oximeter
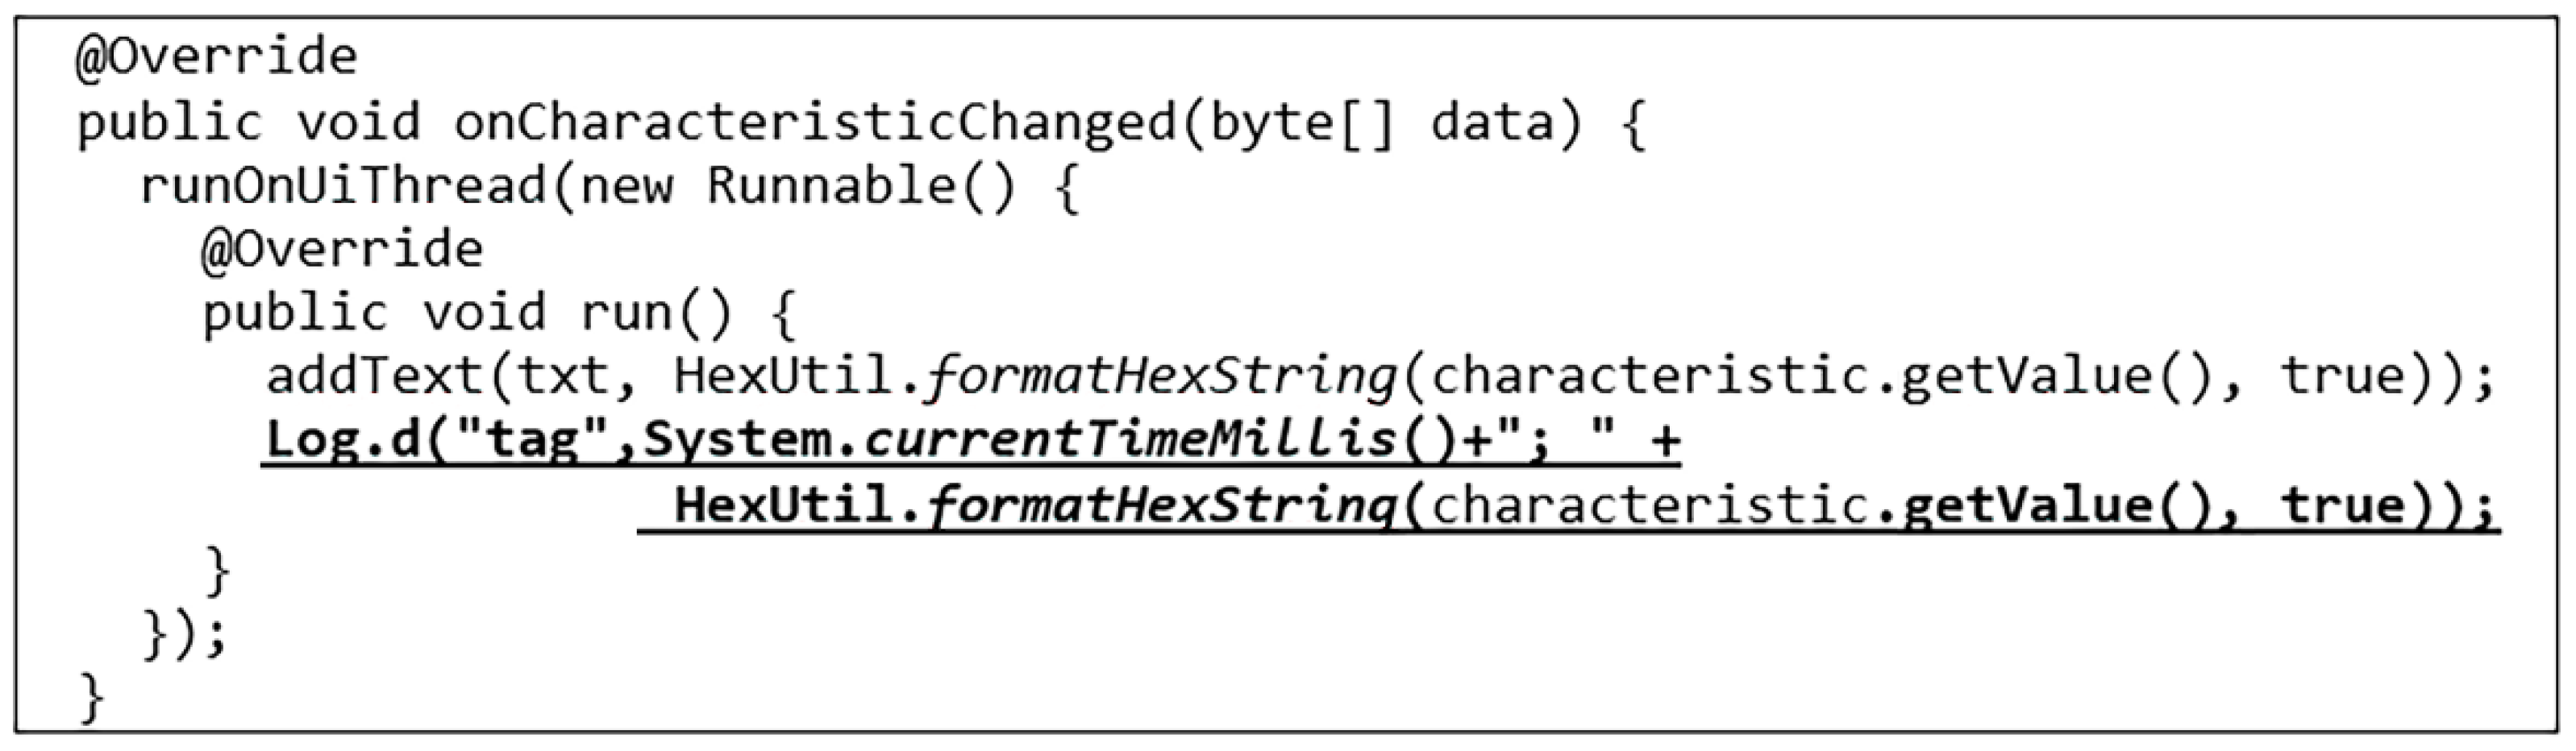
For developing our BLE scanner, an already developed application called FastBLE [
23] has been used as a basis. The source code of the application is modified with the code shown in
Figure 7 to be able to save the information displayed in the LogCat.
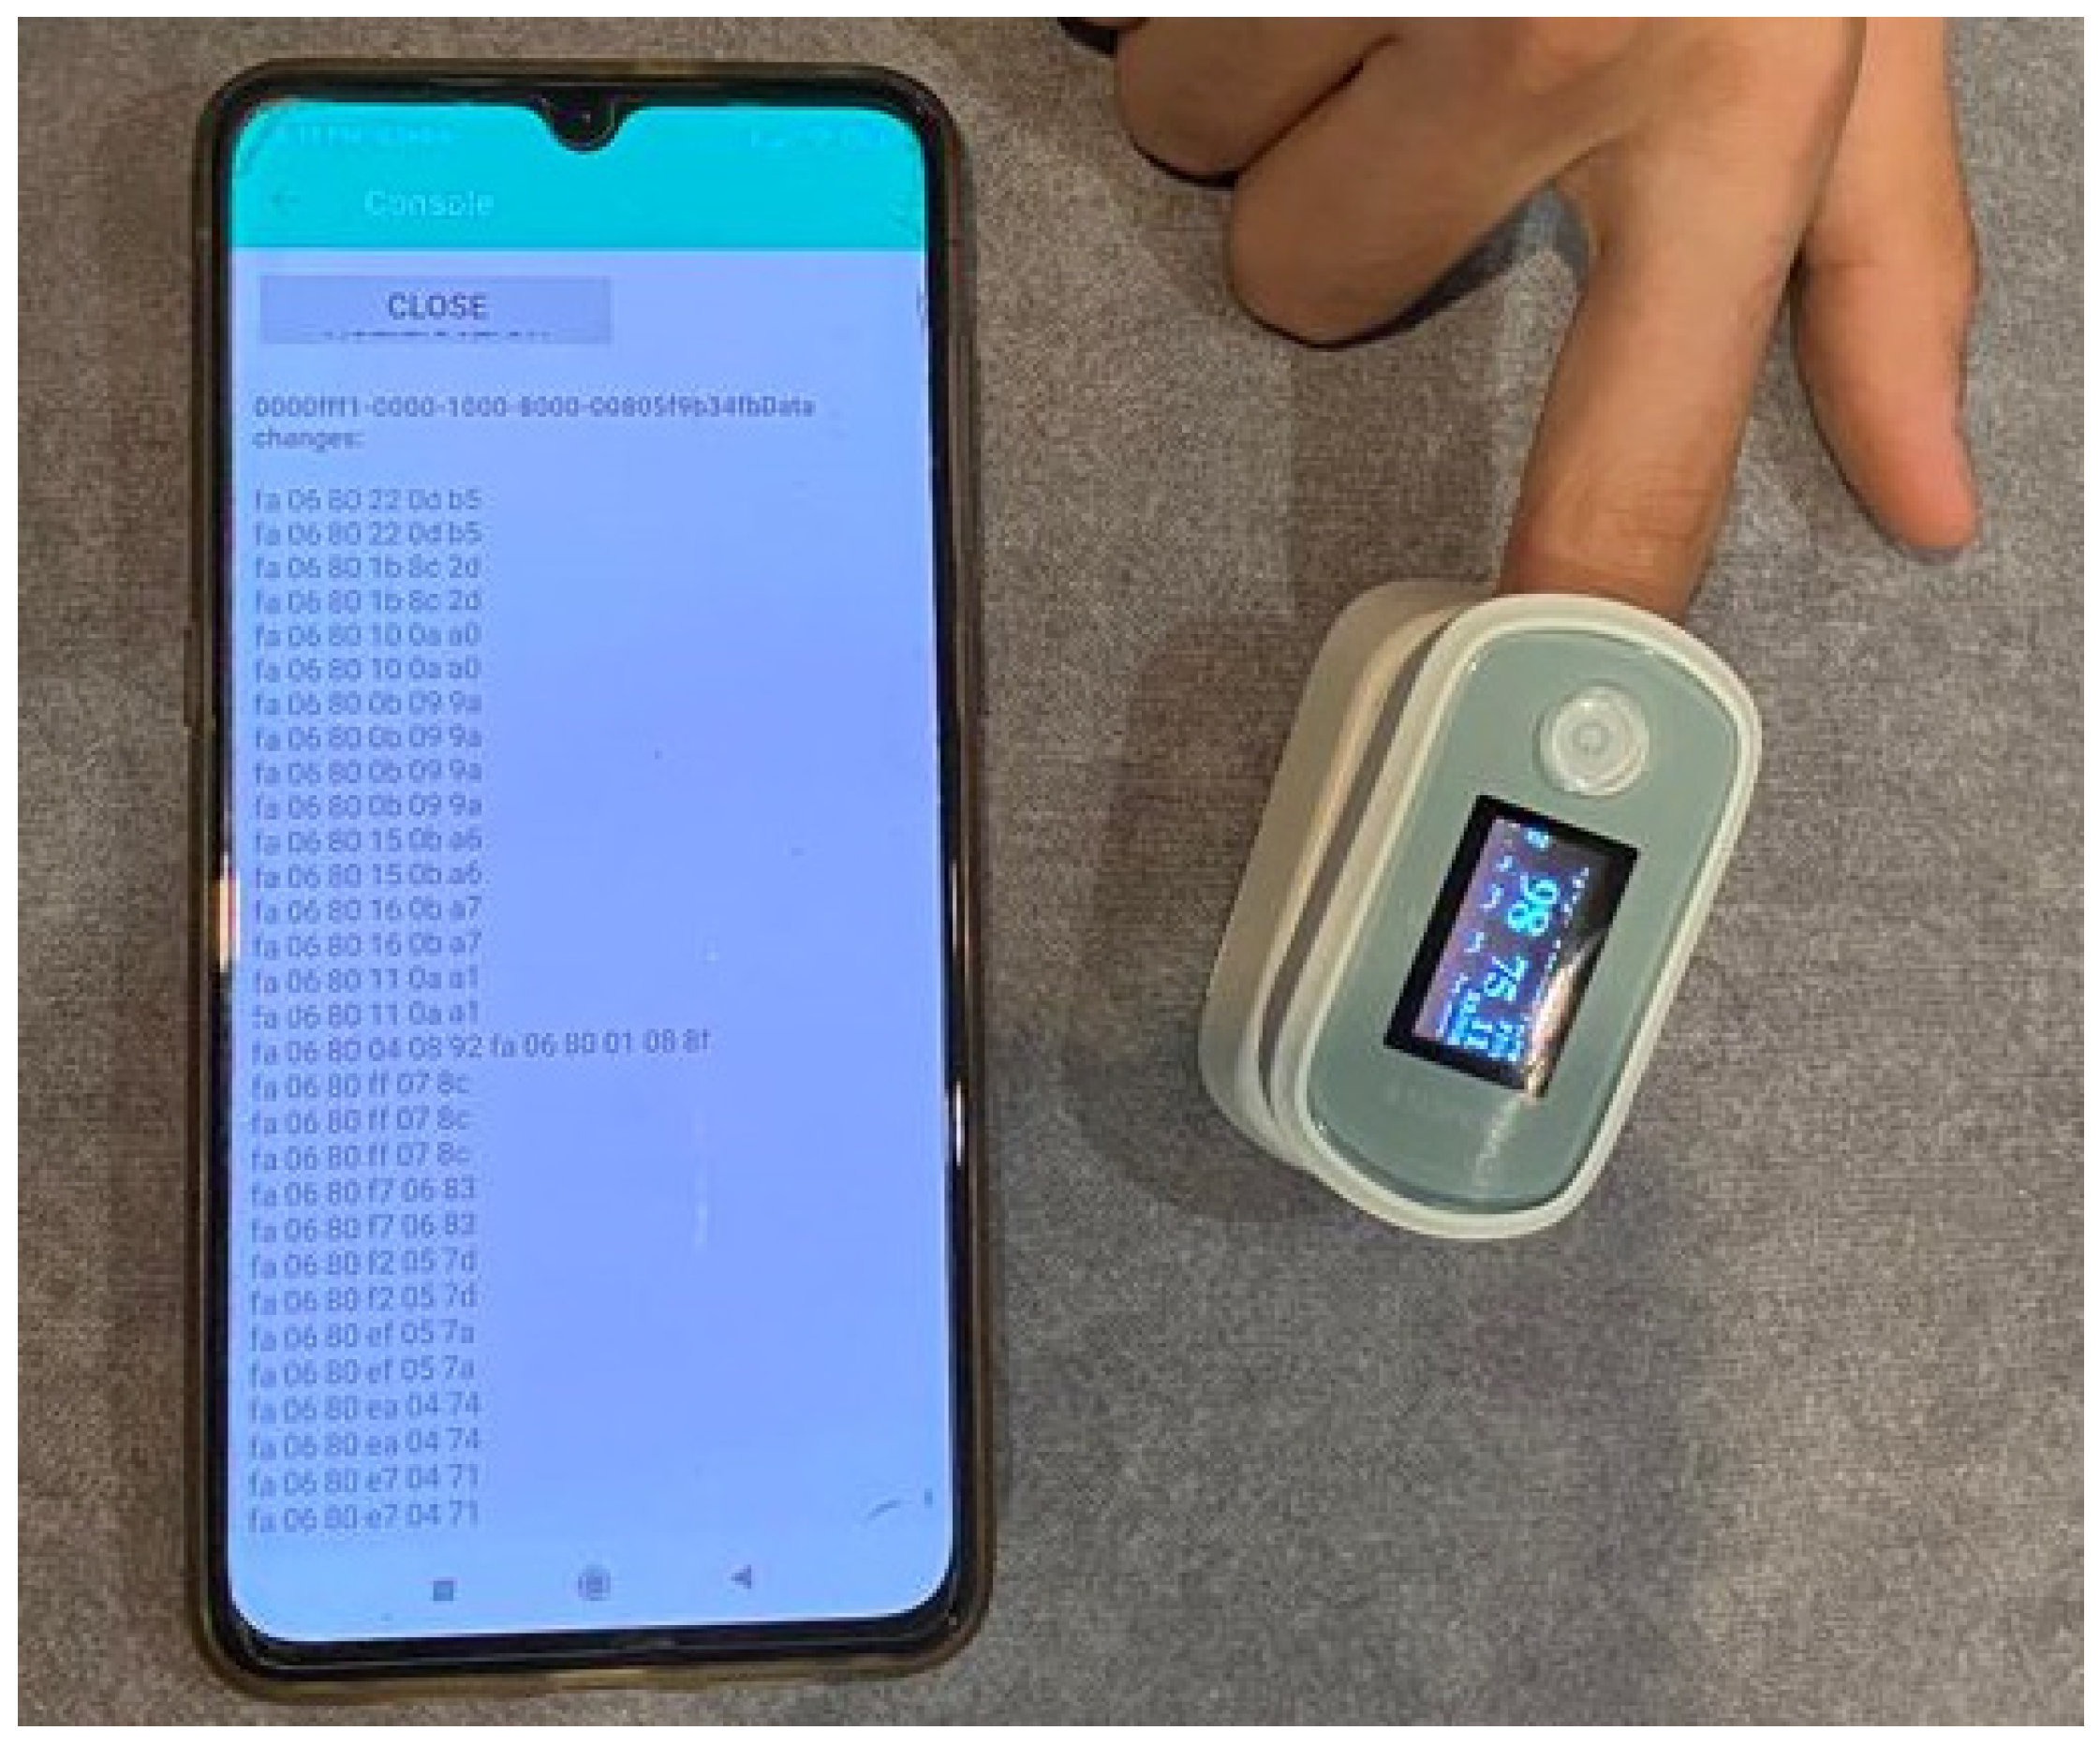
After executing the application and connecting with the device (see
Figure 8), the stored data are extracted, from which we can extract useful information for our prototype.
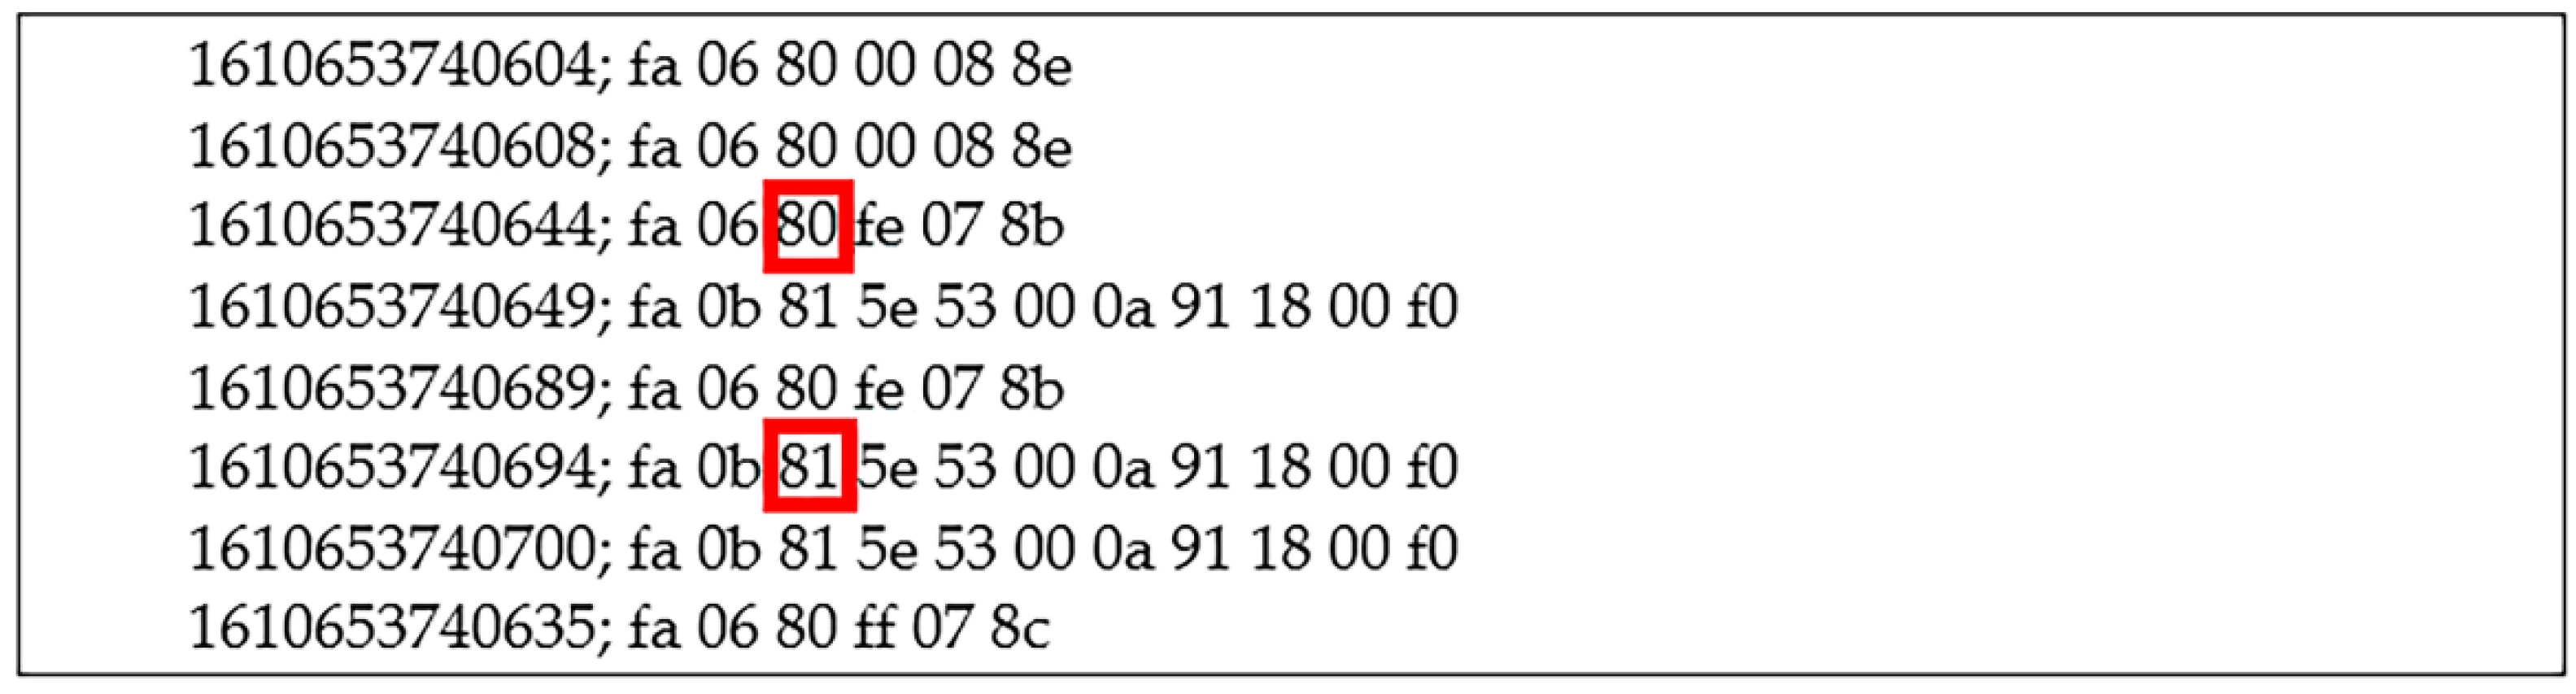
Figure 9 shows an extract of part of the captured data. Each line corresponds to the data received. The first numerical value corresponds to the time mark where the sample was received.
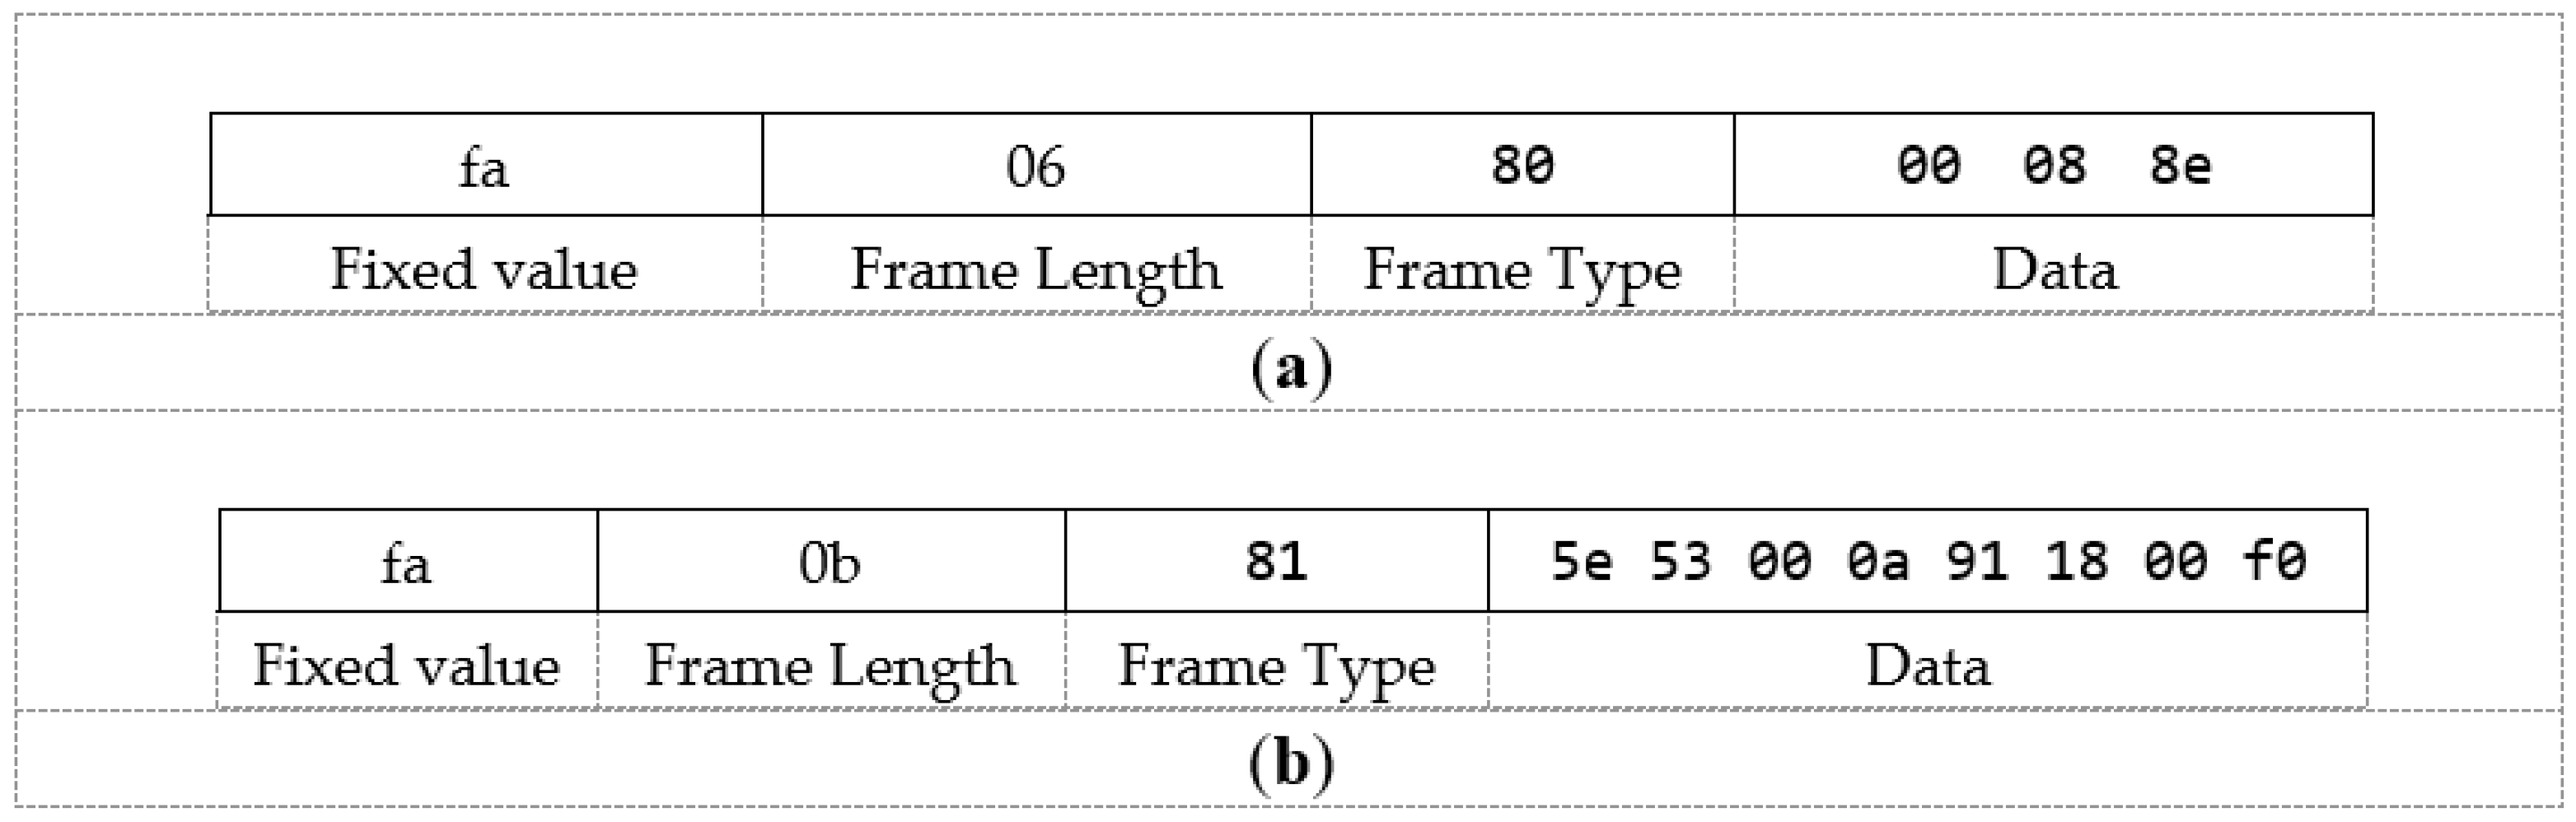
Data are received approximately every 25 ms. As we can see, there are two types of frames, that is, frames identified with a value of 80 (See
Figure 10a) and frames identified with a value of 81 (See
Figure 10b). After analyzing different frames, the following conclusions are drawn. The frame structure is as follows (See
Figure 10):
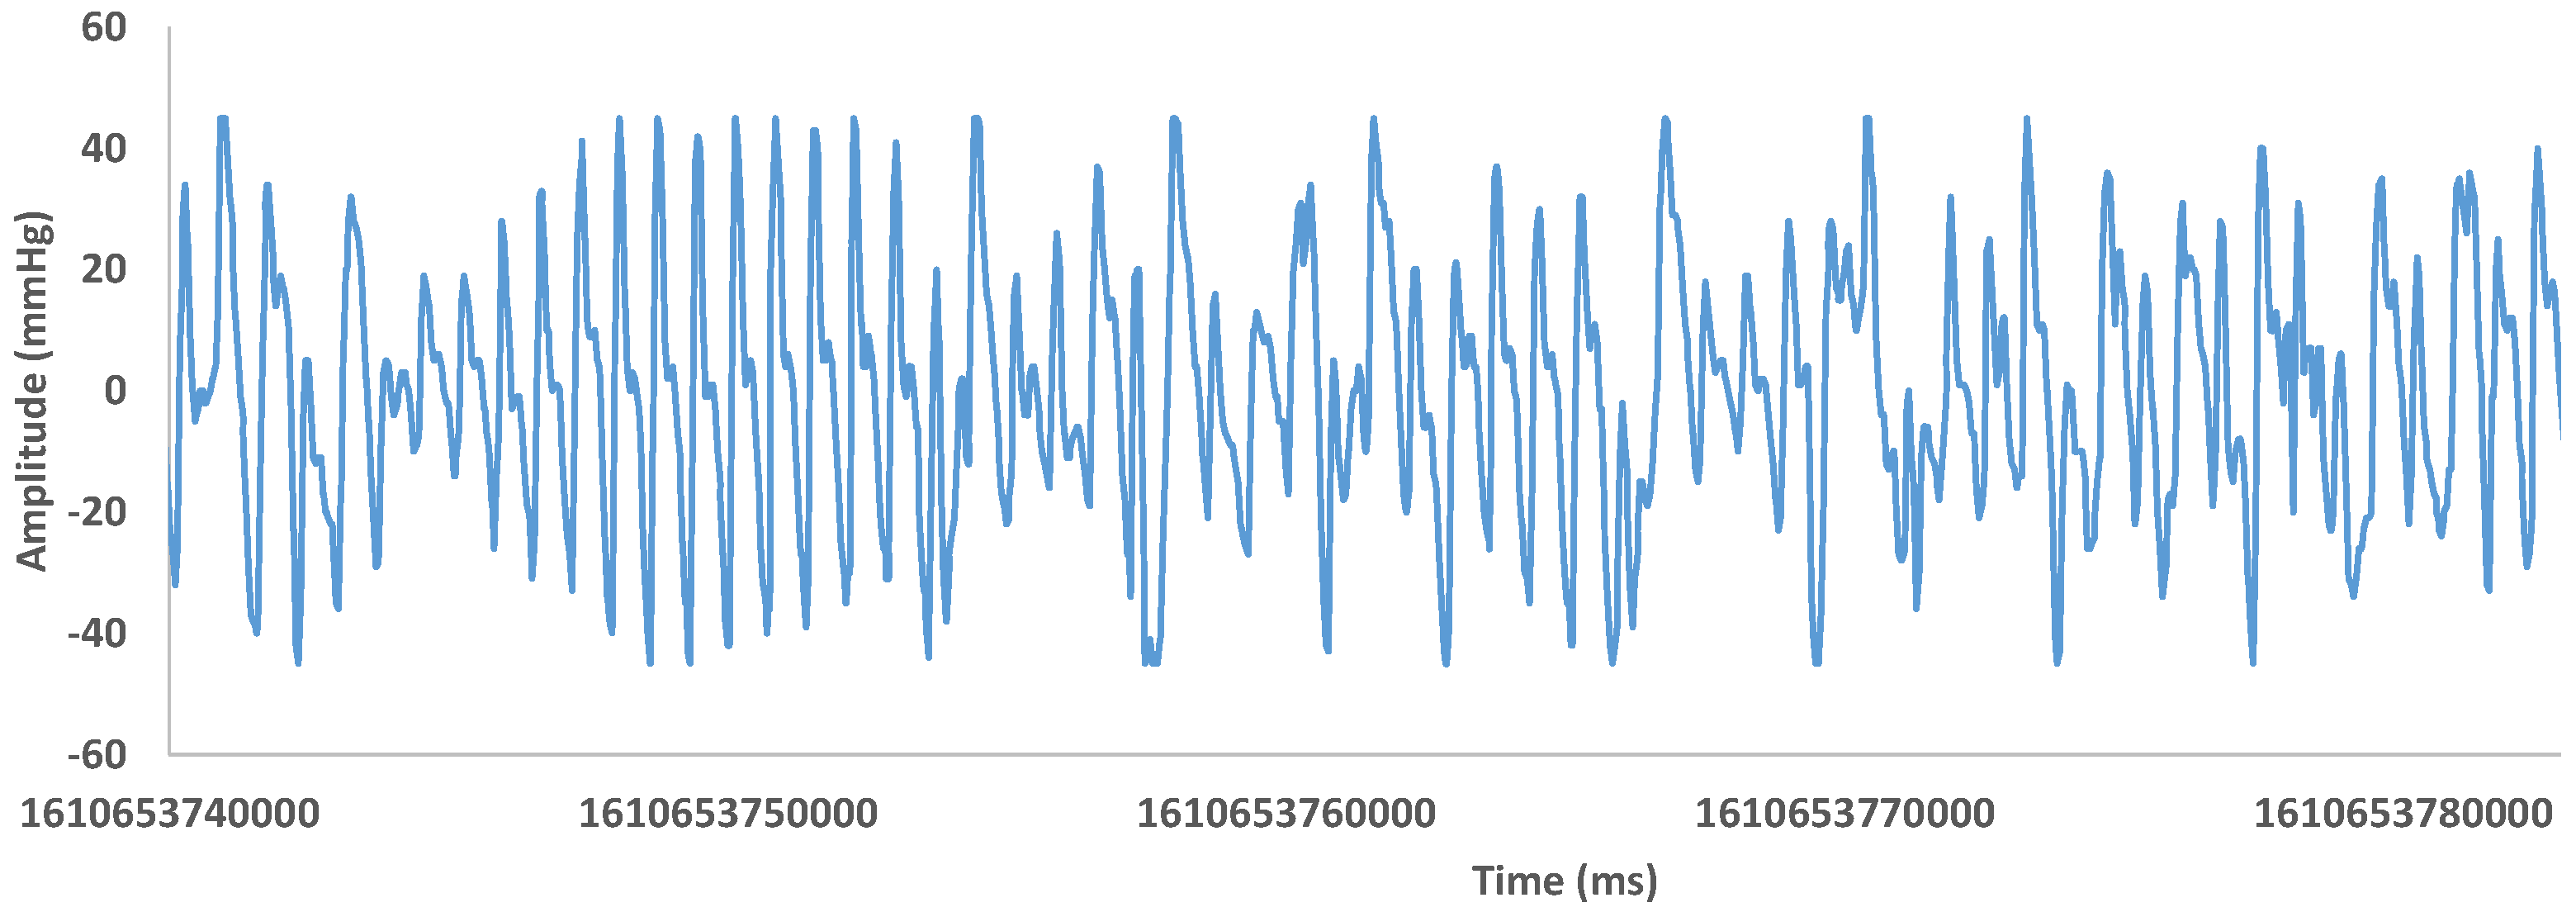
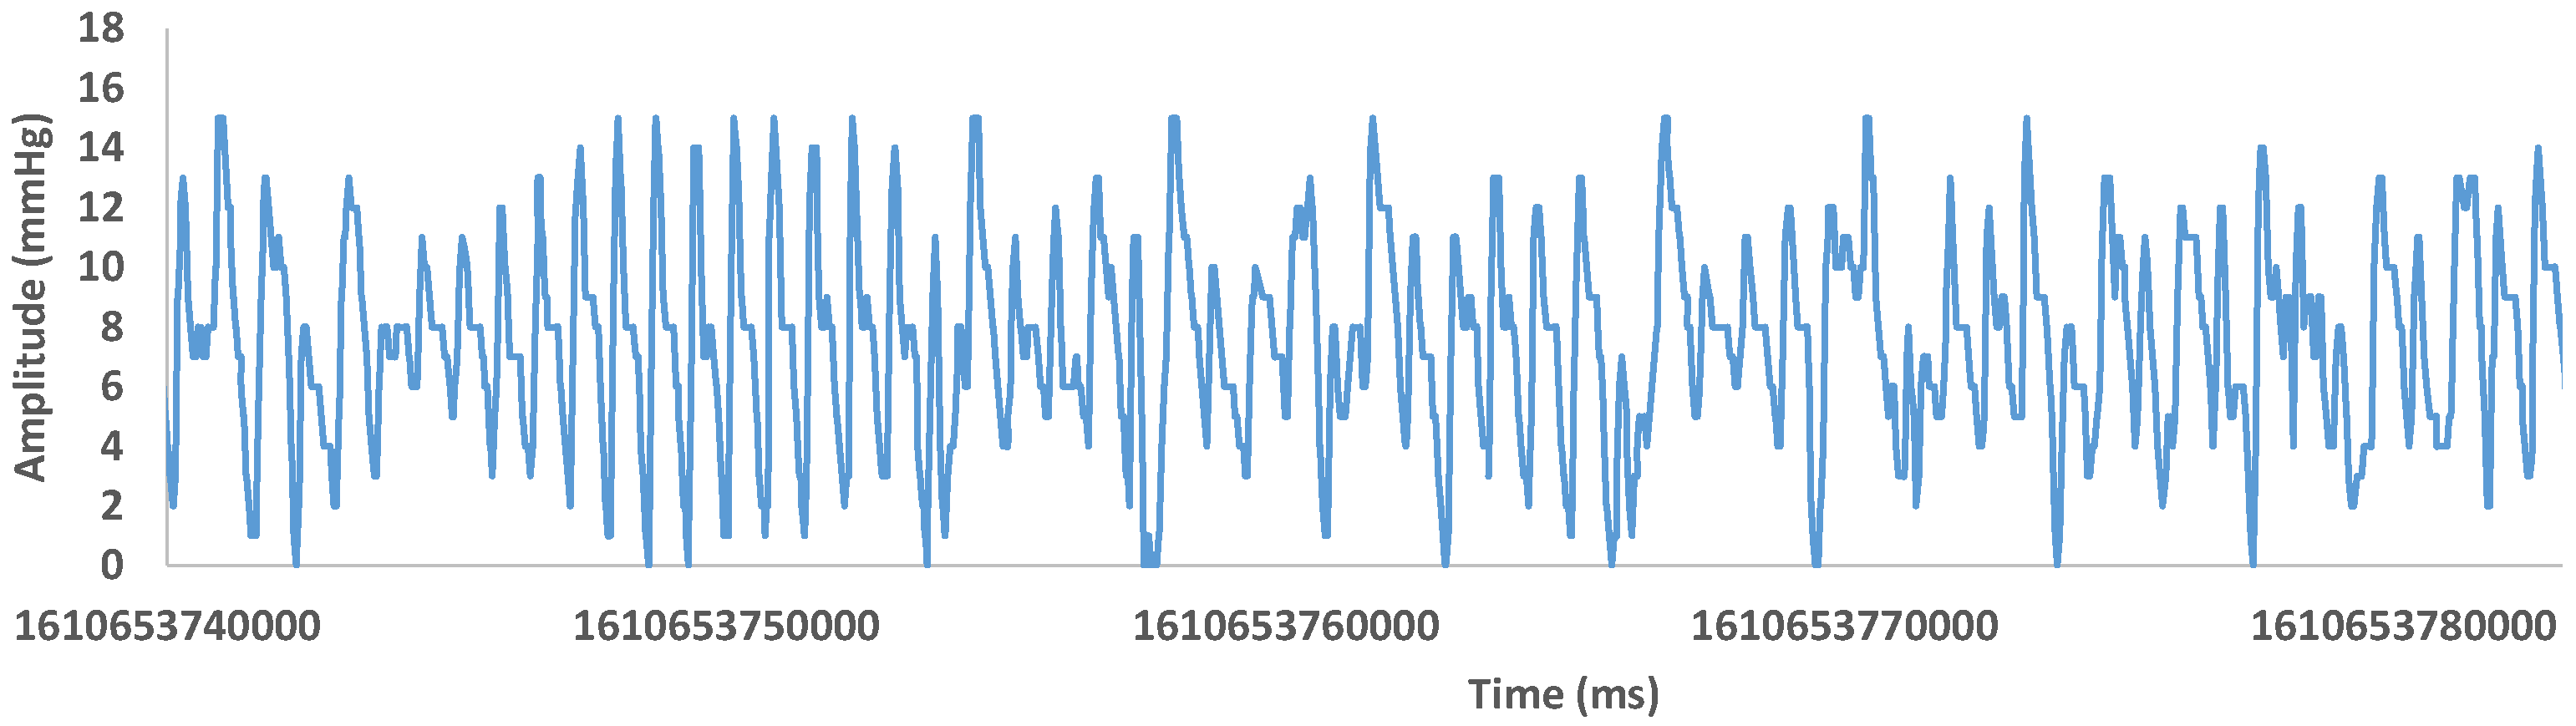
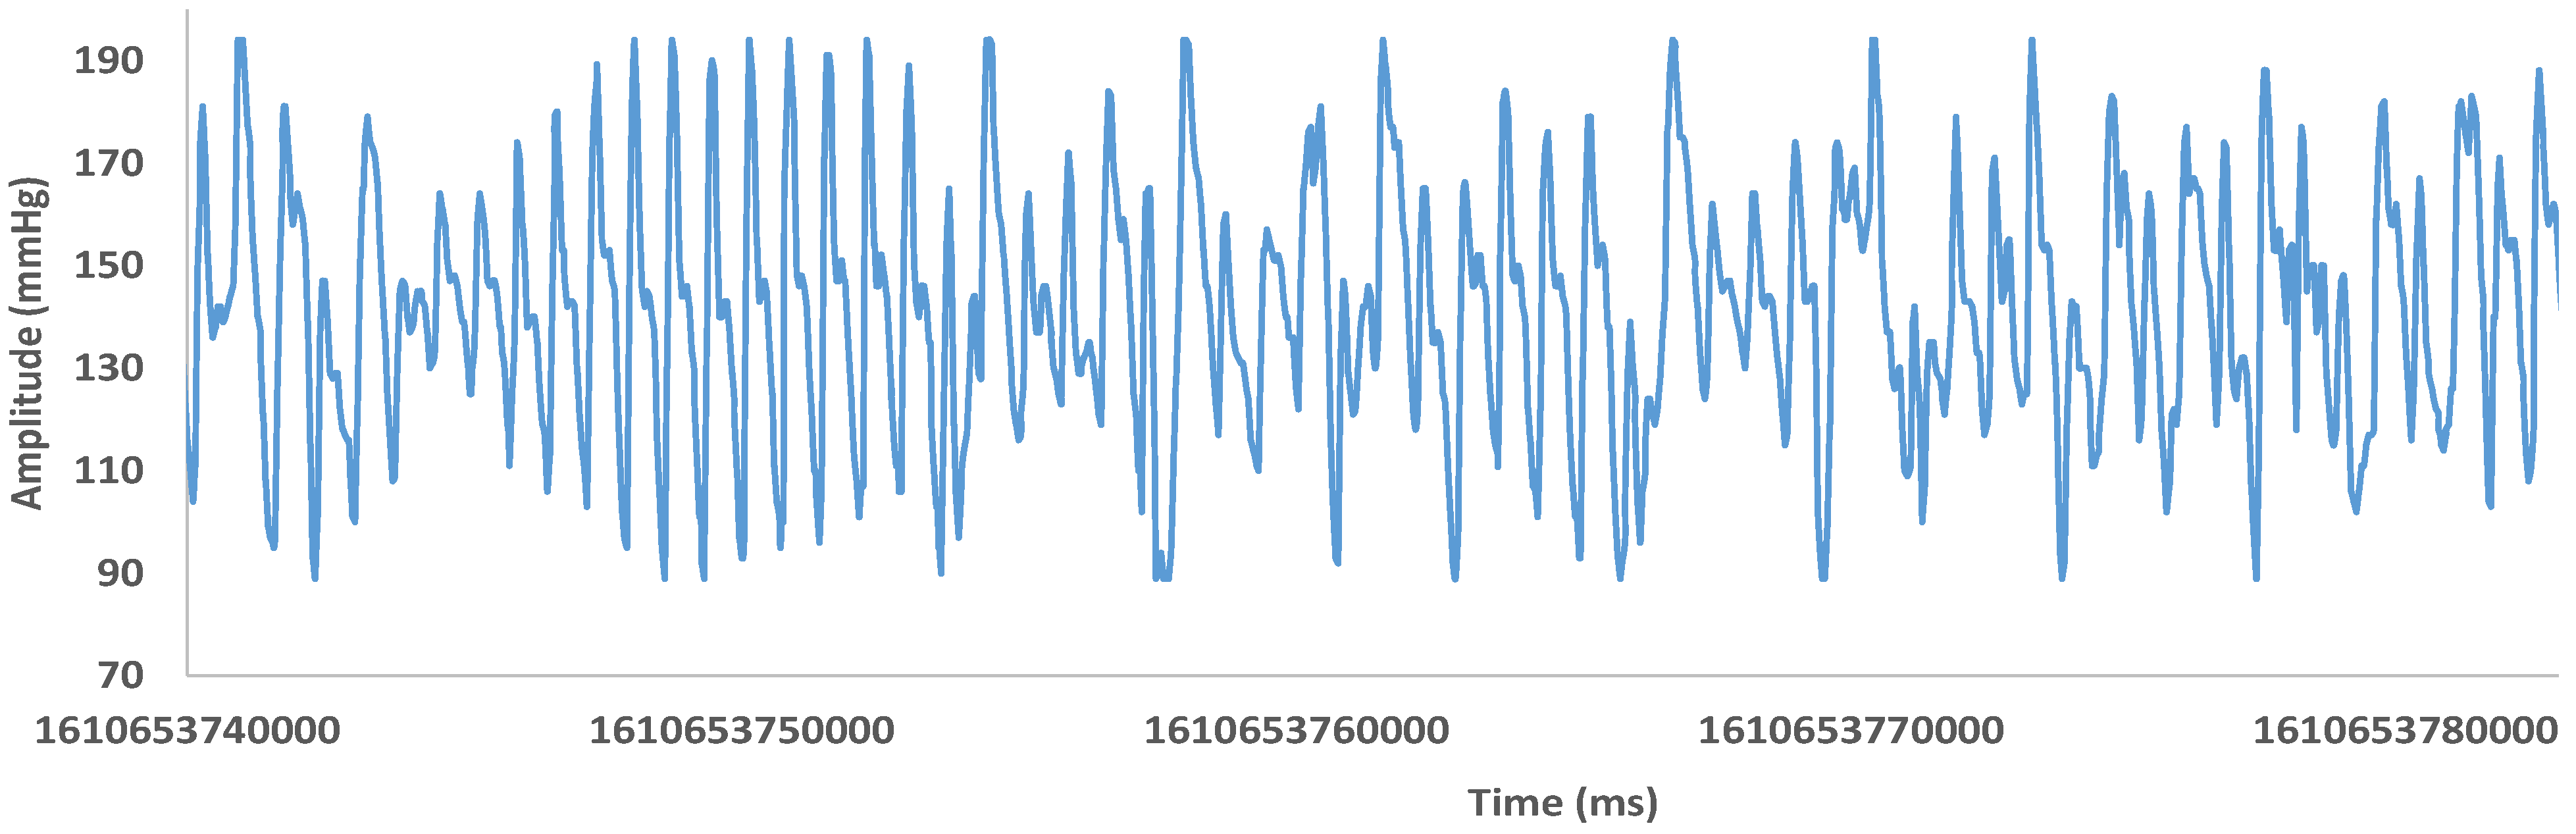
Regarding the type 80 frame, its payload is composed of three bytes. Each of these three bytes is a different information field from which the following graphs can be obtained (See
Figure 11,
Figure 12 and
Figure 13). Each value is represented versus the timestamp that the pulse oximeter uses. These figures represent the O
2 saturation plethysmographic curve that corresponds to the variation of the normalized ratio of transmitted light obtained by dividing the absorption component of the red LED by the ratio between the pulsatile and non-pulsatile red component which, in turn, is divided by the same quotient of the infrared LED.
Taking into account the registered values, we can extract the following ranges of values (see
Table 1).
After comparing the three graphs and the previous statistics, we can conclude that the information contained in the three fields is the same, although their coding and the range of values used are different.
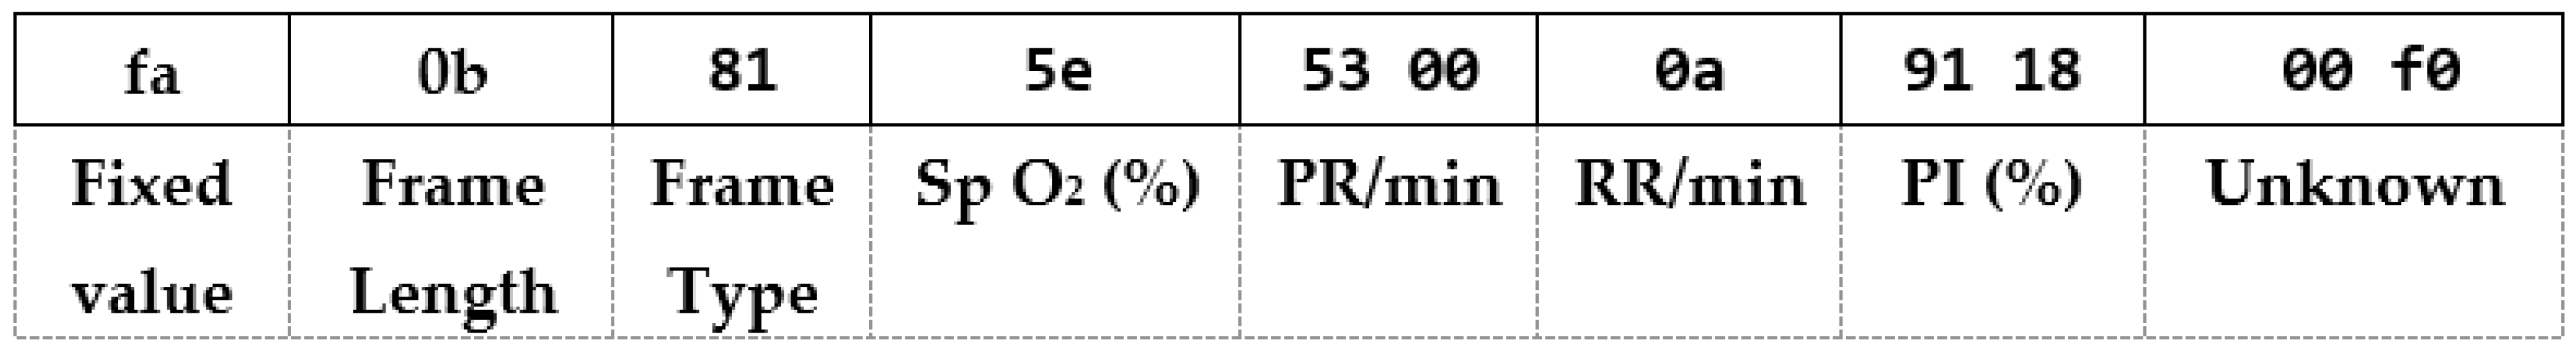
Regarding frame type 81, the payload of this frame is composed of eight bytes. Each of these eight bytes shows a different information field. Taking one of the captured samples as an example, we would obtain the following structure (see
Figure 14):
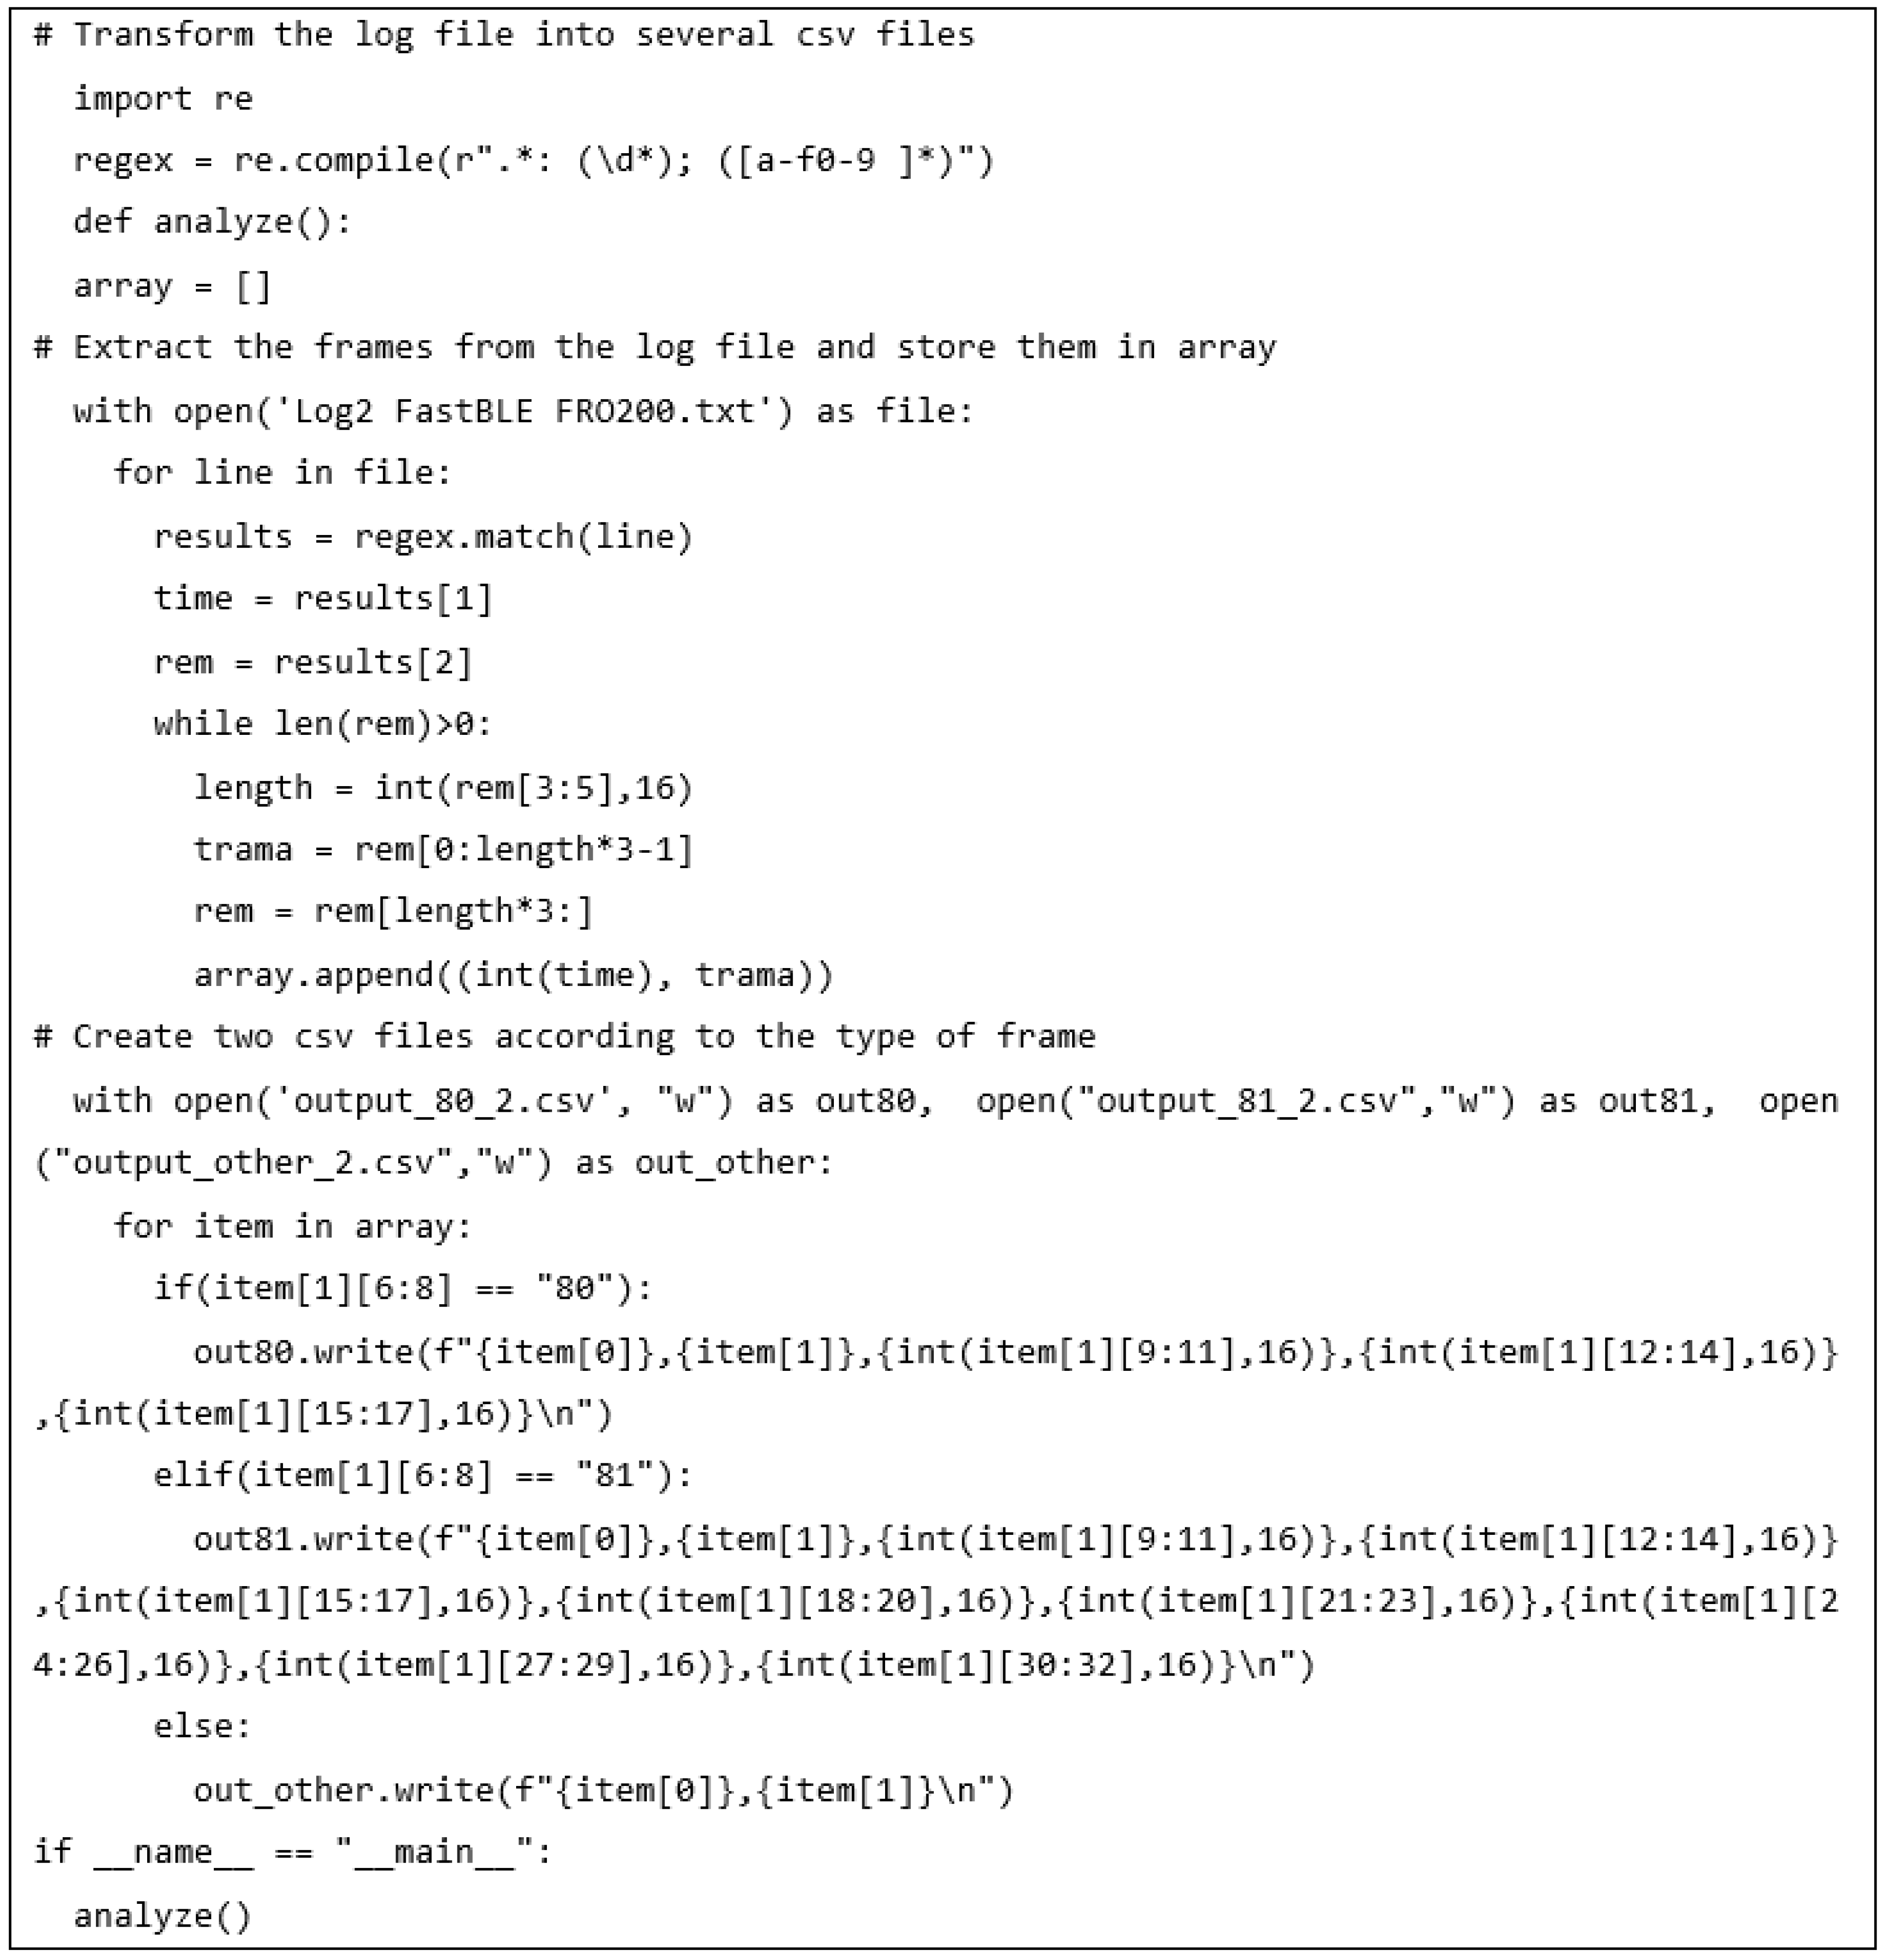
Finally, and after determining the different fields, the following Python script is developed (see
Figure 15). The result of executing this code will be to obtain a file in CSV format to facilitate its subsequent analysis and its graphic representation that will facilitate its visual interpretation.
As we can see, in the first loop, an array with the list of frames is obtained. Then two *.csv files to store the values from each type of frame are created. In these files, the first column is created for the timestamp, the second column contains the entire frame, and finally, the third column will store data from each byte of data.
4. Results and Test of Android Application
This section explains the measured parameters for our system and how to understand them from its graphical view. Through the test of our system, we want to demonstrate that the device, together with the algorithm, is capable of extracting the data from Bluetooth frames and processing them to obtain the parameters of SpO2, PR (bpm), RR/min, and Pi (%). These parameters are directly provided by the device while the plethysmography wave, the PVi (%), the shape of the dicrotic fissure, and the area under the curve are indirectly calculated by our algorithm.
In order to test our proposal, we have selected 11 people with different profiles.
Table 2 shows the genders and ages of the people analyzed. The 11 people that participated in the experiment were researchers and volunteers from the same research group that who informed and had agreed to participate in it. Additionally, to avoid any problem of confidentiality or correlation between the data and the person, the collected data have been anonymized.
To simplify the explanations of the results, we have selected the data of patients from 1 to 4.
Figure 16,
Figure 17,
Figure 18,
Figure 19 and
Figure 20 show the parameters measured as a function of time.
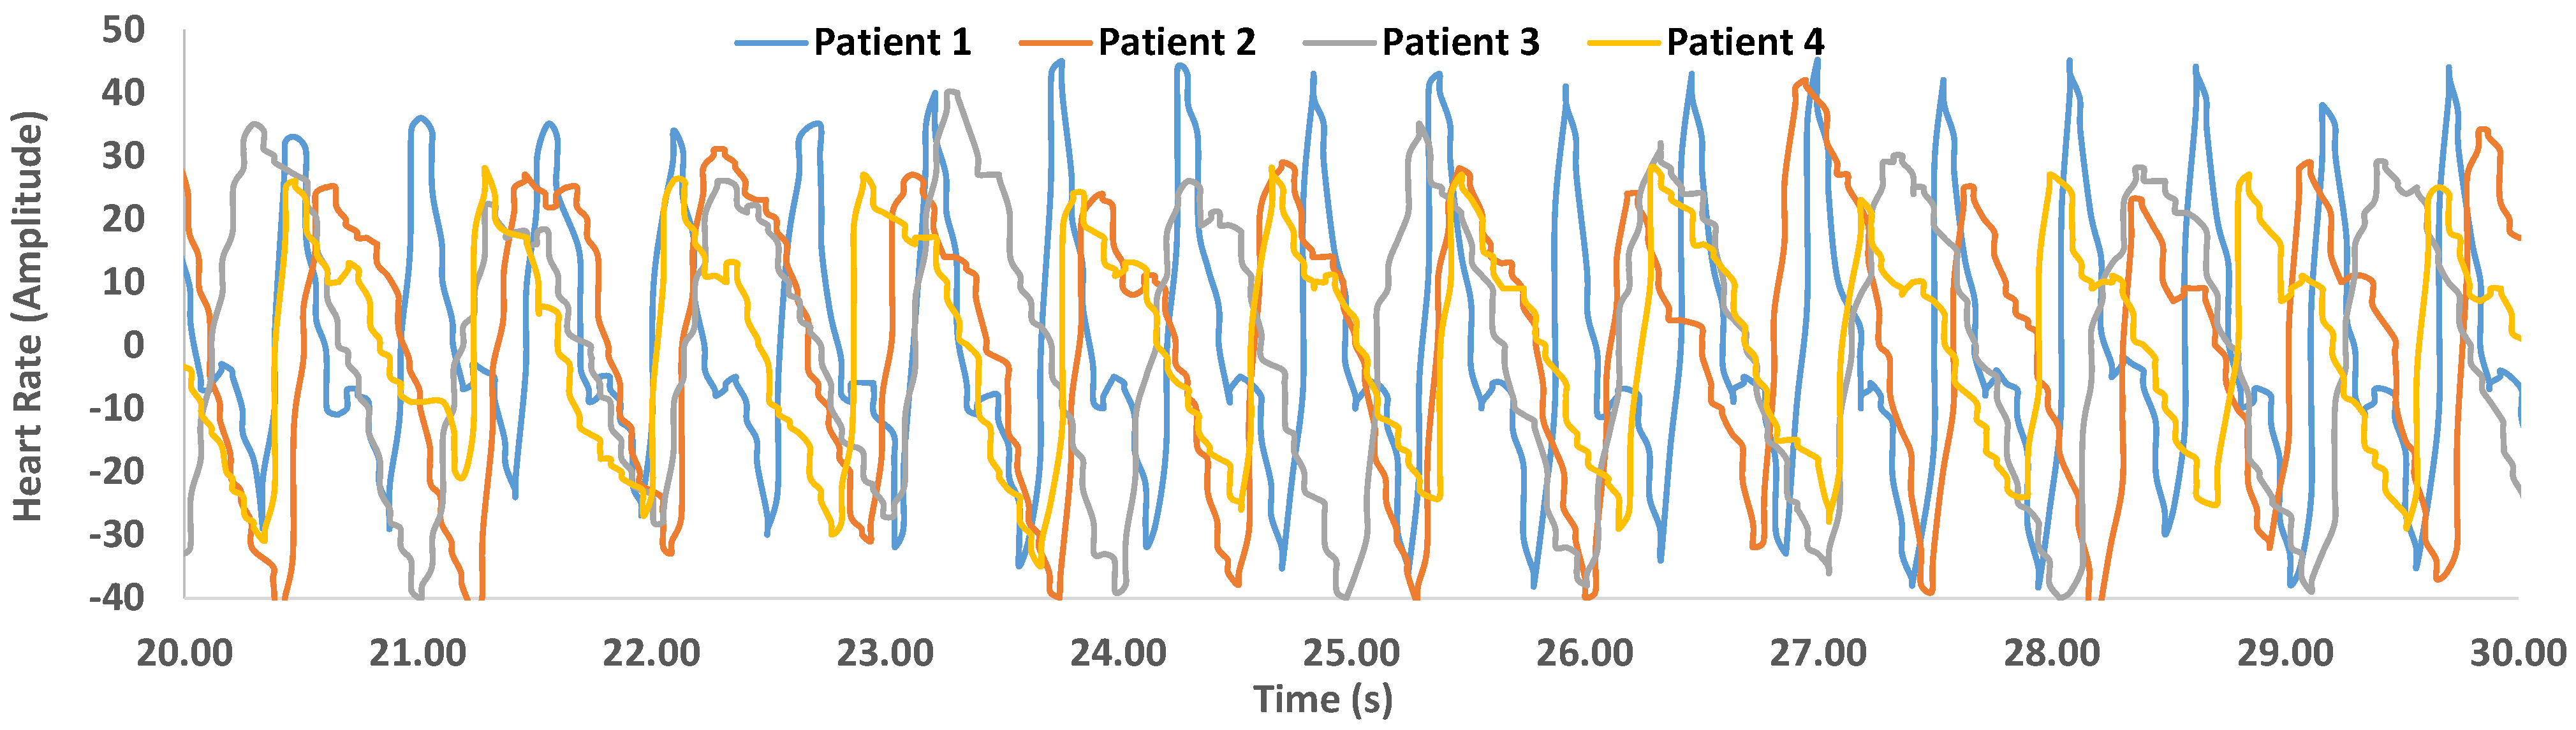
Figure 16 shows the plethysmography wave of patients from 1 to 4 for 10 s.
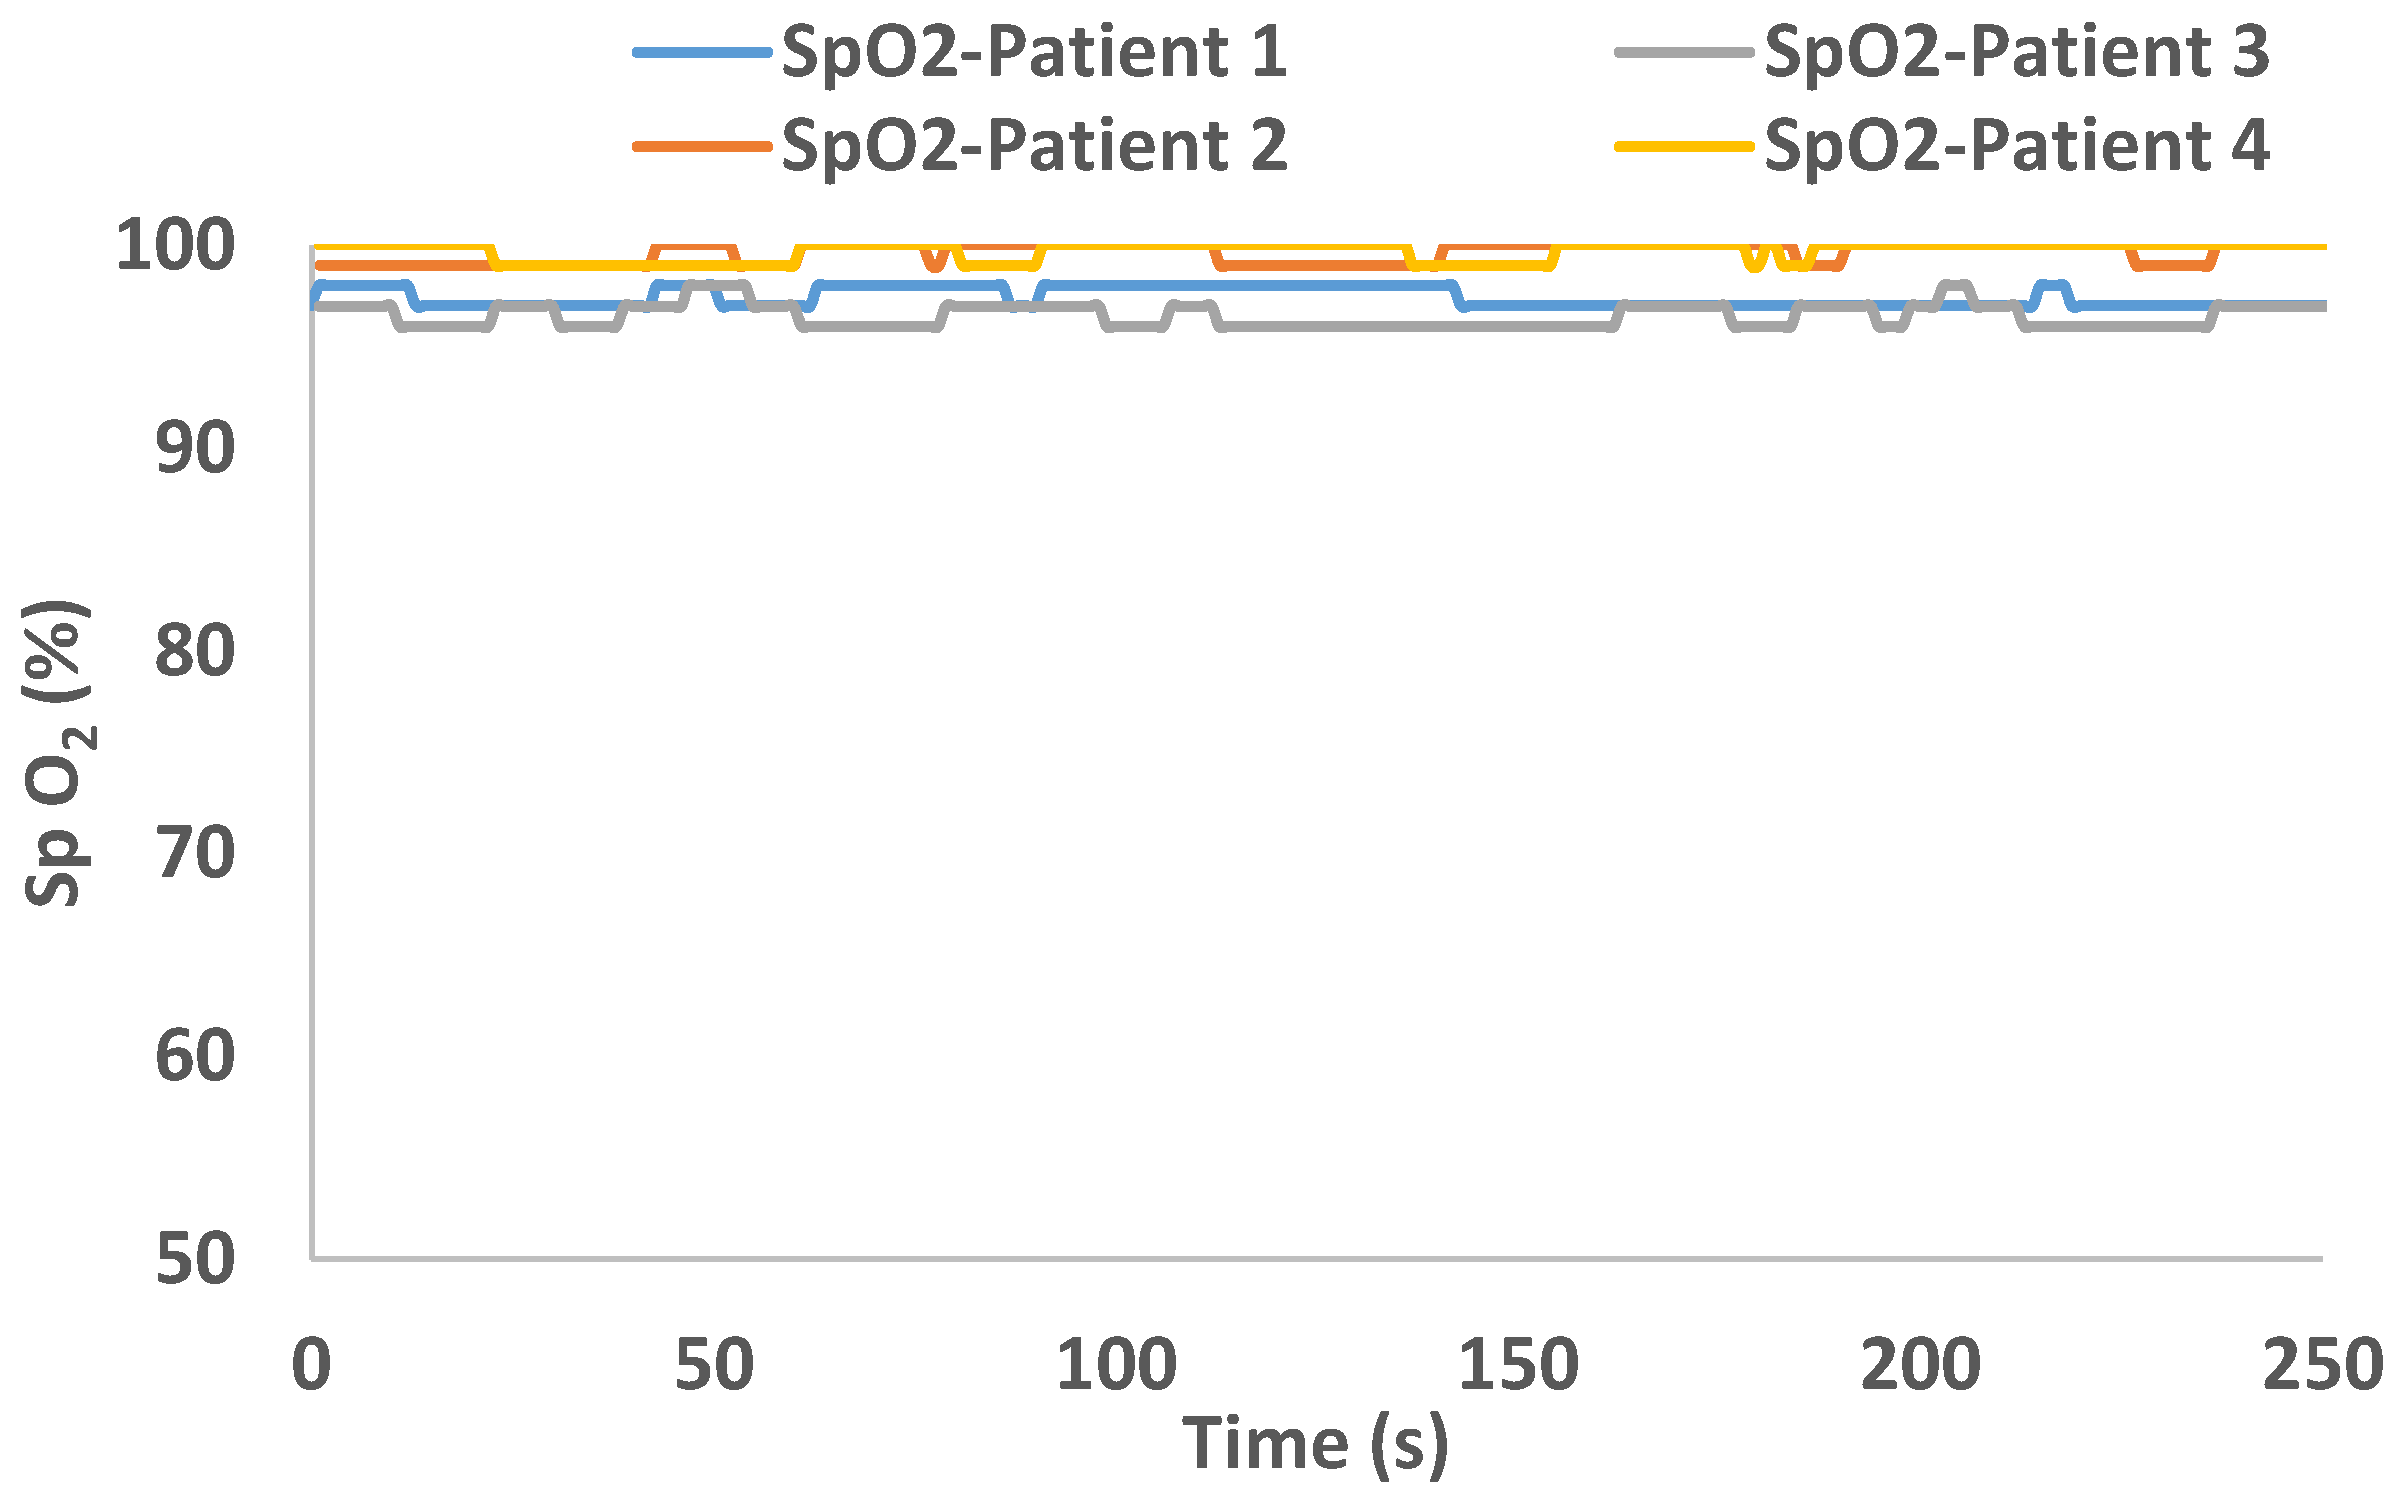
Figure 17 shows the average value of SpO
2 of patients from 1 to 4 for 250 s.
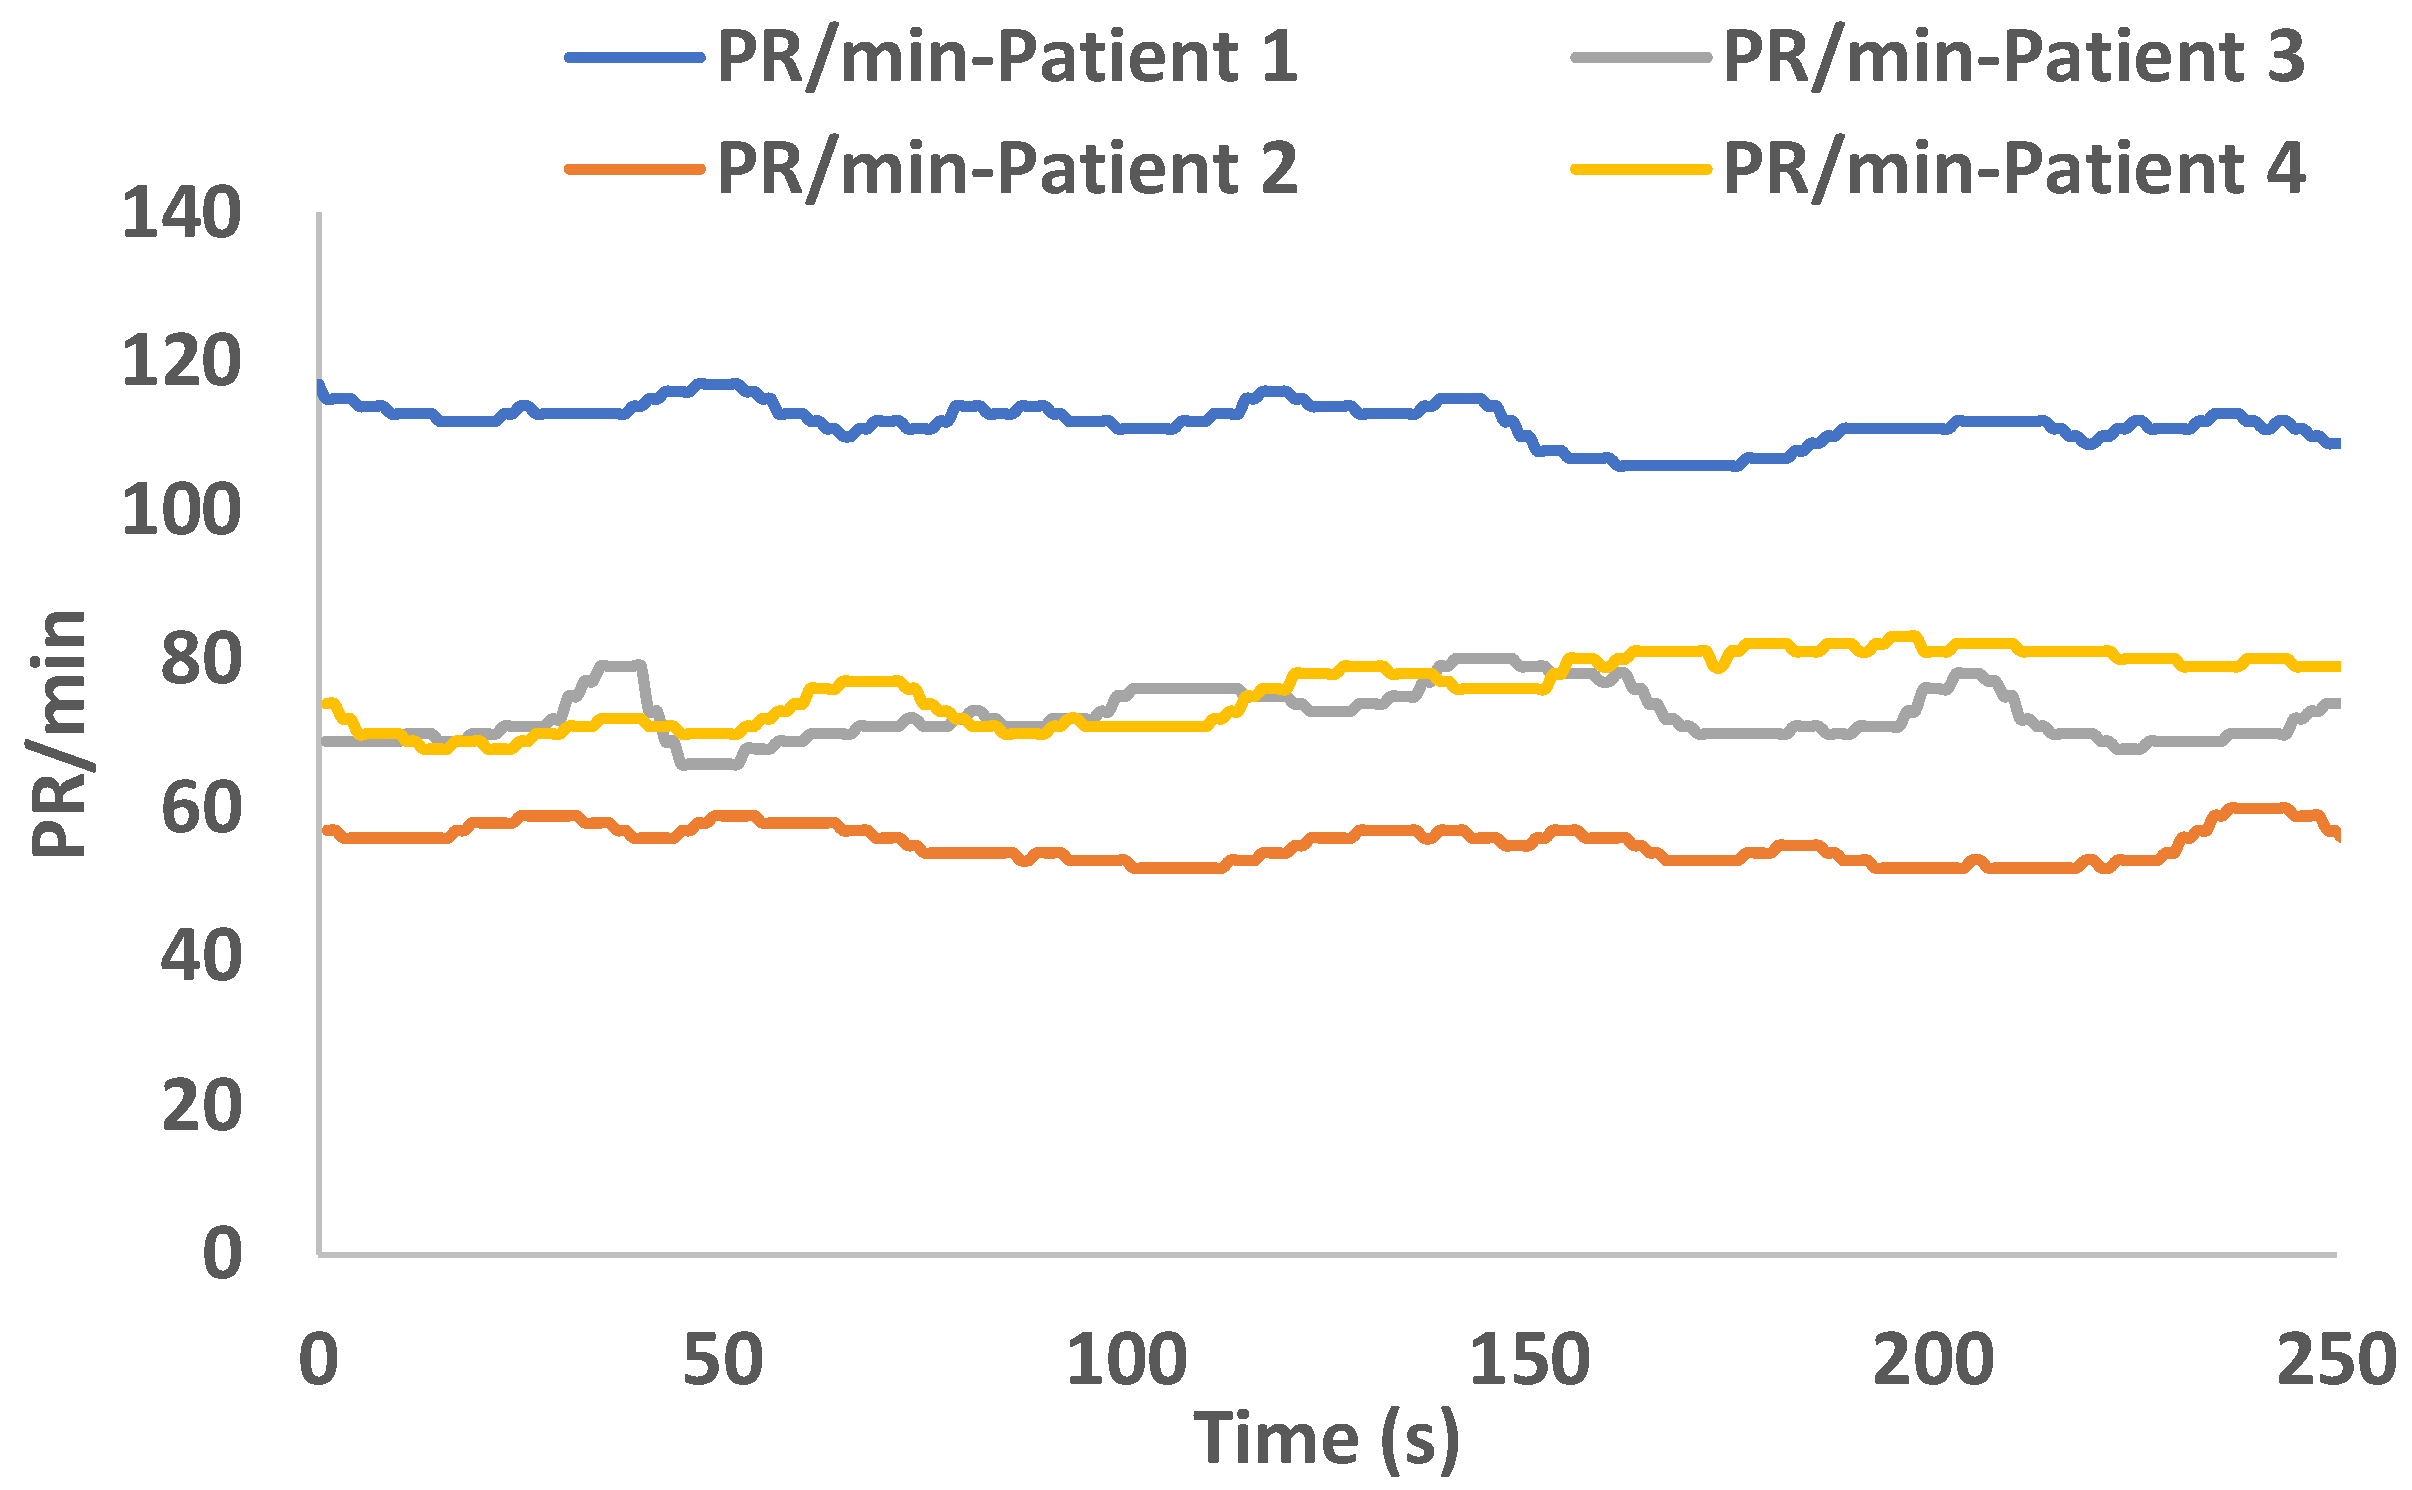
Figure 18 shows the PR/min of patients from 1 to 4 for 250 s.
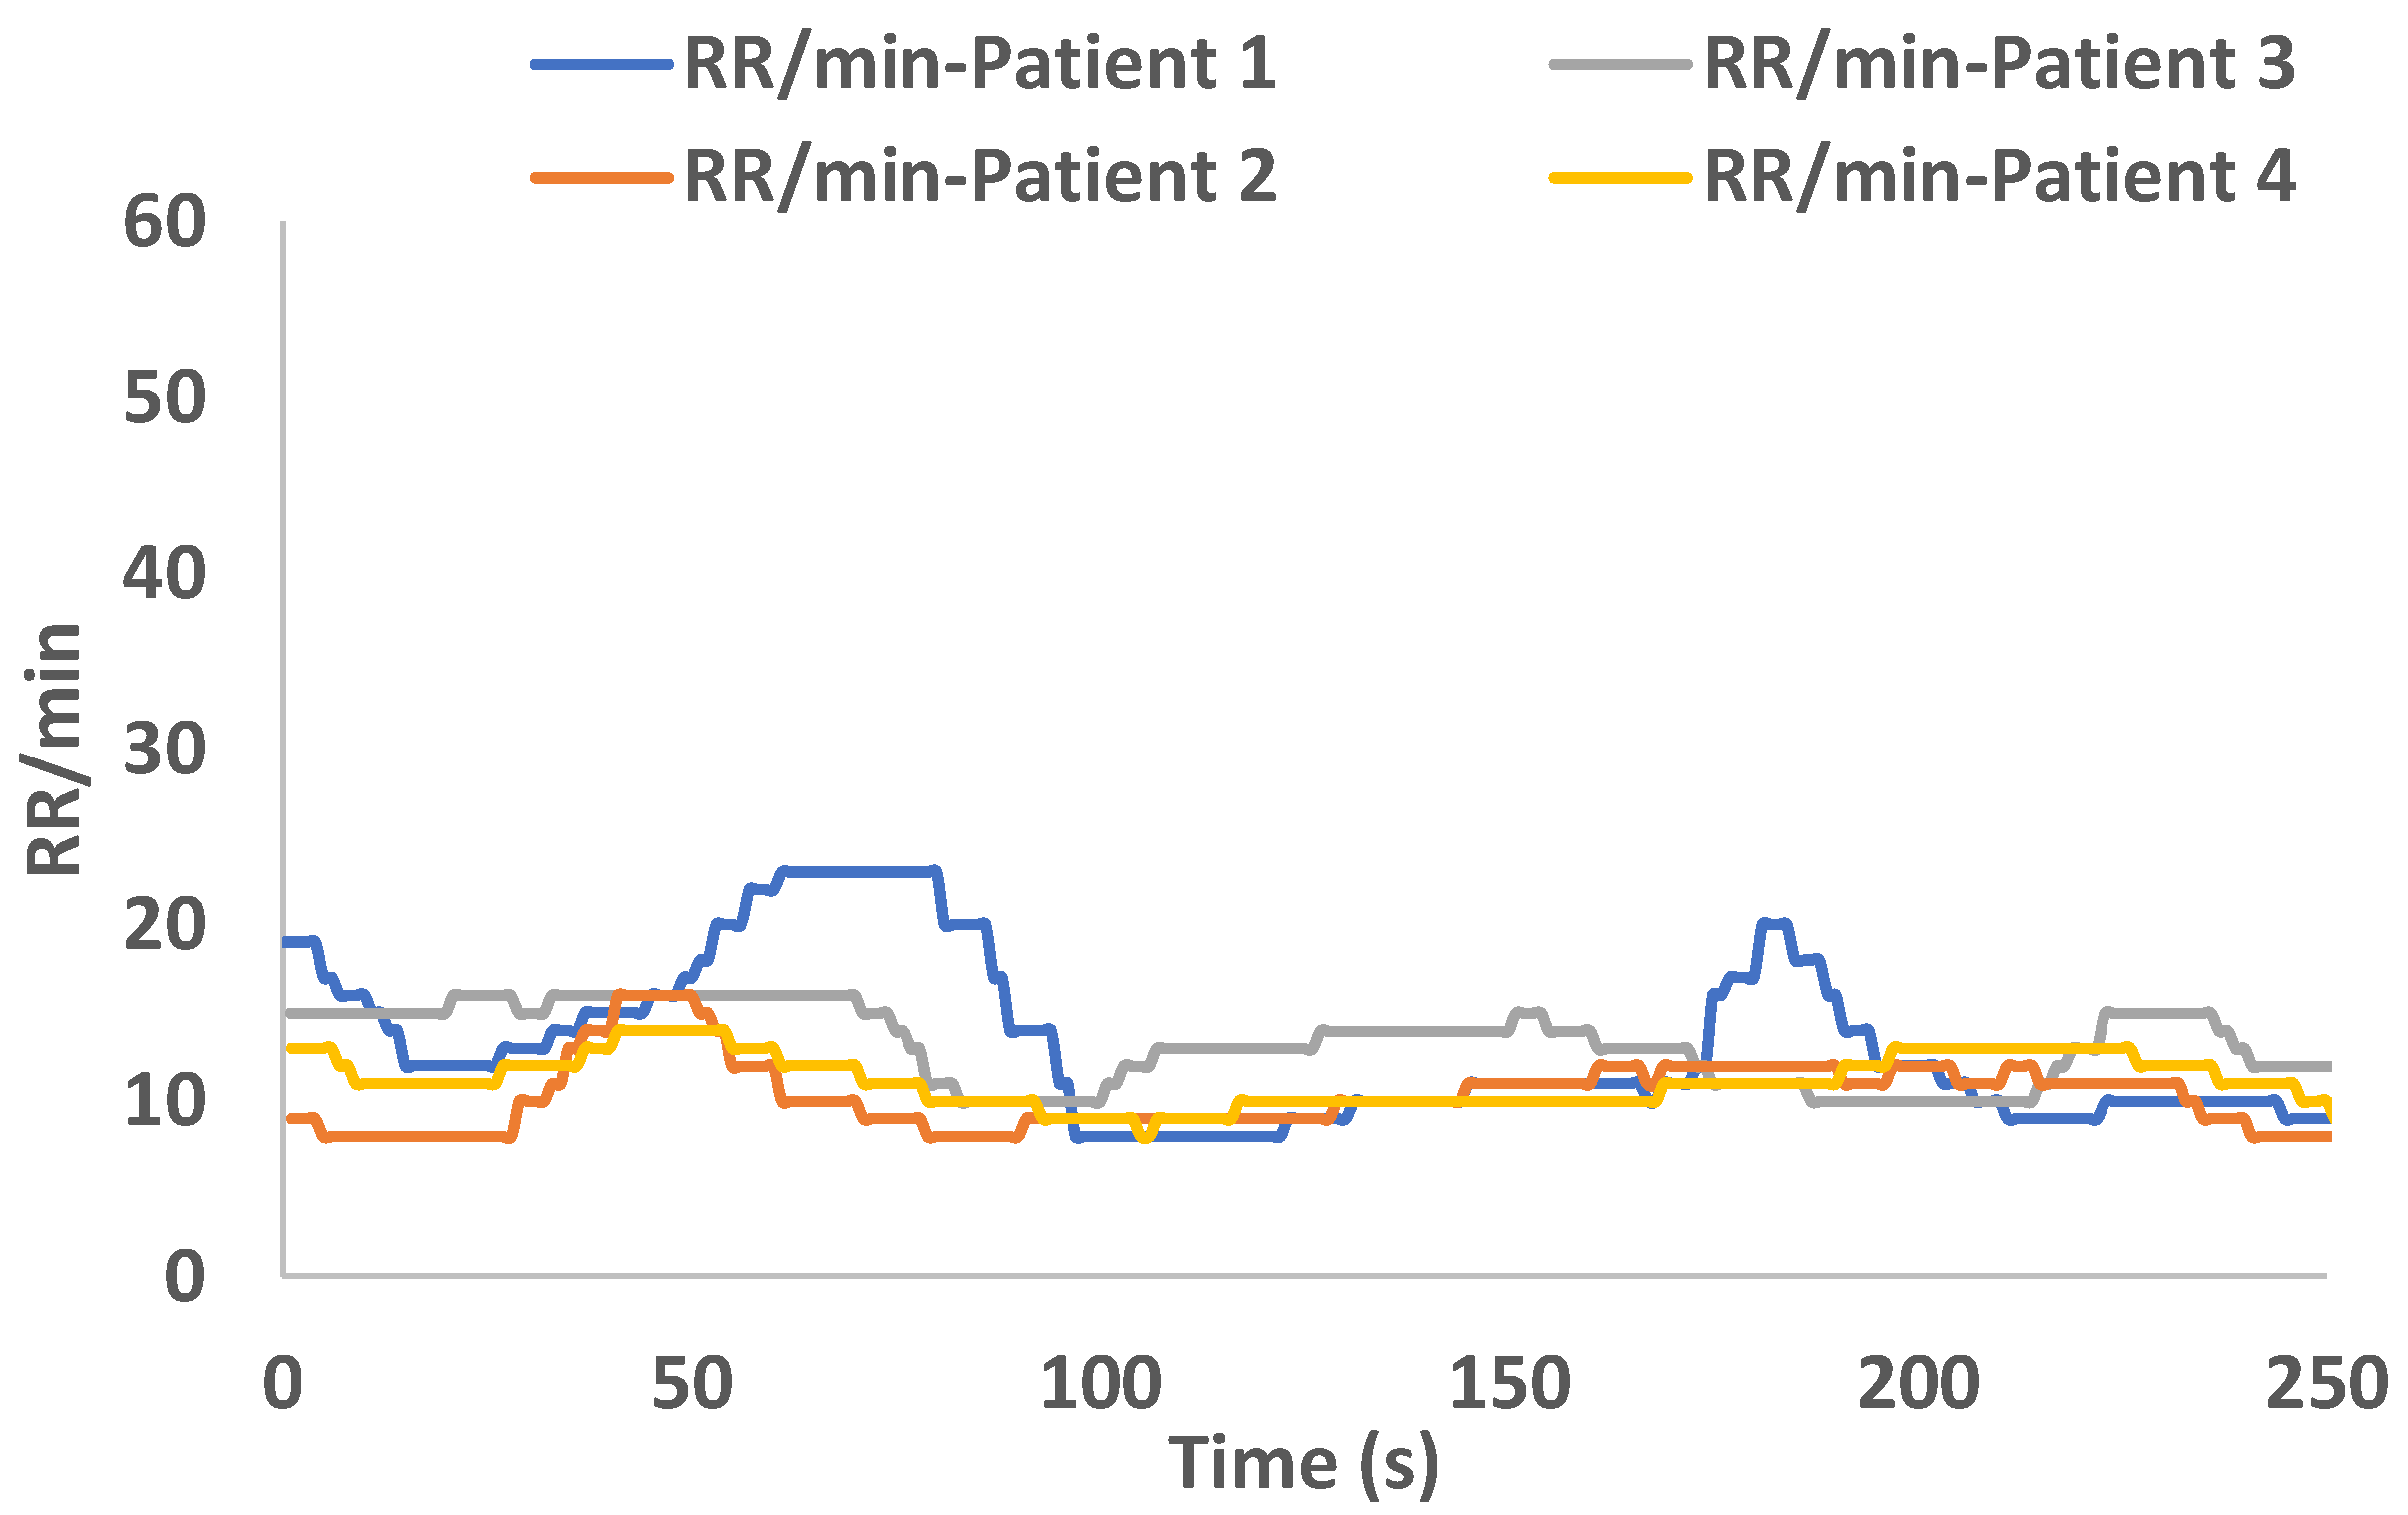
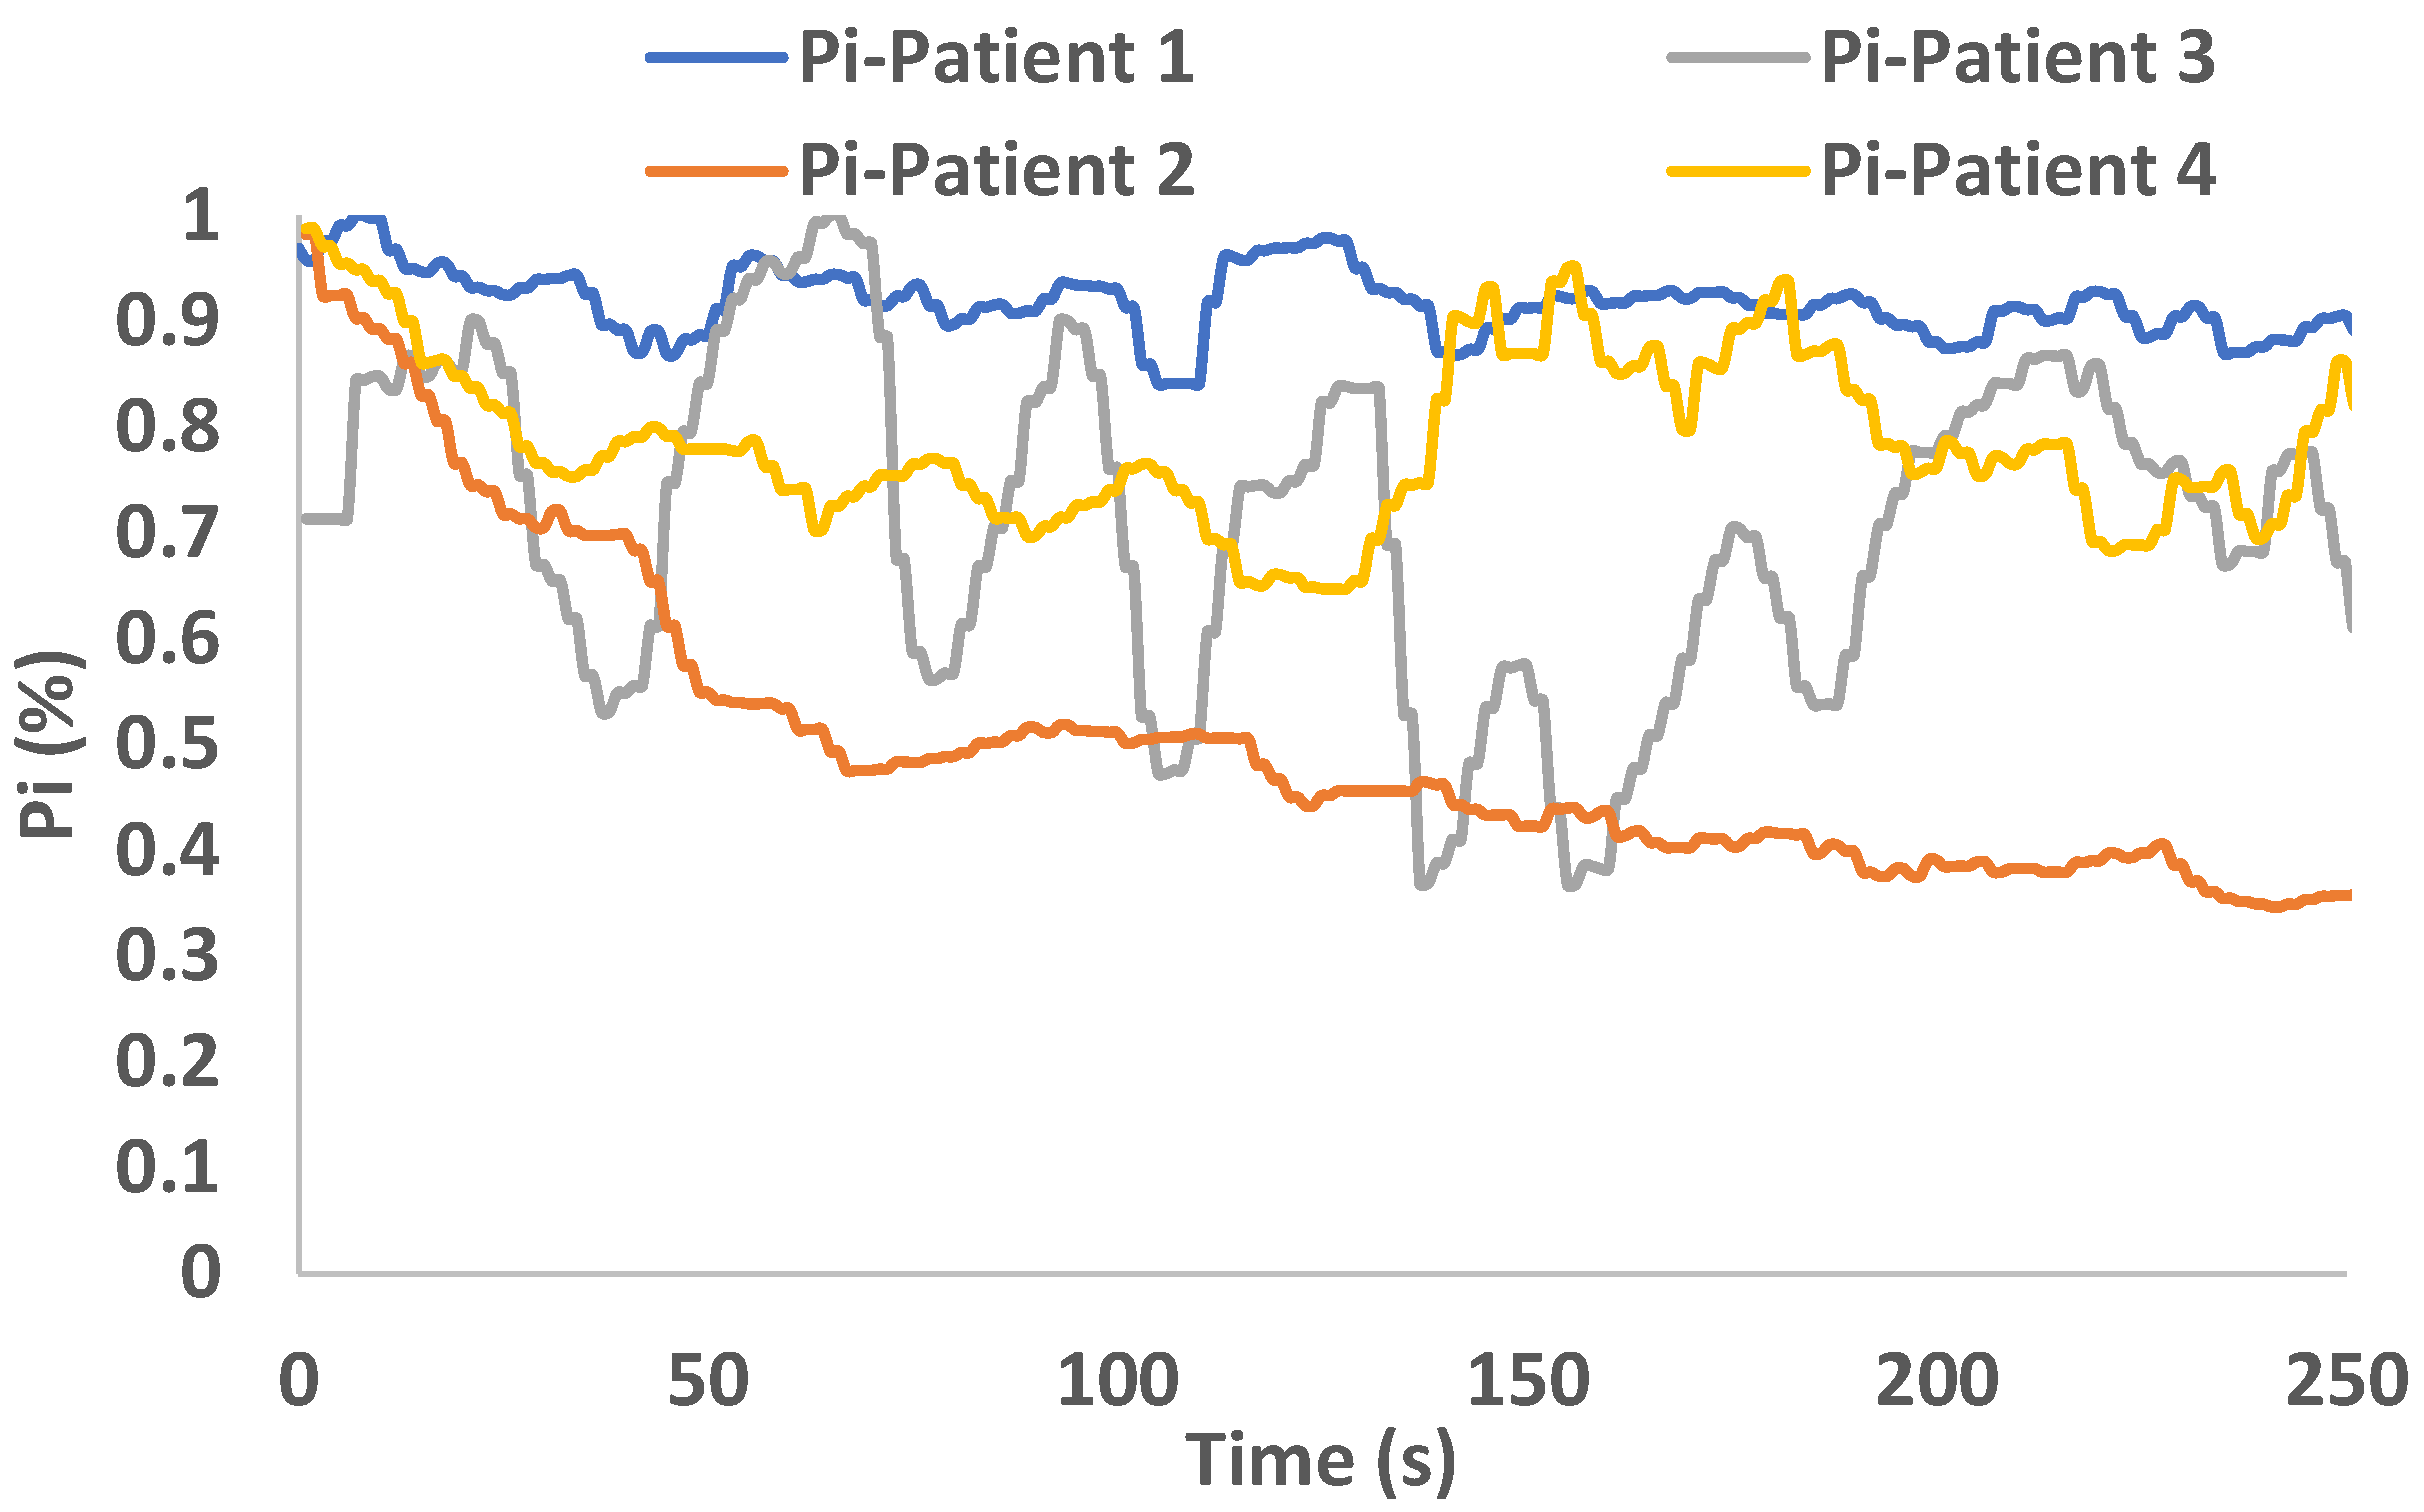
Figure 19 shows the RR/min of patients from 1 to 4 for 250 s and, finally,
Figure 20 shows the average value of PI of patients from 1 to 4 for 250 s.
Blood oxygen saturation values were correct in all cases. However, patient 1 was nervous or exercising due to tachycardia with highly variable respiration. The general conclusions are that those graphs do not show any pathology for patients 1 to 4.
In addition to the measured parameters, we are interested in collecting information on PVi (%), the shape of the dicrotic fissure, the value of the area under the curve, and a graphic representation of the plethysmographic curve. As we mentioned previously, the values of SpO
2, PR (bpm), RR/min, and Pi (%) are offered directly by the pulse oximeter. From the plethysmographic graph, we can obtain Pvi (%), the shape of the dicrotic fissure, and the area under the curve, analyzing it mathematically.
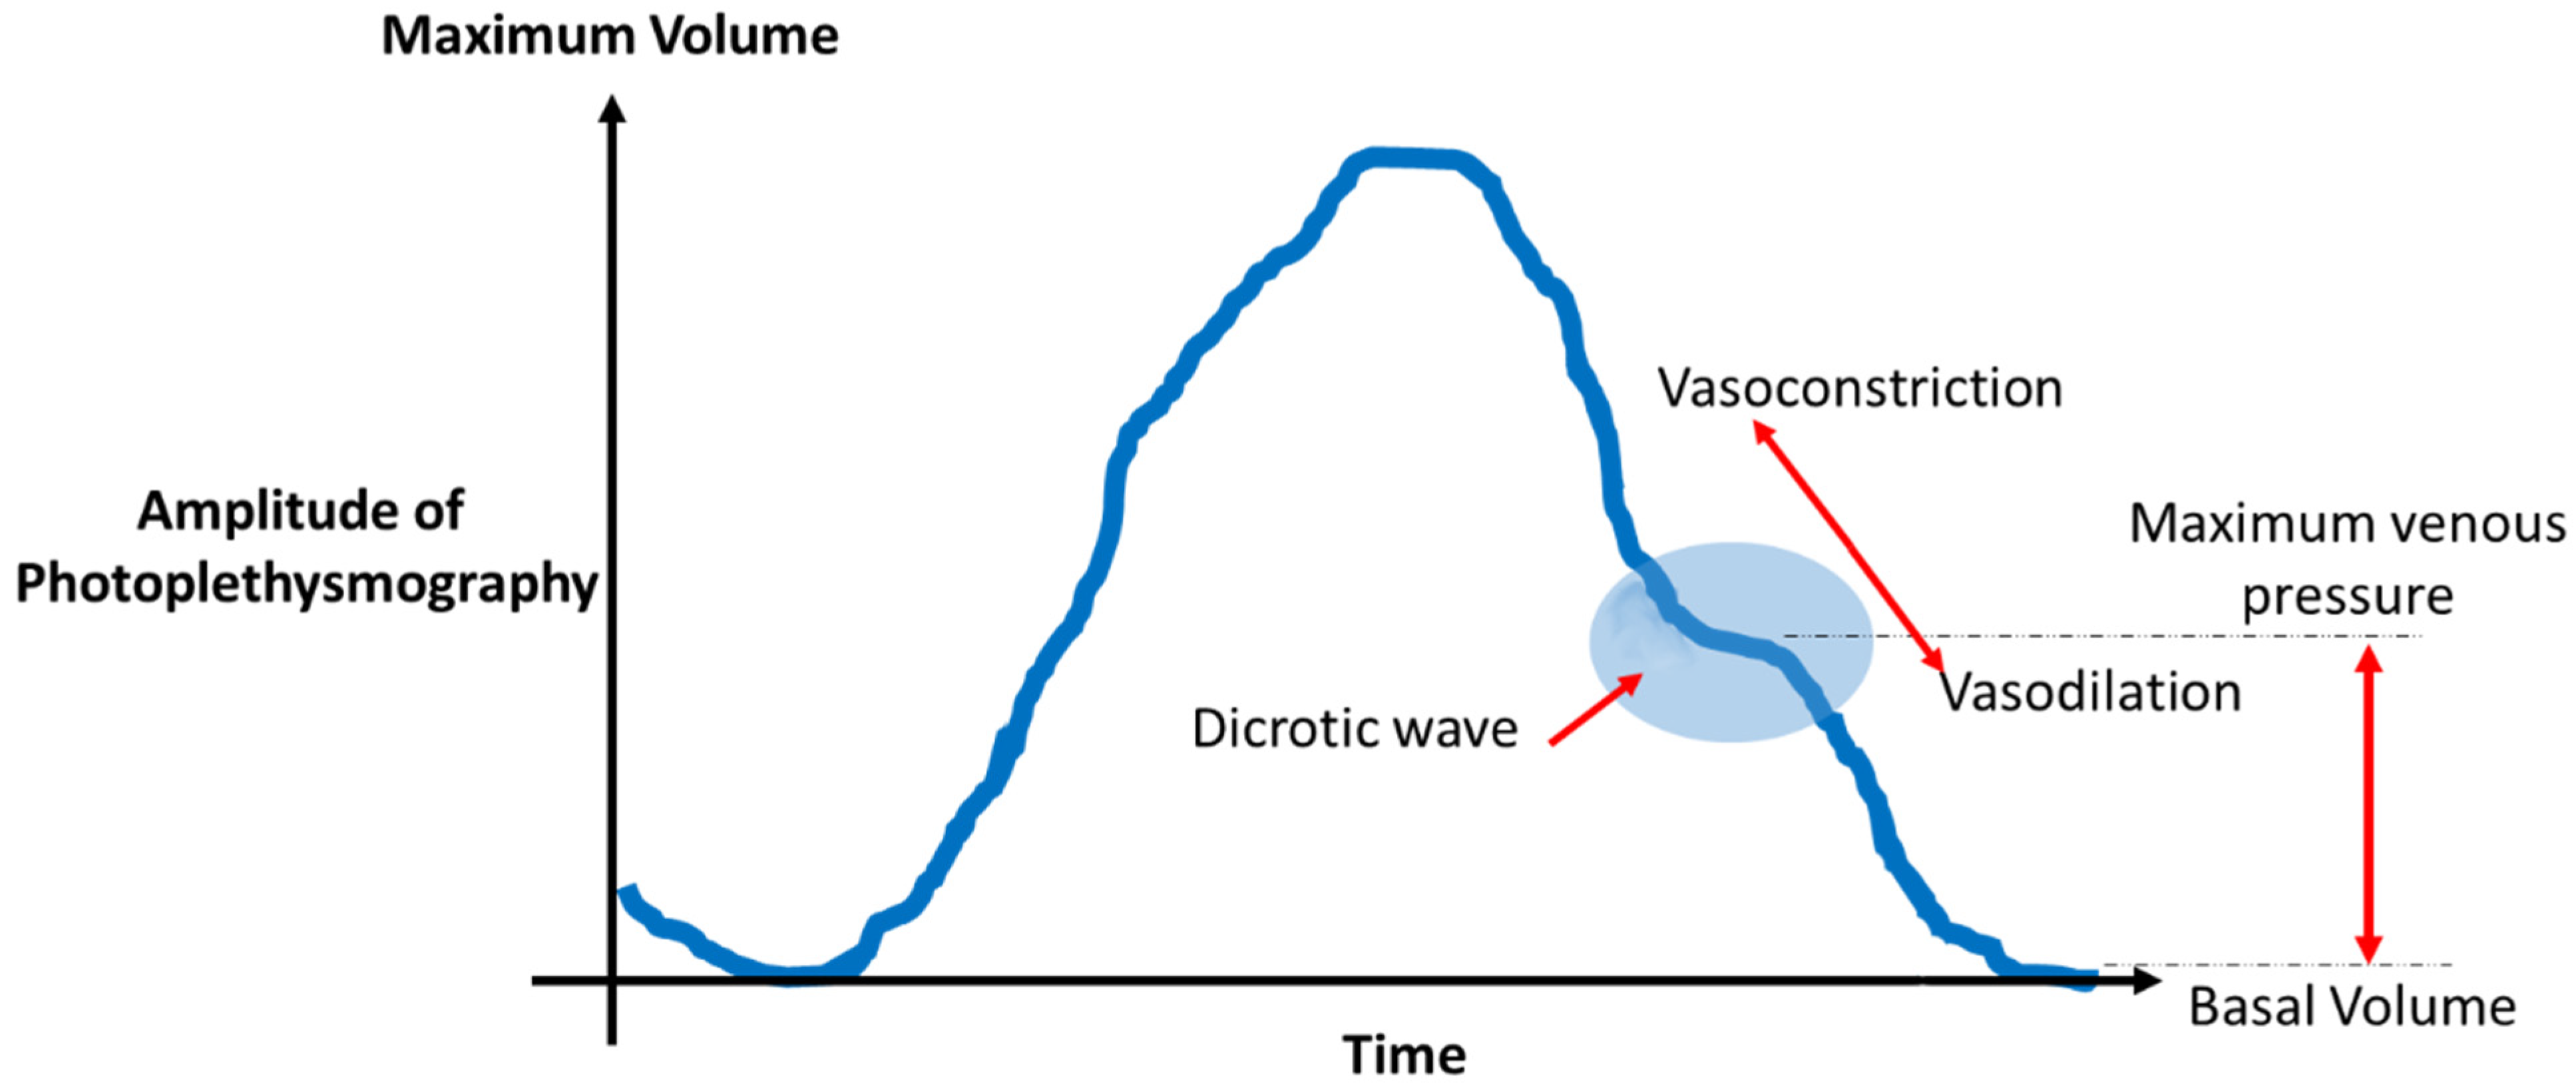
Figure 21 shows the plethysmography curve or the temporal evolution of the normalized absorption rate captured by a conventional pulse oximeter.
The following information can be analyzed and extracted through the waveform [
24,
25]:
Analysis of the amplitude of the pulse wave: The amplitude is the product of the systolic discharge and peripheral resistance. When peripheral resistance increases, the amplitude decreases, and vice versa. From the changes in the amplitude of the signal, we can determine if there is an episode of vasodilation (Significant increase in amplitude), for example, due to the presence of drugs, hyperthermia, or anesthesia in the patient. However, if the amplitude decreases, we will be able to detect vasoconstriction or hypovolemia in the patient;
Analysis of the area under the curve (AUC): The AUC represents the volume of blood scanned by the transducer in the tissue. This value is directly related to the systolic discharge and vasomotor tone of the tissue. We can differentiate three components:
- (a)
Ascending branch of the wave (systolic phase of the cardiac cycle): This corresponds to the initial phase of filling the arterial bed with systolic discharge and the subsequent arrival of blood to the tissue. This value depends on the contractility of the heart muscle;
- (b)
Descending branch: This corresponds to the distribution, in the arterial tree, of the blood ejected during systole. This value depends on vasomotor tone;
- (c)
Baseline: This corresponds to the baseline diastolic pressure. During this phase, the incoming flow is matched with the outgoing flow and is always related to the transducer place;
Analysis of the dicrotic fissure: This is a flatter area found in the descending branch. It represents the area where the change from systole to diastole is recorded. Systole is the contracting phase of the heart, where blood is pumped into the veins, and diastole is the relaxation phase, which allows blood to enter the heart. It is possible to make different interpretations of the changes in the position of the dicrotic fissure (see
Table 3):
- (a)
Vasodilation (lowering of the curve);
- (b)
Vasoconstriction (rise of the curve);
- (c)
Extreme vasodilation (migration of the curve towards the ascending branch);
Analysis of the base width of the wave: This parameter compares the base width of the wave and the distance between two successive peaks, and it indicates the relationship between the filling of the vascular bed (systolic discharge) and the vasomotor tone;
The perfusion index (PI): This is derived from the photoelectric plethysmographic signal of a pulse oximeter and is calculated as the ratio of the pulsatile component (arterial compartment) and the non-pulsatile component (venous blood, bone, connective tissue, etc.) of the light. PI has been used as a marker of peripheral perfusion and it is the ratio of blood flow through the peripheral capillary bed [
26];
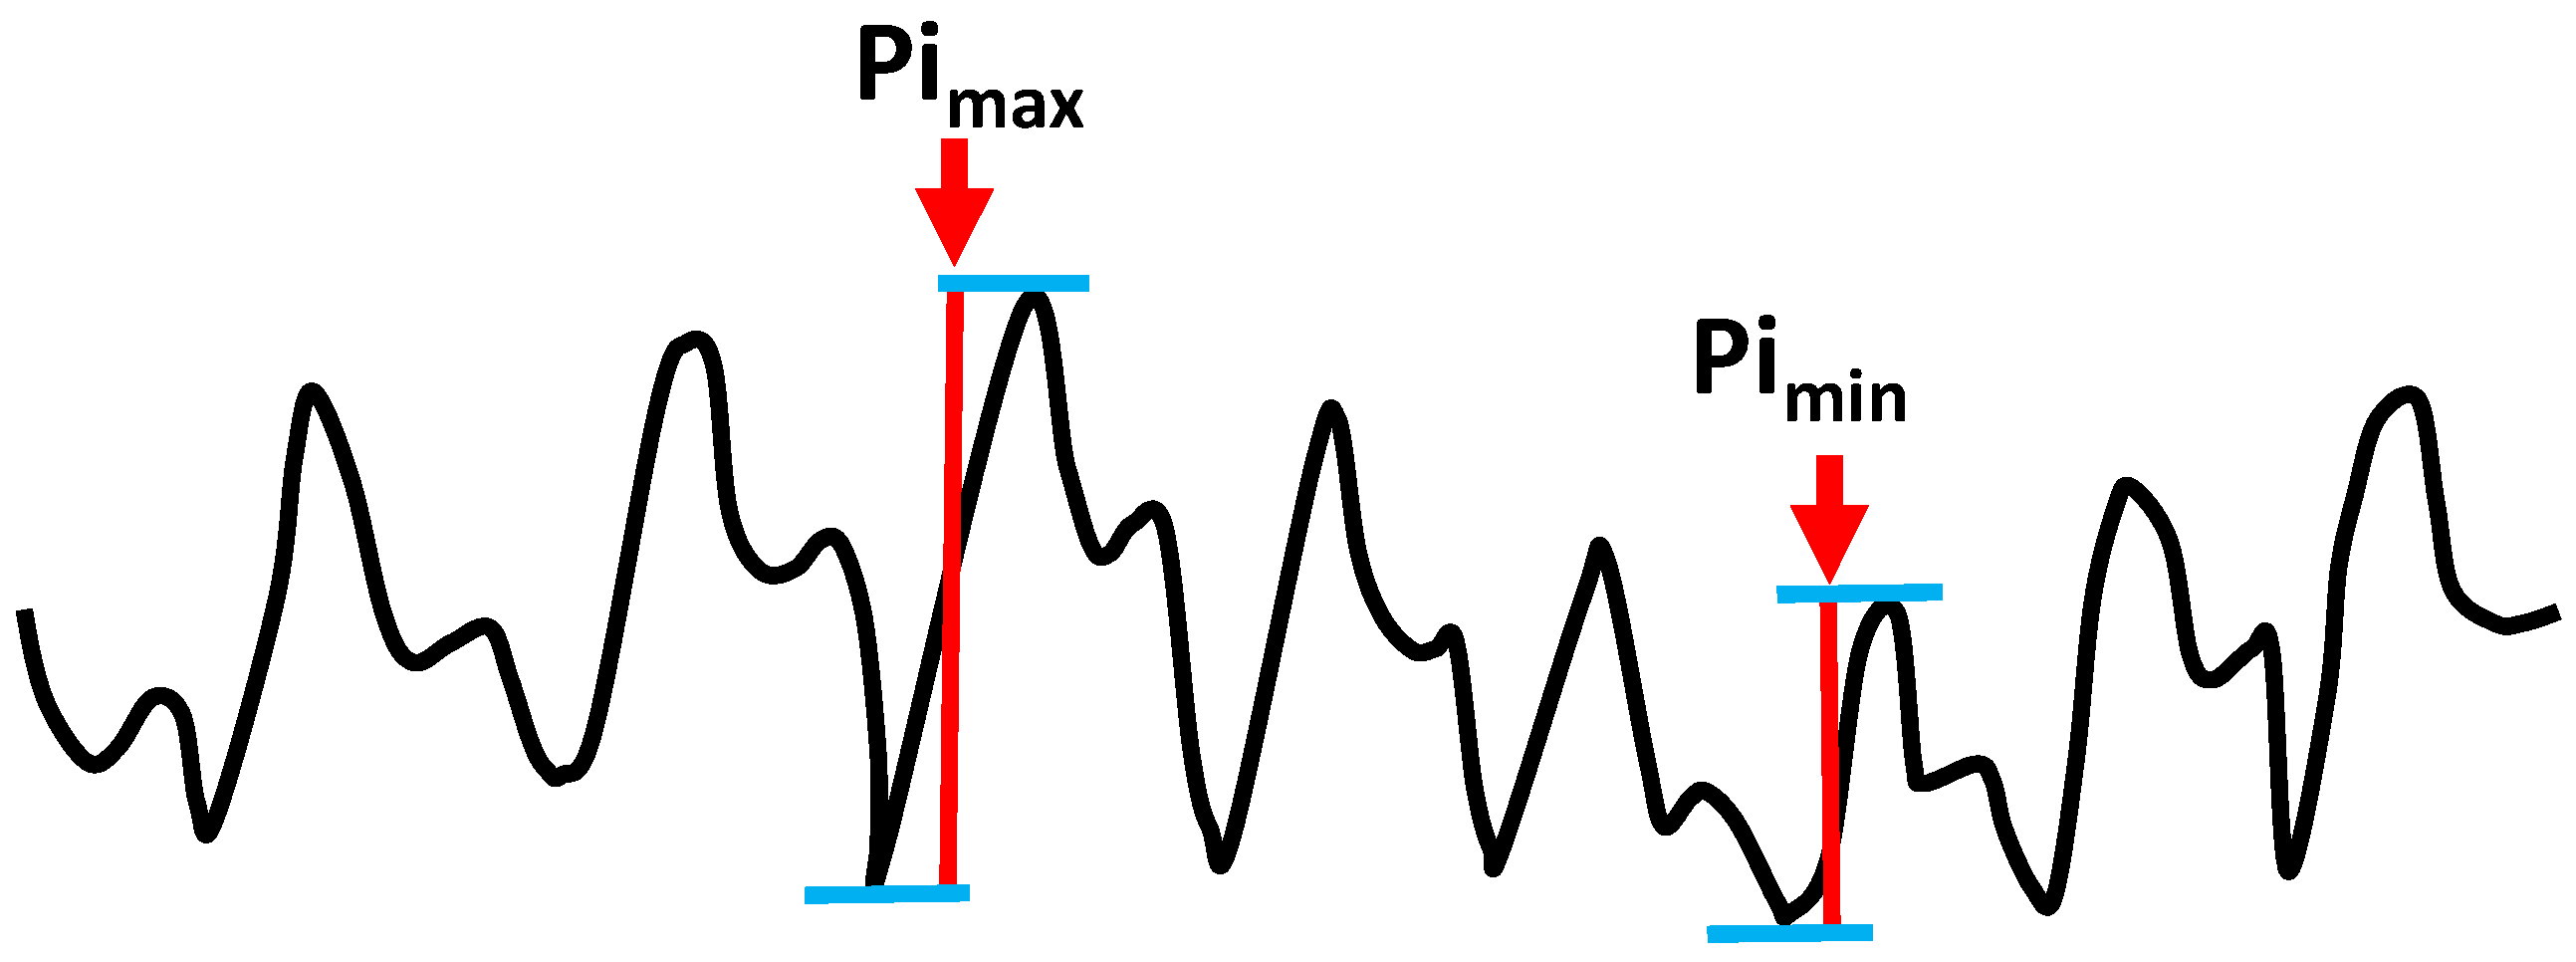
The Plethysmographic Variability Index (PVI: This is a noninvasive parameter that helps medical professionals monitor the response that a patient may have to a fluid administration. The calculation is based on measured changes in PI during a cycle. The PVi can be calculated by equation 1 while
Figure 22 shows the picture of a plethysmographic wave and how to measure both maximum perfusion index
and minimum perfusion index
:
.
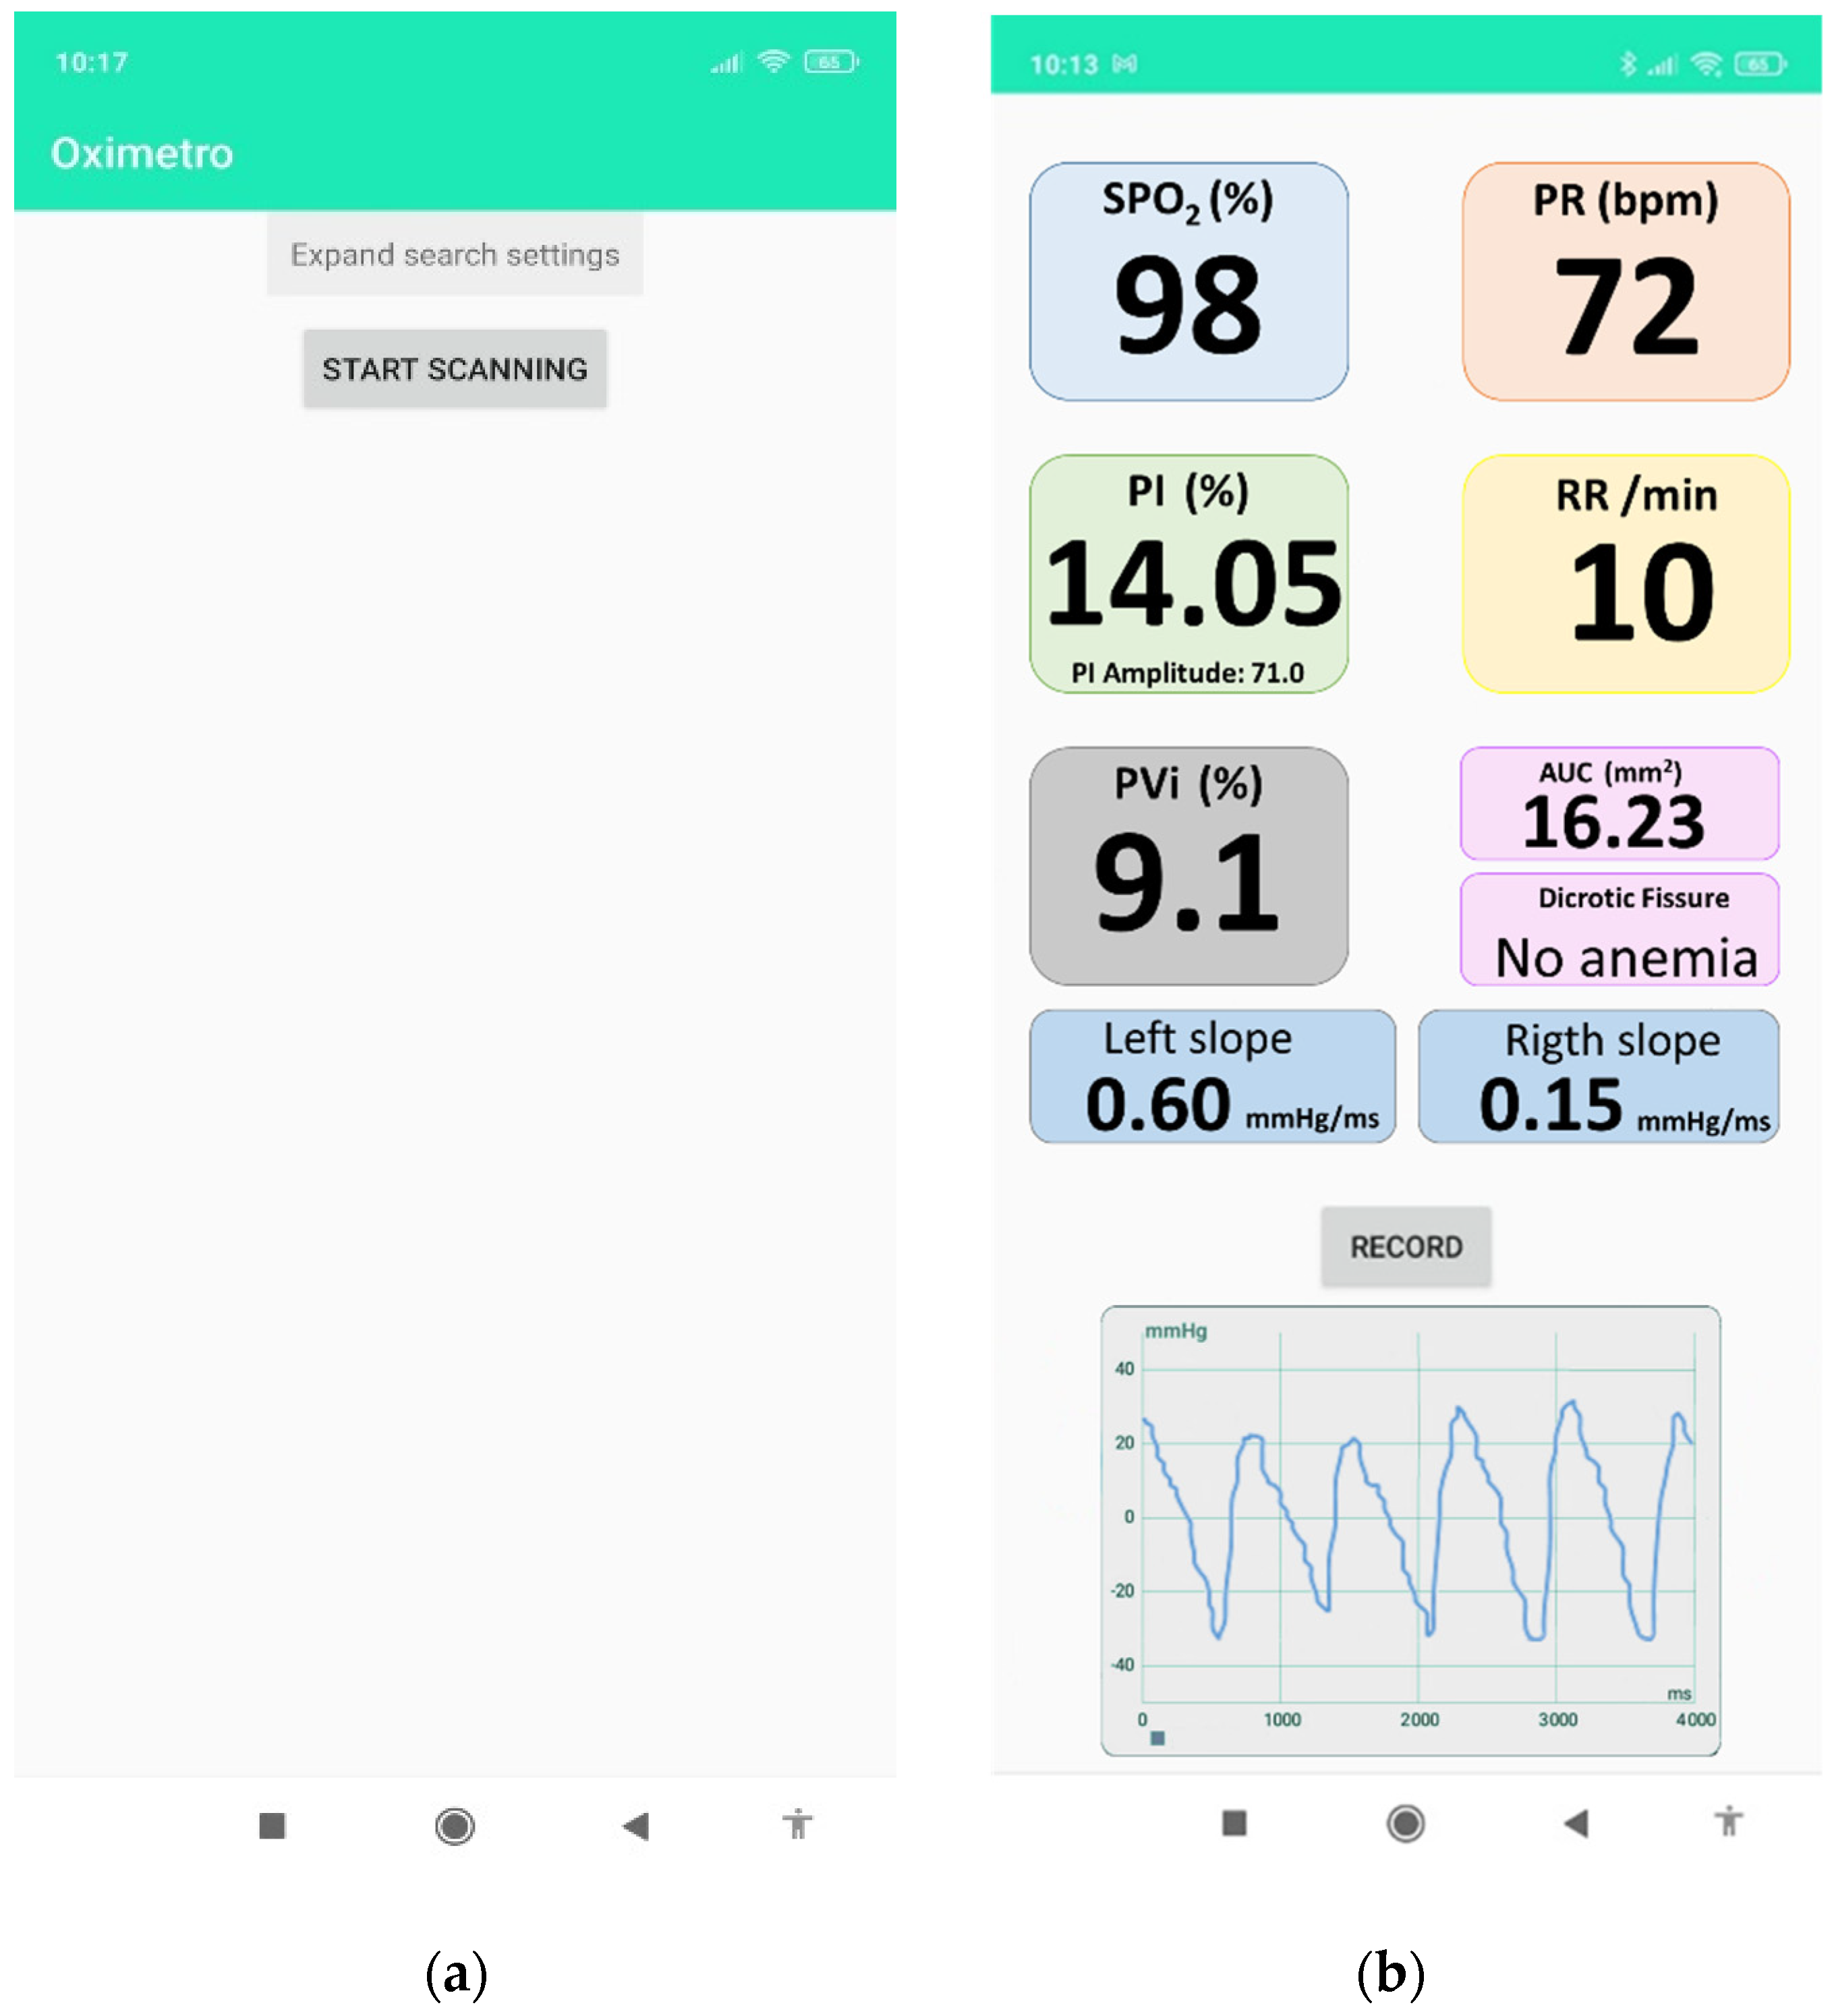
Finally, it is developed as an application for the Android platform. It allows for the management of the Bluetooth connection of the pulse oximeter (see
Figure 23a) and the collection of the vital parameters mentioned above (see
Figure 23b).
5. Conclusions and Future Work
In recent years, the use of Bluetooth-based peripherical devices with medical aims has gained great relevance in domestic and hospital environments. Likewise, the lowering cost of technology has also played an important role in this situation. Among the medical devices with a portable version, the finger pulse oximeter is the most relevant.
Considering that, this paper has presented the analysis and process carried out to determine how to interpret the different information that a commercial pulse oximeter can offer. This kind of device usually offers SpO2, PR (bpm), RR/min, and Pi (%) as parameters measurables. However, most of them can measure and collect the plethysmography wave from which important data from patients can be extracted. Concretely, the paper has shown how to extract the data from the plethysmography wave and how to analyze it to obtain the plethysmography wave, PVi (%), the shape of the dicrotic fissure, and the area under the curve, which are parameters closely related to different health problems beyond respiratory diseases. After extracting the data, the information has been graphically shown on a smartphone through an android application specifically designed for this device. The system was tested with different patients whose results were validated by a physician.
In conclusion, we can say that by using commercial devices that do not a priori offer more specific or useful medical data to determine certain medical problems we have been able to process the raw data offered by the commercial pulse oximeter to obtain useful information like the plethysmography waveform, PVi (%), dicrotic fissure shape, and area under the curve while maintaining the classic parameters of SpO2, PR (bpm), RR/min, and Pi (%). Finally, the Android application offers the user a simple interface that allows any user without extensive knowledge to read them. With this, we created cheaper diagnostic systems that will allow developing countries and users with few resources to make use of specific devices for monitoring the progress of certain diseases.
As several publications recommend, this type of development should not replace face-to-face medical attendance. However, they can contribute to reducing the number of visits to hospitals and permitting the remote tracking of treatments by physicians, as well as quick detection of health problems in order for them to be solved as soon as possible.
For future work, we would like to develop another pulse oximeter and include other sensors such as temperature and gyroscope to determine if measures are correctly done and to include the diagnoses of other pathologies. Additionally, it could be interesting to create a framework to include several devices like the one presented in this paper and others such as glucose meters or weighing machines. We finally consider the presence of an active connection to the cloud to centralize the data collection to apply machine learning to enhance the clinical monitoring of patients and their progress.

 ,
, 


