
Intraocular Pressure-Induced Endothelial Dysfunction of Retinal Blood Vessels Is Persistent, but Does Not Trigger Retinal Ganglion Cell Loss
 , , , and
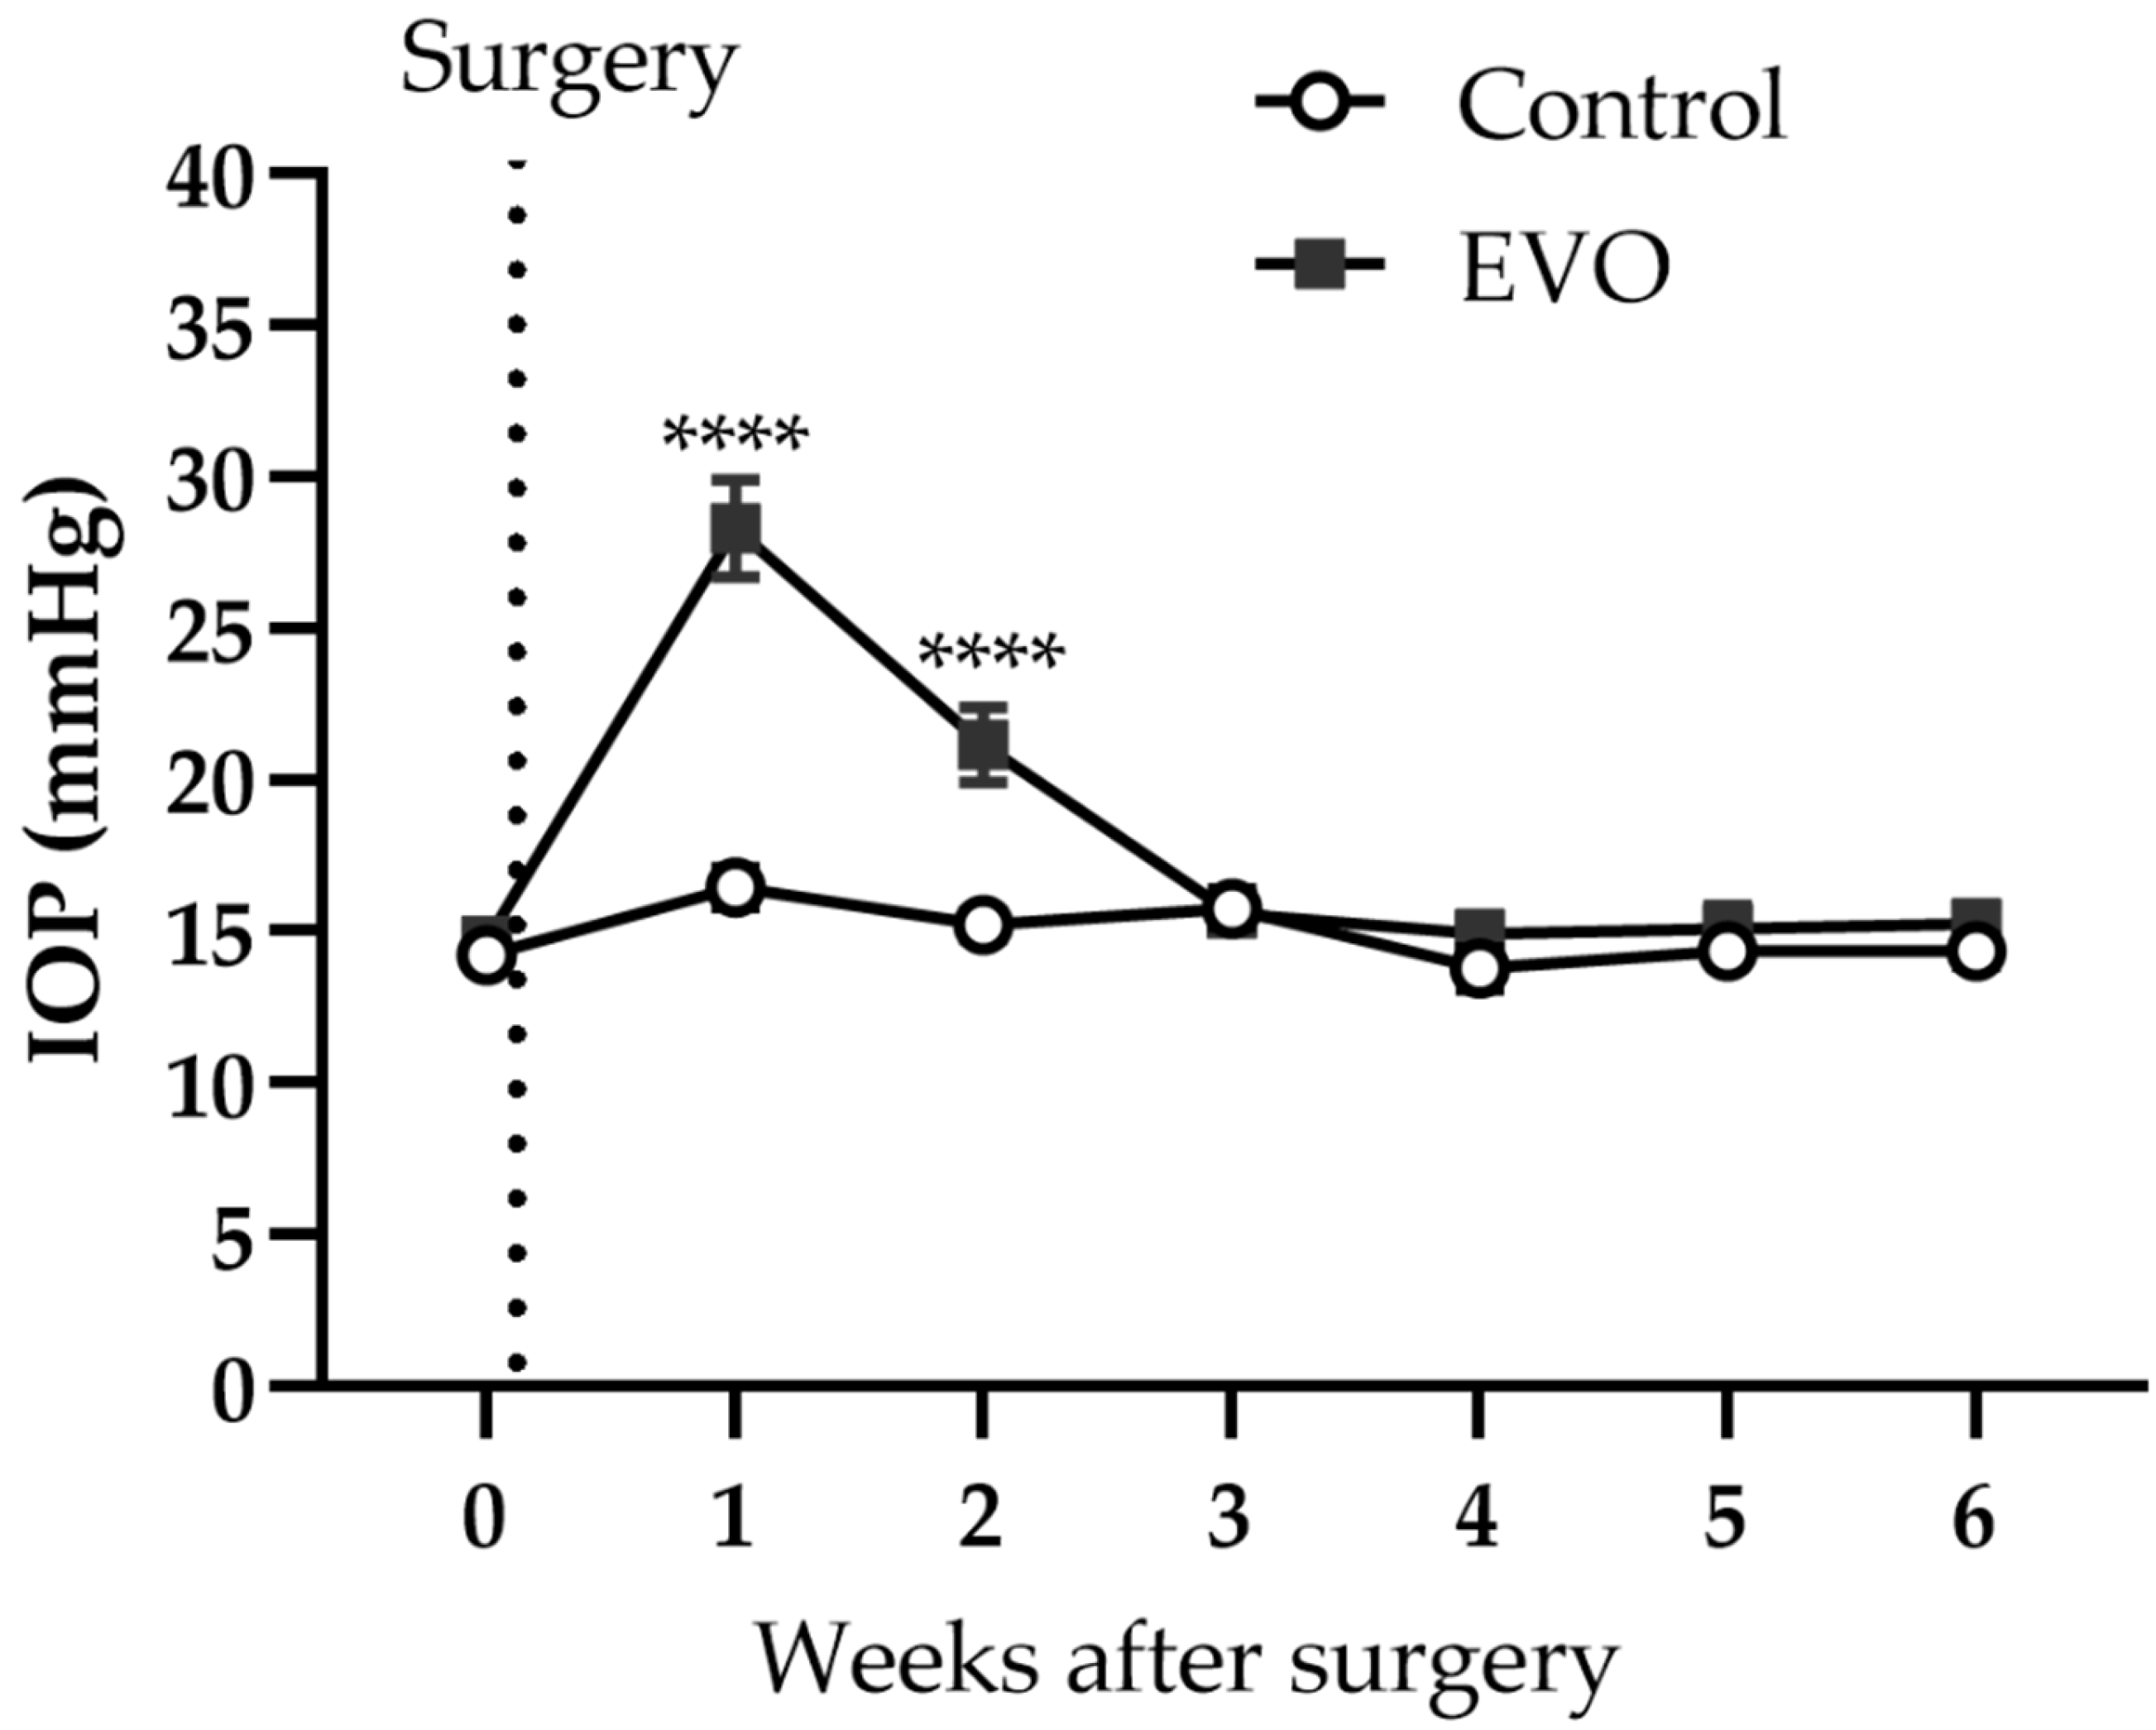
Abstract
:1. Introduction
2. Materials and Methods
2.1. Animals
2.2. Experimental Design
2.3. IOP Monitoring
2.4. Induction of Glaucoma
2.5. Measurement of Vascular Reactivities in Retinal Arterioles
2.6. Quantification of Reactive Oxygen Species (ROS)
2.7. Immunostaining on Retinal Cryosections
2.8. Quantification of Gene Expression by Real-Time PCR
2.9. Immunostaining on Retinal Flatmounts
2.10. Assessment of Optic Nerve Degeneration
2.11. Statistic Analysis
3. Results
3.1. EVO Induced Reversible IOP Elevation
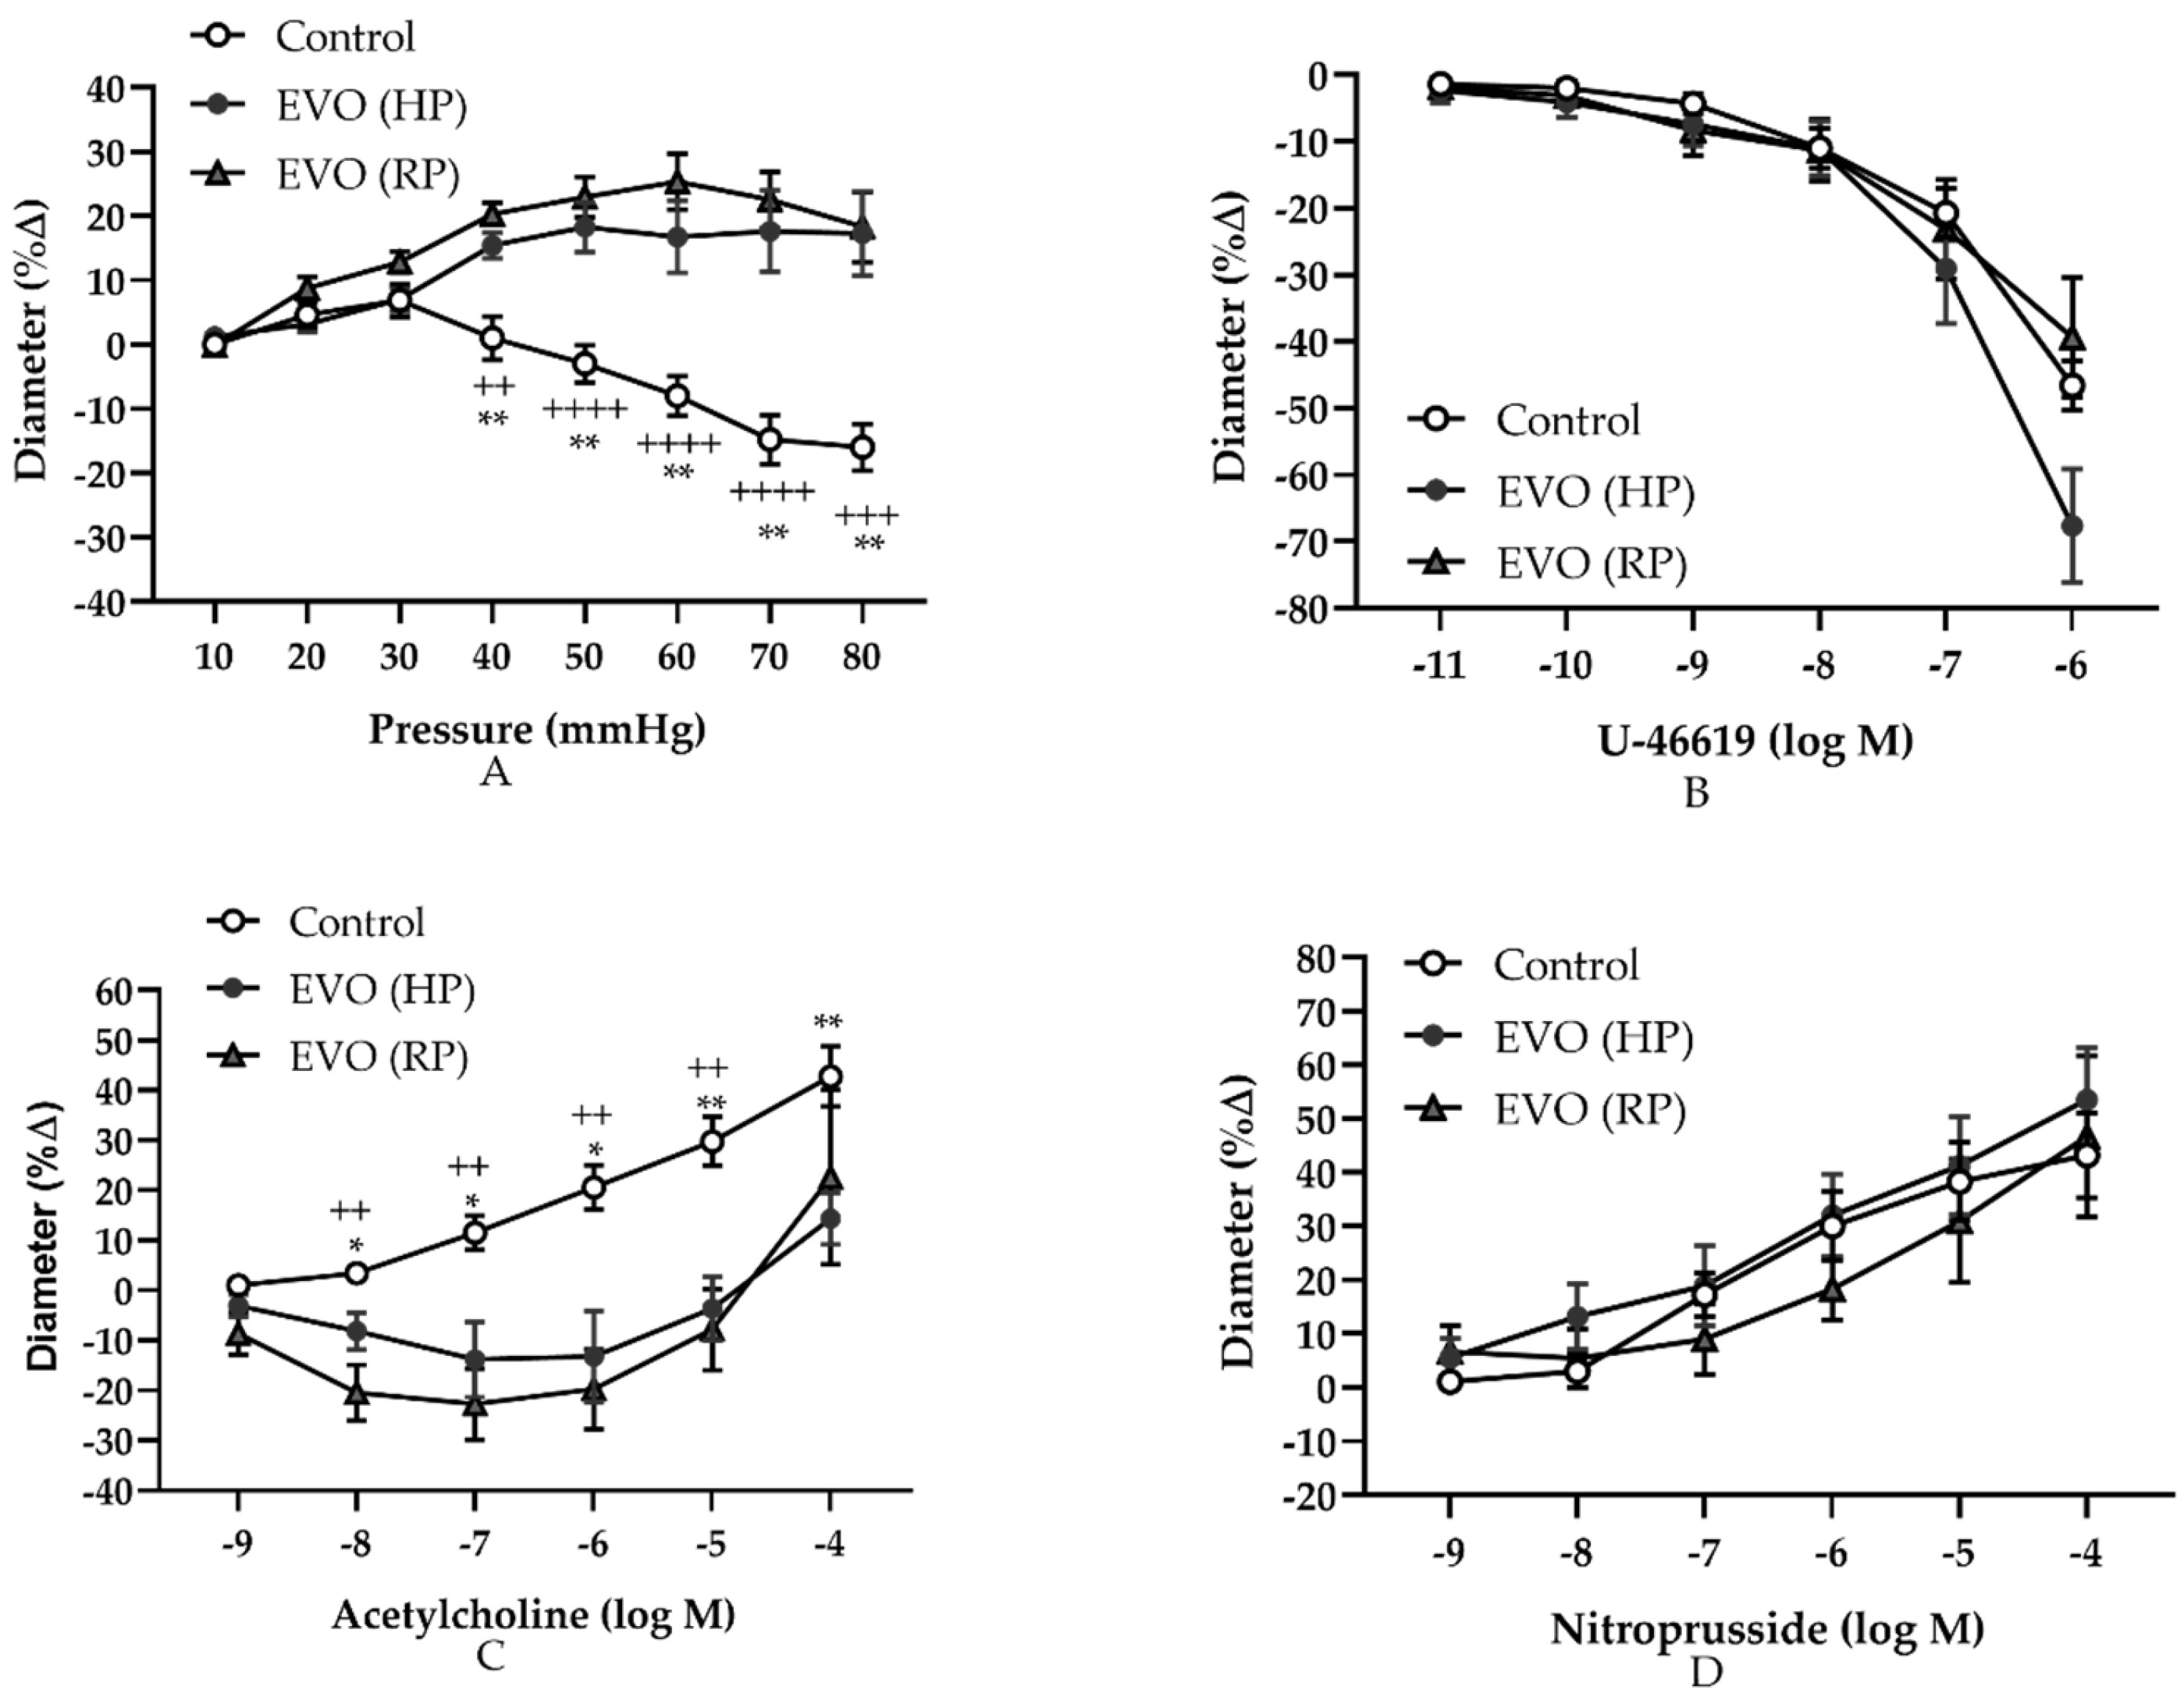
3.2. Elevated IOP Induced Persistently Abnormal Autoregulation and Endothelial Dysfunction in Retinal Arterioles
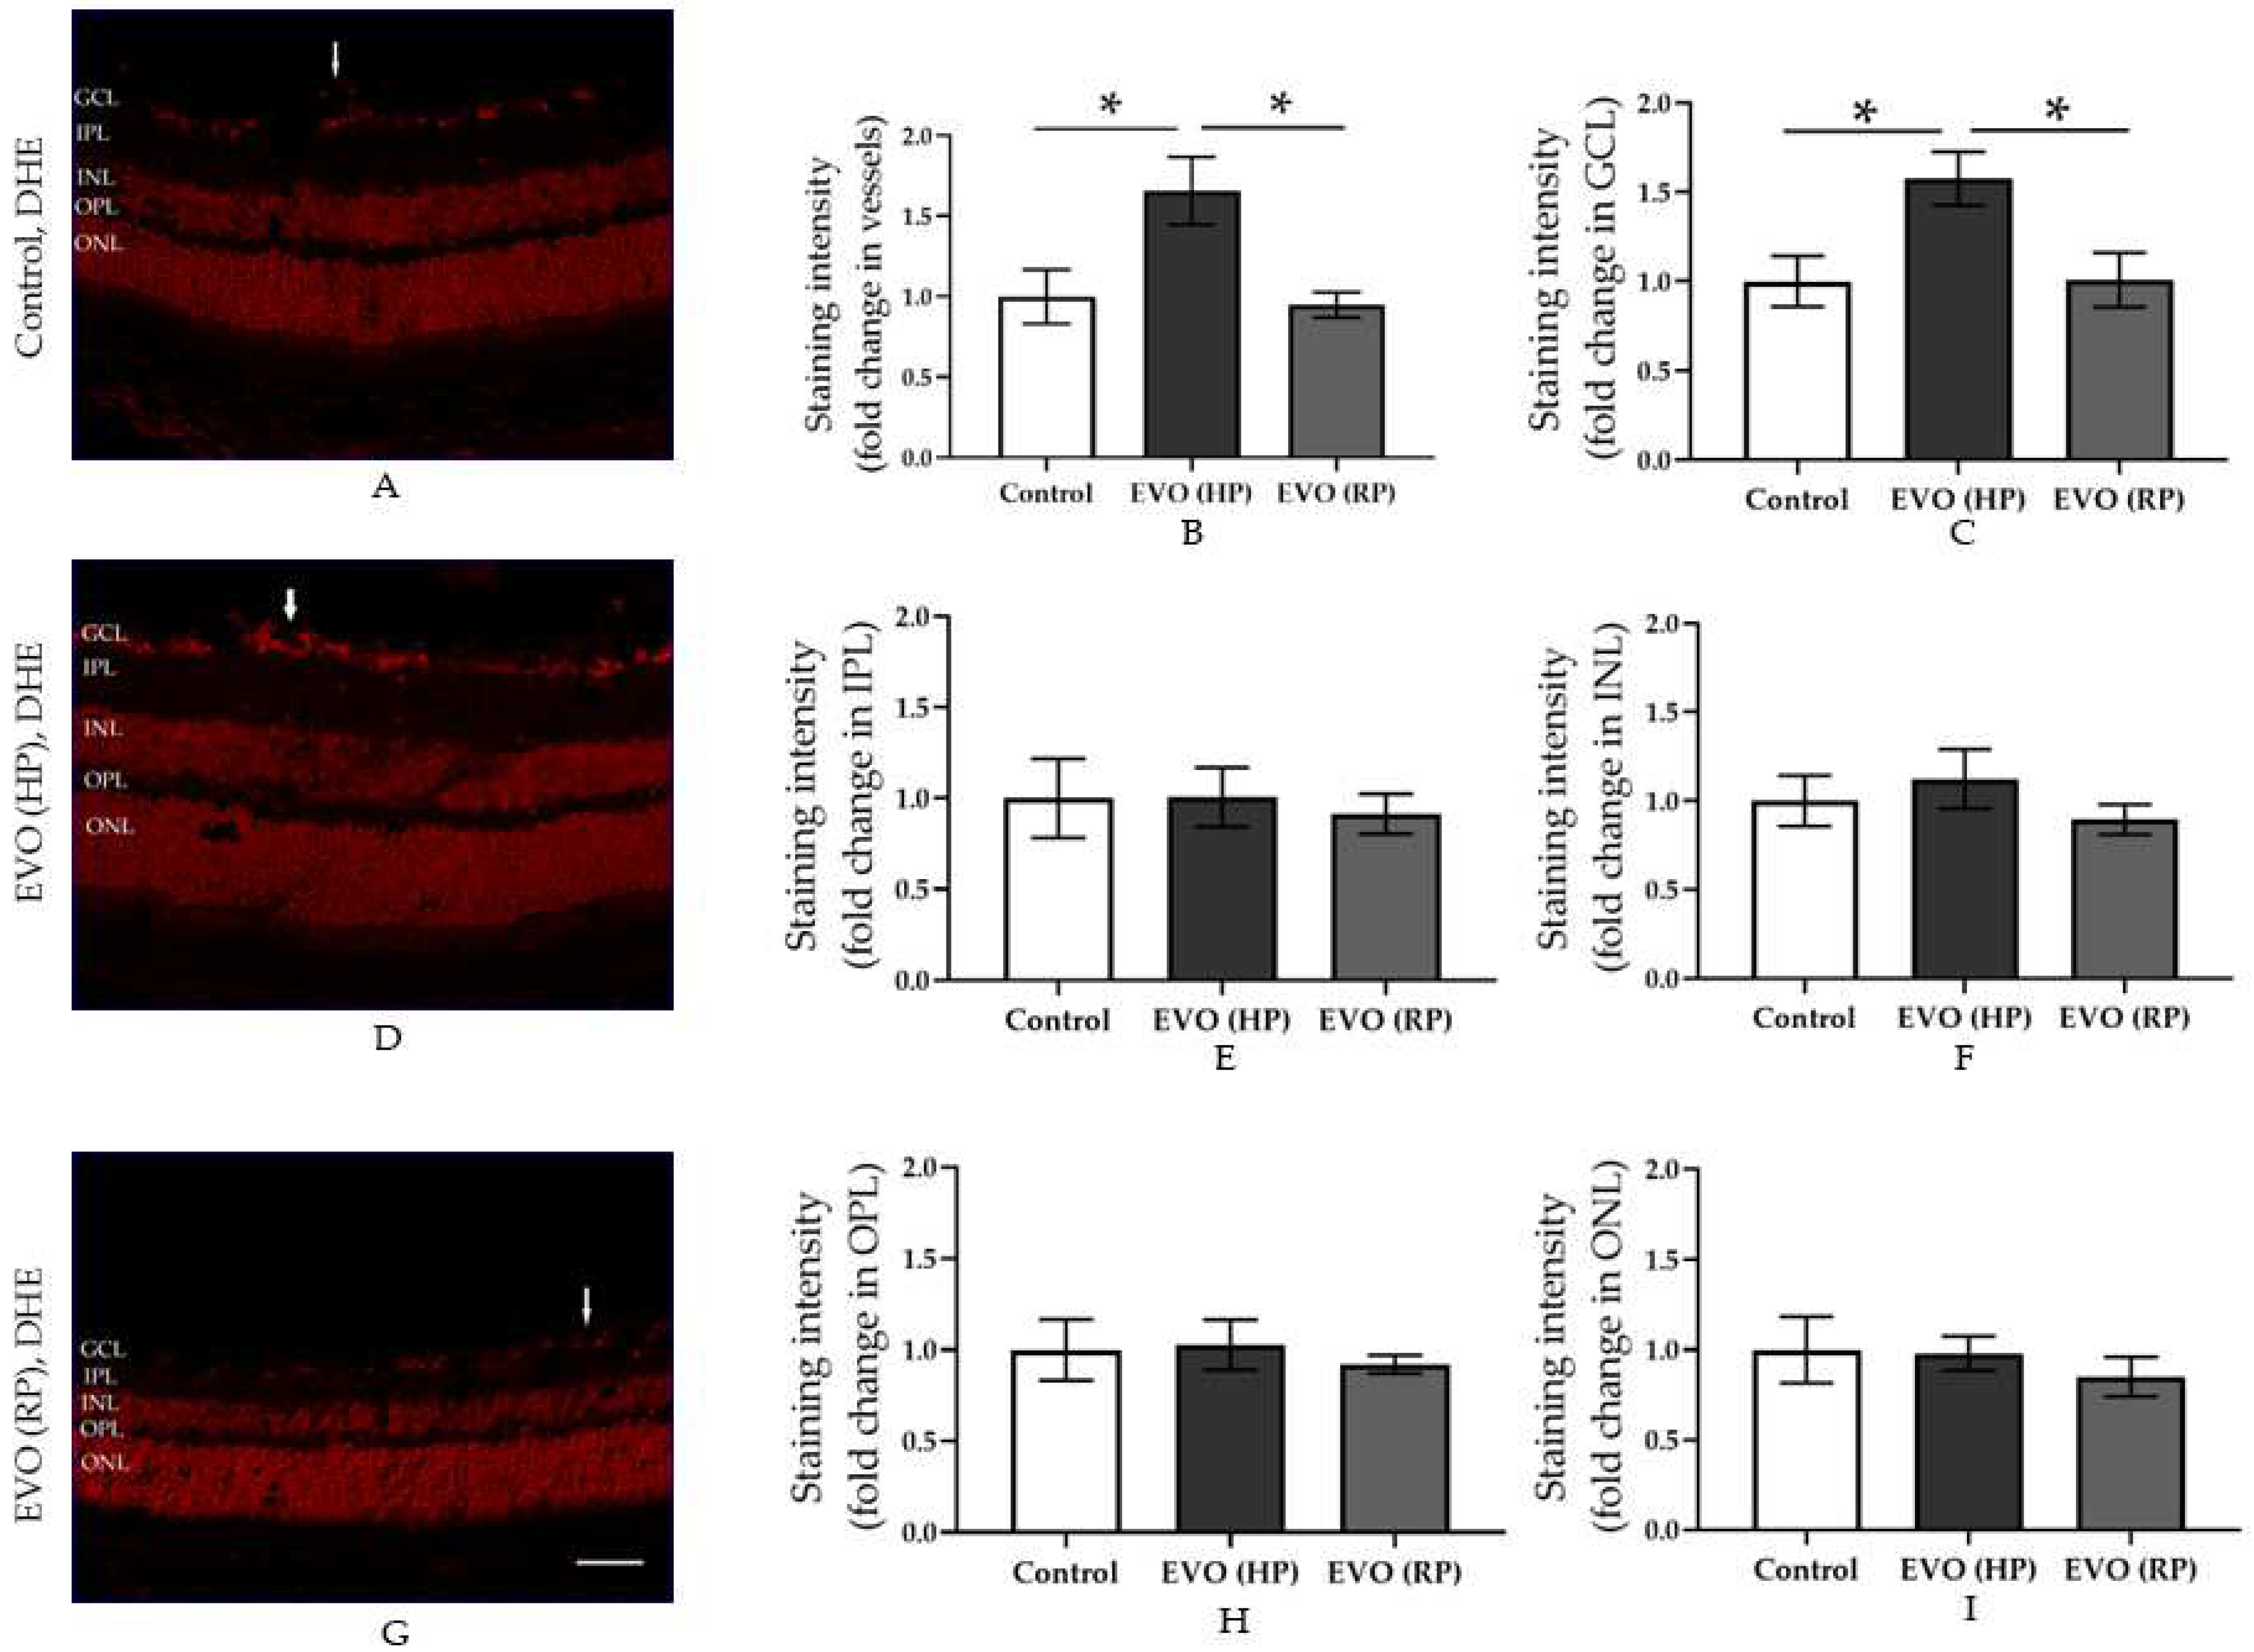
3.3. Elevated IOP Reversibly Increased the Retinal ROS Concentration
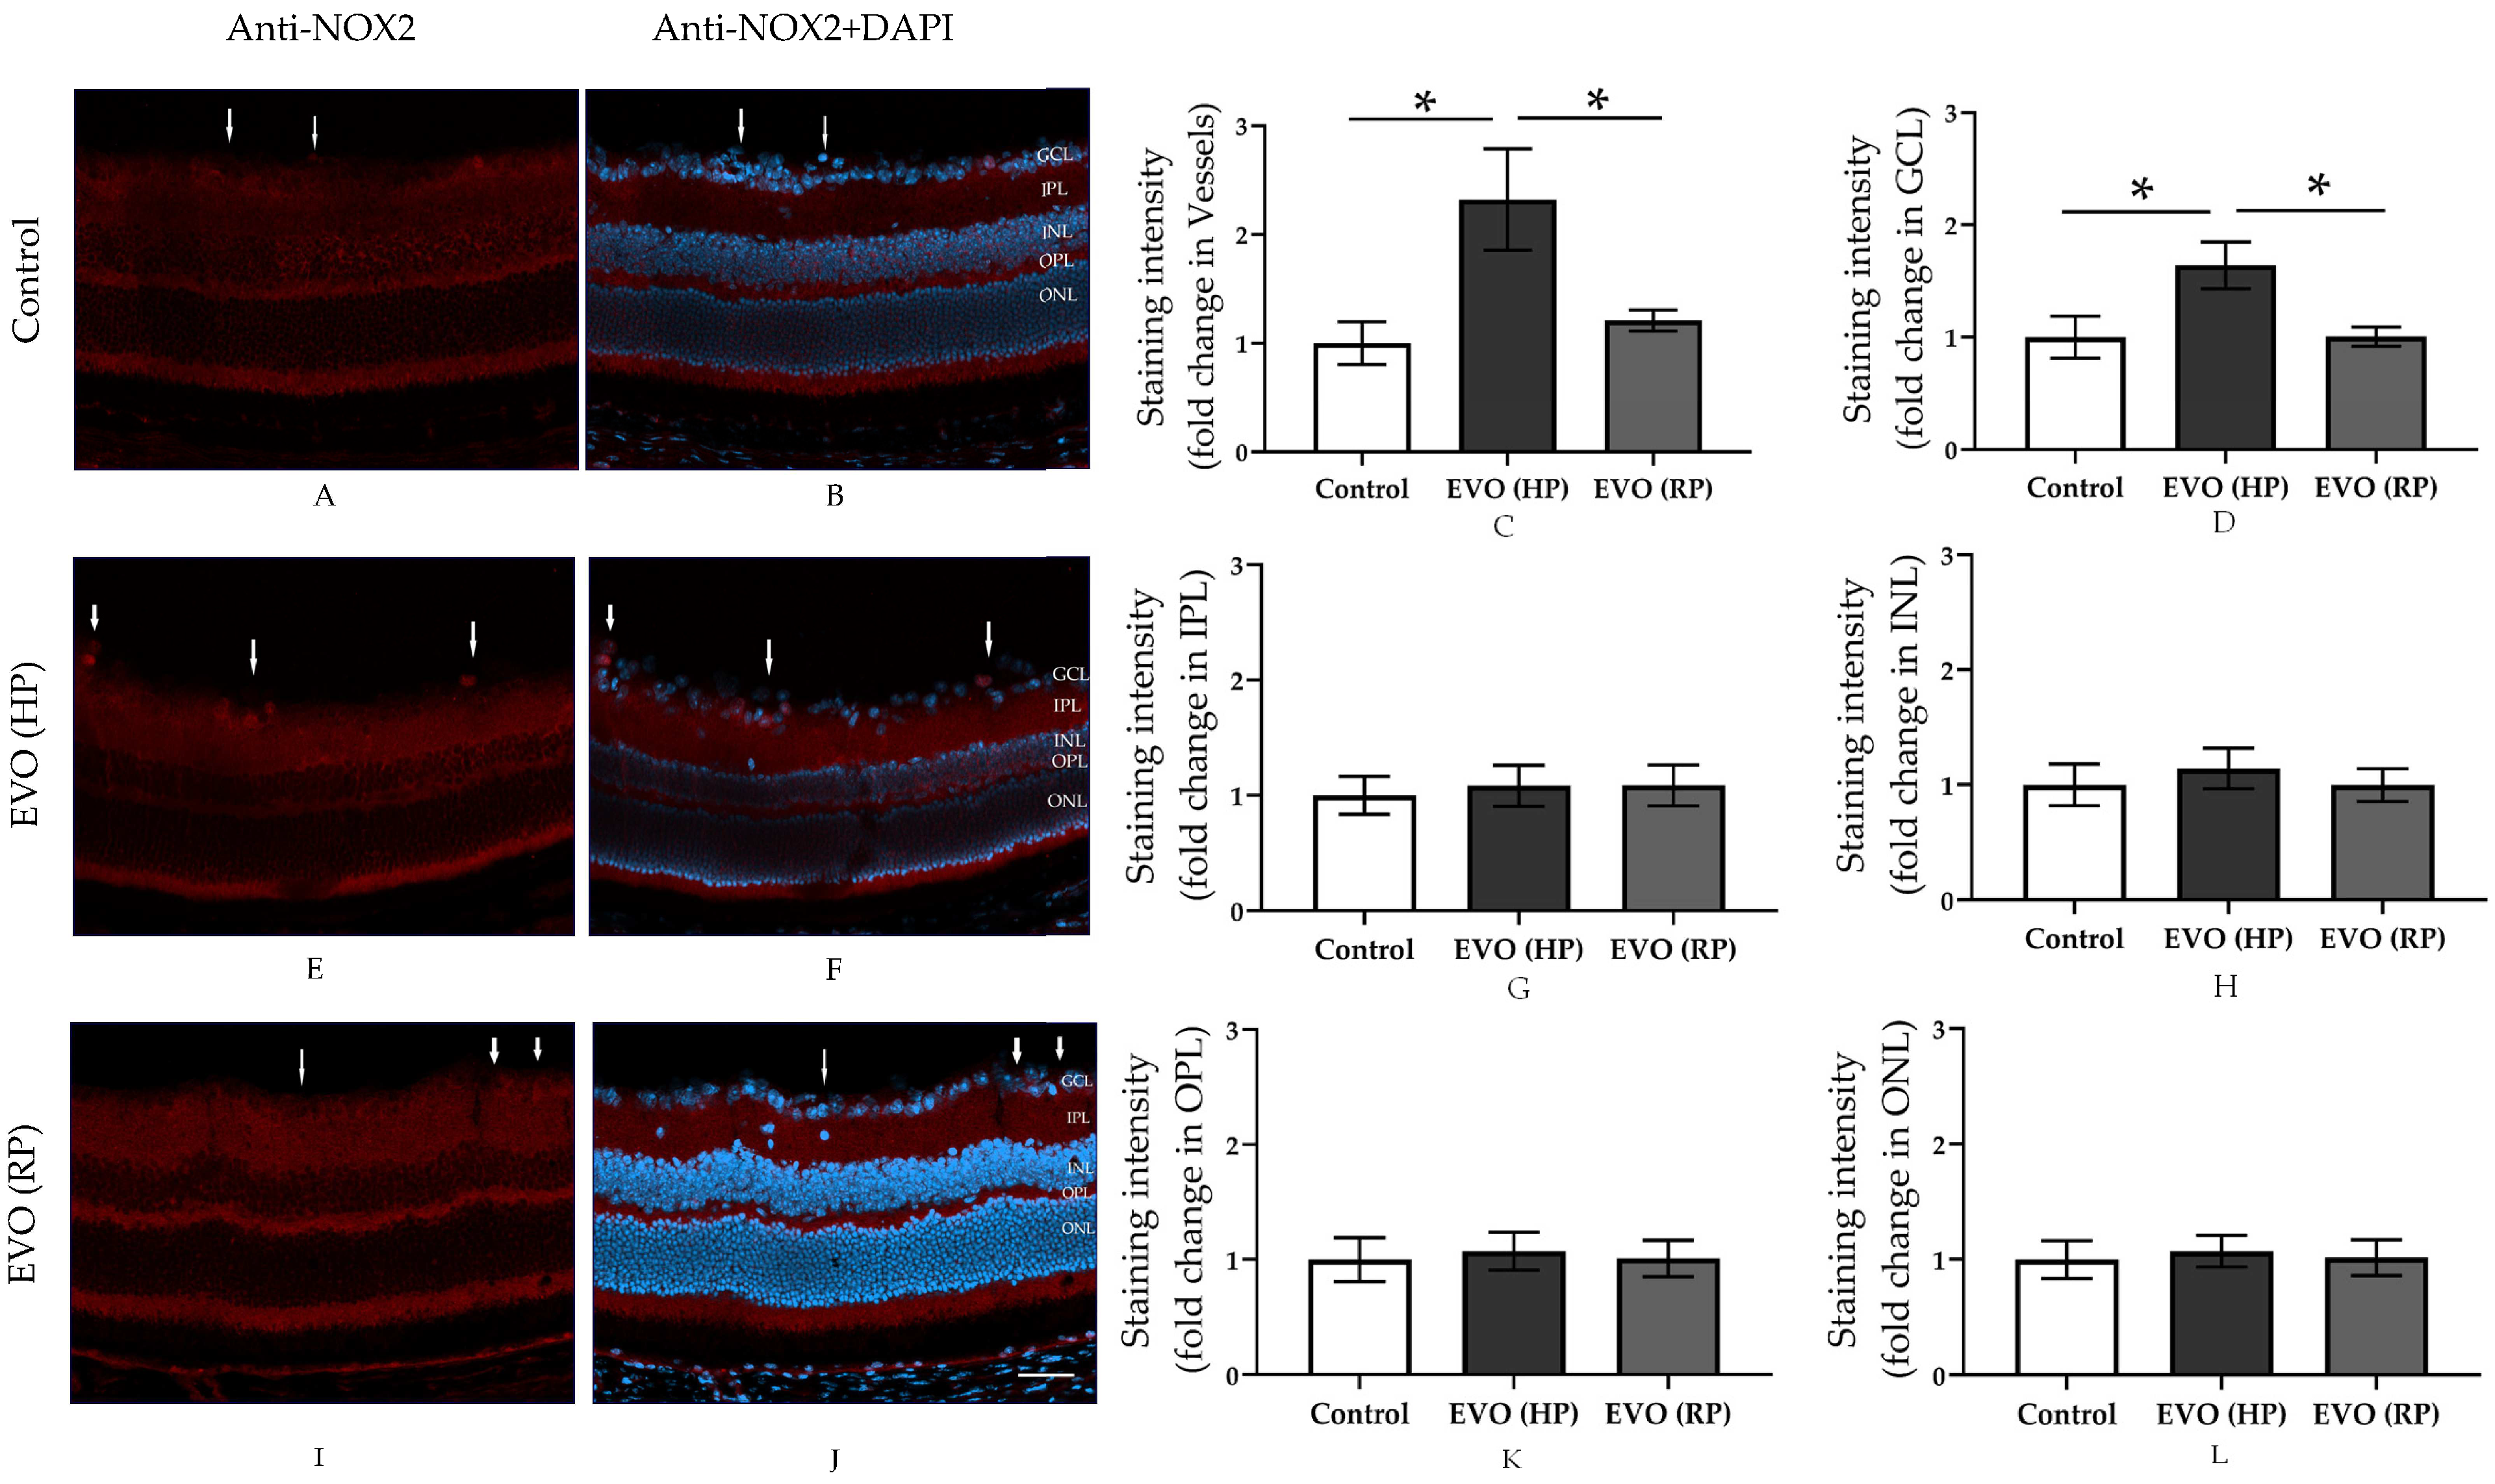
3.4. Elevated IOP Reversibly Increased the Expression of NOX2 in the Retina
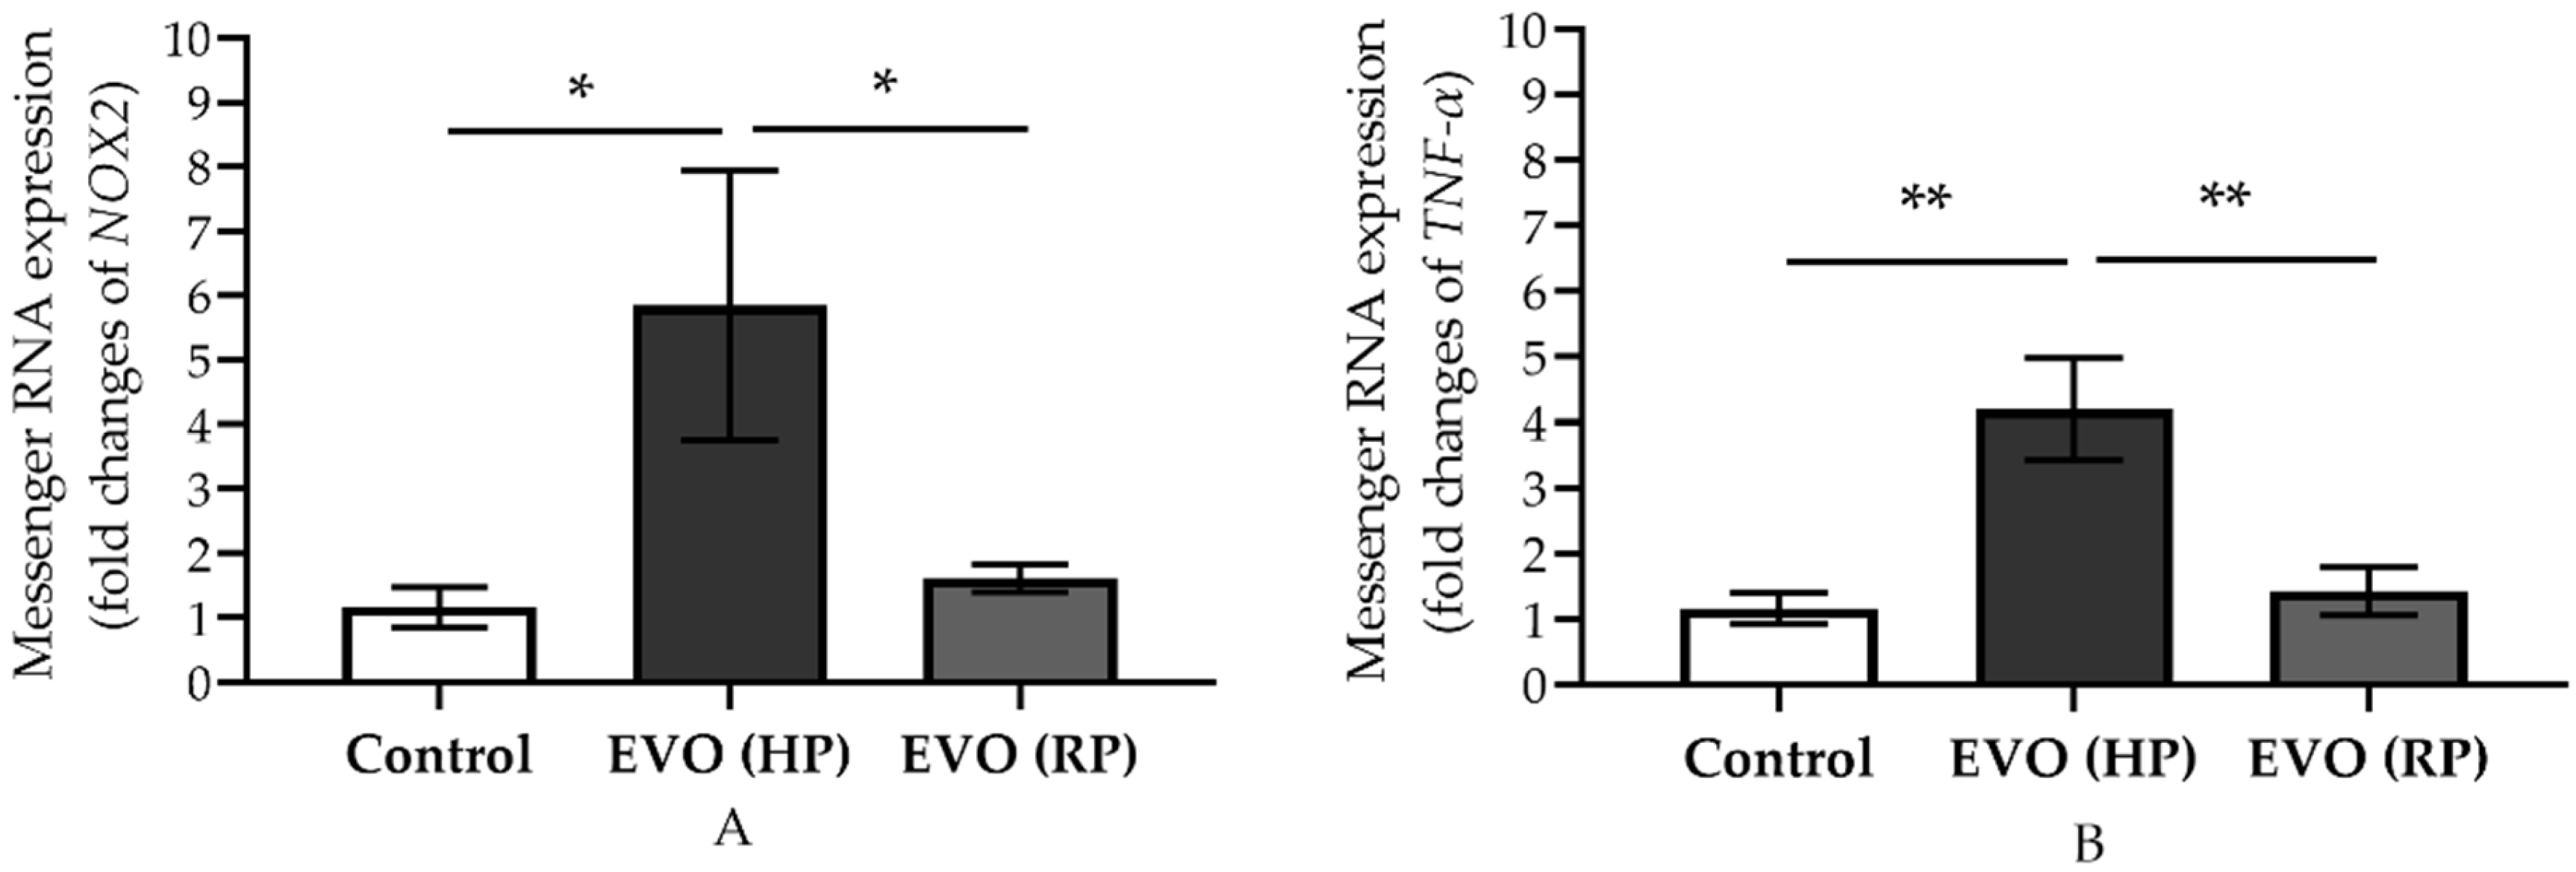
3.5. Elevated IOP Reversibly Increased the Expression of Messenger RNA of NOX2 and TNF-α
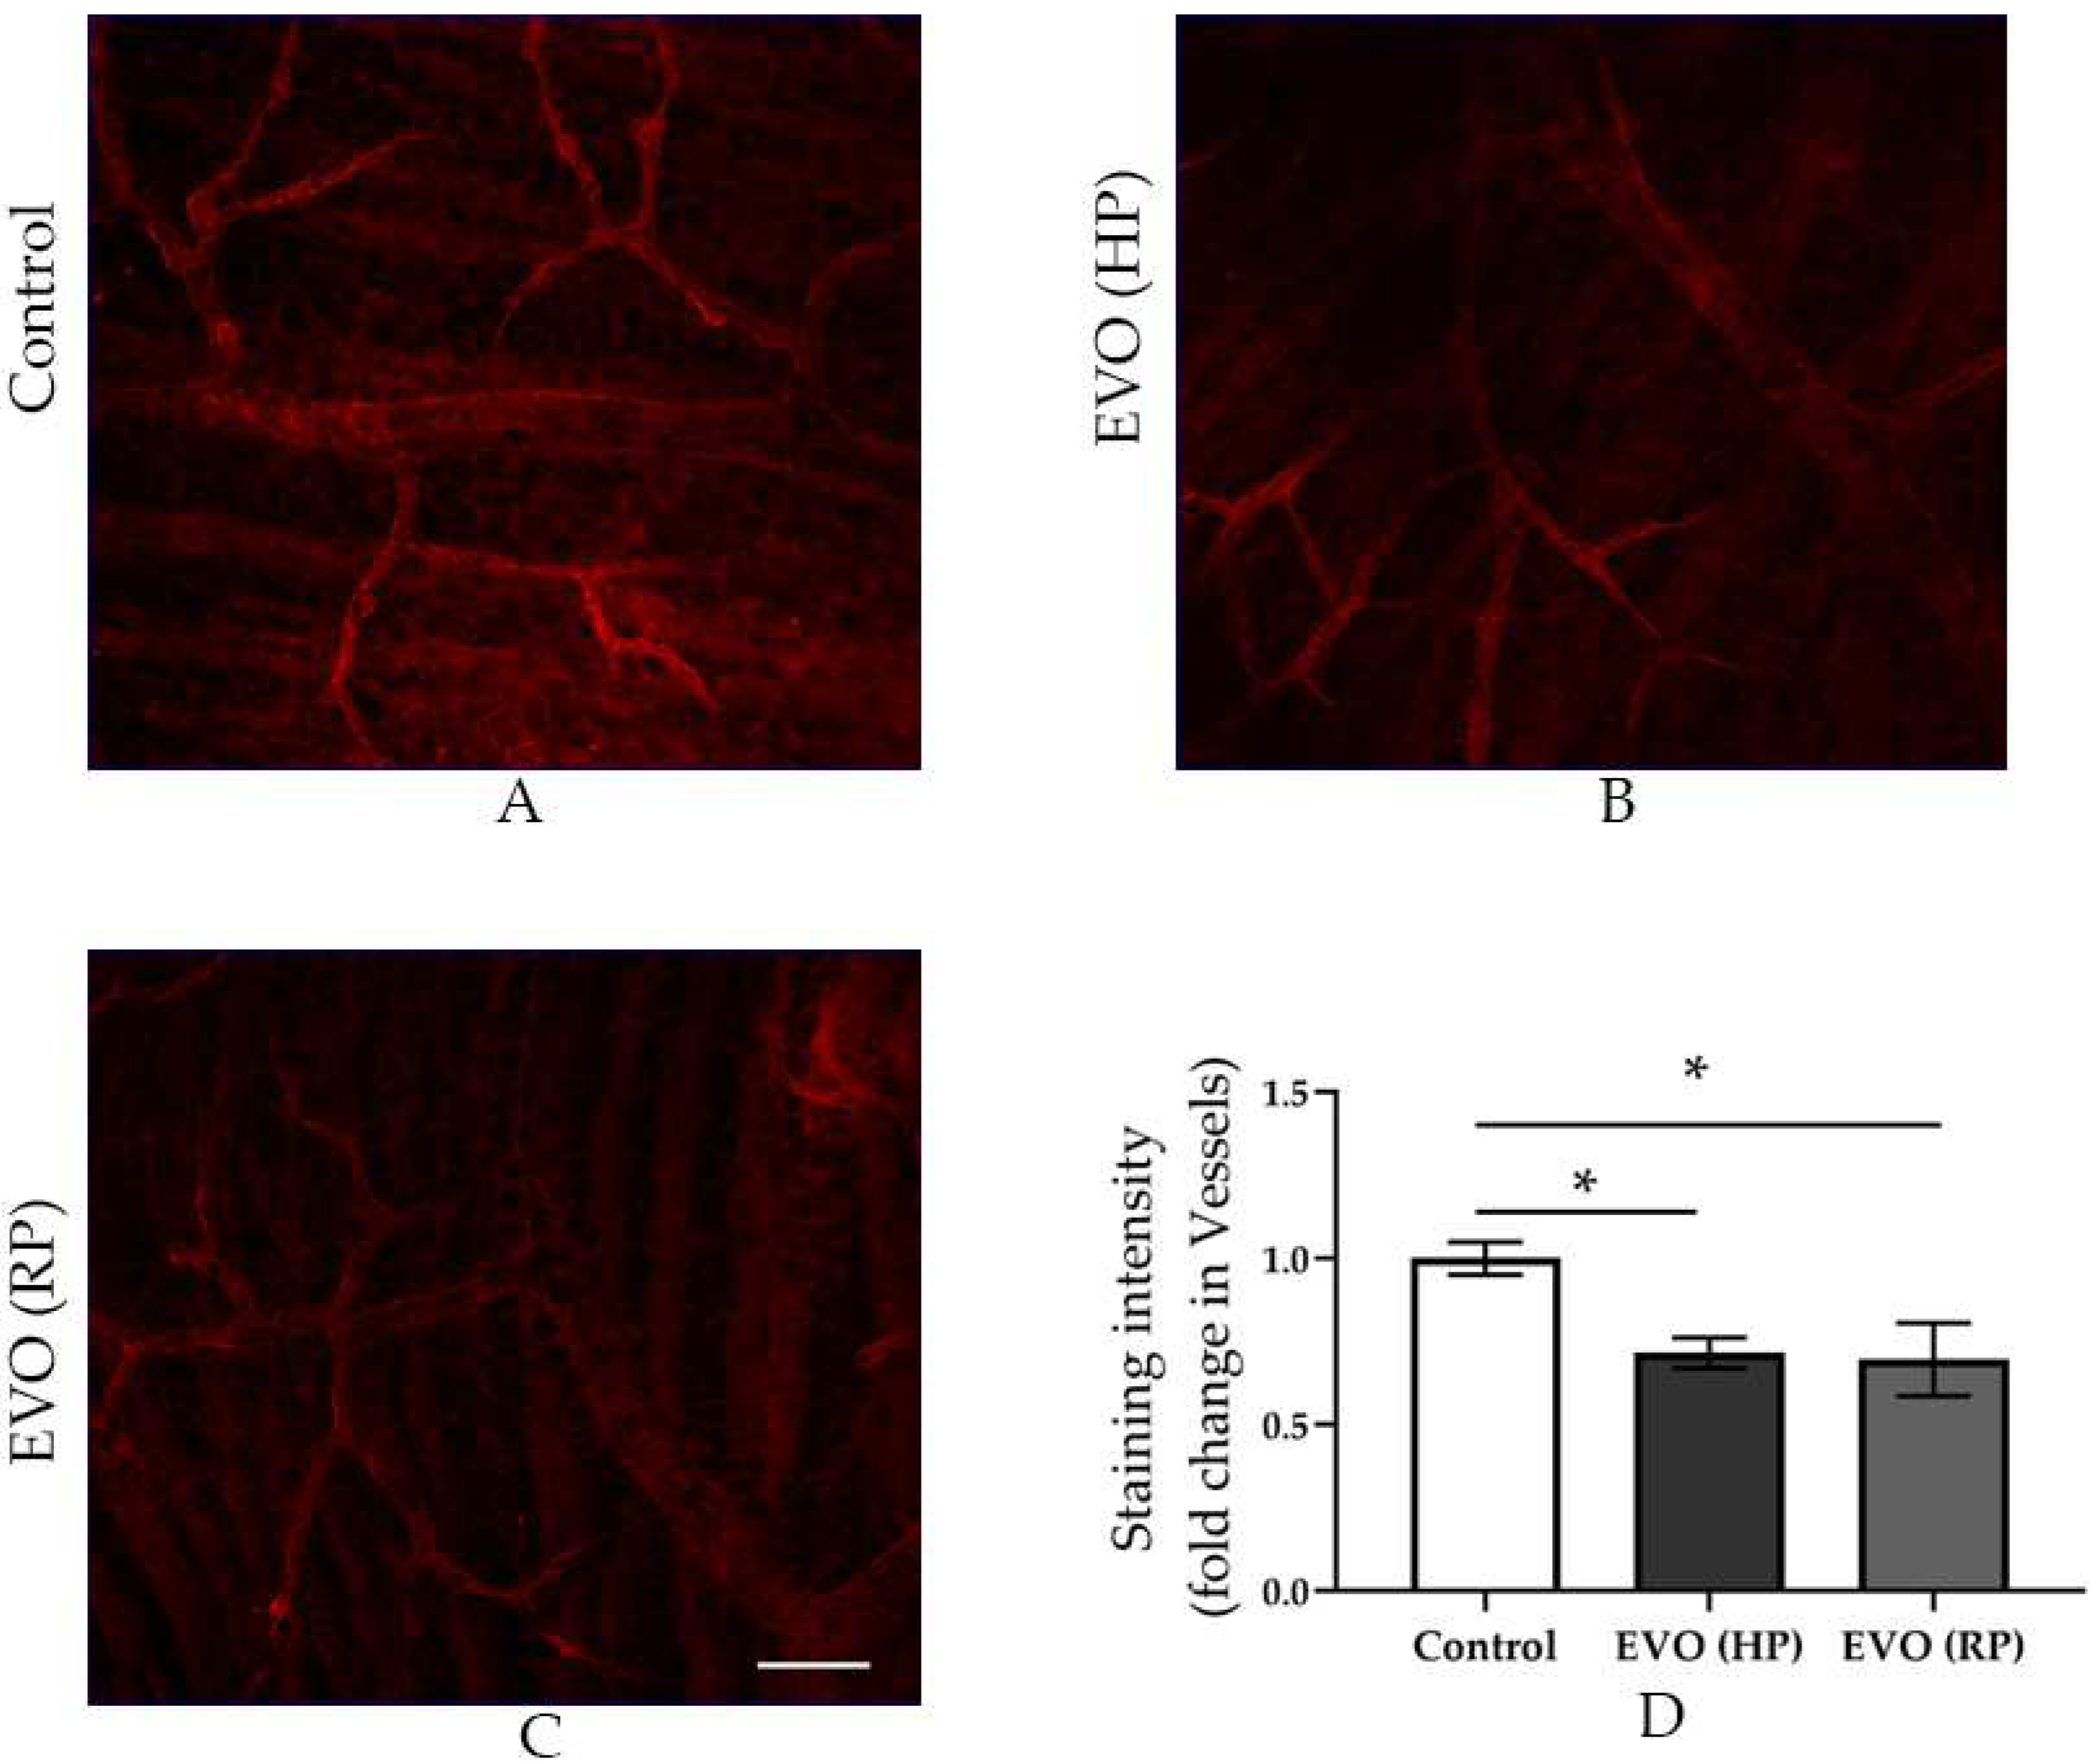
3.6. Elevated IOP Reduced the Pericytes Coverage in the Retinal Arterioles
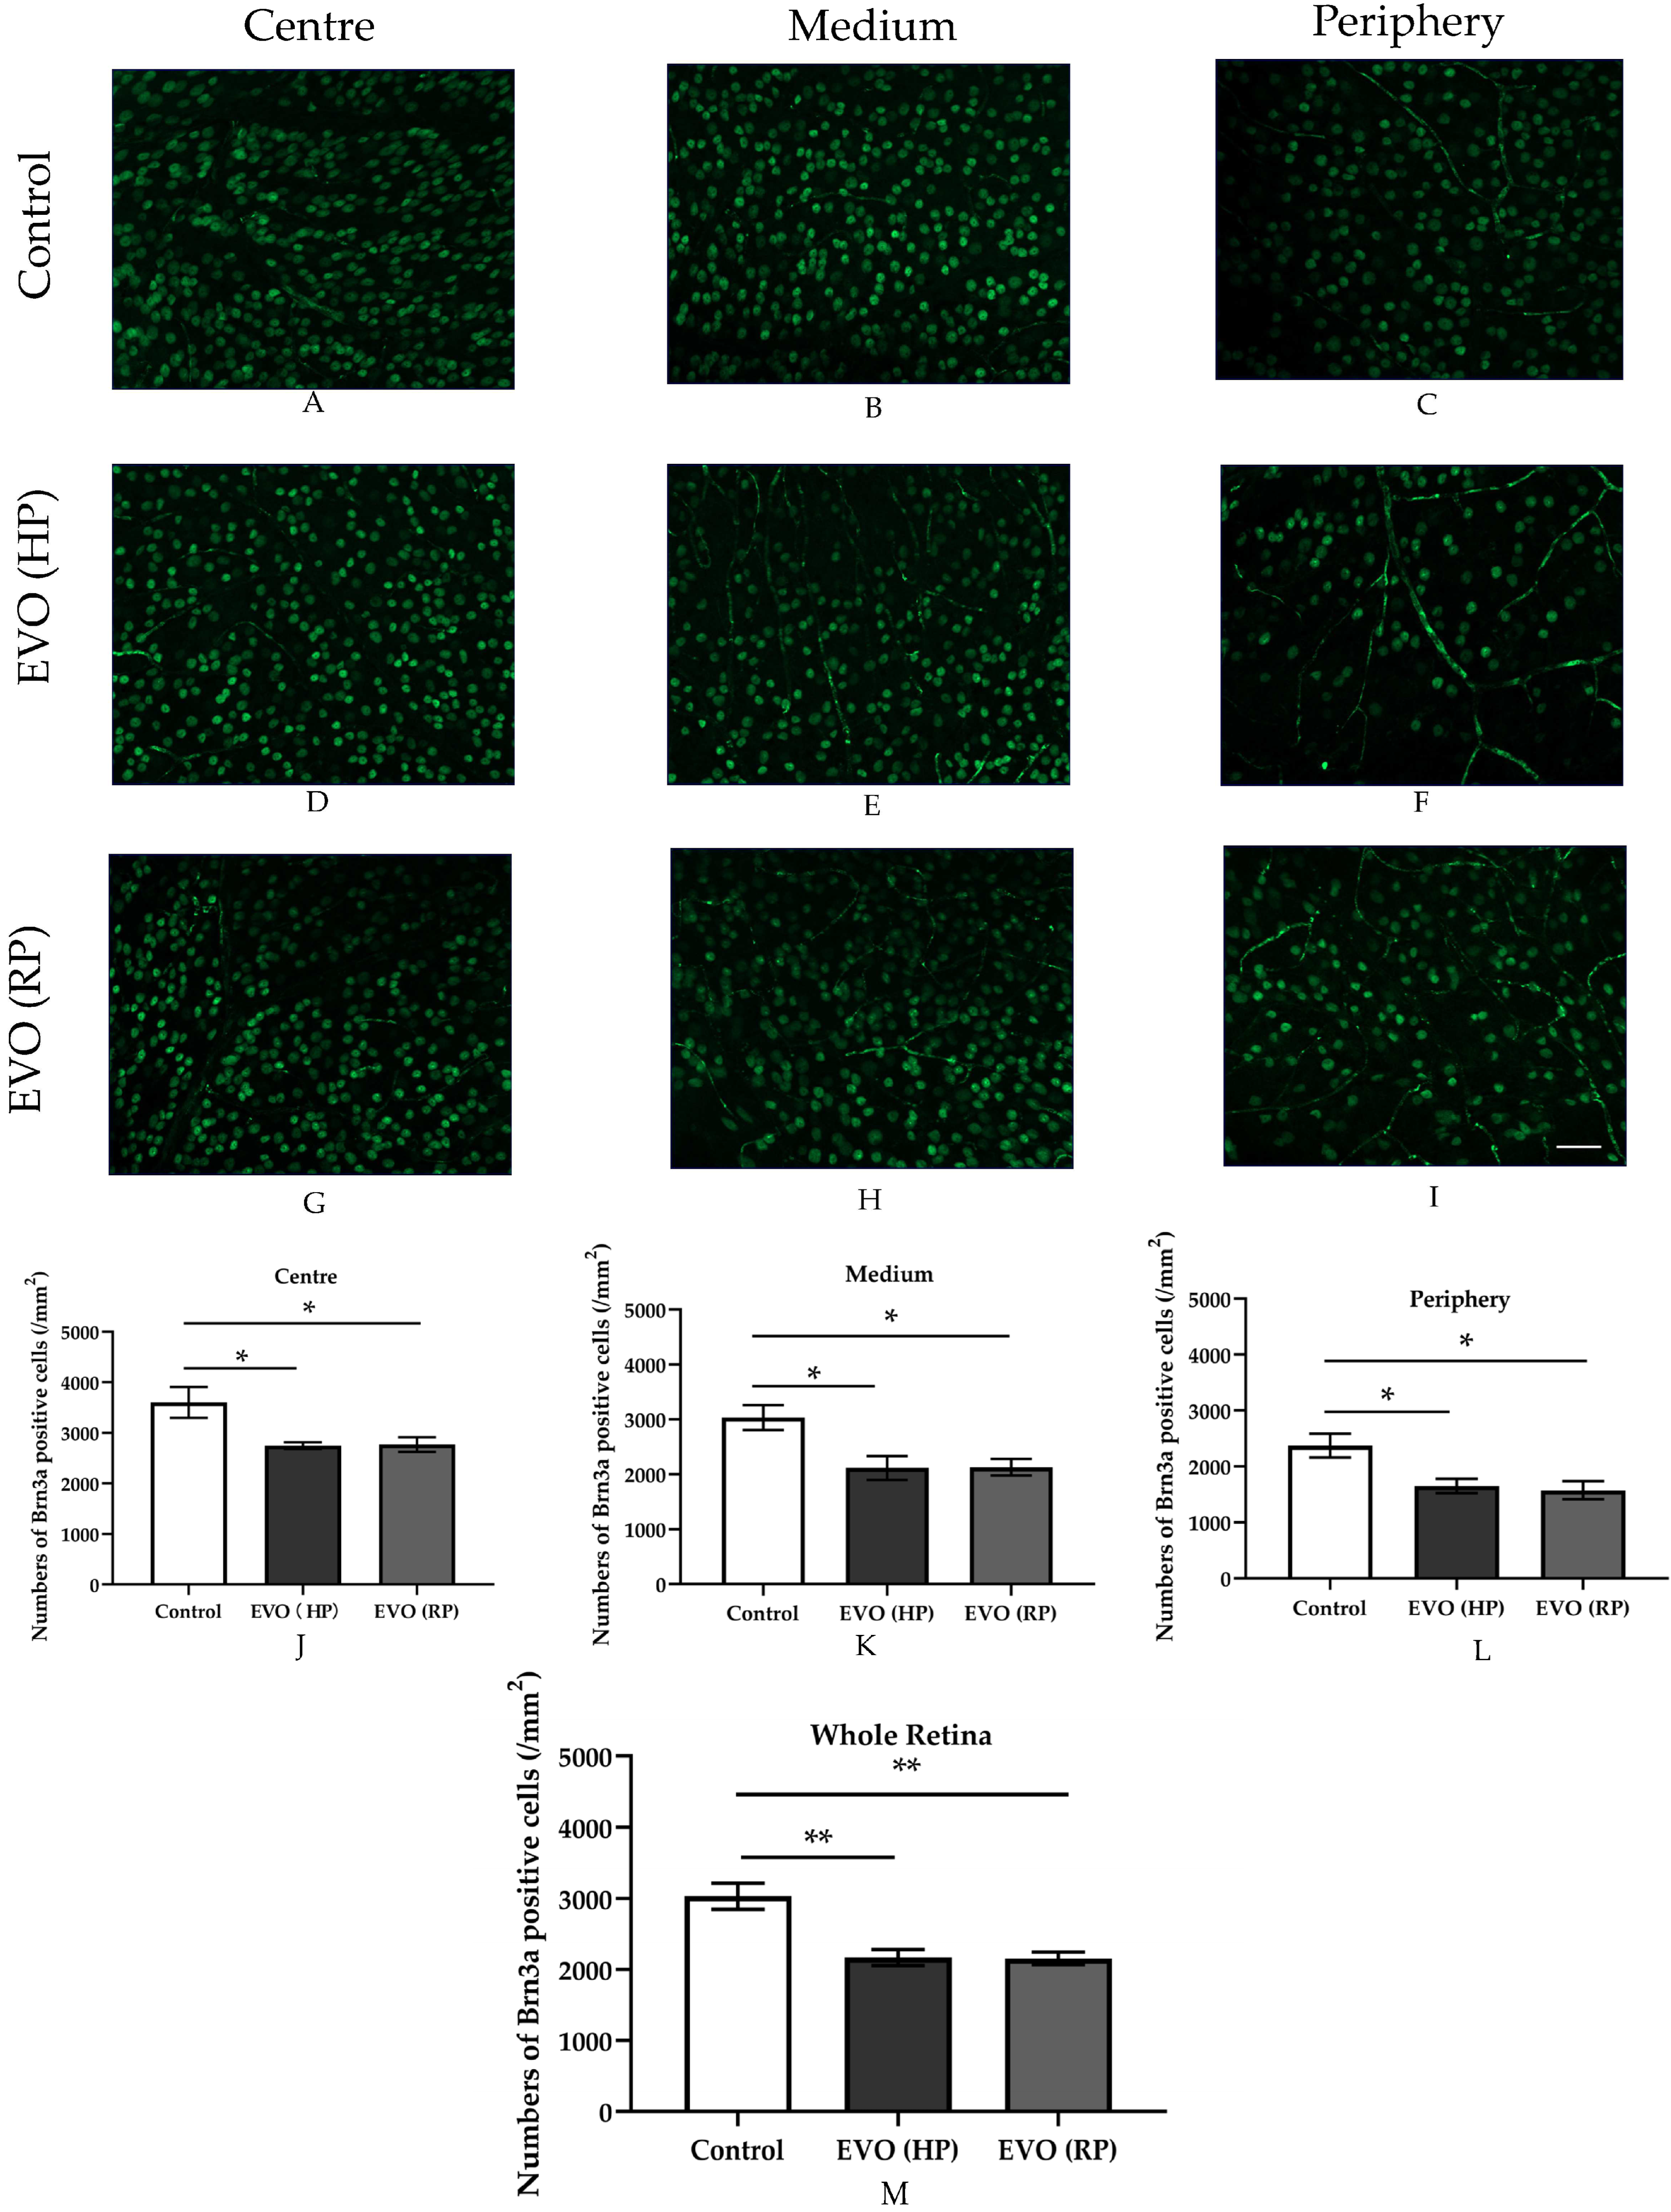
3.7. Elevated IOP Impaired RGC Survival
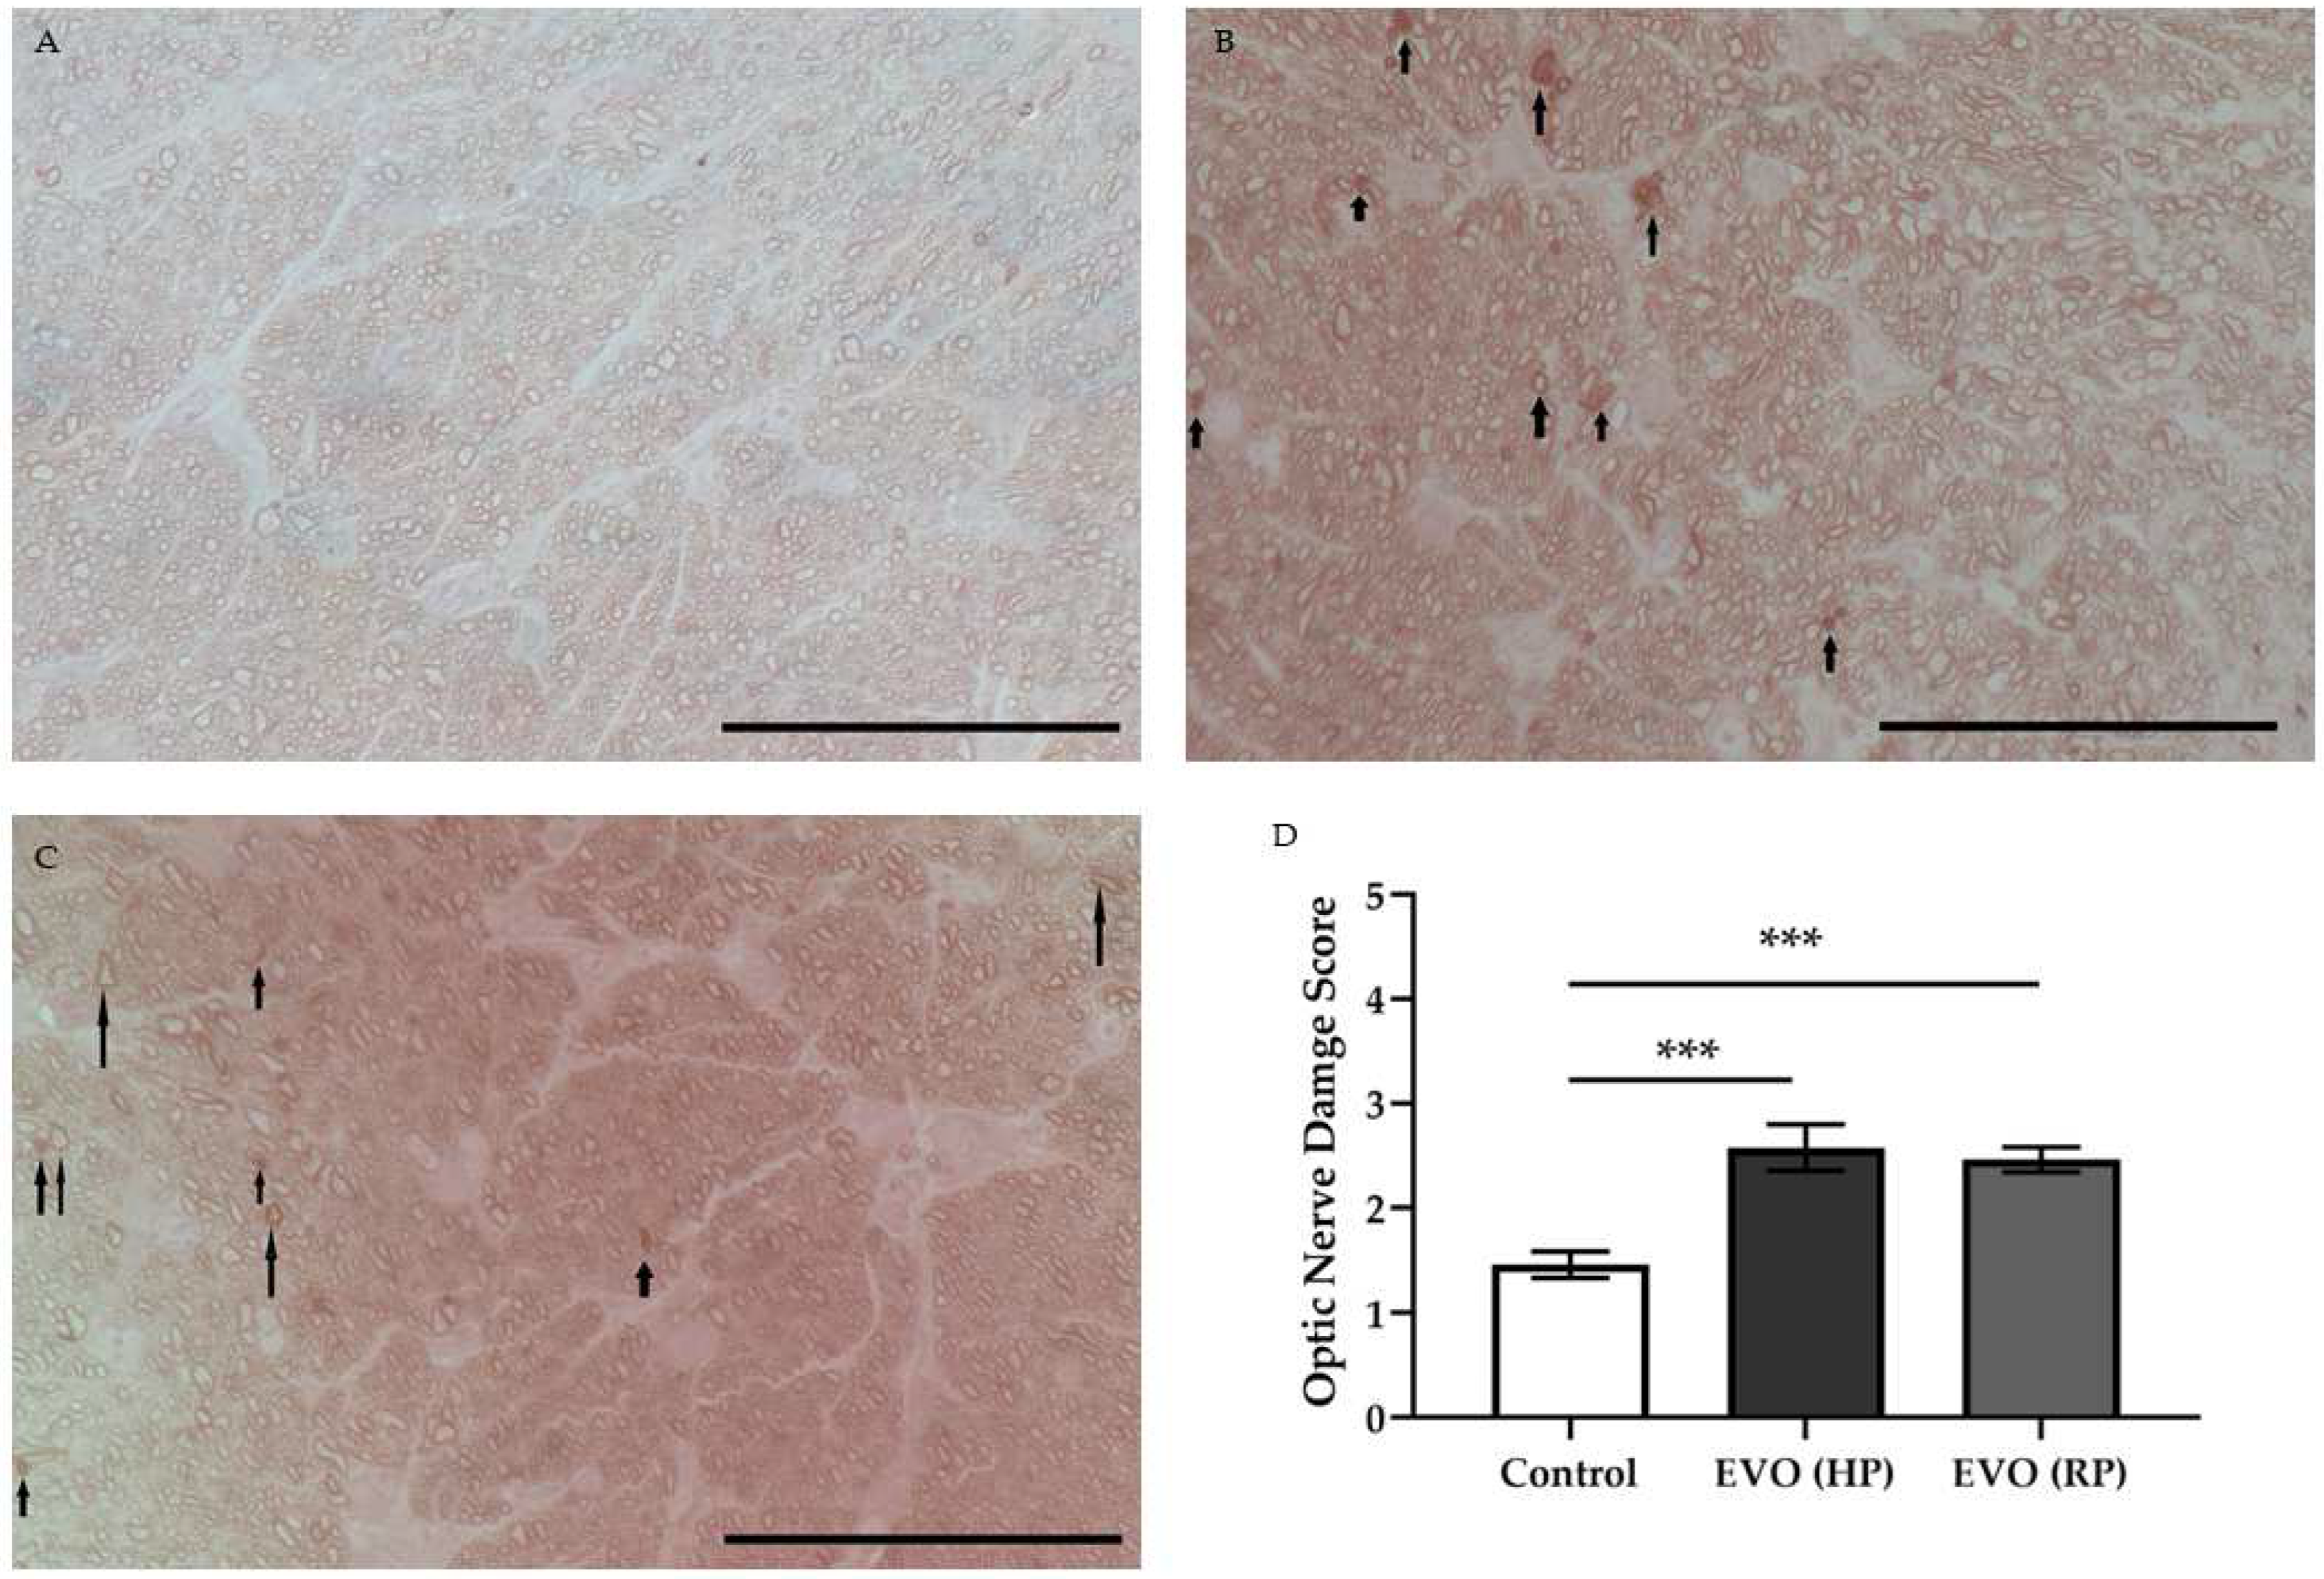
3.8. Elevated IOP Caused Optic Nerve Damage
4. Discussion
5. Conclusions
Author Contributions
Funding
Institutional Review Board Statement
Informed Consent Statement
Data Availability Statement
Acknowledgments
Conflicts of Interest
References
- Raman, P.; Khy Ching, Y.; Sivagurunathan, P.D.; Ramli, N.; Mohd Khalid, K.H. The Association Between Visual Field Reliability Indices and Cognitive Impairment in Glaucoma Patients. J. Glaucoma 2019, 28, 685–690. [Google Scholar] [CrossRef] [PubMed]
- Yu, S.; Tanabe, T.; Yoshimura, N. A rat model of glaucoma induced by episcleral vein ligation. Exp. Eye Res. 2006, 83, 758–770. [Google Scholar] [CrossRef] [PubMed]
- McMonnies, C. Reactive oxygen species, oxidative stress, glaucoma and hyperbaric oxygen therapy. J. Optom. 2018, 11, 3–9. [Google Scholar] [CrossRef] [PubMed]
- Cioffi, G.A. Ischemic model of optic nerve injury. Trans. Am. Ophthalmol. Soc. 2005, 103, 592–613. [Google Scholar] [CrossRef]
- Ahmad, S.S. Controversies in the vascular theory of glaucomatous optic nerve degeneration. Taiwan J. Ophthalmol. 2016, 6, 182–186. [Google Scholar] [CrossRef]
- Levene, R.Z. Low tension glaucoma: A critical review and new material. Surv. Ophthalmol. 1980, 24, 621–664. [Google Scholar] [CrossRef]
- Flammer, J.; Orgul, S.; Costa, V.P.; Orzalesi, N.; Krieglstein, G.K.; Serra, L.M.; Renard, J.P.; Stefansson, E. The impact of ocular blood flow in glaucoma. Prog. Retin. Eye Res. 2002, 21, 359–393. [Google Scholar] [CrossRef]
- Gericke, A.; Mann, C.; Zadeh, J.K.; Musayeva, A.; Wolff, I.; Wang, M.; Pfeiffer, N.; Daiber, A.; Li, H.; Xia, N.; et al. Elevated Intraocular Pressure Causes Abnormal Reactivity of Mouse Retinal Arterioles. Oxid. Med. Cell. Longev. 2019, 2019, 9736047. [Google Scholar] [CrossRef]
- Chen, H.; Zhao, Y.; Liu, M.; Feng, L.; Puyang, Z.; Yi, J.; Liang, P.; Zhang, H.F.; Cang, J.; Troy, J.B.; et al. Progressive degeneration of retinal and superior collicular functions in mice with sustained ocular hypertension. Investig. Ophthalmol. Vis. Sci. 2015, 56, 1971–1984. [Google Scholar] [CrossRef]
- Thomson, B.R.; Grannonico, M.; Liu, F.; Liu, M.; Mendapara, P.; Xu, Y.; Liu, X.; Quaggin, S.E. Angiopoietin-1 Knockout Mice as a Genetic Model of Open-Angle Glaucoma. Transl. Vis. Sci. Technol. 2020, 9, 16. [Google Scholar] [CrossRef] [Green Version]
- Ruiz-Ederra, J.; Verkman, A.S. Mouse model of sustained elevation in intraocular pressure produced by episcleral vein occlusion. Exp. Eye Res. 2006, 82, 879–884. [Google Scholar] [CrossRef] [PubMed]
- Gericke, A.; Sniatecki, J.J.; Goloborodko, E.; Steege, A.; Zavaritskaya, O.; Vetter, J.M.; Grus, F.H.; Patzak, A.; Wess, J.; Pfeiffer, N. Identification of the muscarinic acetylcholine receptor subtype mediating cholinergic vasodilation in murine retinal arterioles. Investig. Ophthalmol. Vis. Sci. 2011, 52, 7479–7484. [Google Scholar] [CrossRef] [PubMed]
- Gericke, A.; Goloborodko, E.; Pfeiffer, N.; Manicam, C. Preparation Steps for Measurement of Reactivity in Mouse Retinal Arterioles Ex Vivo. J. Vis. Exp. 2018, e56199. [Google Scholar] [CrossRef] [PubMed]
- Zadeh, J.K.; Zhutdieva, M.B.; Laspas, P.; Yuksel, C.; Musayeva, A.; Pfeiffer, N.; Brochhausen, C.; Oelze, M.; Daiber, A.; Xia, N.; et al. Apolipoprotein E Deficiency Causes Endothelial Dysfunction in the Mouse Retina. Oxid. Med. Cell. Longev. 2019, 2019, 5181429. [Google Scholar] [CrossRef] [PubMed]
- Musayeva, A.; Jiang, S.; Ruan, Y.; Zadeh, J.K.; Chronopoulos, P.; Pfeiffer, N.; Muller, W.E.G.; Ackermann, M.; Xia, N.; Li, H.; et al. Aged Mice Devoid of the M3 Muscarinic Acetylcholine Receptor Develop Mild Dry Eye Disease. Int. J. Mol. Sci. 2021, 22, 6133. [Google Scholar] [CrossRef]
- Nadal-Nicolas, F.M.; Jimenez-Lopez, M.; Sobrado-Calvo, P.; Nieto-Lopez, L.; Canovas-Martinez, I.; Salinas-Navarro, M.; Vidal-Sanz, M.; Agudo, M. Brn3a as a marker of retinal ganglion cells: Qualitative and quantitative time course studies in naive and optic nerve-injured retinas. Investig. Ophthalmol. Vis. Sci. 2009, 50, 3860–3868. [Google Scholar] [CrossRef]
- Brockhaus, K.; Melkonyan, H.; Prokosch-Willing, V.; Liu, H.; Thanos, S. Alterations in Tight- and Adherens-Junction Proteins Related to Glaucoma Mimicked in the Organotypically Cultivated Mouse Retina Under Elevated Pressure. Investig. Ophthalmol. Vis. Sci. 2020, 61, 46. [Google Scholar] [CrossRef]
- Prokosch, V.; Brockhaus, K.; Anders, F.; Liu, H.; Mercieca, K.; Gericke, A.; Melkonyan, H.; Thanos, S. Elevated intraocular pressure induces neuron-specific beta-III-tubulin expression in non-neuronal vascular cells. Acta Ophthalmol. 2019, 98, e617–e630. [Google Scholar] [CrossRef]
- Wang, M.; Milic, M.; Gericke, A.; Mercieca, K.; Liu, H.; Ruan, Y.; Jiang, S.; van Beers, T.; von Pein, H.D.; Muller, M.B.; et al. Chronic social defeat stress causes retinal vascular dysfunction. Exp. Eye Res. 2021, 213, 108853. [Google Scholar] [CrossRef]
- Tonner, H.; Hunn, S.; Auler, N.; Schmelter, C.; Beutgen, V.M.; von Pein, H.D.; Pfeiffer, N.; Grus, F.H. A Monoclonal Anti-HMGB1 Antibody Attenuates Neurodegeneration in an Experimental Animal Model of Glaucoma. Int. J. Mol. Sci. 2022, 23, 4107. [Google Scholar] [CrossRef]
- McDowell, C.M.; Luan, T.; Zhang, Z.; Putliwala, T.; Wordinger, R.J.; Millar, J.C.; John, S.W.; Pang, I.H.; Clark, A.F. Mutant human myocilin induces strain specific differences in ocular hypertension and optic nerve damage in mice. Exp. Eye Res. 2012, 100, 65–72. [Google Scholar] [CrossRef] [PubMed]
- Pang, I.H.; Clark, A.F. Rodent models for glaucoma retinopathy and optic neuropathy. J. Glaucoma 2007, 16, 483–505. [Google Scholar] [CrossRef] [PubMed]
- Shareef, S.R.; Garcia-Valenzuela, E.; Salierno, A.; Walsh, J.; Sharma, S.C. Chronic ocular hypertension following episcleral venous occlusion in rats. Exp. Eye Res. 1995, 61, 379–382. [Google Scholar] [CrossRef]
- Teister, J.; Anders, F.; Beck, S.; Funke, S.; von Pein, H.; Prokosch, V.; Pfeiffer, N.; Grus, F. Decelerated neurodegeneration after intravitreal injection of alpha-synuclein antibodies in a glaucoma animal model. Sci. Rep. 2017, 7, 6260. [Google Scholar] [CrossRef] [PubMed]
- Cioffi, G.A.; Wang, L. Optic nerve blood flow in glaucoma. Semin. Ophthalmol. 1999, 14, 164–170. [Google Scholar] [CrossRef] [PubMed]
- He, Z.; Vingrys, A.J.; Armitage, J.A.; Bui, B.V. The role of blood pressure in glaucoma. Clin. Exp. Optom. 2011, 94, 133–149. [Google Scholar] [CrossRef] [PubMed]
- Jia, Y.; Morrison, J.C.; Tokayer, J.; Tan, O.; Lombardi, L.; Baumann, B.; Lu, C.D.; Choi, W.; Fujimoto, J.G.; Huang, D. Quantitative OCT angiography of optic nerve head blood flow. Biomed. Opt. Express 2012, 3, 3127–3137. [Google Scholar] [CrossRef]
- Tao, X.; Sigireddi, R.R.; Westenskow, P.D.; Channa, R.; Frankfort, B.J. Single transient intraocular pressure elevations cause prolonged retinal ganglion cell dysfunction and retinal capillary abnormalities in mice. Exp. Eye Res. 2020, 201, 108296. [Google Scholar] [CrossRef]
- Wang, X.; Jiang, C.; Kong, X.; Yu, X.; Sun, X. Peripapillary retinal vessel density in eyes with acute primary angle closure: An optical coherence tomography angiography study. Graefes Arch. Clin. Exp. Ophthalmol. 2017, 255, 1013–1018. [Google Scholar] [CrossRef]
- Zhang, S.; Wu, C.; Liu, L.; Jia, Y.; Zhang, Y.; Zhang, Y.; Zhang, H.; Zhong, Y.; Huang, D. Optical Coherence Tomography Angiography of the Peripapillary Retina in Primary Angle-Closure Glaucoma. Am. J. Ophthalmol. 2017, 182, 194–200. [Google Scholar] [CrossRef]
- Zhao, D.; He, Z.; Wang, L.; Fortune, B.; Lim, J.K.H.; Wong, V.H.Y.; Nguyen, C.T.O.; Bui, B.V. Response of the Trilaminar Retinal Vessel Network to Intraocular Pressure Elevation in Rat Eyes. Investig. Ophthalmol. Vis. Sci. 2020, 61, 2. [Google Scholar] [CrossRef]
- Arend, O.; Remky, A.; Plange, N.; Martin, B.J.; Harris, A. Capillary density and retinal diameter measurements and their impact on altered retinal circulation in glaucoma: A digital fluorescein angiographic study. Br. J. Ophthalmol. 2002, 86, 429–433. [Google Scholar] [CrossRef] [PubMed]
- Mann, C.; Anders, F.; Liu, H.; Brockhaus, K.; Liu, A.; Grus, F.H.; Pfeiffer, N.; Thanos, S.; Prokosch, V. Morphological and Quantitative Changes in Retinal and Optic Nerve Vessels in Experimental Glaucoma Model with Elevated IOP for 7 Weeks. Klin. Monbl. Augenheilkd. 2019, 236, 871–876. [Google Scholar] [PubMed]
- Tan, B.; MacLellan, B.; Mason, E.; Bizheva, K.K. The Effect of Acutely Elevated Intraocular Pressure on the Functional and Blood Flow Responses of the Rat Retina to Flicker Stimulation. Investig. Ophthalmol. Vis. Sci. 2017, 58, 5532–5540. [Google Scholar] [CrossRef] [PubMed]
- Lee, S.J.; Duncan, D.S.; Echevarria, F.D.; McLaughlin, W.M.; Hatcher, J.B.; Sappington, R.M. Pressure-Induced Alterations in PEDF and PEDF-R Expression: Implications for Neuroprotective Signaling in Glaucoma. J. Clin. Exp. Ophthalmol. 2015, 6, 491. [Google Scholar] [CrossRef] [PubMed]
- Stapor, P.C.; Murfee, W.L. Identification of class III beta-tubulin as a marker of angiogenic perivascular cells. Microvasc. Res. 2012, 83, 257–262. [Google Scholar] [CrossRef] [PubMed]
- Moreno, M.C.; Campanelli, J.; Sande, P.; Sanez, D.A.; Keller Sarmiento, M.I.; Rosenstein, R.E. Retinal oxidative stress induced by high intraocular pressure. Free Radic. Biol. Med. 2004, 37, 803–812. [Google Scholar] [CrossRef]
- Ko, M.L.; Peng, P.H.; Ma, M.C.; Ritch, R.; Chen, C.F. Dynamic changes in reactive oxygen species and antioxidant levels in retinas in experimental glaucoma. Free Radic. Biol. Med. 2005, 39, 365–373. [Google Scholar] [CrossRef]
- Tezel, G.; Yang, X.; Cai, J. Proteomic identification of oxidatively modified retinal proteins in a chronic pressure-induced rat model of glaucoma. Investig. Ophthalmol. Vis. Sci. 2005, 46, 3177–3187. [Google Scholar] [CrossRef]
- Frenis, K.; Helmstadter, J.; Ruan, Y.; Schramm, E.; Kalinovic, S.; Kroller-Schon, S.; Bayo Jimenez, M.T.; Hahad, O.; Oelze, M.; Jiang, S.; et al. Ablation of lysozyme M-positive cells prevents aircraft noise-induced vascular damage without improving cerebral side effects. Basic Res. Cardiol. 2021, 116, 31. [Google Scholar] [CrossRef]
- Atlante, A.; Calissano, P.; Bobba, A.; Giannattasio, S.; Marra, E.; Passarella, S. Glutamate neurotoxicity, oxidative stress and mitochondria. FEBS Lett. 2001, 497, 1–5. [Google Scholar] [CrossRef]
- Nucci, C.; Tartaglione, R.; Rombola, L.; Morrone, L.A.; Fazzi, E.; Bagetta, G. Neurochemical evidence to implicate elevated glutamate in the mechanisms of high intraocular pressure (IOP)-induced retinal ganglion cell death in rat. Neurotoxicology 2005, 26, 935–941. [Google Scholar] [CrossRef] [PubMed]
- Tezel, G.; Yang, X.; Luo, C.; Peng, Y.; Sun, S.L.; Sun, D. Mechanisms of immune system activation in glaucoma: Oxidative stress-stimulated antigen presentation by the retina and optic nerve head glia. Investig. Ophthalmol. Vis. Sci. 2007, 48, 705–714. [Google Scholar] [CrossRef]
- Forstermann, U.; Xia, N.; Li, H. Roles of Vascular Oxidative Stress and Nitric Oxide in the Pathogenesis of Atherosclerosis. Circ. Res. 2017, 120, 713–735. [Google Scholar] [CrossRef] [PubMed]
- Mollazadeh, H.; Carbone, F.; Montecucco, F.; Pirro, M.; Sahebkar, A. Oxidative burden in familial hypercholesterolemia. J. Cell. Physiol. 2018, 233, 5716–5725. [Google Scholar] [CrossRef] [PubMed]
- Garcia-Quintans, N.; Sanchez-Ramos, C.; Prieto, I.; Tierrez, A.; Arza, E.; Alfranca, A.; Redondo, J.M.; Monsalve, M. Oxidative stress induces loss of pericyte coverage and vascular instability in PGC-1alpha-deficient mice. Angiogenesis 2016, 19, 217–228. [Google Scholar] [CrossRef]
- Olmos, Y.; Valle, I.; Borniquel, S.; Tierrez, A.; Soria, E.; Lamas, S.; Monsalve, M. Mutual dependence of Foxo3a and PGC-1alpha in the induction of oxidative stress genes. J. Biol. Chem. 2009, 284, 14476–14484. [Google Scholar] [CrossRef]
- Russell, R.W. Evidence for autoregulation in human retinal circulation. Lancet 1973, 2, 1048–1050. [Google Scholar] [CrossRef]


Publisher’s Note: MDPI stays neutral with regard to jurisdictional claims in published maps and institutional affiliations. |
© 2022 by the authors. Licensee MDPI, Basel, Switzerland. This article is an open access article distributed under the terms and conditions of the Creative Commons Attribution (CC BY) license (https://creativecommons.org/licenses/by/4.0/).
Share and Cite
Wang, M.; Liu, H.; Xia, N.; Li, H.; van Beers, T.; Gericke, A.; Prokosch, V. Intraocular Pressure-Induced Endothelial Dysfunction of Retinal Blood Vessels Is Persistent, but Does Not Trigger Retinal Ganglion Cell Loss. Antioxidants 2022, 11, 1864. https://doi.org/10.3390/antiox11101864
Wang M, Liu H, Xia N, Li H, van Beers T, Gericke A, Prokosch V. Intraocular Pressure-Induced Endothelial Dysfunction of Retinal Blood Vessels Is Persistent, but Does Not Trigger Retinal Ganglion Cell Loss. Antioxidants. 2022; 11(10):1864. https://doi.org/10.3390/antiox11101864
Chicago/Turabian StyleWang, Maoren, Hanhan Liu, Ning Xia, Huige Li, Tim van Beers, Adrian Gericke, and Verena Prokosch. 2022. "Intraocular Pressure-Induced Endothelial Dysfunction of Retinal Blood Vessels Is Persistent, but Does Not Trigger Retinal Ganglion Cell Loss" Antioxidants 11, no. 10: 1864. https://doi.org/10.3390/antiox11101864