

Searches for Lepton Flavor Violation in Tau Decays at Belle II


Department of Physics and Astronomy, University of Louisville, Louisville, KY 40292, USA
Universe 2022, 8(9), 480; https://doi.org/10.3390/universe8090480
Submission received: 11 April 2022
/
Revised: 17 August 2022
/
Accepted: 18 August 2022
/
Published: 13 September 2022
(This article belongs to the Special Issue Charged Lepton Flavor Violation)
Abstract
:Searches for lepton flavor violation in tau decays are unambiguous signatures of new physics. The branching ratios of tau leptons at the level of – can be probed using 50 of electron-positron annihilation data being collected by the Belle II experiment at the world’s highest luminosity accelerator, the SuperKEKB, located at the High Energy Accelerator Research Organization, KEK, in Tsukuba, Japan. Searches with such expected sensitivity will either discover new physics or strongly constrain several new physics models.
1. Introduction
Lepton flavor conservation stands out in the Standard Model (SM) among all other symmetries because it is not associated with any underlying conserved current. Lepton flavor violation (LFV) in the charged sector is predicted by many new physics (NP) models. The small but finite mass of the neutrinos in the SM allow charged LFV in neutrino-less two-body decays, e.g., decays (charge conjugate modes are implied throughout the text, unless otherwise specified), where (i = 1, 2) denotes light charged leptons (, ). However, such decays are suppressed by a factor of [1], which produces experimentally unreachable rates of the order of . For neutrino-less three-body decays, e.g., decays (where , and i may or may not be equal to j), two conflicting predictions existed in the literature: one of the order of [2] and another of the order of [3]. Recently, the contributions due to finite neutrino masses for such decays were re-scrutinized and found to be in the range of [4,5], thereby laying to rest the claim that such decays could be of the order of in the SM. Thus, any observation of charged LFV is an unambiguous signature of NP.
A discovery of LFV in the charged sector may provide deeper insight into several unsolved mysteries such as the origin of the dark sector, large baryon number asymmetry, number of flavor generations and extra dimensions. Many NP models, such as low-scale seesaw models [6], supersymmetric standard models [7,8,9,10,11,12,13], little Higgs models [14,15], leptoquark models [16], non-universal models [17], and extended Higgs models [18,19,20,21,22], predict LFV in decays at the level of – which are just below the current experimental bounds. Predictions for two-body and three-body neutrino-less decays from some of these NP models [6,7,8,9,10,11,13,17] are tabulated in Table 1.
Since is the only lepton that can decay hadronically, many neutrino-less final states are allowed via LFV processes in NP models within the observable parameter space [23]. Example of such processes include final states containing a light lepton and a meson e.g., (where ), or a light lepton and two mesons: , (where ).
Searches for all possible LFV processes in decays of are necessary because there are strong correlations between the expected rates of the different channels in various models. For example, in some supersymmetric seesaw models [24,25], the relative rates of : : are predicted to have specific ratios, depending on the model parameters. In the unconstrained minimal supersymmetric model, which includes various correlations between the and LFV rates, the LFV branching fractions of the lepton in some decay channels can be as high as [26,27]), while still respecting the strong experimental bounds on the LFV decays of the lepton [28,29]. Thus, it is critical to probe all possible LFV modes of the lepton, because any excess in a single channel will not provide sufficient information to nail down the underlying LFV mechanism or even to identify an underlying theory.
More exotic decay modes, such as and , accompanied by a violation of the lepton number (LNV), are predicted at the level of – in several scenarios beyond the SM [30]. Several of these decay modes are expected to have branching ratios close to existing experimental limits in NP models, e.g., heavy Dirac neutrinos [31,32], supersymmetric processes [25,33], flavor-changing exchanges with non-universal couplings [34], etc., to name a few. Wrong-sign decays are very intriguing because they are expected at rates only one order of magnitude below the present bounds in some NP models, e.g., the Littlest Higgs model with T-parity realizing an inverse seesaw [35].
Most models for baryogenesis, a hypothetical physical process based on different descriptions of the interaction between the fundamental particles that took place during the early universe producing the observed matter–antimatter asymmetry, require baryon number violation (BNV), which in charged lepton decays automatically implies LNV and LFV [36]. Angular momentum conservation requires the difference of net baryon number (B) and lepton number (L) to be equal to either 0 or 2. Although the SM conserves this difference, the symmetry group for the sum of baryon number and lepton number can be associated with an anomalous current. A set of models predicts baryogenesis that conserves B-L but includes instanton induced B+L violating currents [37]. In a large class of models [38], BNV in decay modes containing baryons in the final state, for example, , are predicted at observable rates in the large data set that the Belle II detector will record over the coming years.
2. Belle II Experiment at SuperKEKB
The most restrictive limits on LFV in decays at the level of have been obtained by the first generation of the B-Factory experiments, Belle and BABAR, where a big data sample of ’ s was generated thanks to large and similar values of the production cross-sections of mesons and pairs around the resonance at the level of a nanobarn () [39]. Belle and BABAR experiments collected approximately one attobarn-inverse () and half an of annihilation data, respectively. The next generation of the B-Factory experiment, Belle II, is expected to collect 50 of data over the next decade [40]. Such a huge data sample corresponding to single -decays would lower the limits on LFV in decays by one or two orders of magnitude.
2.1. Luminosity Upgrade of SuperKEKB
The asymmetric beam energy collider, SuperKEKB, is an upgrade of the KEKB accelerator facility in Tsukuba, Japan, and has a circumference of about 3 km. The main components of the SuperKEKB collider complex are a 7 GeV electron ring known as the high-energy ring (HER), a 4 GeV positron ring known as the low-energy ring (LER), and an injector linear accelerator with a 1.1 GeV positron damping ring [41]. The HER and the LER have four straight sections named Tsukuba, Oho, Fuji, and Nikko, with the interaction point in the straight section of Tsukuba, where the Belle II detector is located.
The target integrated luminosity of 50 to be collected by the Belle II experiment will be achieved by increasing the instantaneous luminosity by a factor of 30. Two major upgrades account for this increase: a modest two-fold increase in the beam currents, and a fifteen-fold reduction of the vertical beta function at the interaction point from 5.9 mm to 0.4 mm, according to the “nano-beam” scheme described below.
Compared to KEKB, the asymmetry between the beam energies for the HER/LER beams were reduced from 8.0/3.5 GeV to 7.0/4.0 GeV, which reduces the beam loss due to Touschek scattering. This also improves the solid-angle acceptance of the experiment, which helps to analyze events with large missing energy. Additionally, the effects of synchrotron radiation as a result of higher currents are mitigated. Since synchrotron radiation is proportional to the product of beam current and the fourth power of beam energy, the HER at SuperKEKB emits as much synchrotron radiation per unit of beam current compared to KEKB [42]. This facilitates the SuperKEKB collider to operate at a beam current twice the value of the KEKB.
The very high luminosity environment of SuperKEKB required significant upgrades of the injection beams with high current and low emittance. The upgraded accelerator complex houses a new electron-injection gun and a new target for positron production. A new damping ring was installed for injection of the positron beam with low-emittance, as well as for improving simultaneous top-up injections needed for the high luminosity upgrade. The upgrade also features completely redesigned lattices for the LER and HER, replacement of short dipoles with longer ones in the LER, a new Titanium Nitride coated beam pipe with antechambers to suppress the electron-cloud effect, a modified RF system, and a completely redesigned interaction region [43].
The design of the beam parameters at SuperKEKB [44] follows the “nano-beam” and the “crab-waist” schemes, which were originally proposed for the SuperB-Factory in Italy [45]. Accordingly, the transverse sizes of the beam bunches in the horizontal plane () are squeezed to have very small values and made to collide at a larger horizontal crossing angle () = at Belle II, instead of =22 mrad at Belle. Thus, the effective size of the overlap region () is much shorter than what it would have been in the case of a normal head-on collision, which is given by the longitudinal size of the beam bunches in the horizontal plane () [46].
The vertical beta function at the interaction point (IP) is constrained due to the hour-glass effect as: , where is the large Piwinski angle. With of the order of 6 mm, the is thus squeezed down to about , which is much shorter than the real bunch length. In addition to increasing the luminosity, a reduction of the interaction region of the colliding beams restricts the vertex position along the beam axis, thus providing an additional benefit of more precise estimation of the primary vertex, which helps in the reconstruction of the complete event topology during physics analysis.
The instantaneous luminosity in an collider is
where is the number of electrons per bunch, is the number of positrons per bunch, f is the collision frequency of the bunch, and are the transverse beam-profile sizes at the IP, and is the luminosity-reduction factor (of the order of unity) due to the finite beam-crossing angle. In terms of beam currents , the luminosity becomes
where e is the charge of the electron. Each beam affects the stability of the other, which can be characterized by the beam–beam tune shift parameters given by
where is the classical radius of the electron, is the relativistic gamma factor of beams, and is the geometric reduction factor (also of the order of unity) due to the hour-glass effect. Putting all these factors altogether, we arrive at the following expression for instantaneous luminosity:
where the design parameters for beam–beam tune shifts are = for HER and = for LER [44]. The horizontal/vertical beam sizes at the IP are reduced from = 170 m/940 nm for HER and =147 m/940 nm for LER at Belle to =10.7 m/62 nm for HER and =10.1 m/48 nm for LER at Belle II, respectively [41]. The beam currents for Belle were 1.19 A and 1.64 A for HER and LER, respectively, compared to the design values of 2.6 A and 3.6 A for HER and LER, respectively, at Belle II [41]. This allows one to improve upon the value of instantaneous luminosity from at Belle to at Belle II [40].
2.2. Detector Upgrade of Belle II
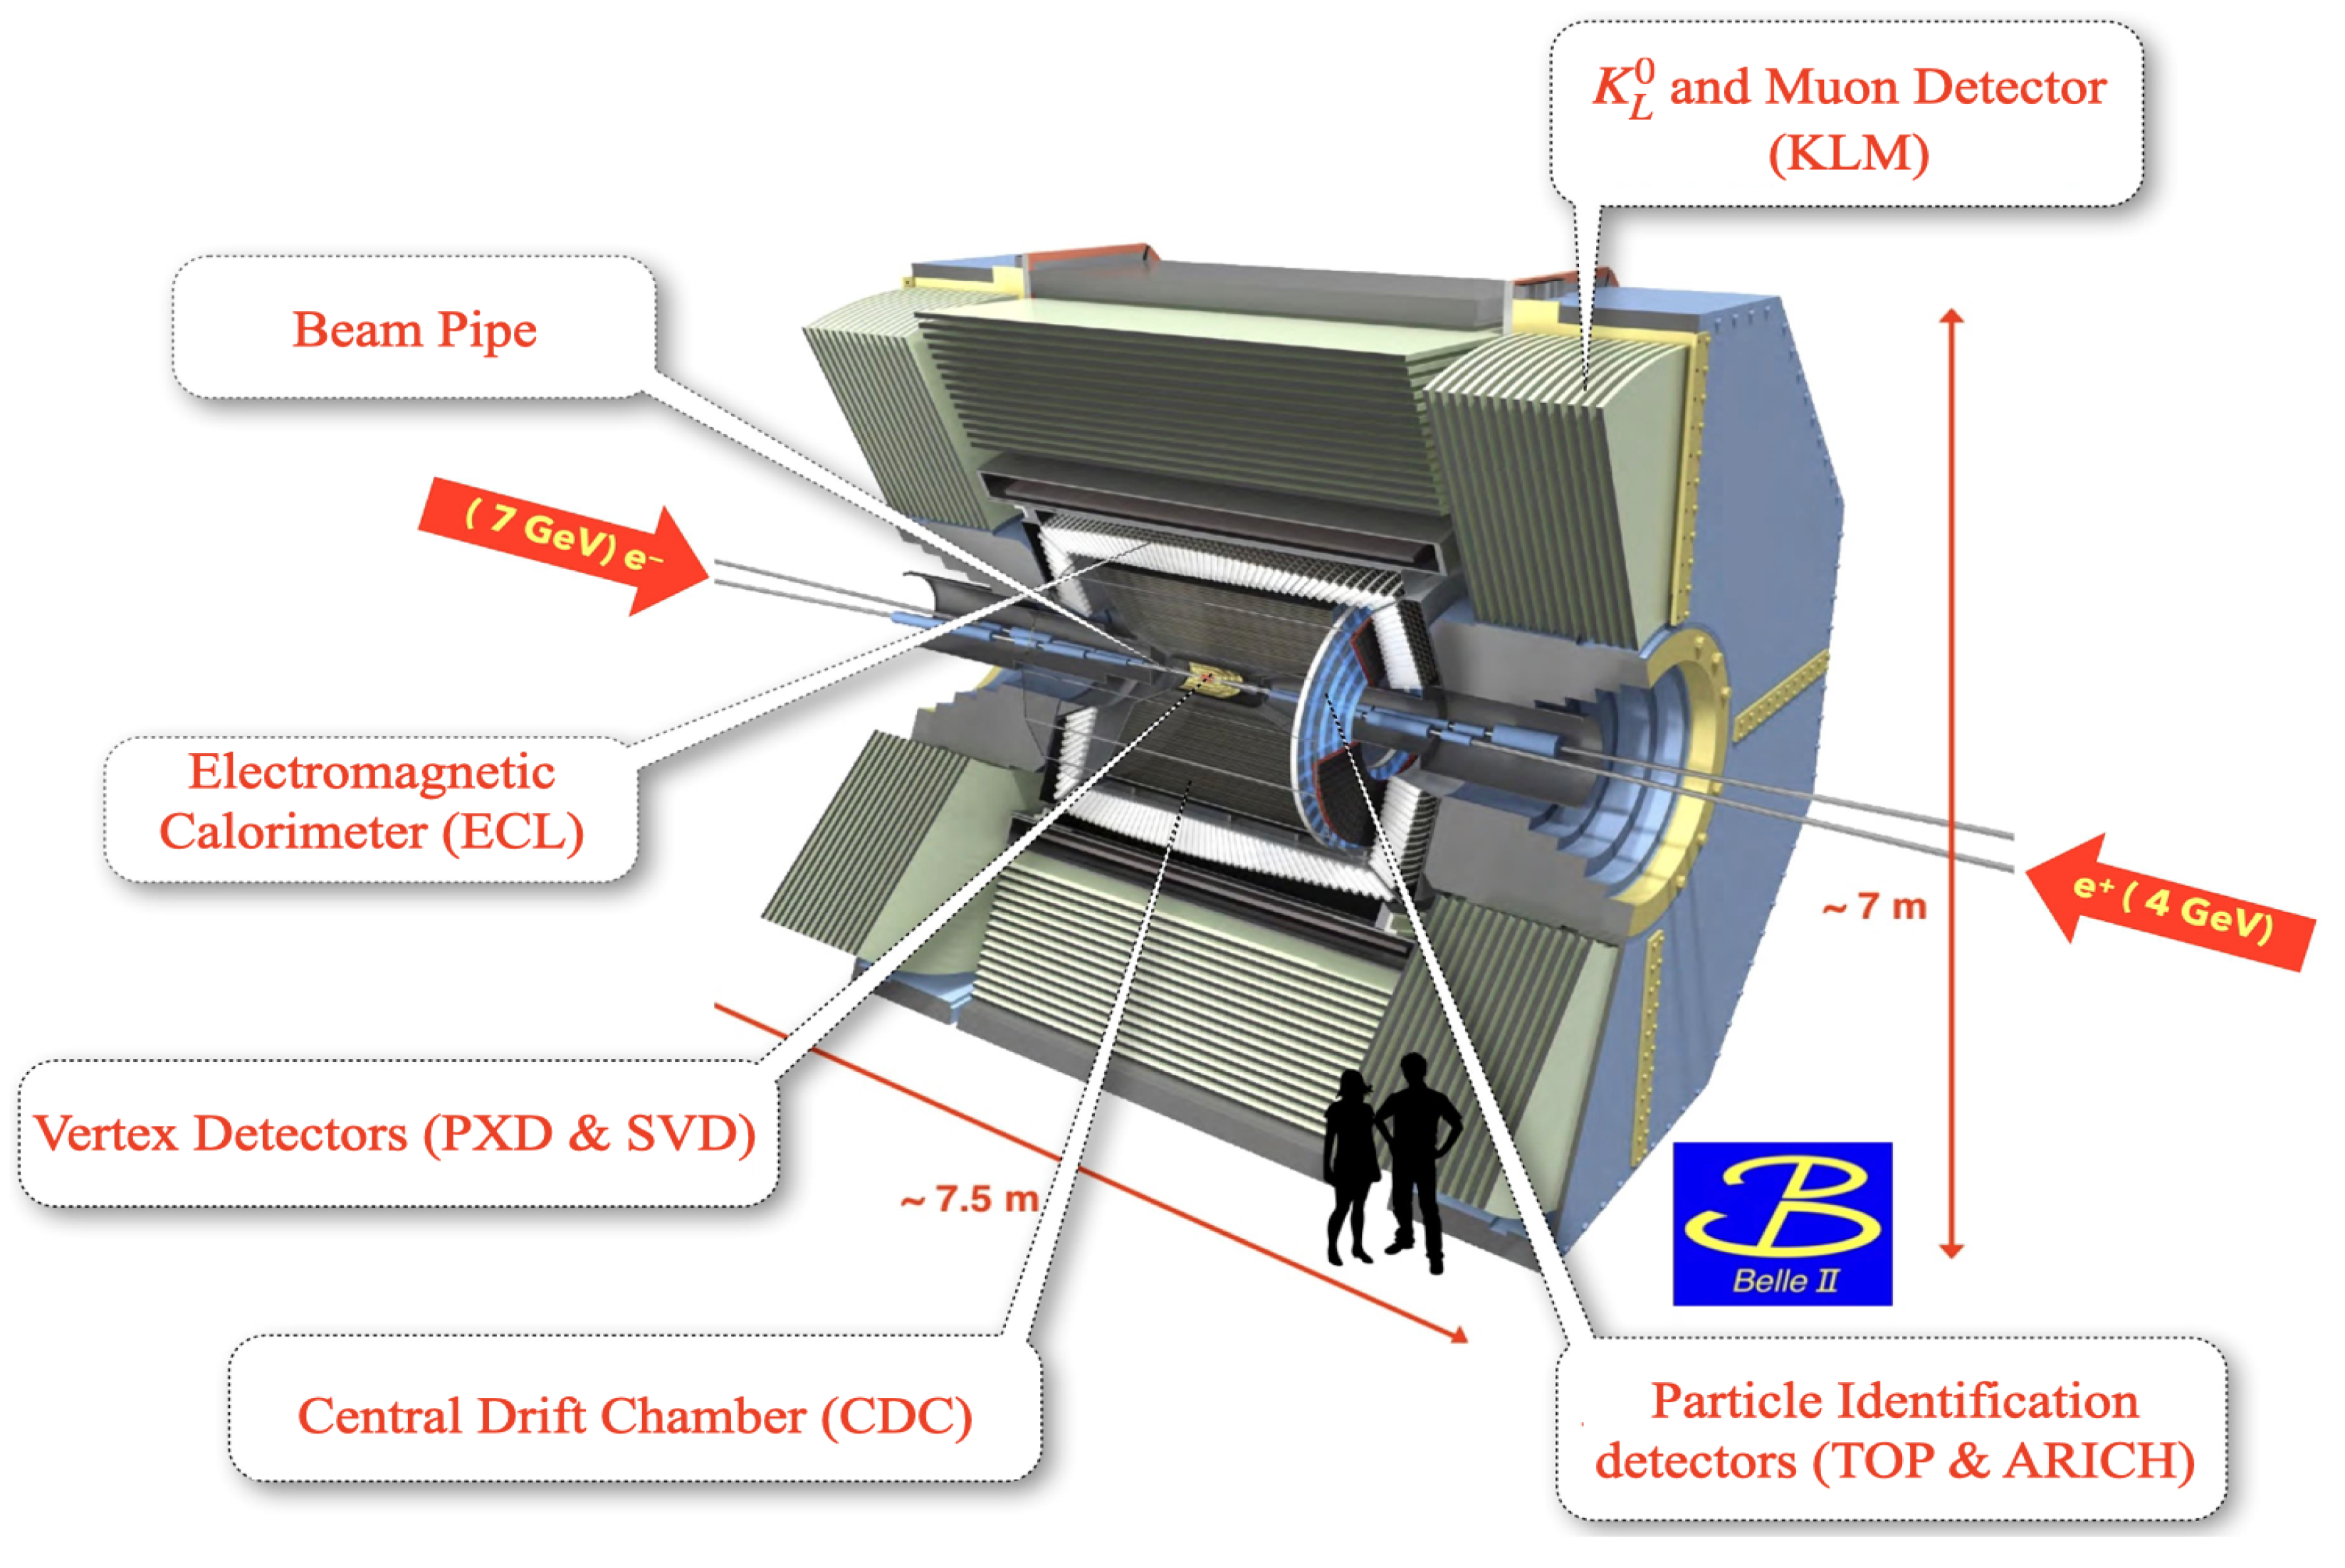
From the IP outward, the main components of the Belle II detector are vertexing and tracking detectors, particle identification systems, calorimeter and muon chambers, as shown in Figure 1 [47]. The tracking detectors consist of an inner Silicon PiXel Detector (PXD), a Silicon Vertex Detector (SVD) and a Central Drift Chamber (CDC). Two dedicated particle identification systems are the Time-Of-Propagation (TOP) detector in the barrel region and the Aerogel Ring-Imaging CHerenkov detector (ARICH) in the forward endcap. These are surrounded by an Electromagnetic CaLorimeter (ECL) and a superconducting solenoid providing a homogeneous magnetic field of 1.5 T. A and Muon detector (KLM) is the largest and outermost part of the Belle II detector.
- Vertexing:In Belle, the beam pipe was at 15 mm [50], the innermost layer of a 4-layer silicon vertex detector [51] was at 20 mm and the outermost layer of the vertex detector was at a radius of 88 mm. In Belle II, the beam pipe is at 10 mm, the inner two layers of the PXD, consisting of silicon pixels, are closer to the IP at 14 mm and 22 mm, respectively, and the outermost layer of the four layers of the SVD, consisting of silicon strips, goes to a larger radius of 140 mm. The PXD is based on the Depleted Field Effect Transistor (DEPFET) technology, which allows for thin sensors with 50 m thickness. The readout of the new silicon strip detector is based on the APV25 chip, which has a much shorter shaping time to accommodate for higher background rates in Belle II than the VAITA chip-based readout used at Belle. As a result of these upgrades, considerably better performance is expected in Belle II than Belle. For example, the vertex resolution at Belle II is improved by the excellent spatial resolution of the two innermost pixel detector layers.
- Tracking:The large volume CDC at Belle II, with 56 layers organized in 9 super-layers, has smaller drift cells than in Belle. CDC starts just outside the expanded silicon strip detector, and extends to a larger radius of 1130 mm in Belle II as compared to 880 mm in Belle. The measured spatial resolution of the CDC is about 100 m, while the relative precision of the measurement for particles with an incident angle of is around . The angular resolution achieved between tracks is ∼4.5 mrad. The efficiency to reconstruct decays in Belle II is also improved because the silicon strip detector occupies a larger volume.
- Particle Identification:Belle II has two completely new, more compact particle identification devices of the Cherenkov imaging type: TOP in the barrel and ARICH in the endcap regions. Both detectors are equipped with very fast read-out electronics, leading to very good kaon versus pion separation in the kinematic limits of the experiment. The two Cherenkov detectors are designed to differentiate between K and particles over the entire momentum range, and also differentiates among , , and e below 1 GeV/c.
- Calorimetry:The ECL is made of CsI(Tl) scintillation crystals of size 6 cm × 6 cm each with high light output, a short radiation length, and good mechanical properties, covering the range of 12 155 in the polar angle, e.g., 90% of solid angle coverage in the center-of-mass system. The ECL is divided into two parts: the barrel and the endcap. While the barrel part consists of 6624 crystals, the endcap part consists of 2112 crystals. The new electronics of the ECL are of the wave-form-sampling type, which has particular relevance in missing-energy studies by reducing the noise due to pile up considerably. The ECL is able to detect neutral particles in a wide energy range, from 20 MeV up to 4 GeV, with a high resolution of = 4% at 100 MeV, and angular resolution of 13 mrad (3 mrad) at low (high) energies. This gives a mass resolution for reconstructing of about 4.5 MeV/c [52].
- and Muon Detection:The and muon detector (KLM) at Belle was based on glass-electrode resistive plate chambers (RPC). Since larger backgrounds are expected in the high luminosity environment at Belle II, the upgraded KLM system consists of RPC only in some parts of the barrel. The two innermost layers in the barrel and the entire endcap section of KLM at Belle II consist of layers of scintillator strips with wavelength shifting fibers, read out by silicon photomultiplier (SiPMs) as light sensors [53]. Although the high neutron background can cause damage to the SiPMs, the upgraded KLM has been demonstrated to operate reliably during irradiation tests by appropriately setting the discrimination thresholds.
2.3. Daq Upgrade of Belle II
The new data acquisition (DAQ) system [54] meets the requirements of considerably higher event rates at Belle II. It consists of a Level One (L1) [55] and High Level Trigger (HLT). The L1 trigger has a latency of 5 s and a maximum trigger output rate of 30 kHz, limited by the read-in rate of the DAQ. The HLT must suppress online event rates to 10 kHz for offline storage using complete reconstruction with all available information from the entire detector. To enable readout from high-speed data transmission, a peripheral component interconnect express based readout module (PCIe40) with high data throughput of up to 100 Gigabytes/s was adopted for the upgrade of the Belle II DAQ system [56]. The trigger system at Belle II achieves almost 100 % trigger efficiency for events and nearly high efficiency for other physics processes of interest, e.g., -pair events.
3. Search Strategies
3.1. Event Topology
B-Factories typically operate at center-of-mass energies around the resonance, e.g., 10.58 GeV. Tau-pair production via annihilation in this energy regime leads to cleanly separated event topology associated with the decay of each lepton, and are well simulated by state-of-the-art event generators: KK2F [57,58,59], Tauola [60,61] and Photos [62,63]. Searches for LFV in decays in B factories exploit these event characteristics, assuming that only one of the two ’s produced in the process could have decayed in this rare mode, and the other decays via the allowed SM processes. By dividing the event into a pair of hemispheres perpendicular to the thrust axis [64,65] in the center-of-mass frame, decay products can thus be identified as coming from the signal-side and the tag-side, corresponding to decay via LFV and the SM decays of the lepton, respectively.
3.2. Signal Characteristics
The characteristic feature of decays via LFV is that the final state does not contain . Thus, there is no missing momentum associated with the signal-side, and the kinematics of the signal lepton can be completely reconstructed from measurements of the final state particles. Simulation studies for more than a hundred possible decays via LFV that can be searched with such signal characteristics for each sign of the lepton, are possible with recent updates of the Tauola event generator [61,66,67], which have been seamlessly integrated into the software of the Belle II experiment.
A very interesting feature of -pair production in annihilation is that the energy of each lepton is known to be exactly half of the center-of-mass (CM) energy of the collision, except for corrections due to initial and final state radiations. Therefore, the uncertainty of the energy of the lepton is independent of the performance of the detector, and is known from the beam energy spread of SuperKEKB to be approximately 5 MeV [48].
As a first example of the signal mode, let us consider decays, which are predicted with rates just lower than the current experimental bounds in the widest variety of NP models and are hence regarded as “golden modes” in searches for LFV. The total energy in the CM frame of the decay products in the signal-side is , and the invariant mass of the pair can be calculated as , where is the magnitude of the three-momentum of the lepton, is the energy of the photon, and is the opening angle between them. The invariant mass is ideal as a discriminating variable, because its resolution is given by [68]:
which simultaneously combines all the available experimental precision on the measured energy/momentum from the calorimeter/tracking systems with the measured uncertainties on the position measurements of the observable final state decays products. The resolution of this kinematic variable is further improved by considering the beam-energy-constrained mass, , given as:
where and is the sum of the lepton and photon momenta in the CM frame, because the resolution of comes from the accelerator instead of the detector.
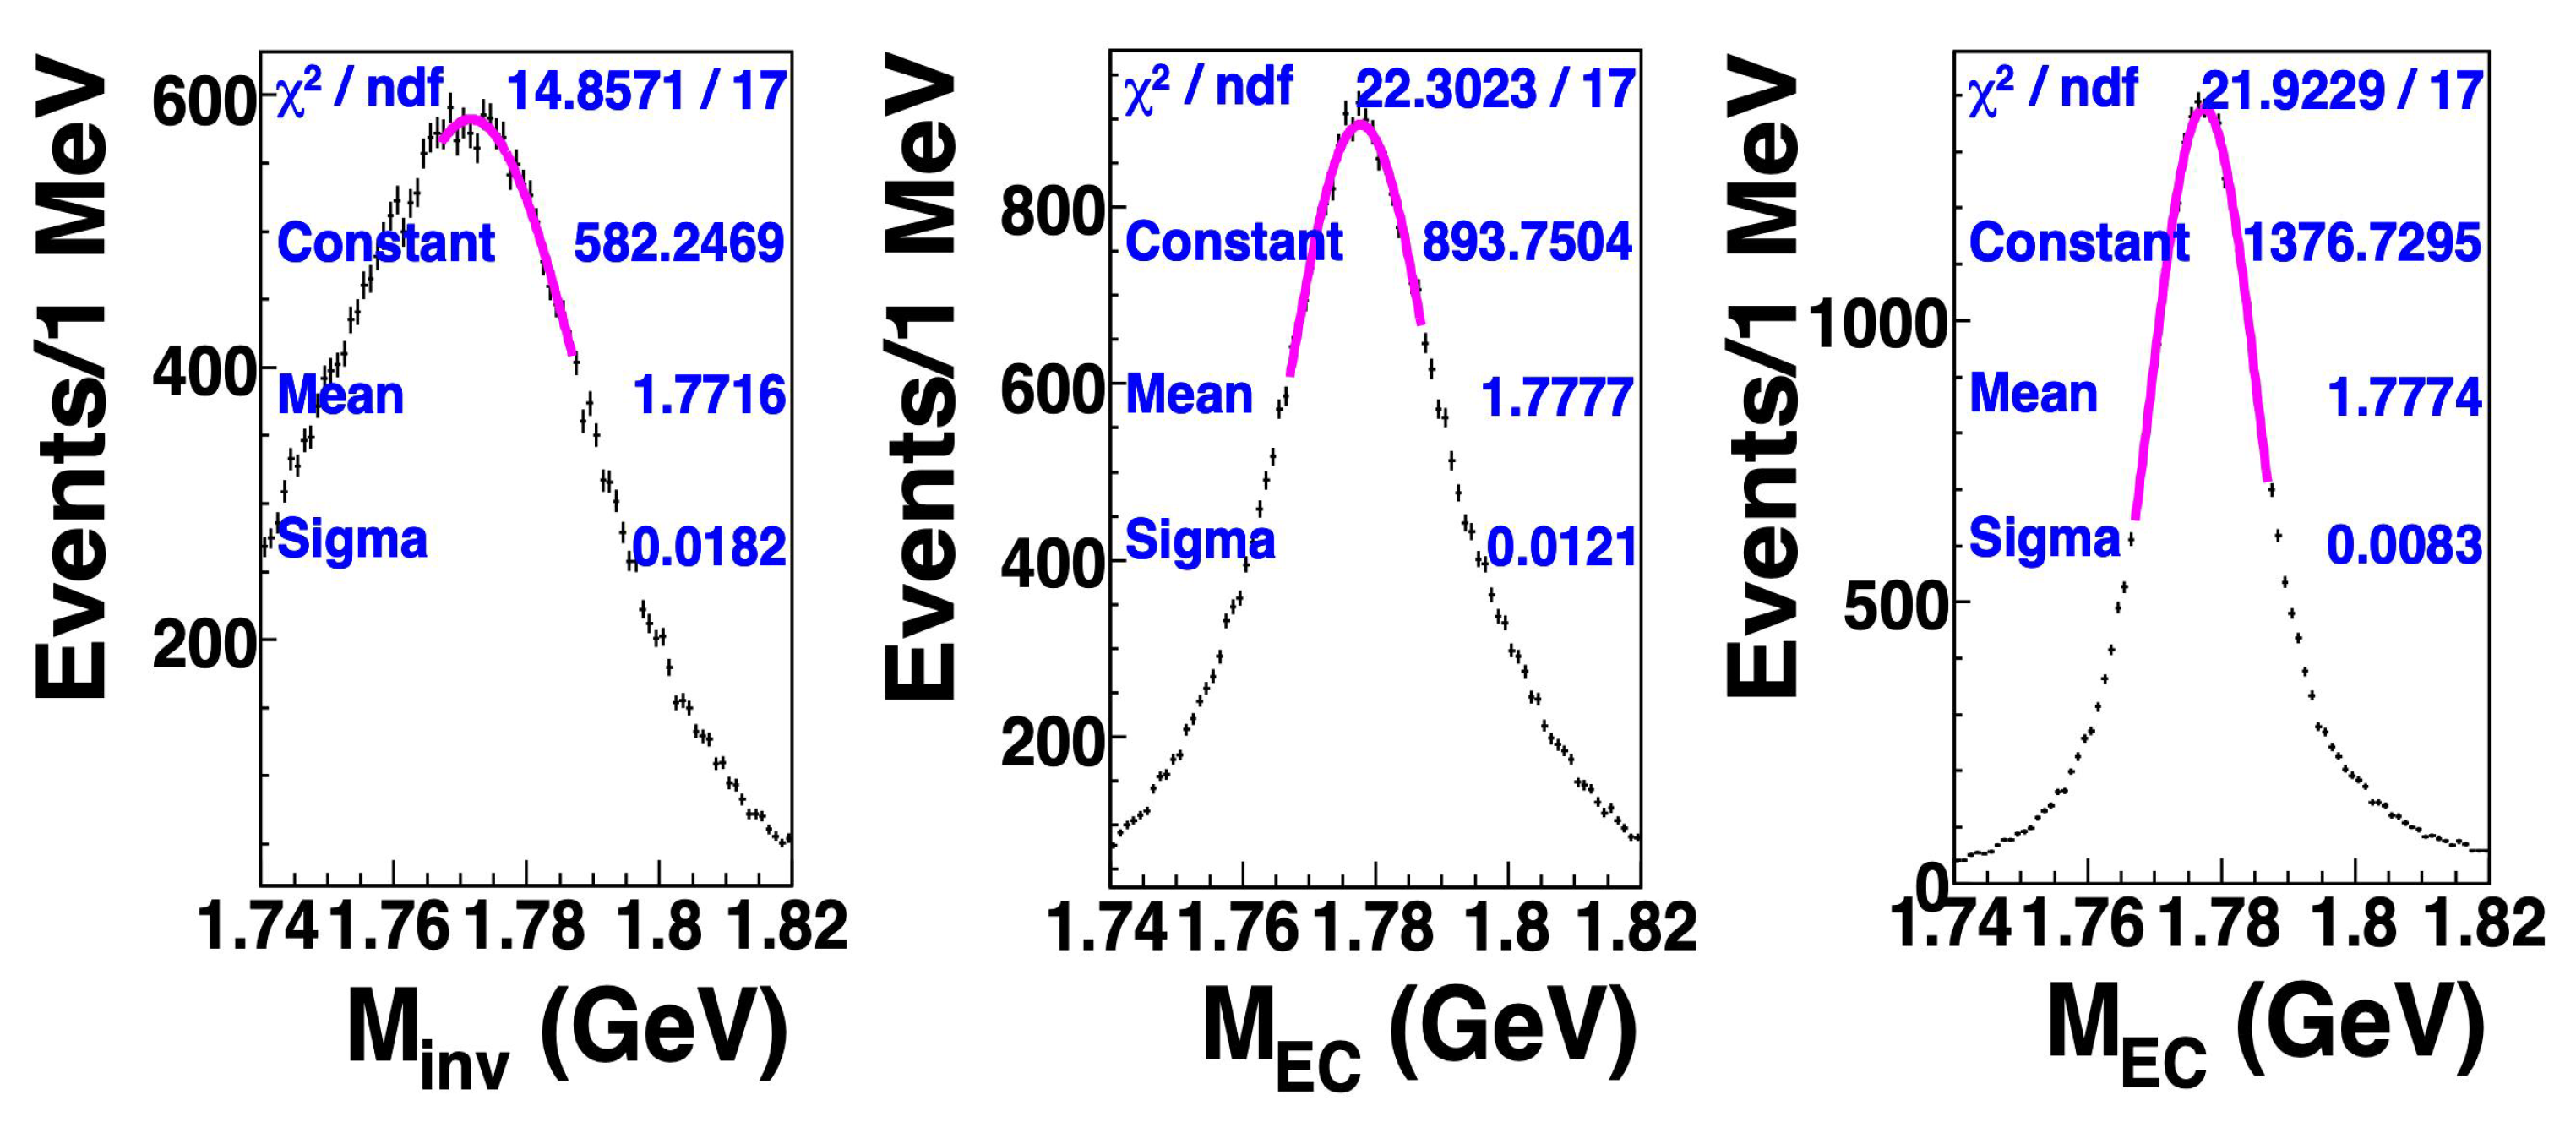
The beam-energy-constrained mass, labeled somewhat differently as for the BABAR search [69], is typically obtained from a kinematic fit that constrains the CM energy of the to be . Its resolution was further improved in the BABAR search by assigning the origin of the photon candidate to the point of the closest approach of the signal lepton track to the collision axis. Figure 2 shows a comparison study using a simulated sample of signal events, where the resolution of the invariant mass is crudely estimated to be 18.2 MeV/c from a single Gaussian fit to the peak of the distribution, while that of is 12.1 MeV/c, which improves further to 8.3 MeV/c after the vertex constraint.
The most distinguishing feature of signal events is obtained by considering the characteristic mass of the decay products of the LFV decays along with the normalized difference in their energy from half the center-of-mass energy in annihilation, so that the search can be uniformly performed at energies other than the peak, to take advantage of the larger luminosity including all the recorded data:
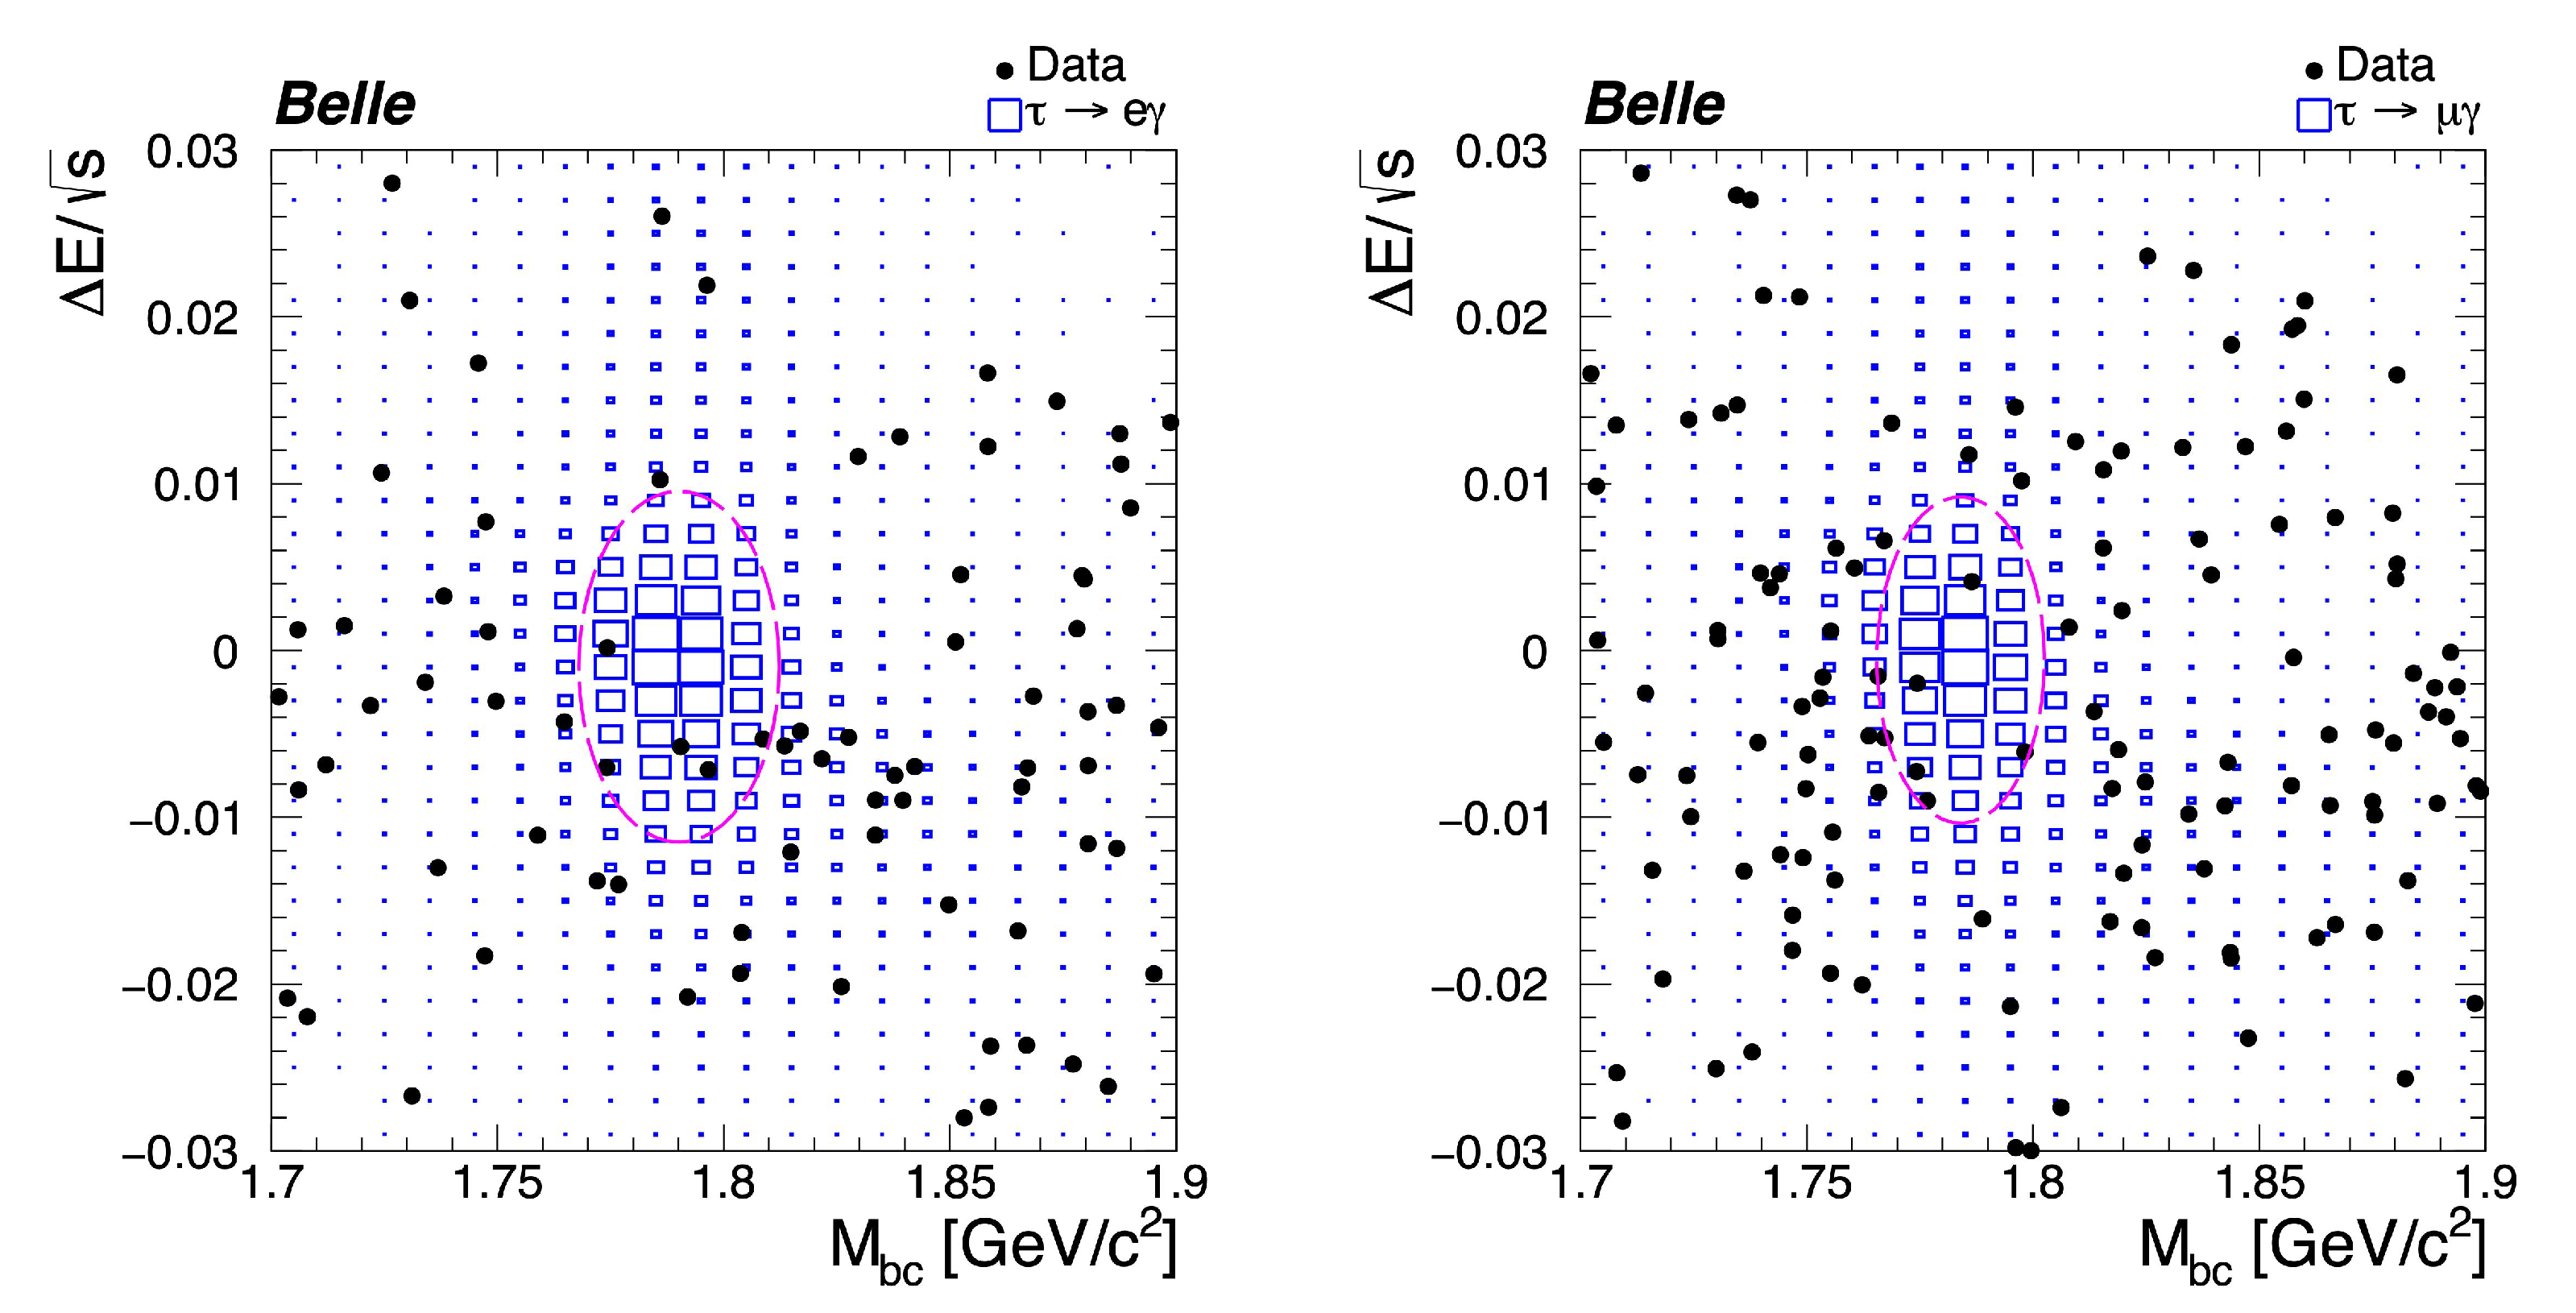
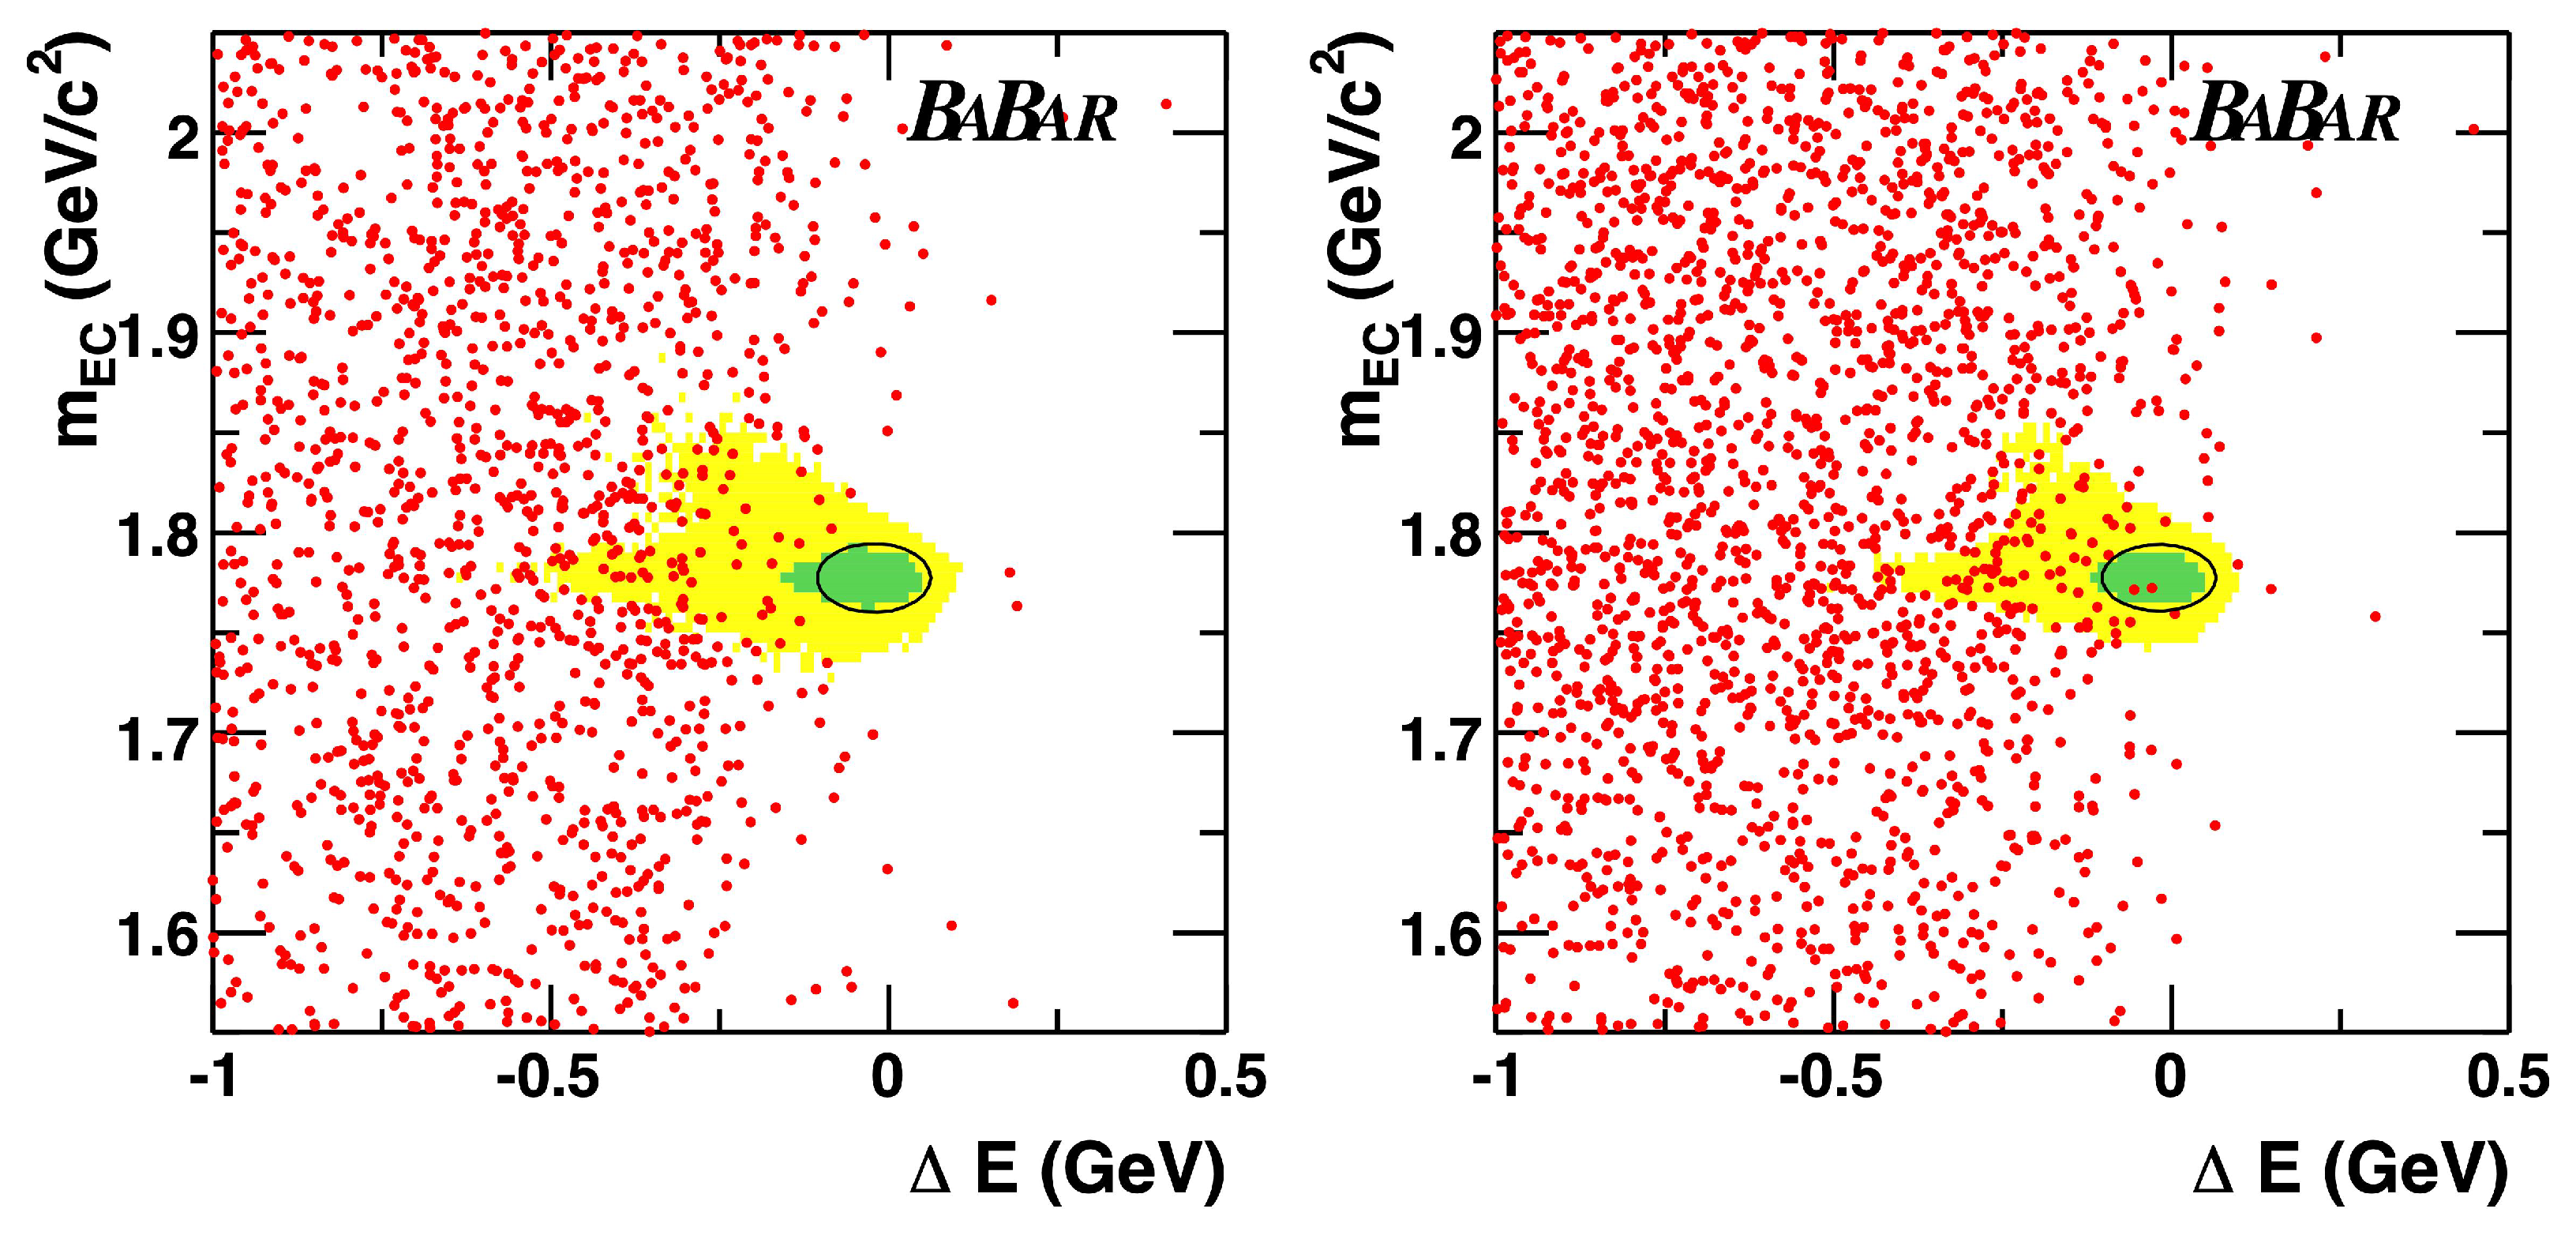
The signal events are clustered around and in the two-dimensional plots of vs. , as shown in Figure 3 and Figure 4 for (left) and (right) searches at Belle [70] and BABAR [69] experiments, respectively, where the variable refers to the beam-energy-constrained mass in the latter, as mentioned earlier.
All analyses are developed in a blind manner, e.g., optimizing the event selection before looking at the data events inside the signal region, to avoid experimental bias in the search for LFV decays. The search sensitivity can be optimized to give the smallest expected upper limit in the background-only hypothesis inside a ellipse, for example, amongst other possible choices. A typical signal region is defined as the following elliptical regions:
Here, and are the widths on the higher/lower side of the peak obtained by fitting the signal distribution to an asymmetric Gaussian function [71].
For the Belle search [70], the resolutions are MeV/c and for events; and MeV/c and for events. The mean values are MeV/c and for events, and MeV/c and for events. For the BABAR search [69], the resolutions for and are 8.6 MeV/c and 42.1 for , and 8.3 MeV/c and 42.2 for , respectively, centered on 1777.3 MeV/c and −21.4 for , and 1777.4 MeV/c and −18.3 for . Shifts from zero for are mostly due to initial and final state radiations.
The mass and energy kinematic variables typically have a small correlation arising from initial and final state radiation, as well as energy/momentum scale calibration effects. For the BABAR search [69], the correlation was estimated to be −8.5% and −8.4% for the and decays, respectively, around the core region. Without the beam-energy constraint, the correlation between the invariant mass and energy variables are typically much higher.
LFV process in decays containing a resonance in the final state are identified by the presence of a peak in the invariant mass of the daughter particles in the simulation of the signal process. For example, distributions of invariant mass of the , , , , and systems in the signal-side are studied and confirmed to contain the respective resonances in searches for , , , , and decays, respectively, performed by the Belle experiment [72,73]. The selected mass regions ensure that the signal is unambiguously selected in the corresponding searches.
3.3. Background Suppression
Background events containing leptons from decays of heavy quarks are easily suppressed by appropriate cuts on Fox-Wolfram moments [74], and on the invariant mass of all decay products on the tag-side. The characteristic difference between -pairs events with LFV decays and backgrounds consisting of generic -pair, di-lepton, two-photon production and processes (where ), in the number of neutrinos in the signal-side and tag-side, as defined by the event topology in Section 3.1, are shown in Table 2.
Since decay products of the decay via LFV in the signal-side do not contain any neutrino, the direction of the lepton in the tag-side can be precisely obtained in the center-of-mass frame by reversing the total momentum of the signal-side. This allows for good kinematic reconstruction of the missing mass in the tag-side, assuming that in the CM frame, the tag-side momentum is opposite that of the signal-side momentum and that its energy is constrained to be half the center-of-mass energy. Thus, selection of events with small values of the square of the missing mass () in the tag-side play an important role in the suppression of the background events [70].
Additional selection criteria are also used to suppress the backgrounds in the different LFV decay modes, which are mostly accidental in nature, except in and searches. The dominant background in the searches arise from events decaying via the () channel with a photon coming from initial-state radiation or beam background. The and events are subdominant, and are estimated to contribute to <5% of the total backgrounds in the Belle search [70]. Contributions from other sources of backgrounds, such as two-photon and processes, are estimated to be quite small in the signal region.
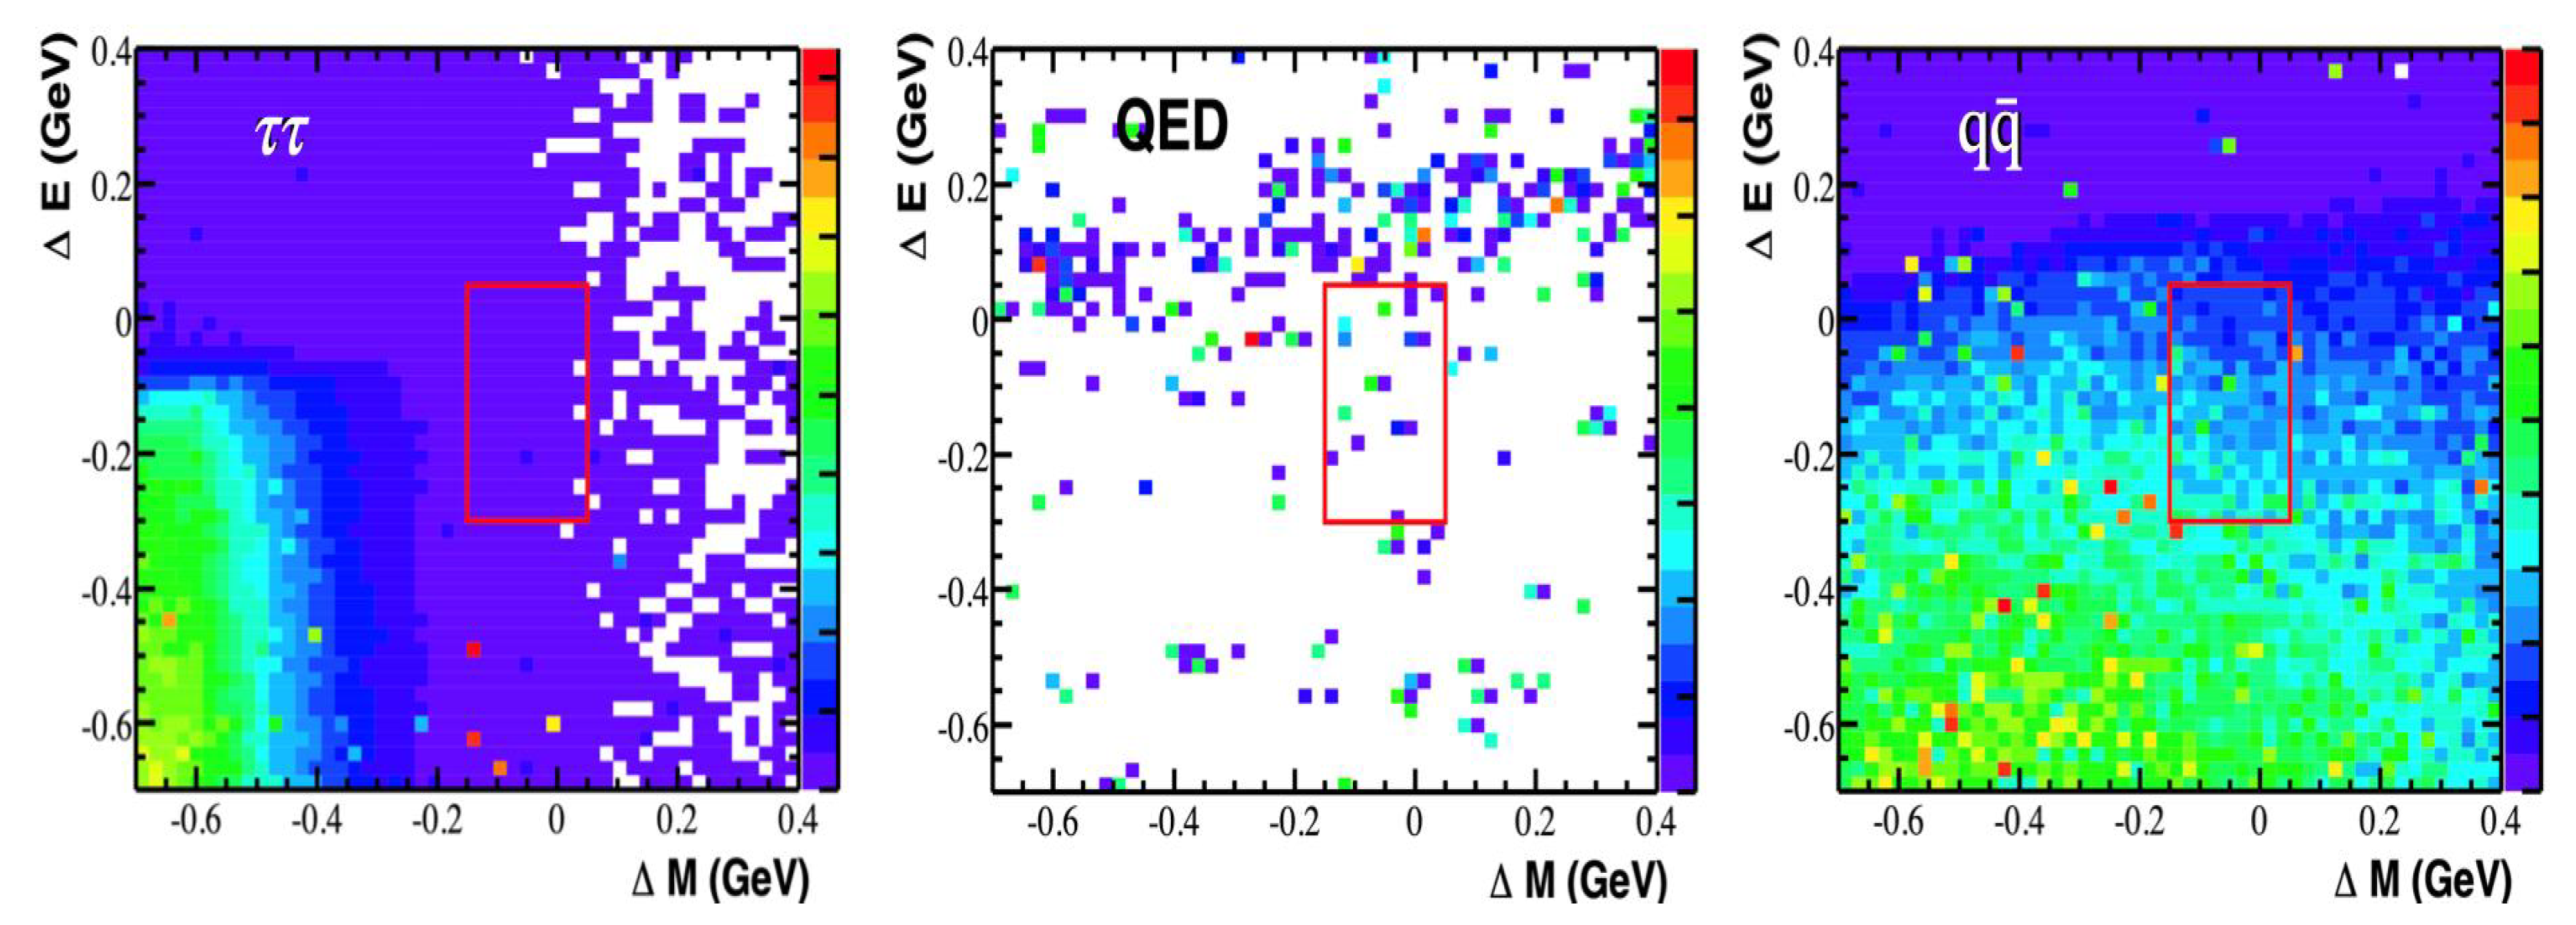
Furthermore, each component of the background processes has distinctive features as visible in their respective two-dimensional distributions in the plane, where denotes the difference between the characteristic mass of the system of -daughters and the well-known mass of the -lepton = [75], and , as defined above. The shapes of the leading backgrounds in search of decays as performed at the BABAR experiment [76] are shown in Figure 5, where the red box indicates the rectangular boundaries of a generic region mostly populated by the signal processes. The SM background events are generally restricted to small negative values of both and variables, because the reconstruction of signal event topology does not account for the neutrinos present in SM decays. QED background events are mostly dominated by di-lepton production as the main underlying hard process and typically lie within a narrow horizontal band across the variable centered around slightly positive values of , due to the presence of a pair of extra charged particles in such events. The QCD background events from various processes tend to populate the plane uniformly across the variable and drop towards large values of the variable. The expected background rates inside the signal region can be obtained by fitting the observed data in the plane to a sum of probability density functions. Such data-driven estimates, based on the shapes predicted by respective simulation samples and validated by data-driven control regions, scale well with larger data statistics. Thus, the background uncertainties can be controlled in a statistical manner, which is very useful in rare searches with high luminosity data sets.
3.4. Upper Limit Estimation
No excess of events has ever been observed in searches for LFV in decays. The upper limit at 90% confidence level (CL) on signal branching fraction () is calculated as:
where is the number of -pairs produced, is the reconstruction efficiency of the signal decay mode, and is the 90% CL upper limit on number of signal events. The factor of two enters into the denominator because either one of the two leptons produced in the event can decay into the rare signal channel coming from LFV.
3.4.1. Number of -Pairs Produced
is obtained by summing over the product of luminosity and the -pairs production cross-section at each of the center-of-mass energies () where the search is conducted. The cross-section of -pair production in annihilation follows a characteristic dependence, but receives additional contribution from decays of the resonances for , according to the known branching fractions [75]: , and . Beyond the open-beauty threshold, contributions from resonances with are negligible.
The Belle experiment collected data with center-of-mass energies around the peak of resonances corresponding to luminosities of , and at , respectively, while the BABAR experiment collected luminosities of and at center-of-mass energies corresponding to the peak at , respectively, as reported in Table 3.2.1 in the reference [52]. The statistical errors on these measured luminosities are much smaller than the systematic errors, which are estimated to be 1.4% at the Belle experiment, and 0.7% (0.6%) at the BABAR experiment for , respectively [52].
The numbers of produced in the Belle experiment are , and for , respectively, while in the BABAR experiment, the numbers are and for , respectively, as obtained from Table 3.2.2 in the reference [52]. By dividing the numbers of resonances produced with its corresponding luminosity, the resonant production cross-sections are estimated for to be in the Belle experiment, for to be and in the Belle and BABAR experiments, and for to be and in the Belle and BABAR experiments, respectively. For the purposes of averaging the measured values, the observed differences at resonances are accounted for by calculating the PDG-style scale factors [75] equal to 4.38 and 4.24, respectively, with . Thus, the average values are estimated to be for and for .
The total is obtained by adding the contributions to -pairs production from the continuum [39] and the contributions from the decays of the resonances for . The estimated values of total at the peak of resonances and at below the corresponding resonances (labelled with a “—off”) are listed in Table 3.
3.4.2. Efficiency of Signal Reconstruction
The signal reconstruction efficiency receives multiplicative reduction factors corresponding to the application of trigger, acceptance, and event topology requirements, particle identification criteria, background suppression and choice of the signal region in the two-dimensional plane given by mass versus the normalized difference of energy of the decay products and . At Belle and BABAR, the signal efficiencies were estimated to lie approximately between to , depending on the different decay channels. For example, the overall signal efficiency estimated for the search for reconstructed via the and decay modes is [77], while the search for decays have an efficiency of 11.5% [78]. In the Belle II experiment, an increase in the signal efficiency can be expected due to higher trigger efficiencies, improvements in the vertex reconstruction, charged track and neutral meson reconstructions, and particle identification. Refinements in the analysis techniques will produce a more accurate understanding of the physics backgrounds and would thus contribute to an increase in the signal detection efficiency, which directly translates into higher sensitivities in searches for LFV.
3.4.3. Upper Limit on the Number of Signal Events
In the case of searches with very low counts, the search becomes a single-bin counting experiment following a Poisson probability distribution, with the mean count given by the expected number of background events (b) and possibly some signal events (s). The likelihood function is thus described by:
where N is the number of observed events. If the experimental resolution of the discriminating variables allows multiple bins, the difference in shapes of the discriminating variables between the signal and background distributions can be exploited in an extended unbinned maximum likelihood fit using:
where i indicates the i-th event, and are the probability density functions (PDF) for signal and sum of all background process, respectively.
is obtained by considering , and integrating the likelihood up to the value that includes 90% of the total integral of the likelihood function, following a flat prior Bayesian prescription [79]. Alternatively, following a Frequentist prescription [80], a toy Monte Carlo approach is used to generate numerous samples with sizes that follow a Poisson distribution about the mean value being given by the number of observed events. Each sample is then fitted to obtain the number of signal and background events using the same extended unbinned maximum likelihood fit procedure as that applied to the data. is obtained by varying the true branching fraction of the signal such that 90% of the samples yield a fitted number of signal events greater than the number of signal events in the observed data sample. In the unified approach for finding confidence levels [81], the order of samples in the acceptance interval for a specific value of the number of signal events follows an ordering principle based on likelihood ratios, where the denominator is determined by the best fit value in each sample.
In order to have an unbiased estimate of the expected sensitivity, a blinding procedure should be followed to predict the expected background rate inside the signal region (SR), which does not depend on the observed data inside a blinding region (BR), defined as a part of a broad fit range (FR), but hiding data events inside the SR. For well-controlled modeling of the total background PDF, the number of expected background events () inside the SR can then be estimated directly from the data outside the blinded region using the formula:
where and are the integrals of the background probability density functions over the signal region and the non-blinded parts of the fit region.
3.5. Systematic Uncertainties
In terms of the number of decays being studied, , the number of signal events are written as , where is the branching fraction of the signal process and the normalization factor t includes uncertainities on luminosity, cross-section and the signal efficiency. The upper limit including all systematic effects using the technique of Cousins and Highland [82], is calculated by propagating all the measured uncertainties onto the number of signal events and background events .
Implementation of systematic effects in the POLE (POisson Limit Estimator) program [83] is based on the following likelihood function, which is a convolution of a Poisson distribution with two Gaussian resolution functions corresponding to the signal normalization factor and background, as described by the following formula:
where and are the average estimates corresponding to measured uncertainties of and , respectively.
In searches for rare processes such as LFV in decays, often a very small number of events are expected in the signal region. Sometimes the sensitivity of the search cannot easily distinguish a very small number of signal events from the background-only hypothesis, and inappropriately tends to exclude an unusually small signal value. To overcome such difficulties, the upper limits can be calculated using the method [84,85], where the is defined as the ratio of confidence levels for the signal-plus-background hypothesis normalized by the confidence level for the background-only hypothesis. Asymptotic calculations of the likelihood ratios used as the test statistic in such methods allow for a computationally efficient estimate of the intervals [86].
A Neyman construction [87] of upper limits including systematic uncertainties is provided by the HistFactory implementation [88,89], based on the likelihood function defined as:
where is the number of events observed in the bin with signal normalization factor and background predictions given by and , respectively, of a multicategorical search describing, for example, different tag-side decay modes each with different sensitivity over possibly multiple decay channels of the signal mode. The systematic uncertainties are constrained by nuisance parameters corresponding to various scale factors as determined from dedicated calibration constants of efficiency measurements and are obtained from simulation studies or analysis of control regions in the data.
The HistFactory allows for the calculation of upper limits in both Bayesian and Frequentist interpretations [90], with slightly different treatments of the nuisance parameters. While in the former interpretation, the nuisance parameters are eliminated by marginalizing the posterior density, using, for example, Markov Chain Monte Carlo integration, in the latter interpretation, the nuisance parameters are determined by profiling the likelihood function based on auxiliary measurements, such as control regions, side-bands, or dedicated calibration measurements. Some uncertainties arising from theoretical calculations or ad hoc estimates are not statistical in nature and thus are not associated with auxiliary measurements. However, log-normal probability density functions of nuisance parameters are used to constrain all the uncertainties, by convention.
Bayesian limits can also be calculated using the Bayesian Analysis Toolkit [91].
4. Current Status and Future Prospects
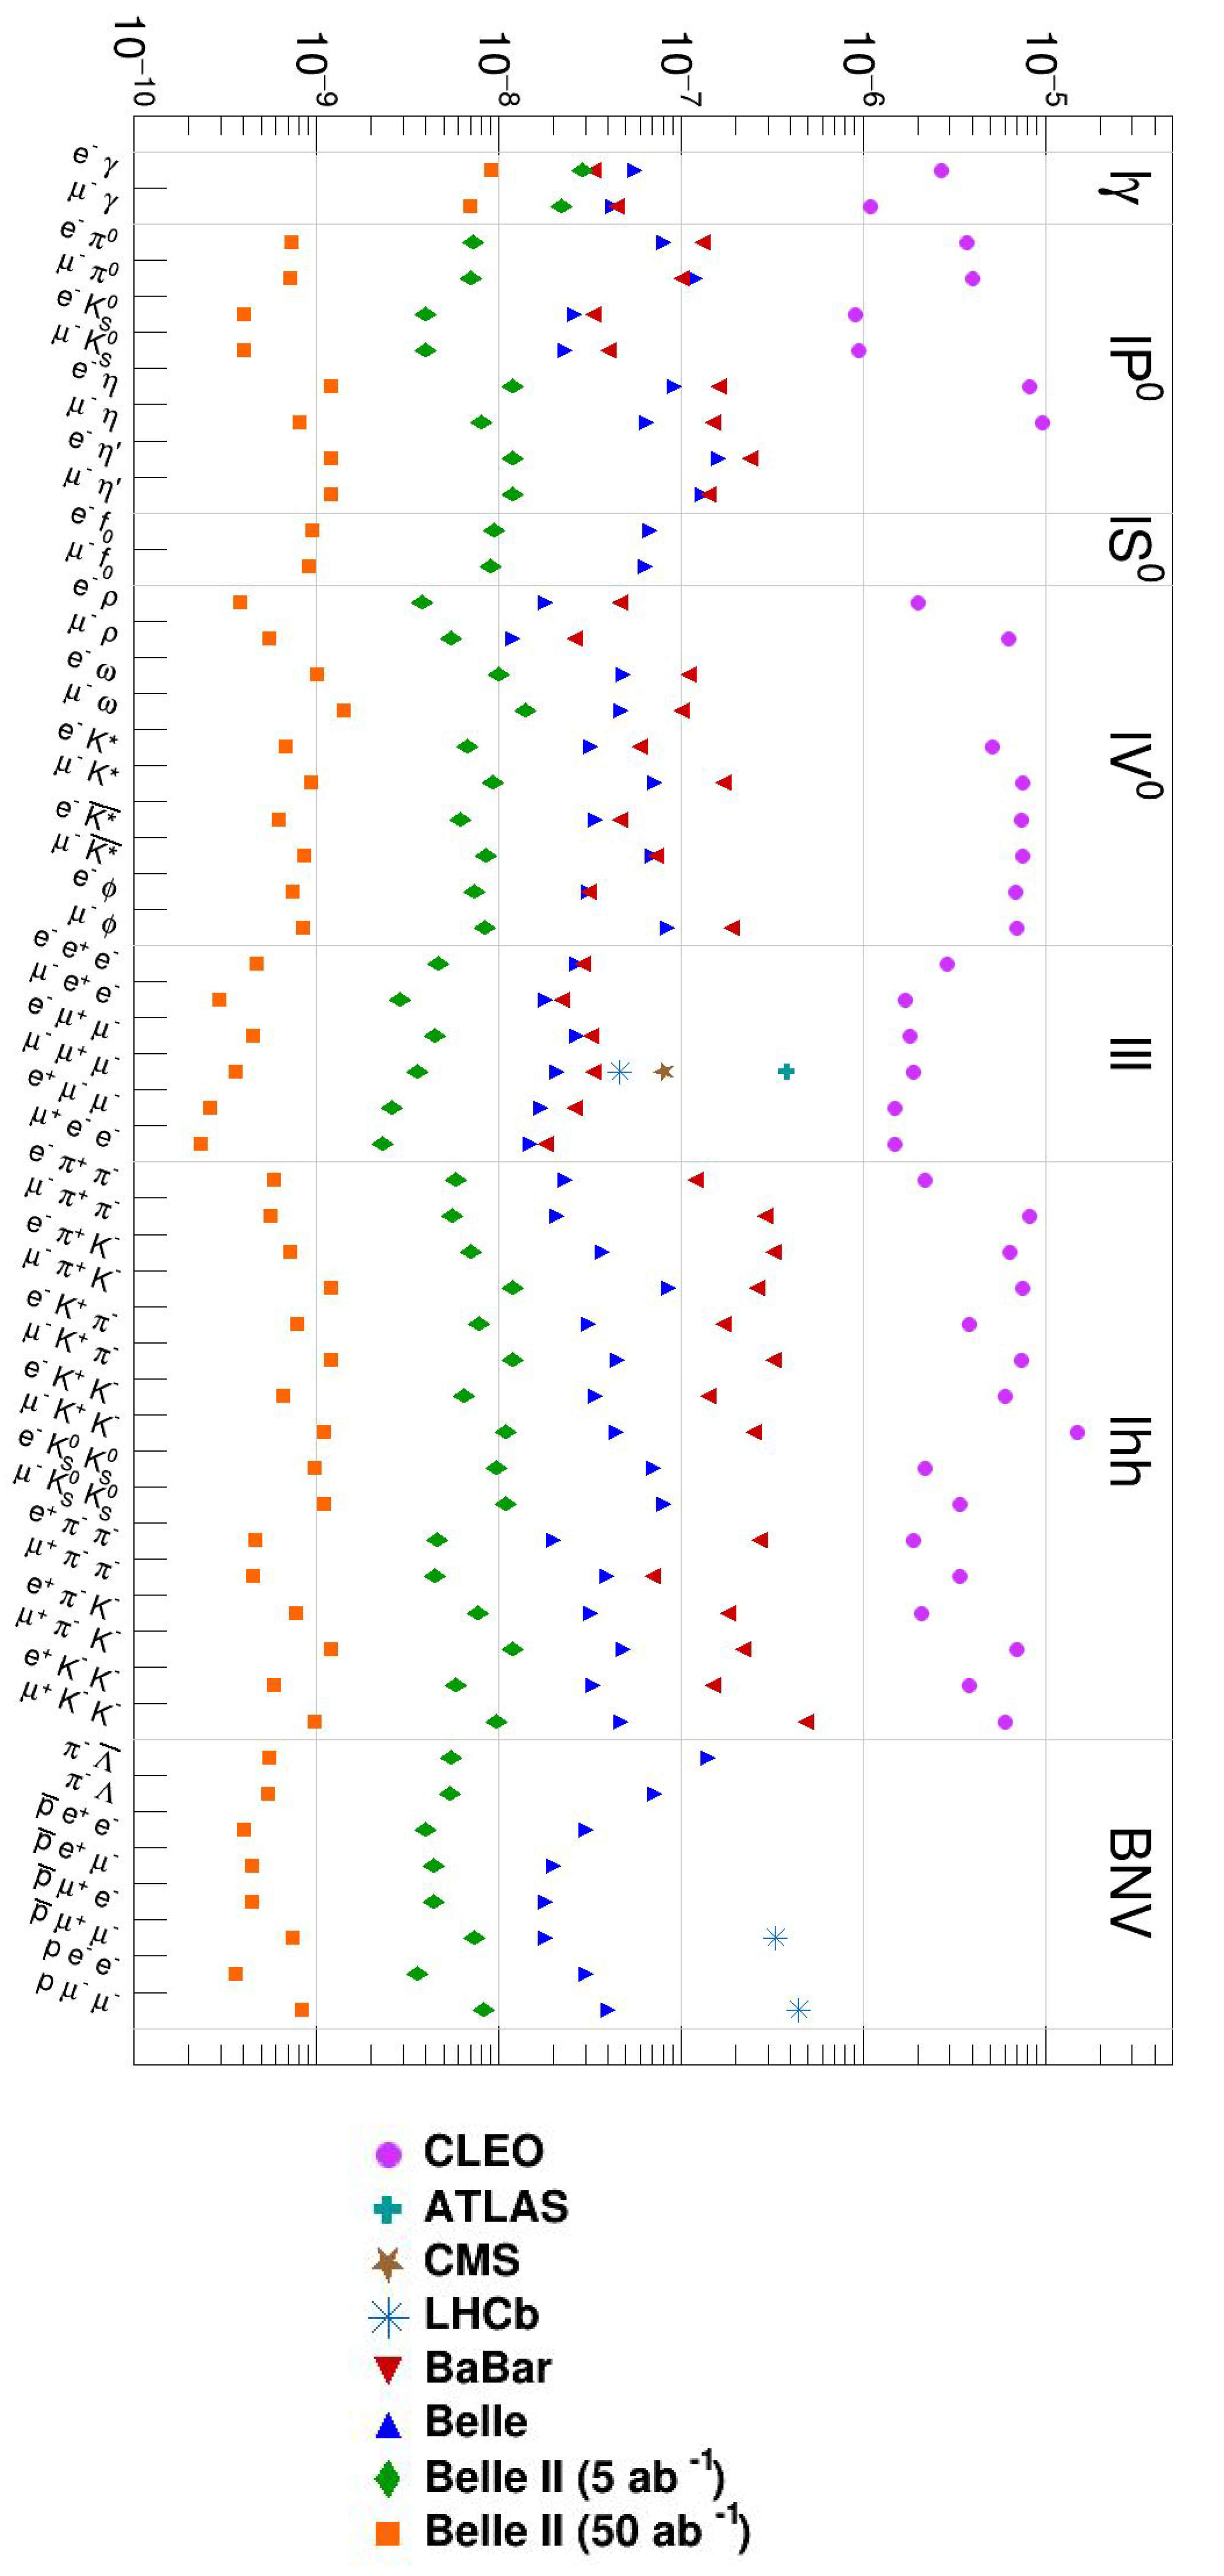
Summary of observed limits obtained by CLEO, BABAR, Belle, ATLAS, CMS, and LHCb experiments [92] are shown in Table 4 and Figure 6, along with projections for two illustrative scenarios of luminosity = 5 and 50 at the Belle II experiment [40]. Projections are extrapolated from expected limits obtained at the Belle experiment. The expected limits for decays are obtained from Ref. [70]. We assume the presence of irreducible backgrounds for decays, thus approximating the sensitivity to upper bounds as proportional to . Given the expected number of background events in each channel from the previous searches at the Belle experiment and the improvements listed in Section 3.4.2, the background expectations corresponding to the integrated luminosity at Belle II for all other modes are still of the order of unity or less. For such accidental backgrounds, the sensitivity for upper bounds is proportional to , as discussed in Section 8.2.1.3 of Ref. [93]. The projections for the corresponding upper limits at Belle II are estimated using the Feldman and Cousins approach [81].
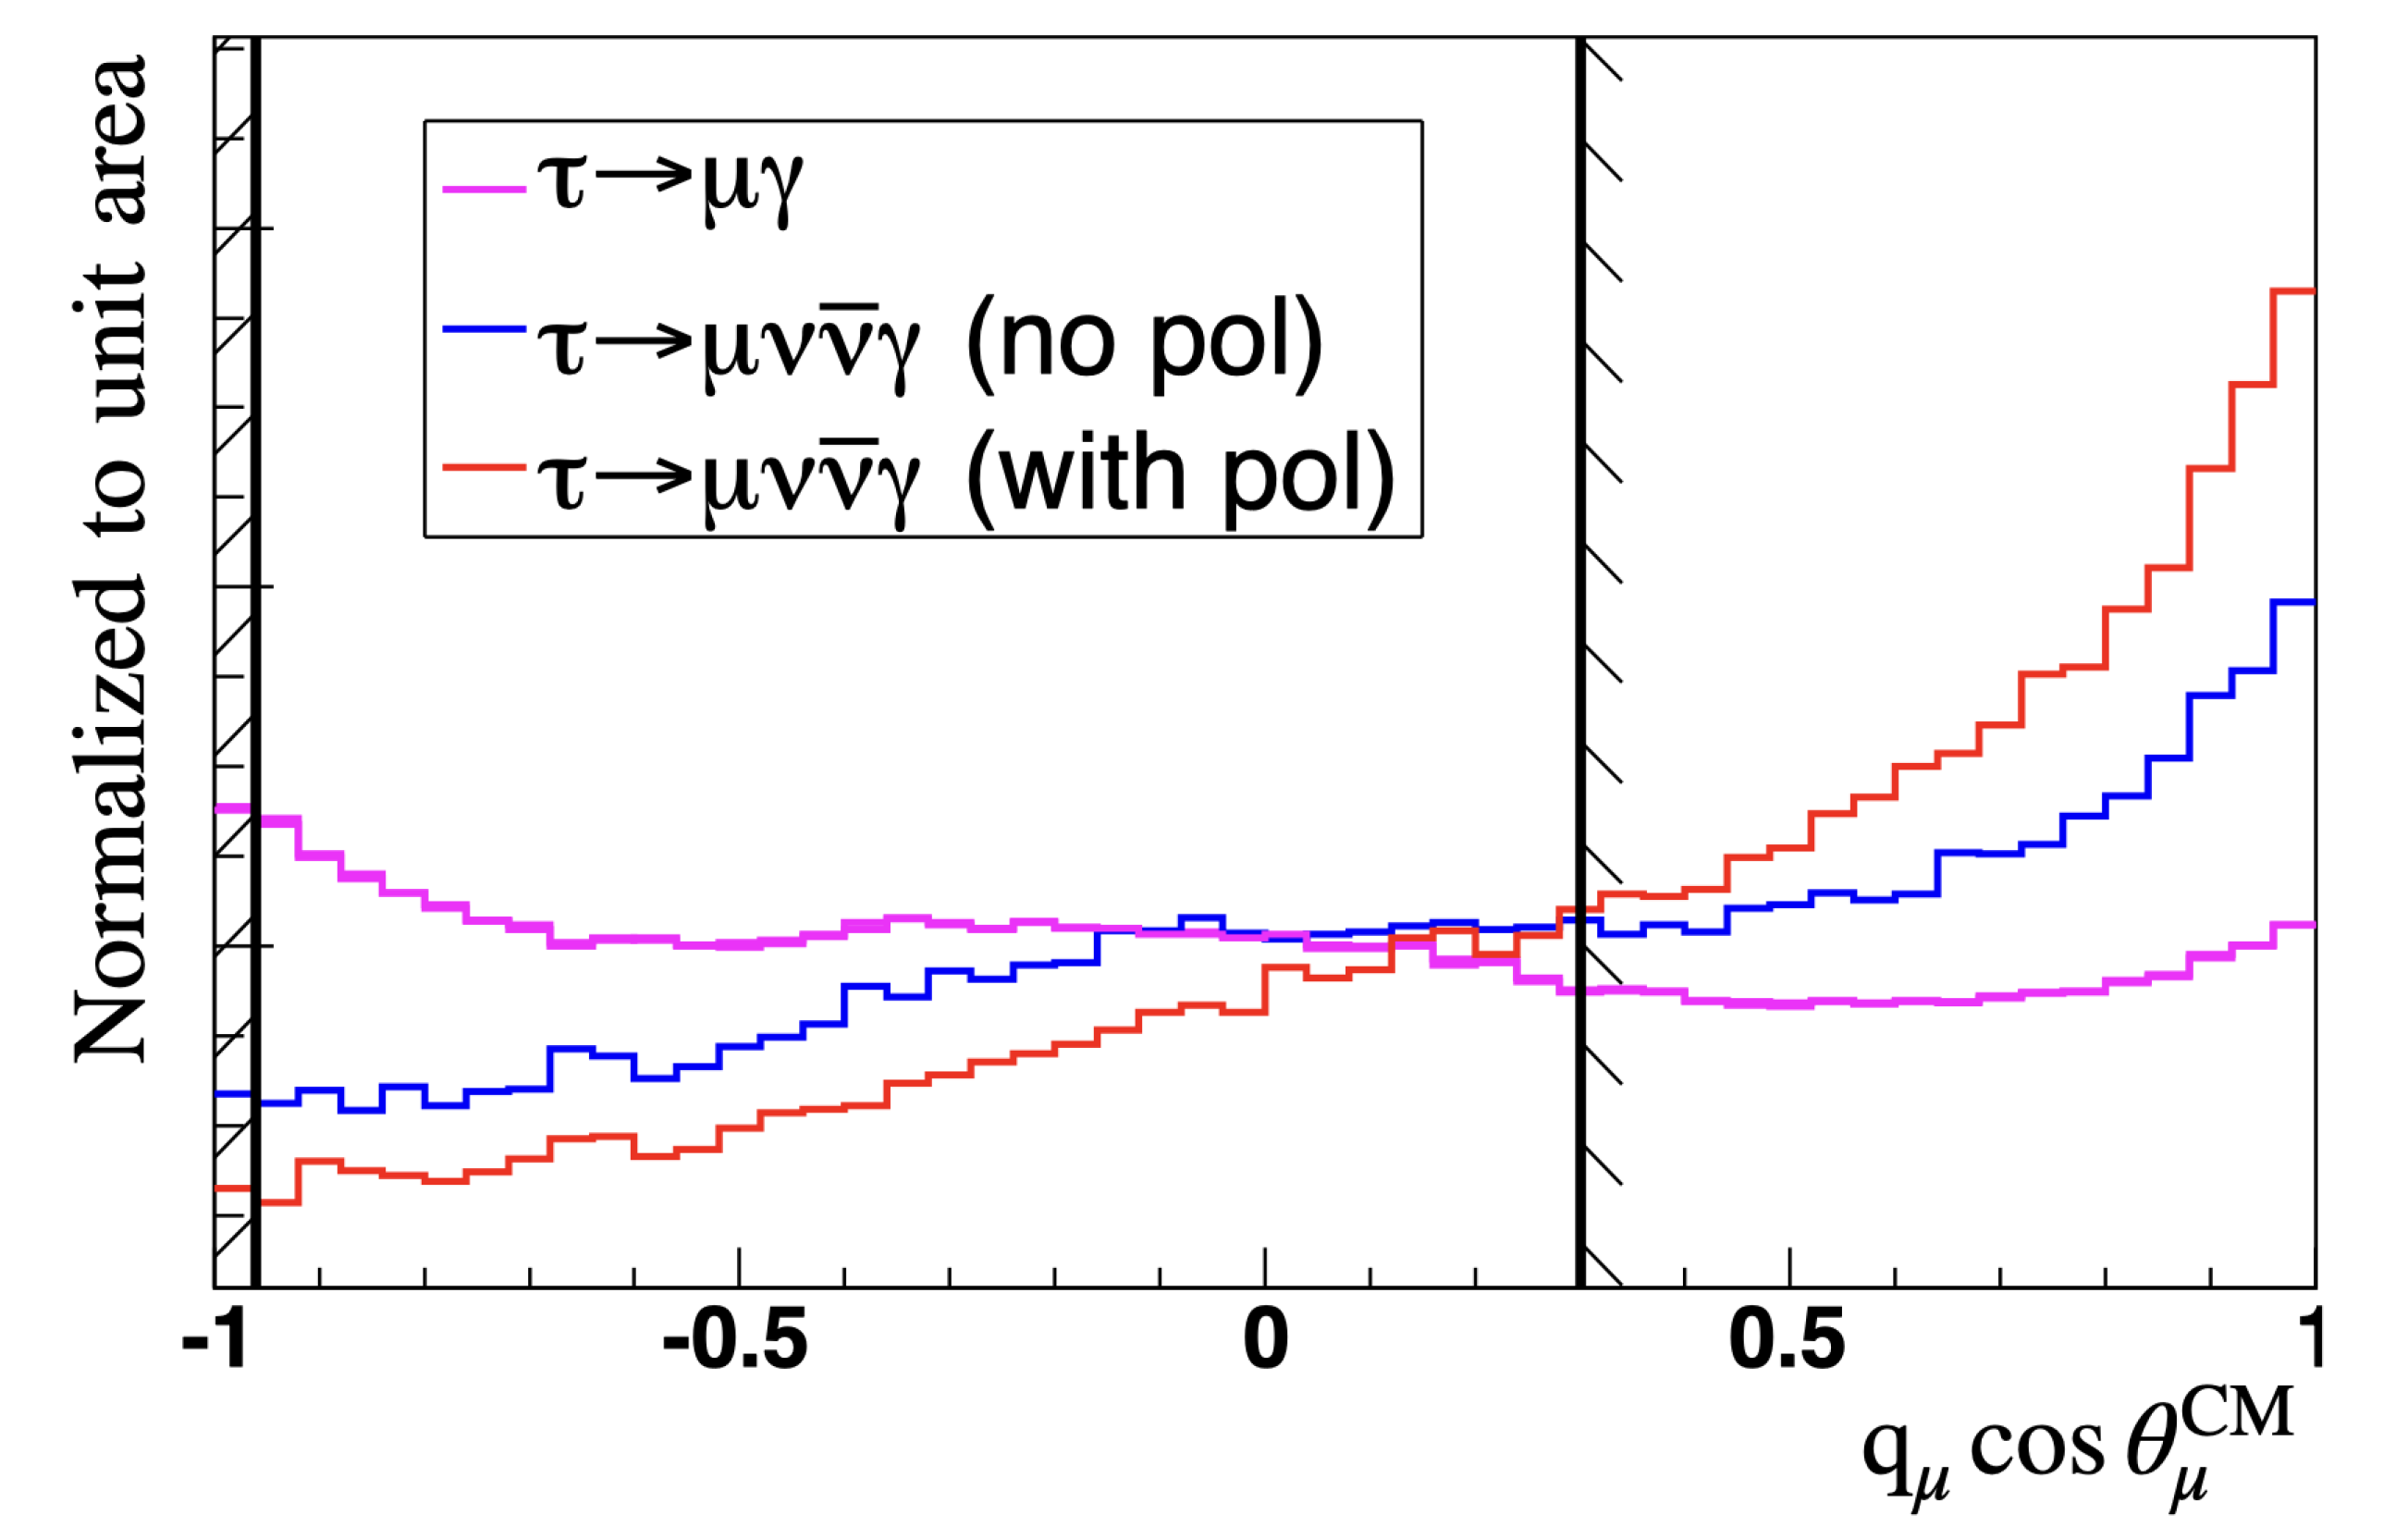
A beam polarization upgrade of the SuperKEKB collider can enhance the sensitivity to LFV in decays at the Belle II experiment to levels beyond the ones listed in Table 4 and Figure 6. The proposed upgrade [111] will result in longitudinal polarization of the high energy electron beam, which will influence the angular distribution of the decay products in the SM -pair backgrounds. The characteristic polarization dependence of the helicity angles of the decay products with beam polarization can then be used to further suppress the background in, for example, searches, where one decays to a muon and a photon, while the other decays to a pion and a neutrino, the decay channel most sensitive to the polarization of the lepton. Similar background suppression can also be obtained with the other decay modes, which vary in their sensitivity to the polarization. In general, the maximal discriminating power is obtained by studying the polar angles in the center-of-mass frame times the charge of the decay.
The “irreducible background” from decays are studied in Figure 7 [112]. While the distributions of the backgrounds show marked differences in the case of beam polarization with respect to the case of no beam polarization, the signal distribution modeled by uniform phase–phase does not change with beam polarization. By removing events where the distribution of the irreducible background shows a rising trend near unity, the background can be reduced significantly, corresponding to a small loss in signal efficiency. An optimization study has demonstrated that this would result in approximately a 10% improvement in the sensitivity to LFV. Similar analyses are expected to yield comparable gain in sensitivities for other decay modes.
It is worth noting that the uniform phase space model of the signal distribution is chosen because the underlying theory behind LFV is not known. Different spin-dependent operators are predicted to give significantly different features in the Dalitz plane of final state momenta distributions of, for example, decays [113,114]. One of the most interesting aspects of having the beam polarization is the possibility to distinguish between these different new physics models to understand the helicity structure of the couplings producing LFV in decays, once such decays are observed.
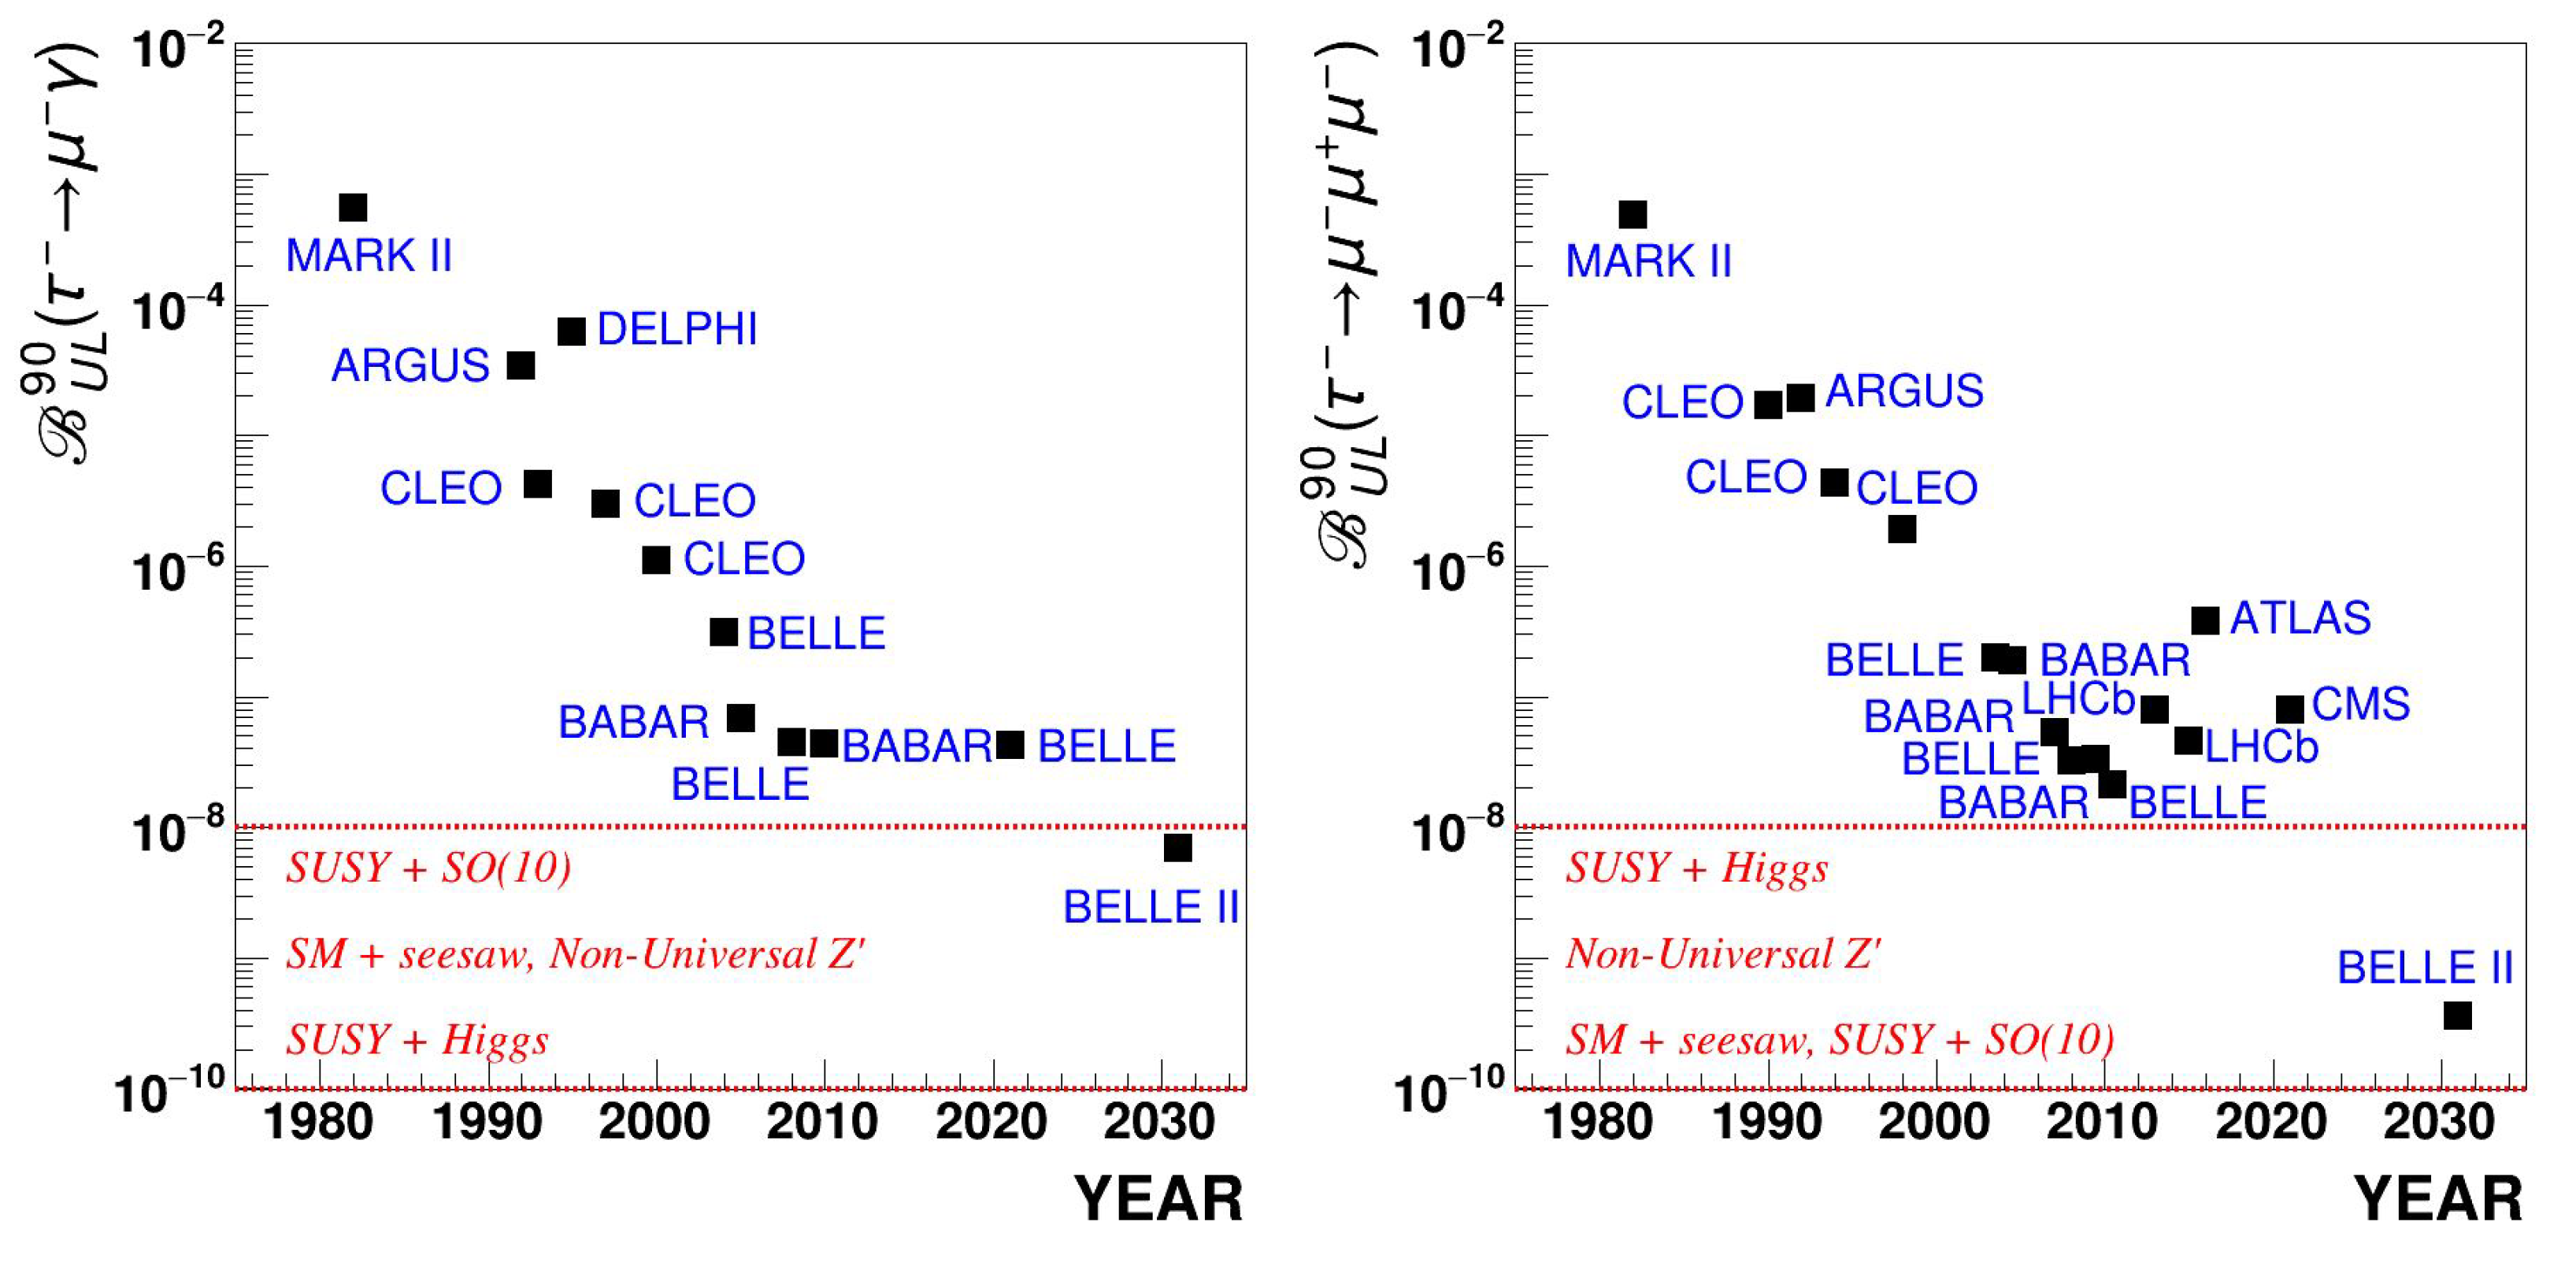
Belle II limits will probe predictions from several theoretical models, as listed in Table 1. Some theoretical expectations from different new physics models and improvements on experimental limits over the last few decades for [69,70,71,94,95,115,116,117,118,119,120] and [36,76,78,102,104,105,106,115,116,121,122,123,124,125,126] decays, along with future prospects at Belle II [40], are shown in Figure 8.
5. Conclusions
LFV in decays are unambiguous signatures of new physics, and are thus of great experimental and theoretical interest. Many models from supersymmetric scenarios to leptoquarks predict LFV in decays at experimentally observable rates, which will be probed at Belle II. Searches for LFV in decays can discover new physics at the multi-TeV scale by identifying the underlying mechanism beyond the SM, or strongly constrain the flavor structure of TeV-scale extensions beyond the SM [127,128], as discussed in the context of different experimental efforts in Ref. [129]. The first generation B-Factory experiments, Belle and BABAR, saw an order of magnitude improvement on the upper limit on LFV in decays from level down to level. The Belle II experiment will continue to improve the sensitivity in searches of LFV in decays over the next decade. The projected sensitivity at Belle II for LFV in decays with 50 of data is at the – level, which constitutes one or two orders of magnitude of improvement over the previous experiments.
[custom]
Funding
This project was supported by the U.S. Department of Energy under research Grant No. DE-SC0022350.
Institutional Review Board Statement
Not applicable.
Informed Consent Statement
Not applicable.
Data Availability Statement
Not applicable.
Acknowledgments
The author acknowledges fruitful discussions with Kiyoshi Hayasaka, Kenji Inami, John Micheal Roney, Armine Rostomyan, Michel Hernández Villanueva, and many others. Sources of all figures and tables included for discussions have been appropriately cited, and reproduced with permissions from the respective collaborations.
Conflicts of Interest
The author declares no conflict of interest.
References
- Lee, B.W.; Shrock, R.E. Natural Suppression of Symmetry Violation in Gauge Theories: Muon-Lepton and Electron Lepton Number Nonconservation. Phys. Rev. D 1977, 16, 1444. [Google Scholar] [CrossRef]
- Petcov, S.T. The Processes μ→e+γ,μ→e+e¯,ν′→ν+γ in the Weinberg-Salam Model with Neutrino Mixing. Sov. J. Nucl. Phys. 1977, 25, 340, Erratum in Sov. J. Nucl. Phys. 1977, 25, 698; Yad. Fiz. 1977, 25, 1336. [Google Scholar]
- Pham, X.Y. Lepton flavor changing in neutrinoless tau decays. Eur. Phys. J. C 1999, 8, 513–516. [Google Scholar] [CrossRef]
- Hernández-Tomé, G.; López Castro, G.; Roig, P. Flavor violating leptonic decays of τ and μ leptons in the Standard Model with massive neutrinos. Eur. Phys. J. C 2019, 79, 84, Erratum in Eur. Phys. J. C. 2020, 80, 438. [Google Scholar] [CrossRef]
- Blackstone, P.; Fael, M.; Passemar, E. τ→μμμ at a rate of one out of 1014 tau decays? Eur. Phys. J. C 2020, 80, 506. [Google Scholar] [CrossRef]
- Cvetic, G.; Dib, C.; Kim, C.S.; Kim, J.D. On lepton flavor violation in tau decays. Phys. Rev. D 2002, 66, 034008, Erratum in Phys. Rev. D. 2003, 68, 059901. [Google Scholar] [CrossRef]
- Ellis, J.R.; Gomez, M.E.; Leontaris, G.K.; Lola, S.; Nanopoulos, D.V. Charged lepton flavor violation in the light of the Super-Kamiokande data. Eur. Phys. J. C 2000, 14, 319–334. [Google Scholar] [CrossRef]
- Ellis, J.R.; Hisano, J.; Raidal, M.; Shimizu, Y. A New parametrization of the seesaw mechanism and applications in supersymmetric models. Phys. Rev. D 2002, 66, 115013. [Google Scholar] [CrossRef]
- Dedes, A.; Ellis, J.R.; Raidal, M. Higgs mediated Bs,d0→μτ, eτ and τ→3μ, eμμ decays in supersymmetric seesaw models. Phys. Lett. B 2002, 549, 159–169. [Google Scholar] [CrossRef]
- Brignole, A.; Rossi, A. Lepton flavor violating decays of supersymmetric Higgs bosons. Phys. Lett. B 2003, 566, 217–225. [Google Scholar] [CrossRef]
- Masiero, A.; Vempati, S.K.; Vives, O. Seesaw and lepton flavor violation in SUSY SO(10). Nucl. Phys. B 2003, 649, 189–204. [Google Scholar] [CrossRef] [Green Version]
- Hisano, J.; Nagai, M.; Paradisi, P.; Shimizu, Y. Waiting for mu —> e gamma from the MEG experiment. J. High Energy Phys. 2009, 12, 030. [Google Scholar] [CrossRef]
- Fukuyama, T.; Kikuchi, T.; Okada, N. Lepton flavor violating processes and muon g-2 in minimal supersymmetric SO(10) model. Phys. Rev. D 2003, 68, 033012. [Google Scholar] [CrossRef]
- Choudhury, S.R.; Cornell, A.S.; Deandrea, A.; Gaur, N.; Goyal, A. Lepton flavour violation in the little Higgs model. Phys. Rev. D 2007, 75, 055011. [Google Scholar] [CrossRef]
- Blanke, M.; Buras, A.J.; Duling, B.; Poschenrieder, A.; Tarantino, C. Charged Lepton Flavour Violation and (g-2)(mu) in the Littlest Higgs Model with T-Parity: A Clear Distinction from Supersymmetry. J. High Energy Phys. 2007, 5, 013. [Google Scholar] [CrossRef]
- Davidson, S.; Bailey, D.C.; Campbell, B.A. Model independent constraints on leptoquarks from rare processes. Z. Phys. C 1994, 61, 613–644. [Google Scholar] [CrossRef]
- Yue, C.X.; Zhang, Y.M.; Liu, L.J. Nonuniversal gauge bosons Z-prime and lepton flavor violation tau decays. Phys. Lett. B 2002, 547, 252–256. [Google Scholar] [CrossRef]
- Akeroyd, A.G.; Aoki, M.; Sugiyama, H. Lepton Flavour Violating Decays τ→ℓ¯ℓℓ and μ→eγ in the Higgs Triplet Model. Phys. Rev. D 2009, 79, 113010. [Google Scholar] [CrossRef]
- Harnik, R.; Kopp, J.; Zupan, J. Flavor Violating Higgs Decays. J. High Energy Phys. 2013, 3, 26. [Google Scholar] [CrossRef]
- Celis, A.; Cirigliano, V.; Passemar, E. Lepton flavor violation in the Higgs sector and the role of hadronic τ-lepton decays. Phys. Rev. D 2014, 89, 013008. [Google Scholar] [CrossRef]
- Omura, Y.; Senaha, E.; Tobe, K. Lepton-flavor-violating Higgs decay h→μτ and muon anomalous magnetic moment in a general two Higgs doublet model. J. High Energy Phys. 2015, 5, 28. [Google Scholar] [CrossRef] [Green Version]
- Goudelis, A.; Lebedev, O.; Park, J.H. Higgs-induced lepton flavor violation. Phys. Lett. B 2012, 707, 369–374. [Google Scholar] [CrossRef]
- Black, D.; Han, T.; He, H.J.; Sher, M. τ–μ flavor violation as a probe of the scale of new physics. Phys. Rev. D 2002, 66, 053002. [Google Scholar] [CrossRef]
- Babu, K.S.; Kolda, C. Higgs mediated τ→3μ in the supersymmetric seesaw model. Phys. Rev. Lett. 2002, 89, 241802. [Google Scholar] [CrossRef]
- Sher, M. τ→μη in supersymmetric models. Phys. Rev. D 2002, 66, 057301. [Google Scholar] [CrossRef]
- Brignole, A.; Rossi, A. Anatomy and phenomenology of mu-tau lepton flavor violation in the MSSM. Nucl. Phys. B 2004, 701, 3–53. [Google Scholar] [CrossRef]
- Goto, T.; Okada, Y.; Shindou, T.; Tanaka, M. Patterns of flavor signals in supersymmetric models. Phys. Rev. D 2008, 77, 095010. [Google Scholar] [CrossRef]
- Baldini, A.M.; et al. [MEG Collaboration] Search for the lepton flavour violating decay μ+→e+γ with the full dataset of the MEG experiment. Eur. Phys. J. C 2016, 76, 434. [Google Scholar] [CrossRef]
- Bellgardt, U.; et al. [SINDRUM Collaboration] Search for the Decay mu+ —>e+e+e-. Nucl. Phys. B 1988, 299, 1–6. [Google Scholar] [CrossRef]
- Lopez Castro, G.; Quintero, N. Lepton number violating four-body tau lepton decays. Phys. Rev. D 2012, 85, 076006, Erratum in Phys. Rev. D. 2012, 86, 079904. [Google Scholar] [CrossRef]
- Gonzalez-Garcia, M.C.; Valle, J.W.F. Enhanced lepton flavor violation with massless neutrinos: A Study of muon and tau decays. Mod. Phys. Lett. A 1992, 7, 477–488. [Google Scholar] [CrossRef] [Green Version]
- Ilakovac, A. Lepton flavor violation in the standard model extended by heavy singlet Dirac neutrinos. Phys. Rev. D 2000, 62, 036010. [Google Scholar] [CrossRef]
- Arganda, E.; Herrero, M.J.; Portoles, J. Lepton flavour violating semileptonic tau decays in constrained MSSM-seesaw scenarios. J. High Energy Phys. 2008, 6, 79. [Google Scholar] [CrossRef]
- Li, W.J.; Yang, Y.D.; Zhang, X.D. τ-→μ-π0(η,η′) decays in new physics scenarios beyond the standard model. Phys. Rev. D 2006, 73, 073005. [Google Scholar] [CrossRef]
- Pacheco, I.; Roig, P. Lepton flavor violation in the Littlest Higgs Model with T parity realizing an inverse seesaw. J. High Energy Phys. 2022, 2, 54. [Google Scholar] [CrossRef]
- Aaij, R.; et al. [LHCb coolaboration] Searches for violation of lepton flavour and baryon number in tau lepton decays at LHCb. Phys. Lett. B 2013, 724, 36–45. [Google Scholar] [CrossRef]
- Fuentes-Martin, J.; Portoles, J.; Ruiz-Femenia, P. Instanton-mediated baryon number violation in non-universal gauge extended models. J. High Energy Phys. 2015, 1, 134. [Google Scholar] [CrossRef]
- Hou, W.S.; Nagashima, M.; Soddu, A. Baryon number violation involving higher generations. Phys. Rev. D 2005, 72, 095001. [Google Scholar] [CrossRef]
- Banerjee, S.; Pietrzyk, B.; Roney, J.M.; Was, Z. Tau and muon pair production cross-sections in electron-positron annihilations at s=10.58 GeV. Phys. Rev. D 2008, 77, 054012. [Google Scholar] [CrossRef]
- Aggarwal, L.; et al. [Belle II collaboration] Snowmass White Paper: Belle II physics reach and plans for the next decade and beyond. arXiv 2022, arXiv:2207.06307. [Google Scholar]
- Akai, K.; Furukawa, K.; Koiso, H. SuperKEKB Collider. Nucl. Instrum. Meth. A 2018, 907, 188–199. [Google Scholar] [CrossRef]
- Wu, W.; Summers, D. Luminosity and Crab Waist Collision Studies. arXiv 2015, arXiv:1505.06482. [Google Scholar]
- Suetsugu, Y.; Shibata, K.; Ishibashi, T.; Kanazawa, K.; Shirai, M.; Terui, S.; Hisamatsu, H. First commissioning of the SuperKEKB vacuum system. Phys. Rev. Accel. Beams 2016, 19, 121001. [Google Scholar] [CrossRef]
- Ohnishi, Y.; Abe, T.; Adachi, T.; Akai, K.; Arimoto, Y.; Ebihara, K.; Egawa, K.; Flanagan, J.; Fukuma, H.; Funakoshi, Y.; et al. Accelerator design at SuperKEKB. Prog. Theor. Exp. Phys. 2013, 2013, 03A011. [Google Scholar] [CrossRef]
- Bona, M.; et al. [SuperB collaboration] SuperB: A High-Luminosity Asymmetric e+ e- Super Flavor Factory. Conceptual Design Report. arXiv 2007, arXiv:0709.0451. [Google Scholar]
- Ohnishi, Y. Highlights from SuperKEKB Commissioning for early stage of Nano-Beam Scheme and Crab Waist Scheme. PoS 2021, ICHEP2020, 695. [Google Scholar] [CrossRef]
- Abe, T.; et al. [Belle II collaboration] Belle II Technical Design Report. arXiv 2010, arXiv:1011.0352. [Google Scholar]
- Altmannshofer, W.; et al. [Belle II collaboration] The Belle II Physics Book. Prog. Theor. Exp. Phys. 2019, 2019, 123C01, Erratum in PTEP 2020, 2020, 029201. [Google Scholar] [CrossRef]
- Abashian, A.; et al. [Belle collaboration] The Belle Detector. Nucl. Instrum. Meth. A 2002, 479, 117–232. [Google Scholar] [CrossRef]
- Abe, R.; et al. [Belle collaboration] The new beampipe for the Belle experiment. Nucl. Instrum. Meth. A 2004, 535, 558–561. [Google Scholar] [CrossRef]
- Kibayashi, A. Status of the Belle silicon vertex detector. Nucl. Instrum. Meth. A 2006, 569, 5–7. [Google Scholar] [CrossRef]
- Bevan, A.J.; et al. [BABAR and Belle collaborations] The Physics of the B Factories. Eur. Phys. J. C 2014, 74, 3026. [Google Scholar] [CrossRef]
- Balagura, V.; Danilov, M.; Dolgoshein, B.; Klemin, S.; Mizuk, R.; Pakhlov, P.; Popova, E.; Rusinov, V.; Tarkovsky, E.; Tikhomirov, I. Study of scintillator strip with wavelength shifting fiber and silicon photomultiplier. Nucl. Instrum. Meth. A 2006, 564, 590–596. [Google Scholar] [CrossRef]
- Yamada, S.; Itoh, R.; Nakamura, K.; Nakao, M.; Suzuki, S.Y.; Konno, T.; Higuchi, T.; Liu, Z.; Zhao, J. Data Acquisition System for the Belle II Experiment. IEEE Trans. Nucl. Sci. 2015, 62, 1175–1180. [Google Scholar] [CrossRef]
- Iwasaki, Y.; Cheon, B.; Won, E.; Gao, X.; Macchiarulo, L.; Nishimura, K.; Varner, G. Level 1 trigger system for the Belle II experiment. IEEE Trans. Nucl. Sci. 2011, 58, 1807–1815. [Google Scholar] [CrossRef]
- Zhou, Q.D.; Yamada, S.; Robbe, R.; Charlet, D.; Itoh, R.; Nakao, M.; Suzuki, S.Y.; Kunigo, T.; Jules, E.; Plaige, E.; et al. PCI-Express Based High-Speed Readout for the Belle II DAQ Upgrade. IEEE Trans. Nucl. Sci. 2021, 68, 1818–1825. [Google Scholar] [CrossRef]
- Jadach, S.; Ward, B.F.L.; Was, Z. The Precision Monte Carlo event generator K K for two fermion final states in e+ e- collisions. Comput. Phys. Commun. 2000, 130, 260–325. [Google Scholar] [CrossRef]
- Ward, B.F.L.; Jadach, S.; Was, Z. Precision calculation for e+e-—> 2f: The KK MC project. Nucl. Phys. B Proc. Suppl. 2003, 116, 73–77. [Google Scholar] [CrossRef]
- Arbuzov, A.; Jadach, S.; Wąs, Z.; Ward, B.F.L.; Yost, S.A. The Monte Carlo Program KKMC, for the Lepton or Quark Pair Production at LEP/SLC Energies—Updates of electroweak calculations. Comput. Phys. Commun. 2021, 260, 107734. [Google Scholar] [CrossRef]
- Jadach, S.; Was, Z.; Decker, R.; Kuhn, J.H. The tau decay library TAUOLA: Version 2.4. Comput. Phys. Commun. 1993, 76, 361–380. [Google Scholar] [CrossRef]
- Chrzaszcz, M.; Przedzinski, T.; Was, Z.; Zaremba, J. TAUOLA of τ lepton decays—Framework for hadronic currents, matrix elements and anomalous decays. Comput. Phys. Commun. 2018, 232, 220–236. [Google Scholar] [CrossRef]
- Barberio, E.; Was, Z. PHOTOS: A Universal Monte Carlo for QED radiative corrections. Version 2.0. Comput. Phys. Commun. 1994, 79, 291–308. [Google Scholar] [CrossRef]
- Davidson, N.; Przedzinski, T.; Was, Z. PHOTOS interface in C++: Technical and Physics Documentation. Comput. Phys. Commun. 2016, 199, 86–101. [Google Scholar] [CrossRef]
- Brandt, S.; Peyrou, C.; Sosnowski, R.; Wroblewski, A. The Principal axis of jets. An Attempt to analyze high-energy collisions as two-body processes. Phys. Lett. 1964, 12, 57–61. [Google Scholar] [CrossRef]
- Farhi, E. A QCD Test for Jets. Phys. Rev. Lett. 1977, 39, 1587–1588. [Google Scholar] [CrossRef]
- Antropov, S.; Banerjee, S.; Was, Z.; Zaremba, J. TAUOLA update for decay channels with e+e- pairs in the final state. arXiv 2019, arXiv:1912.11376. [Google Scholar]
- Banerjee, S.; Biswas, D.; Przedzinski, T.; Was, Z. Monte Carlo Event Generator updates, for τ pair events at Belle II energies. In Proceedings of the 16th International Workshop on Tau Lepton Physics, Bloomington, IN, USA, 27 September–1 October 2021. [Google Scholar]
- Fabre, M. The Dimuon Mass Resolution of the L3 Experiment and its Dependence on the Muon Spectrometer Alignment. Ph.D. Thesis, ETH, Zurich, Switzerland, 1992. [Google Scholar]
- Aubert, B.; et al. [BABAR collaboration] Searches for Lepton Flavor Violation in the Decays τ+→e+γ and τ+→μ+γ. Phys. Rev. Lett. 2010, 104, 021802. [Google Scholar] [CrossRef]
- Abdesselam, A.; et al. [Belle collaboration] Search for lepton-flavor-violating tau-lepton decays to ℓγ at Belle. J. High Energy Phys. 2021, 10, 19. [Google Scholar] [CrossRef]
- Hayasaka, K.; et al. [Belle collaboration] New Search for τ→μγ and τ→eγ Decays at Belle. Phys. Lett. B 2008, 666, 16–22. [Google Scholar] [CrossRef]
- Miyazaki, Y.; et al. [Belle collaboration] Search for Lepton-Flavor-Violating tau Decays into a Lepton and a Vector Meson. Phys. Lett. B 2011, 699, 251–257. [Google Scholar] [CrossRef]
- Miyazaki, Y.; et al. [Belle collaboration] Search for Lepton-Flavor-Violating tau Decays into Lepton and f0(980) Meson. Phys. Lett. B 2009, 672, 317–322. [Google Scholar] [CrossRef]
- Fox, G.C.; Wolfram, S. Observables for the Analysis of Event Shapes in e+e- Annihilation and Other Processes. Phys. Rev. Lett. 1978, 41, 1581. [Google Scholar] [CrossRef]
- Zyla P.A.; et al. [PDG collaboration] Review of Particle Physics. Prog. Theor. Exp. Phys. 2020, 2020, 083C01. [Google Scholar] [CrossRef]
- Lees, J.P.; et al. [BABAR collaboration] Limits on tau Lepton-Flavor Violating Decays in three charged leptons. Phys. Rev. D 2010, 81, 111101. [Google Scholar] [CrossRef]
- Miyazaki, Y.; et al. [Belle collaboration] Search for lepton flavor violating tau- decays into ℓ-η, ℓ-η′ and ℓ-π0. Phys. Lett. B 2007, 648, 341–350. [Google Scholar] [CrossRef]
- Hayasaka, K.; et al. [Belle collaboration] Search for Lepton Flavor Violating Tau Decays into Three Leptons with 719 Million Produced τ+τ- Pairs. Phys. Lett. B 2010, 687, 139–143. [Google Scholar] [CrossRef] [Green Version]
- Helene, O. Upper Limit of Peak Area. Nucl. Instrum. Meth. 1983, 212, 319. [Google Scholar] [CrossRef]
- Narsky, I.V. Estimation of upper limits using a Poisson statistic. Nucl. Instrum. Meth. A 2000, 450, 444–455. [Google Scholar] [CrossRef]
- Feldman, G.J.; Cousins, R.D. A Unified approach to the classical statistical analysis of small signals. Phys. Rev. D 1998, 57, 3873–3889. [Google Scholar] [CrossRef]
- Cousins, R.D.; Highland, V.L. Incorporating systematic uncertainties into an upper limit. Nucl. Instrum. Meth. A 1992, 320, 331–335. [Google Scholar] [CrossRef]
- Conrad, J.; Botner, O.; Hallgren, A.; Perez de los Heros, C. Including systematic uncertainties in confidence interval construction for Poisson statistics. Phys. Rev. D 2003, 67, 012002. [Google Scholar] [CrossRef]
- Junk, T. Confidence level computation for combining searches with small statistics. Nucl. Instrum. Meth. A 1999, 434, 435–443. [Google Scholar] [CrossRef]
- Read, A.L. Presentation of search results: The CL(s) technique. J. Phys. G 2002, 28, 2693–2704. [Google Scholar] [CrossRef]
- Cowan, G.; Cranmer, K.; Gross, E.; Vitells, O. Asymptotic formulae for likelihood-based tests of new physics. Eur. Phys. J. C 2013, 71, 1554, Erratum in Eur. Phys. J. C. 2013, 73, 2501. [Google Scholar] [CrossRef]
- Neyman, J. Outline of a Theory of Statistical Estimation Based on the Classical Theory of Probability. Phil. Trans. Roy. Soc. Lond. A 1937, 236, 333–380. [Google Scholar] [CrossRef]
- Moneta, L.; Belasco, K.; Cranmer, K.S.; Kreiss, S.; Lazzaro, A.; Piparo, D.; Schott, G.; Verkerke, W.; Wolf, M. The RooStats Project. PoS 2010, ACAT2010, 057. [Google Scholar] [CrossRef] [Green Version]
- Cranmer, K.; Lewis, G.; Moneta, L.; Shibata, A.; Verkerke, W. HistFactory: A Tool for Creating Statistical Models for Use with RooFit and RooStats 2012. CERN-OPEN-2012-016. Available online: https://inspirehep.net/literature/1236448 (accessed on 17 August 2022).
- Cranmer, K.; Kraml, S.; Prosper, H.B.; Bechtle, P.; Bernlochner, F.U.; Bloch, I.M.; Canonero, E.; Chrzaszcz, M.; Coccaro, A.; Conrad, J.; et al. Publishing statistical models: Getting the most out of particle physics experiments. SciPost Phys. 2022, 12, 037. [Google Scholar] [CrossRef]
- Caldwell, A.; Kollar, D.; Kroninger, K. BAT: The Bayesian Analysis Toolkit. Comput. Phys. Commun. 2009, 180, 2197–2209. [Google Scholar] [CrossRef]
- Amhis, Y.S.; et al. [HFLAV collaboration] Averages of b-hadron, c-hadron, and τ-lepton properties as of 2018. Eur. Phys. J. C 2021, 81, 226. [Google Scholar] [CrossRef]
- Raidal, M.; Van der Schaaf, A.; Bigi, I.; Mangano, M.L.; Semertzidis, Y.K.; Abel, S.; Albino, S.; Antusch, S.; Arganda, E.; Bajc, B.; et al. Flavour physics of leptons and dipole moments. Eur. Phys. J. C 2008, 57, 13–182. [Google Scholar] [CrossRef]
- Edwards, K.W.; et al. [CLEO collaboration] Search for neutrinoless tau decays: τ→eγ and τ→μγ. Phys. Rev. D 1997, 55, 3919–3923. [Google Scholar] [CrossRef]
- Ahmed, S.; et al. [CLEO collaboration] Update of the search for the neutrinoless decay tau —> muon gamma. Phys. Rev. D 2000, 61, 071101. [Google Scholar] [CrossRef]
- Aubert, B.; et al. [BABAR collaboration] Search for Lepton Flavor Violating Decays τ±→ℓ±π0, ℓ±η, ℓ±η′. Phys. Rev. Lett. 2007, 98, 061803. [Google Scholar] [CrossRef] [PubMed]
- Bonvicini, G.; et al. [CLEO collaboration] Search for neutrinoless tau decays involving pi0 or eta mesons. Phys. Rev. Lett. 1997, 79, 1221–1224. [Google Scholar] [CrossRef]
- Miyazaki, Y.; et al. [Belle collaboration] Search for Lepton Flavor Violating tau- Decays into ℓ-KS0 and ℓ-KS0KS0. Phys. Lett. B 2010, 692, 4–9. [Google Scholar] [CrossRef]
- Aubert, B.; et al. [BABAR collaboration] Search for Lepton Flavor Violating Decays τ-→ℓ-KS0 with the BABAR Experiment. Phys. Rev. D 2009, 79, 012004. [Google Scholar] [CrossRef] [Green Version]
- Chen, S.; et al. [CLEO collaboration] Search for neutrinoless tau decays involving the K0(S) meson. Phys. Rev. D 2002, 66, 071101. [Google Scholar] [CrossRef]
- Aubert, B.; et al. [BABAR collaboration] Improved limits on lepton flavor violating tau decays to ℓ- ϕ, ℓ- ρ, ℓ- K*0 and ℓ- K¯*0. Phys. Rev. Lett. 2009, 103, 021801. [Google Scholar] [CrossRef]
- Bliss, D.W.; et al. [CLEO collaboration] New limits for neutrinoless tau decays. Phys. Rev. D 1998, 57, 5903–5907. [Google Scholar] [CrossRef]
- Aubert, B.; et al. [BABAR collaboration] Search for lepton flavor violating decays τ±→ℓ±ω(ℓ=e,μ). Phys. Rev. Lett. 2008, 100, 071802. [Google Scholar] [CrossRef]
- Aaij, R.; et al. [LHCb collaboration] Search for the lepton flavour violating decay τ- → μ- μ+μ-. J. High Energy Phys. 2015, 2, 121. [Google Scholar] [CrossRef]
- Sirunyan, A.M.; et al. [CMS collaboration] Search for the lepton flavor violating decay τ→ 3μ in proton-proton collisions at s= 13 TeV. J. High Energy Phys. 2021, 1, 163. [Google Scholar] [CrossRef]
- Aad, G.; et al. [ATLAS collaboration] Probing lepton flavour violation via neutrinoless τ→3μ decays with the ATLAS detector. Eur. Phys. J. C 2016, 76, 232. [Google Scholar] [CrossRef] [PubMed]
- Miyazaki, Y.; et al. [Belle collaboration] Search for Lepton-Flavor-Violating and Lepton-Number-Violating τ→ℓhh′ Decay Modes. Phys. Lett. B 2013, 719, 346–353. [Google Scholar] [CrossRef]
- Aubert, B.; et al. [BABAR collaboration] Search for lepton-flavor and lepton-number violation in the decay τ-→ℓ∓h±h′-. Phys. Rev. Lett. 2005, 95, 191801. [Google Scholar] [CrossRef]
- Miyazaki, Y.; et al. [Belle collaboration] Search for lepton and baryon number violating τ- decays into Λ¯π- and Λπ-. Phys. Lett. B 2006, 632, 51–57. [Google Scholar] [CrossRef] [Green Version]
- Sahoo, D.; et al. [Belle collaboration] Search for lepton-number- and baryon-number-violating tau decays at Belle. Phys. Rev. D 2020, 102, 111101. [Google Scholar] [CrossRef]
- Banerjee, S.; Roney, J.M. Snowmass 2021 White Paper on Upgrading SuperKEKB with a Polarized Electron Beam: Discovery Potential and Proposed Implementation. arXiv 2022, arXiv:2205.12847. [Google Scholar]
- Hitlin, D.G.; et al. [SuperB collaboration] New Physics at the Super Flavor Factory. In Proceedings of the 6th superB Workshop, Valencia, Spain, 7–15 January 2008. [Google Scholar]
- Matsuzaki, A.; Sanda, A.I. Analysis of lepton flavor violating τ±→μ±μ±μ∓ decays. Phys. Rev. D 2008, 77, 073003. [Google Scholar] [CrossRef]
- Dassinger, B.M.; Feldmann, T.; Mannel, T.; Turczyk, S. Model-independent analysis of lepton flavour violating tau decays. newblock J. High Energy Phys. 2007, 10, 039. [Google Scholar] [CrossRef]
- Hayes, K.G.; et al. [Mark II collaboration] Experimental Upper Limits on Branching Fractions for Unexpected Decay Modes of the Tau Lepton. Phys. Rev. D 1982, 25, 2869. [Google Scholar] [CrossRef]
- Albrecht, H.; et al. [ARGUS collaboration] Search for neutrinoless tau decays. Z. Phys. C 1992, 55, 179–190. [Google Scholar]
- Bean, A.; et al. [CLEO collaboration] A Search for τ-→γμ-: A Test of lepton number conservation. Phys. Rev. Lett. 1993, 70, 138–142. [Google Scholar] [CrossRef]
- Abreu, P.; et al. [DELPHI collaboration] Upper limits on the branching ratios τ→μγ and τ→eγ. Phys. Lett. B 1995, 359, 411–421. [Google Scholar] [CrossRef]
- Abe, K.; et al. [Belle collaboration] An Upper bound on the decay τ→μγ from Belle. Phys. Rev. Lett. 2004, 92, 171802. [Google Scholar] [CrossRef]
- Aubert, B.; et al. [BABAR collaboration] Search for lepton flavor violation in the decay τ→μγ. Phys. Rev. Lett. 2005, 95, 041802. [Google Scholar] [CrossRef]
- Bowcock, T.J.V.; et al. [CLEO collaboration] Search for Neutrinoless Decays of the τ Lepton. Phys. Rev. D 1990, 41, 805. [Google Scholar] [CrossRef]
- Bartelt, J.E.; et al. [CLEO collaboration] Search for neutrinoless decays of the tau lepton. Phys. Rev. Lett. 1994, 73, 1890–1894. [Google Scholar] [CrossRef]
- Yusa, Y.; et al. [Belle collaboration] Search for neutrinoless decays τ→ 3l. Phys. Lett. B 2004, 589, 103–110. [Google Scholar] [CrossRef]
- Aubert, B.; et al. [BABAR collaboration] Search for lepton flavor violation in the decay τ-→ℓ-ℓ+ℓ-. Phys. Rev. Lett. 2004, 92, 121801. [Google Scholar] [CrossRef]
- Aubert, B.; et al. [BABAR collaboration] Improved limits on the lepton-flavor violating decays τ-→ℓ-ℓ+ℓ-. Phys. Rev. Lett. 2007, 99, 251803. [Google Scholar] [CrossRef]
- Miyazaki, Y.; et al. [Belle collaboration] Search for Lepton Flavor Violating tau Decays into Three Leptons. Phys. Lett. B 2008, 660, 154–160. [Google Scholar] [CrossRef]
- Husek, T.; Monsalvez-Pozo, K.; Portoles, J. Lepton-flavour violation in hadronic tau decays and μ-τ conversion in nuclei. JHEP 2021, 1, 059. [Google Scholar] [CrossRef]
- Cirigliano, V.; Fuyuto, K.; Lee, C.; Mereghetti, E.; Yan, B. Charged Lepton Flavor Violation at the EIC. J. High Energy Phys. 2021, 3, 256. [Google Scholar] [CrossRef]
- Banerjee, S.; Cirigliano, V.; Dam, M.; Deshpande, A.; Fiorini, L.; Fuyuto, K.; Gal, C.; Husek, T.; Mereghetti, E.; Monsálvez-Pozo, K.; et al. Snowmass 2021 White Paper: Charged lepton flavor violation in the tau sector. arXiv 2022, arXiv:2203.14919. [Google Scholar]
Figure 1.
Schematic view of the Belle II detector [47]. The self-annotated figure is based on overview available from SuperKEKB/Belle II public page: https://www.belle2.org/project/super_kekb_and_belle_ii (accessed on 11 April 2022). Picture copyright and credit: KEK.
Figure 1.
Schematic view of the Belle II detector [47]. The self-annotated figure is based on overview available from SuperKEKB/Belle II public page: https://www.belle2.org/project/super_kekb_and_belle_ii (accessed on 11 April 2022). Picture copyright and credit: KEK.

Figure 2.
Invariant mass (left), without vertex constraint (middle) and with vertex constraint (right) obtained from simulated samples during analysis strategy development studies for search at the BABAR experiment [69].
Figure 2.
Invariant mass (left), without vertex constraint (middle) and with vertex constraint (right) obtained from simulated samples during analysis strategy development studies for search at the BABAR experiment [69].

Figure 3.
Two-dimensional distributions of versus for Belle searches [70] for (left) and (right) decays. Black points are data, blue squares are signal MC events, and magenta ellipses show the signal region ( region). This figure has been reprinted with permission from Ref. [70].

Figure 4.
Two-dimensional distributions in the vs. plane for the BABAR searches [69] for (left) and (right) decays. Data are shown as dots and contours containing 90% (50%) of signal MC events are shown as light-yellow (dark-green) shaded regions, along with the contours shown as black ellipses. This figure has been reprinted with permission from Ref. [69].

Figure 5.
Two-dimensional distributions for , QED, and background processes in the plane obtained from simulated samples during analysis strategy development studies for search at the BABAR experiment [76]. Rectangular box-shaped regions mostly populated by the signal processes are shown in red.
Figure 5.
Two-dimensional distributions for , QED, and background processes in the plane obtained from simulated samples during analysis strategy development studies for search at the BABAR experiment [76]. Rectangular box-shaped regions mostly populated by the signal processes are shown in red.

Figure 6.
Current status of observed upper limits at CLEO, BABAR, Belle, ATLAS, CMS, and LHCb experiments [92] and projections of expected upper limits at the Belle II experiment [40].

Figure 7.
Distribution of the cosine of the signal-side muon multiplied by the muon charge for signal and background events with and without electron beam polarization in the search analysis [112].
Figure 7.
Distribution of the cosine of the signal-side muon multiplied by the muon charge for signal and background events with and without electron beam polarization in the search analysis [112].

Figure 8.
Evolution of experimental bounds on [69,70,71,94,95,115,116,117,118,119,120] (left) and [36,76,78,102,104,105,106,115,116,121,122,123,124,125,126] decays, future prospects at Belle II [40] and some predictions from Table 1.


Table 1.
The branching fractions () for and decays in some NP models.
| SM + seesaw [6] | ||
| SUSY + Higgs [9,10] | ||
| SUSY + SO(10) [11,13] | ||
| Non-universal Z [17] |
Table 2.
Number of neutrinos in the event for signal and background processes.
| # of ’s | LFV Decays | Generic -Pair | Other Backgrounds |
|---|---|---|---|
| Signal-side | 0 | 1–2 | 0 |
| Tag-side | 1–2 | 1–2 | 0 |
Table 3.
at different center-of-mass energies corresponding to data-taking at the B-Factories.
| —off | |||
| —off | |||
| —off | |||
| —off | |||
| —off |
| 1c | Observed Limits | Expected Limits | ||||
|---|---|---|---|---|---|---|
| Experiment | Luminosity | UL (obs) | Experiment | Luminosity | UL (exp) | |
| Belle [70] | 988 | 5.6 | Belle II [40] | 50 | 9.0 | |
| BABAR [69] | 516 | 3.3 | ||||
| CLEO [94] | 4.68 | 2.7 | ||||
| Belle [70] | 988 | 4.2 | Belle II [40] | 50 | 6.9 | |
| BABAR [69] | 516 | 4.4 | ||||
| CLEO [95] | 13.8 | 1.1 | ||||
| Belle [77] | 401 | 8.0 | Belle II [40] | 50 | 7.3 | |
| BABAR [96] | 339 | 1.3 | ||||
| CLEO [97] | 4.68 | 3.7 | ||||
| Belle [77] | 401 | 1.2 | Belle II [40] | 50 | 7.1 | |
| BABAR [96] | 339 | 1.1 | ||||
| CLEO [97] | 4.68 | 4.0 | ||||
| Belle [98] | 671 | 2.6 | Belle II [40] | 50 | 4.0 | |
| BABAR [99] | 469 | 3.3 | ||||
| CLEO [100] | 13.9 | 9.1 | ||||
| Belle [98] | 671 | 2.3 | Belle II [40] | 50 | 4.0 | |
| BABAR [99] | 469 | 4.0 | ||||
| CLEO [100] | 13.9 | 9.5 | ||||
| Belle [77] | 401 | 9.2 | Belle II [40] | 50 | 1.2 | |
| BABAR [96] | 339 | 1.6 | ||||
| CLEO [97] | 4.68 | 8.2 | ||||
| Belle [77] | 401 | 6.5 | Belle II [40] | 50 | 8.0 | |
| BABAR [96] | 339 | 1.5 | ||||
| CLEO [97] | 4.68 | 9.6 | ||||
| Experiment | Luminosity | UL (obs) | Experiment | Luminosity | UL (exp) | |
| Belle [77] | 401 | 1.6 | Belle II [40] | 50 | 1.2 | |
| BABAR [96] | 339 | 2.4 | ||||
| Belle [77] | 401 | 1.3 | Belle II [40] | 50 | 1.2 | |
| BABAR [96] | 339 | 1.4 | ||||
| Belle [73] | 671 | 6.8 | Belle II [40] | 50 | 9.5 | |
| Belle [73] | 671 | 6.4 | Belle II [40] | 50 | 9.1 | |
| Belle [72] | 854 | 1.8 | Belle II [40] | 50 | 3.8 | |
| BABAR [101] | 451 | 4.6 | ||||
| CLEO [102] | 4.79 | 2.0 | ||||
| Belle [72] | 854 | 1.2 | Belle II [40] | 50 | 5.5 | |
| BABAR [101] | 451 | 2.6 | ||||
| CLEO [102] | 4.79 | 6.3 | ||||
| Belle [72] | 854 | 4.8 | Belle II [40] | 50 | 1.0 | |
| BABAR [103] | 384 | 1.1 | ||||
| Belle [72] | 854 | 4.7 | Belle II [40] | 50 | 1.4 | |
| BABAR [103] | 384 | 1.0 | ||||
| Belle [72] | 854 | 3.2 | Belle II [40] | 50 | 6.7 | |
| BABAR [101] | 451 | 5.9 | ||||
| CLEO [102] | 4.79 | 5.1 | ||||
| Belle [72] | 854 | 7.2 | Belle II [40] | 50 | 9.3 | |
| BABAR [101] | 451 | 1.7 | ||||
| CLEO [102] | 4.79 | 7.5 | ||||
| Belle [72] | 854 | 3.4 | Belle II [40] | 50 | 6.2 | |
| BABAR [101] | 451 | 4.6 | ||||
| CLEO [102] | 4.79 | 7.4 | ||||
| Belle [72] | 854 | 7.0 | Belle II [40] | 50 | 8.5 | |
| BABAR [101] | 451 | 7.3 | ||||
| CLEO [102] | 4.79 | 7.5 | ||||
| Belle [72] | 854 | 3.1 | Belle II [40] | 50 | 7.4 | |
| BABAR [101] | 451 | 3.1 | ||||
| CLEO [102] | 4.79 | 6.9 | ||||
| Belle [72] | 854 | 8.4 | Belle II [40] | 50 | 8.4 | |
| BABAR [101] | 451 | 1.9 | ||||
| CLEO [102] | 4.79 | 7.0 | ||||
| Belle [78] | 782 | 2.7 | Belle II [40] | 50 | 4.7 | |
| BABAR [76] | 468 | 2.9 | ||||
| CLEO [102] | 4.79 | 2.9 | ||||
| Belle [78] | 782 | 1.8 | Belle II [40] | 50 | 2.9 | |
| BABAR [76] | 468 | 2.2 | ||||
| CLEO [102] | 4.79 | 1.7 | ||||
| Belle [78] | 782 | 2.7 | Belle II [40] | 50 | 4.5 | |
| BABAR [76] | 468 | 3.2 | ||||
| CLEO [102] | 4.79 | 1.8 | ||||
| Experiment | Luminosity | UL (obs) | Experiment | Luminosity | UL (exp) | |
| Belle [78] | 782 | 2.1 | Belle II [40] | 50 | 3.6 | |
| BABAR [76] | 468 | 3.3 | ||||
| LHCb [104] | 3 | 4.6 | ||||
| CMS [105] | 33 | 8.0 | ||||
| ATLAS [106] | 20 | 3.8 | ||||
| CLEO [102] | 4.79 | 1.9 | ||||
| Belle [78] | 782 | 1.7 | Belle II [40] | 50 | 2.6 | |
| BABAR [76] | 468 | 2.6 | ||||
| CLEO [102] | 4.79 | 1.5 | ||||
| Belle [78] | 782 | 1.5 | Belle II [40] | 50 | 2.3 | |
| BABAR [76] | 468 | 1.8 | ||||
| CLEO [102] | 4.79 | 1.5 | ||||
| Belle [107] | 854 | 2.3 | Belle II [40] | 50 | 5.8 | |
| BABAR [108] | 221 | 1.2 | ||||
| CLEO [102] | 4.79 | 2.2 | ||||
| Belle [107] | 854 | 2.1 | Belle II [40] | 50 | 5.6 | |
| BABAR [108] | 221 | 2.9 | ||||
| CLEO [102] | 4.79 | 8.2 | ||||
| Belle [107] | 854 | 3.7 | Belle II [40] | 50 | 7.1 | |
| BABAR [108] | 221 | 3.2 | ||||
| CLEO [102] | 4.79 | 6.4 | ||||
| Belle [107] | 854 | 8.6 | Belle II [40] | 50 | 1.2 | |
| BABAR [108] | 221 | 2.6 | ||||
| CLEO [102] | 4.79 | 7.5 | ||||
| Belle [107] | 854 | 3.1 | Belle II [40] | 50 | 7.8 | |
| BABAR [108] | 221 | 1.7 | ||||
| CLEO [102] | 4.79 | 3.8 | ||||
| Belle [107] | 854 | 4.5 | Belle II [40] | 50 | 1.2 | |
| BABAR [108] | 221 | 3.2 | ||||
| CLEO [102] | 4.79 | 7.4 | ||||
| Belle [107] | 854 | 3.4 | Belle II [40] | 50 | 6.5 | |
| BABAR [108] | 221 | 1.4 | ||||
| CLEO [102] | 4.79 | 6.0 | ||||
| Belle [107] | 854 | 4.4 | Belle II [40] | 50 | 1.1 | |
| BABAR [108] | 221 | 2.5 | ||||
| CLEO [102] | 4.79 | 1.5 | ||||
| Belle [98] | 671 | 7.1 | Belle II [40] | 50 | 9.7 | |
| CLEO [100] | 13.9 | 2.2 | ||||
| Belle [98] | 671 | 8.0 | Belle II [40] | 50 | 1.1 | |
| CLEO [100] | 13.9 | 3.4 | ||||
| Belle [107] | 854 | 2.0 | Belle II [40] | 50 | 4.6 | |
| BABAR [108] | 221 | 2.7 | ||||
| CLEO [102] | 4.79 | 1.9 | ||||
| Belle [107] | 854 | 3.9 | Belle II [40] | 50 | 4.5 | |
| BABAR [108] | 221 | 7.0 | ||||
| CLEO [102] | 4.79 | 3.4 | ||||
| Experiment | Luminosity | UL (obs) | Experiment | Luminosity | UL (exp) | |
| Belle [107] | 854 | 3.2 | Belle II [40] | 50 | 7.7 | |
| BABAR [108] | 221 | 1.8 | ||||
| CLEO [102] | 4.79 | 2.1 | ||||
| Belle [107] | 854 | 4.8 | Belle II [40] | 50 | 1.2 | |
| BABAR [108] | 221 | 2.2 | ||||
| CLEO [102] | 4.79 | 7.0 | ||||
| Belle [107] | 854 | 3.3 | Belle II [40] | 50 | 5.8 | |
| BABAR [108] | 221 | 1.5 | ||||
| CLEO [102] | 4.79 | 3.8 | ||||
| Belle [107] | 854 | 4.7 | Belle II [40] | 50 | 9.7 | |
| BABAR [108] | 221 | 4.8 | ||||
| CLEO [102] | 4.79 | 6.0 | ||||
| Belle [109] | 154 | 1.4 | Belle II [40] | 50 | 5.5 | |
| Belle [109] | 154 | 7.2 | Belle II [40] | 50 | 5.4 | |
| Belle [110] | 921 | 3.0 | Belle II [40] | 50 | 4.0 | |
| Belle [110] | 921 | 2.0 | Belle II [40] | 50 | 4.4 | |
| Belle [110] | 921 | 1.8 | Belle II [40] | 50 | 4.4 | |
| Belle [110] | 921 | 1.8 | Belle II [40] | 50 | 7.4 | |
| LHCb [36] | 1 | 3.3 | ||||
| Belle [110] | 921 | 3.0 | Belle II [40] | 50 | 3.6 | |
| Belle [110] | 921 | 4.0 | Belle II [40] | 50 | 8.3 | |
| LHCb [36] | 1 | 4.4 | ||||
Publisher’s Note: MDPI stays neutral with regard to jurisdictional claims in published maps and institutional affiliations. |
© 2022 by the author. Licensee MDPI, Basel, Switzerland. This article is an open access article distributed under the terms and conditions of the Creative Commons Attribution (CC BY) license (https://creativecommons.org/licenses/by/4.0/).
Share and Cite
MDPI and ACS Style
Banerjee, S. Searches for Lepton Flavor Violation in Tau Decays at Belle II. Universe 2022, 8, 480. https://doi.org/10.3390/universe8090480
AMA Style
Banerjee S. Searches for Lepton Flavor Violation in Tau Decays at Belle II. Universe. 2022; 8(9):480. https://doi.org/10.3390/universe8090480
Chicago/Turabian StyleBanerjee, Swagato. 2022. "Searches for Lepton Flavor Violation in Tau Decays at Belle II" Universe 8, no. 9: 480. https://doi.org/10.3390/universe8090480
Note that from the first issue of 2016, this journal uses article numbers instead of page numbers. See further details here.