Growth as a function of sea ice cover, light and temperature in the arctic/subarctic coralline C. compactum: A year-long in situ experiment in the high arctic
 Jessica Gould
 Jochen Halfar2
  Justin B. Ries
- 1Department of Marine and Environmental Sciences, Northeastern University, Nahant, MA, United States
- 2Department of Chemical and Physical Sciences, University of Toronto Mississauga, Toronto, ON, Canada
- 3Department of Botany, Smithsonian National Museum of Natural History, Washington, DC, United States
Long-term, high-resolution measurements of environmental variability are sparse in the High Arctic. In the absence of such data, we turn to proxies recorded in the layered skeletons of the long-lived crustose coralline algae Clathromorphum compactum. Annual growth banding in this alga is dependent on several factors that include temperature, light availability, nutrients, salinity, and calcium carbonate saturation state. It has been observed that growth slows during winter as sunlight reaching the seafloor diminishes due to decreased insolation and the build-up of sea-ice, such that the relationship between sea-ice cover extent and algal growth has allowed for reconstructions of relative sea-ice variability through time. However, recent laboratory work has shown that C. compactum continue growing in complete darkness (sea-ice cover). Therefore, a more complete understanding of algal growth is necessary for the refinement of the sea-ice proxy. Here, we present the results of a ~year-long in-situ growth and environmental monitoring experiment in Arctic Bay, Nunavut, Canada (~73°N) which addresses, for the first time in situ, the gaps in our understanding of growth over an annual cycle in the High Arctic. Algal growth was assessed on a quasi-monthly basis, where specimens were subsampled to quantify monthly extension in the context of ocean temperature and light availability. By measuring extension rate through time, we observed that the algae grew on average 72 µm yr-1, with ~54% of annual growth occurring during the sea-ice free summer months (June-September), ~25% during the winter months (November-April), and ~21% occurring during the transition months of May and October. Although winter growth slowed, we did not observe a consistent cessation of linear extension during low-or no-light months. We posit that substantial growth during the winter months at this latitude is most likely a consequence of the mobilization of stored energy (photosynthate) produced during the photosynthetically active summer months. However, we also discuss the possibility of low light-photosynthetic activity and/or dark carbon fixation, which could also facilitate extension through time. Overall, the novel growth model presented here has implications for the use of C. compactum growth for reconstructing the environment as well as for trace-element-based (typically Mg/Ca) algal chronologies.
1 Introduction
Comprehensive long-term records of environmental variability are necessary for contextualizing present and future oceanic change. However, for most of the Arctic Ocean significant paleorecords are sparse. Over the last few decades, the Arctic Ocean environment has been changing at an alarming rate, in large part due to anthropogenic disturbances contributing to a loss of sea-ice extent, a shortening of the sea-ice season, and a general warming of the ocean in many regions (e.g., Kinnard et al., 2011; Stroeve et al., 2012; Comiso et al., 2017; Stroeve and Notz, 2018; Schweiger et al., 2019; Cai et al., 2021). Among the rapidly changing parameters in this region, we know little about the long-term and fine-scale dynamics of sea-ice and ocean temperature. Beyond terrestrial climate archives (tree rings and ice cores), most of the available historical data for this region come from satellite sensors only available for the 1970s and onwards (Polyak et al., 2010), and from marine sediment cores (e.g. IP25 biomarkers; Belt et al., 2007) typically archiving data at hundreds- to thousands-years resolution (De Vernal et al., 2013), and in rarer instances at sub decadal resolution. While reconstructions of past sea-ice extent are possible using multiple proxies as listed above (Kinnard et al., 2011), the low geographic and temporal resolution of such reconstructions does not allow for a thorough evaluation of annual to sub-annual scale variability. Nonetheless, the observed declines in Arctic sea-ice and associated increases in glacial melt water over the last number of decades have the potential to significantly influence heat exchange, ocean circulation, climate patterns, organism survival, ecosystem function and even fisheries productivity – all at the global scale (e.g. Meier et al., 2014).
Fortunately, geochemical archives of ocean variability in this region exist in the layered skeletons of long-lived Arctic calcifying marine organisms called crustose coralline algae (CCA). Some genera of CCA are among the longest lived marine calcifiers in the world (living for upwards of 1800 years; Adey et al., 2015a), producing annual high-magnesium calcite layers that can be counted, dated, and chemically analyzed to reconstruct the environment over the last one or two millennia, and are found almost ubiquitously between 10 and 20m depth along the rocky coastlines of the northwestern North Atlantic and Arctic Oceans (Adey, 1966; Adey and Steneck, 2001; Adey and Hayek, 2011; Adey et al., 2013). Of particular interest in the High Arctic is the CCA species Clathromorphum compactum, which grows upwards of 60-150 µm/year in the cold, often sea-ice covered Arctic waters (Halfar et al., 2013; Adey et al., 2015a; Williams et al., 2021). The genus Clathromorphum possesses a unique method of growth and calcification, originating from a single-cell plane of growth termed the intercalary meristem (Adey, 1965; Adey et al., 2005; Adey et al., 2015b). In this intercalary meristem, growth and calcification of the thin upper photosynthetically active multilayered epithallial skeleton (Adey et al., 2015b) and the thicker lower perithallial skeleton occur simultaneously but in opposing direction (Adey et al., 2013).
Clathromorphum compactum serves as an exceptional archive of environmental variability owing to its ability to form continuously accreted, multilayered mounds (Adey et al., 2015a). A tight link between environmental conditions and skeletal growth, coupled with the protection of the archival perithallial skeleton from grazing by the epithallial skeletal layers above the meristem, often render the perithallial layers very well preserved and, as such, the bulk skeleton serves as an excellent archive. Evaluation of annual growth band thickness and Mg/Ca incorporation in the perithallial skeleton, both highly positively correlated with environmental temperature, has allowed for the reconstruction of ocean temperature through time in non-sea-ice covered regions (Halfar et al., 2000; Halfar et al., 2008; Hetzinger et al., 2009; Gamboa et al., 2010; Hetzinger et al., 2017). While grazing of the epithallial skeleton by chitons is balanced by new production, occasionally deep grazing from scraping organisms like urchins or boring by worms and clams, can disrupt yearly layering. This damage is typically local, not occurring across the entire algal surface - thus, stepwise layer analysis of adjacent layers can avoid the issue (Adey et al., 2013). In some cases, where scarring from boring organisms or diagenetic alteration of dead skeleton, which later can be recolonized, does cause unconformities in the archival record, the skeleton is rendered undatable. To mitigate the impact of boring on skeletal archives, (Adey et al., 2015a) show that sampling from bottom types that limit boring can extend both the age and the paleoenvironmental fidelity of C. compactum beyond the current 800–1800-year limit.
Experimental work in both the laboratory and field has shown growth in the genus Clathromorphum to be largely a function of light availability and temperature (Adey, 1970; Halfar et al., 2008; Williams et al., 2018; Williams et al., 2021; Westfield et al., 2022). Additionally, multiyear growth, anatomical development, and calcification rates have been investigated for wild specimens of C. compactum collected from northern Labrador, where a six to eight month sea-ice regime exists (Adey et al., 2015a). However, a complete understanding of algal growth through sea-ice-covered seasons in High Arctic regions characterized by more extensive sea-ice cover and complete darkness is lacking. Although algal growth appears to decline in winter months, several lines of evidence point to continued growth and calcification even after the onset of winter sea-ice for at least one to two months as the algae metabolize stored photosynthate (Rhodophycean starch) to continue growing (Williams et al., 2018). First, very low Mg/Ca ratios measured in algal specimens sampled from the High Arctic (Halfar et al., 2013) indicate that growth of C. compactum slows significantly in the colder winter months, owing to the decrease in sunlight reaching the seafloor (due to decreased insolation and the build-up of sea-ice and snow cover) and the decline in seawater temperatures to as low as -1.8°C, but apparently continues for some time in order to record the very low Mg/Ca signatures reflective of low seawater temperatures (Halfar et al., 2013). Second, recent work by Williams et al. (2018) observed that C. compactum continues to grow and calcify under experimental conditions of complete darkness, apparently until stored photosynthate is exhausted.
The strong relationship between year-to-year variability in annual sea-ice extent and algal growth has allowed for the reconstruction of sea-ice variability in the High Arctic through time using a combination of both skeleton growth band anomalies and Mg/Ca anomalies in this species through time (Halfar et al., 2013; Hetzinger et al., 2019; Leclerc et al., 2022a; Leclerc et al., 2022b). Leclerc et al. (2022b) for instance, find strong correlations between growth band thickness (growth anomalies) and summer sea-ice concentrations in three cross-dated specimens of C. compactum from Beechey Island, Nunavut. However, the laboratory experiment of Williams et al. (2018) also illustrates that light availability may have a large control not only on the growth and calcification of this marine alga, as previously illustrated, but also on the incorporation of Mg/Ca into the skeleton, adding uncertainty to the Mg/Ca proxy for reconstructing both seawater temperature and sea-ice extent. Therefore, a refinement of our understanding of seasonal variations in algal growth and calcification in regions of the High Arctic is necessary for finetuning of the algal sea-ice proxy.
Here, we present the results of an 11-month in situ growth monitoring experiment in Ikpiarjuk (Arctic Bay) Nunavut, Canada, to address the gaps in our understanding of C. compactum growth over an annual cycle. We develop a framework for algal growth, which has implications for the use of CCA growth banding for reconstructing sea-ice extent as well as for skeletal element-based (e.g., Mg/Ca) chronologies. These findings inform both the proxy calibration and age-modeling of these important marine archives and speak to the potential impact of environmental change on this important ecosystem engineer.
2 Materials and methods
2.1 Study site and experimental setup
The Ikpiarjuk (Arctic Bay) in-situ growth experiment commenced in September 2019 at 72°59.747’ 85°04.589’ (Figure 1). This High Arctic location was considered an ideal setting for this experimental setup due in part to the lack of deep grazing pressure on skeletal accretion owing to the much colder Arctic waters than found in other potential locations such as in the Aleutian Islands, where work by Rasher et al. (2020) observed extensive grazing on the species Clathromorphum nereostratum. Clathromorphum compactum were first identified at 15 m on the western coastline of Arctic Bay using an underwater camera survey. Alga were then collected by SCUBA using hammer and chisel. All algal colonies collected were submerged in holding tanks filled with a seawater calcein solution (5 mL 1% Western Chemical SE-MARK calcein L-1 seawater) for a period of 72 hours to mark the initiation of the experimental period. Algal colonies were then sectioned with a hammer and chisel to roughly 25-cm2-sized fragments and affixed with z-spar epoxy resin (A-788 Splash Zone 2-Part Epoxy Compound) to individual acrylic plates marked with a unique sample number. Individual algal plates were then set on larger sample plates (8 algae/plate) equipped with environmental sensors (Figure 2). A total of 80 individual algal colony fragments were re-deployed to the seafloor at the same depth they were collected (15 m) (Figure 2). Sea-ice thickness (cm) was measured across the experimental period using an auger and tape measure (Figure 8). Snow cover on the sea-ice was not well documented throughout the study and was therefore not included as a variable in this analysis, however, we acknowledge that snow-cover atop the sea-ice may have contributed to the measured declines in insolation to the seafloor observed here.
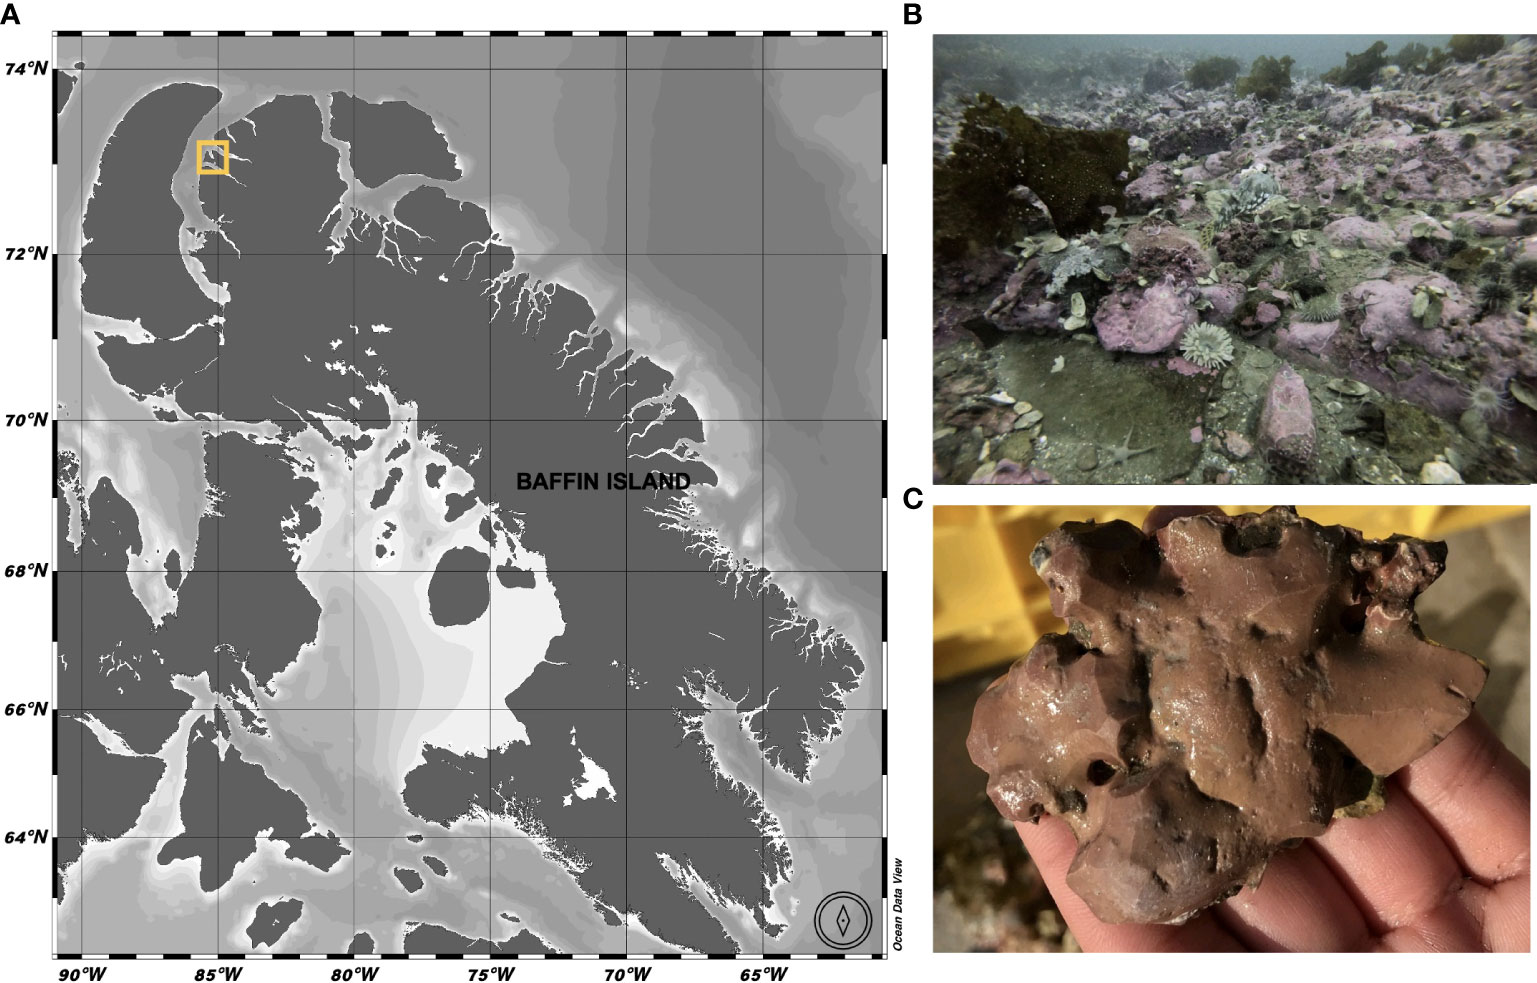
Figure 1 (A) Field sampling location in Ikpiarjuk (Arctic Bay), Nunavut, Canada (yellow square). (B) Seafloor at 72°59.747’ 85°04.589’ 15m depth, where the experimental array was deployed from September 2019 through August 2020. (C) Clathromorphum compactum specimen collected at sample site.
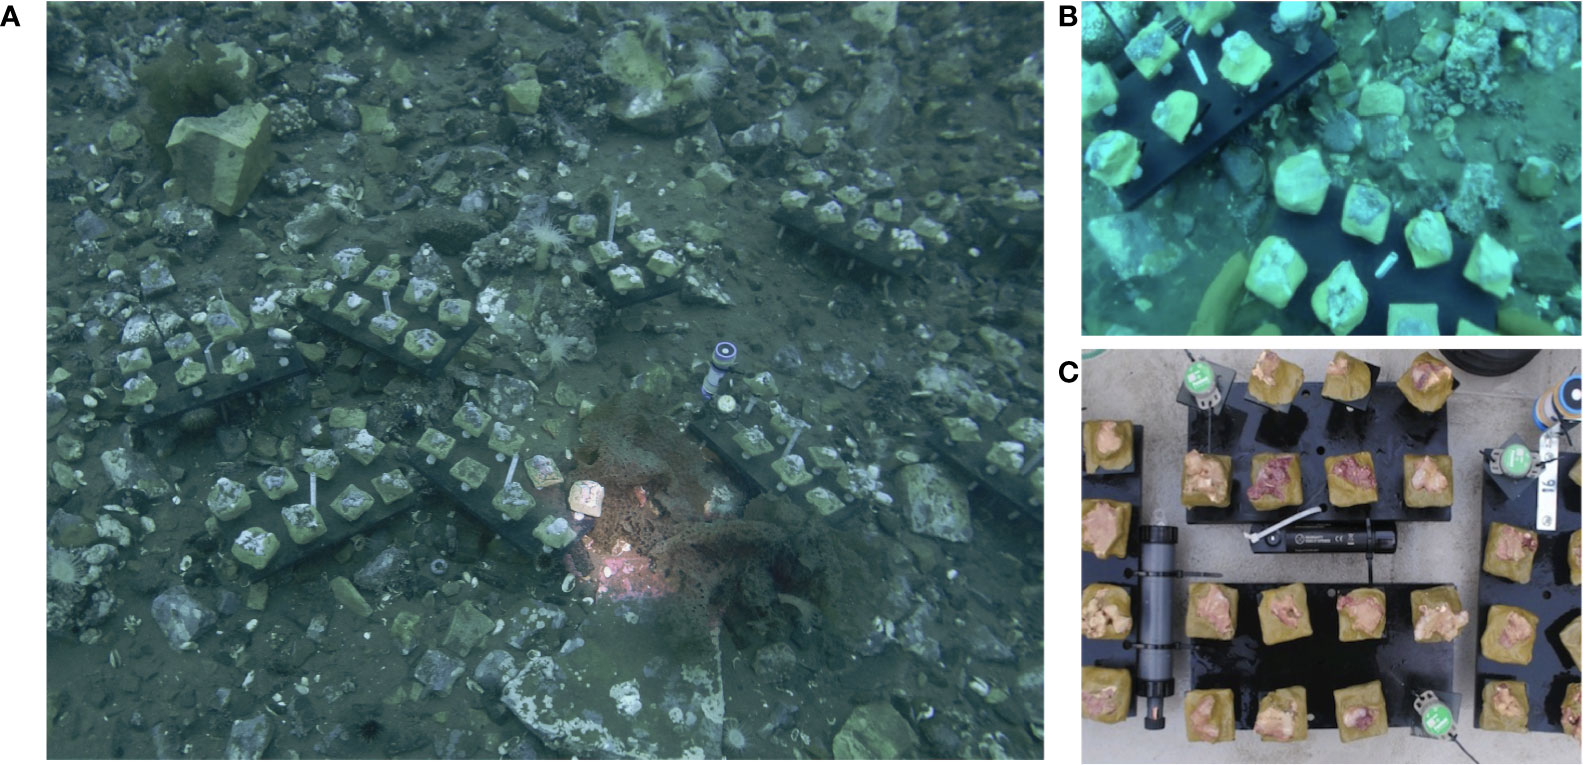
Figure 2 (A, B) Algal experimental setup on the seafloor in Arctic Bay, Nunavut, Canada. (photo credit: Eric Brossier). (C) Algal sample plates, each equipped with an ONSET HOBO Pendant MX2202 temperature/light data logger and 8 algal specimens.
2.2 Data collection
2.2.1 Algal sampling
A subsample of algae was randomly sampled from the experimental array on a quasi-monthly basis by SCUBA. At each collection time point, algae were recovered by clipping individual algal plates from the larger array and brought safely aboard the RV Vagabond, which overwintered at the study site. Once aboard, the sample ID was recorded and the algae were rinsed in ethanol and left to dry before being wrapped in paper towels for safe transit to Northeastern University’s Marine Science Center at the conclusion of the experiment. Due to technical issues, the March and September 2020 collection of algae were not possible. When possible, 8 to 10 algae were collected during each dive (see Table 1 for algal collection schedule), and a total of 68 algae were collected at the conclusion of the experiment in August 2020.
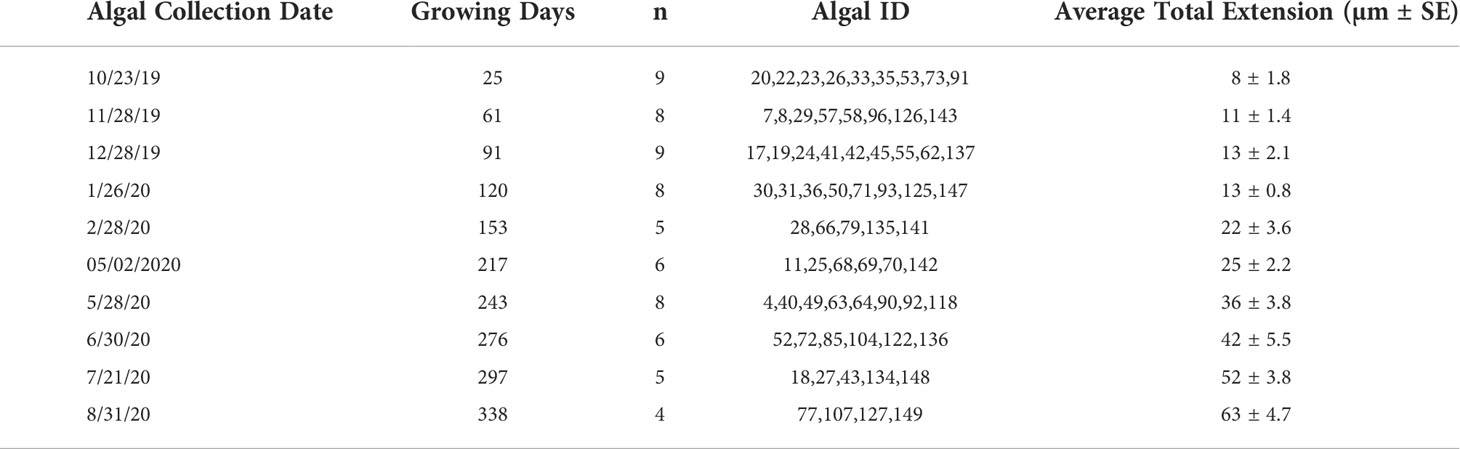
Table 1 Arctic Bay, NU C. compactum sampling schedule.
2.2.2 Environmental data
The algal experimental array was equipped with ONSET HOBO Pendant MX2202 temperature/light data loggers set to record both lux and temperature at 20-minute intervals throughout the experimental period. These loggers were affixed to the stages holding the algal specimens at the height of the algae and oriented parallel to the sea surface so that incident light would be recorded at the average depth and angle of the algae. Loggers were cleaned and data offloaded during each collection dive. Sea-ice thickness was measured across the experimental period as well using an auger and tape measure (Figure 8).
Monthly integrated incident light energy data were computed at the plane of the algae by first converting instantaneous lux measurements from the HOBO pendant loggers to photosynthetic photon flux density (PPFD, µmol photon m-2 sec-1) using the conversion factor for sunlight of 0.0185 (Apogee Instruments). Next, average hourly irradiance was computed across all days per month (Figure 3), and the area under the irradiance curve was solved for using the R package MESS (Miscellaneous Esoteric Statistical Scripts) and the function auc (area under curve) to achieve average daily light energy values for each month, which were then converted to monthly integrated energies (µmol photon m-2 month-1) by multiplying the area under the curve by the number of days in each month. Average monthly temperatures are reported in °C and were computed using the 20-minute logged temperature averages from the deployed HOBO pendant loggers (Figure 4 and Table 2).
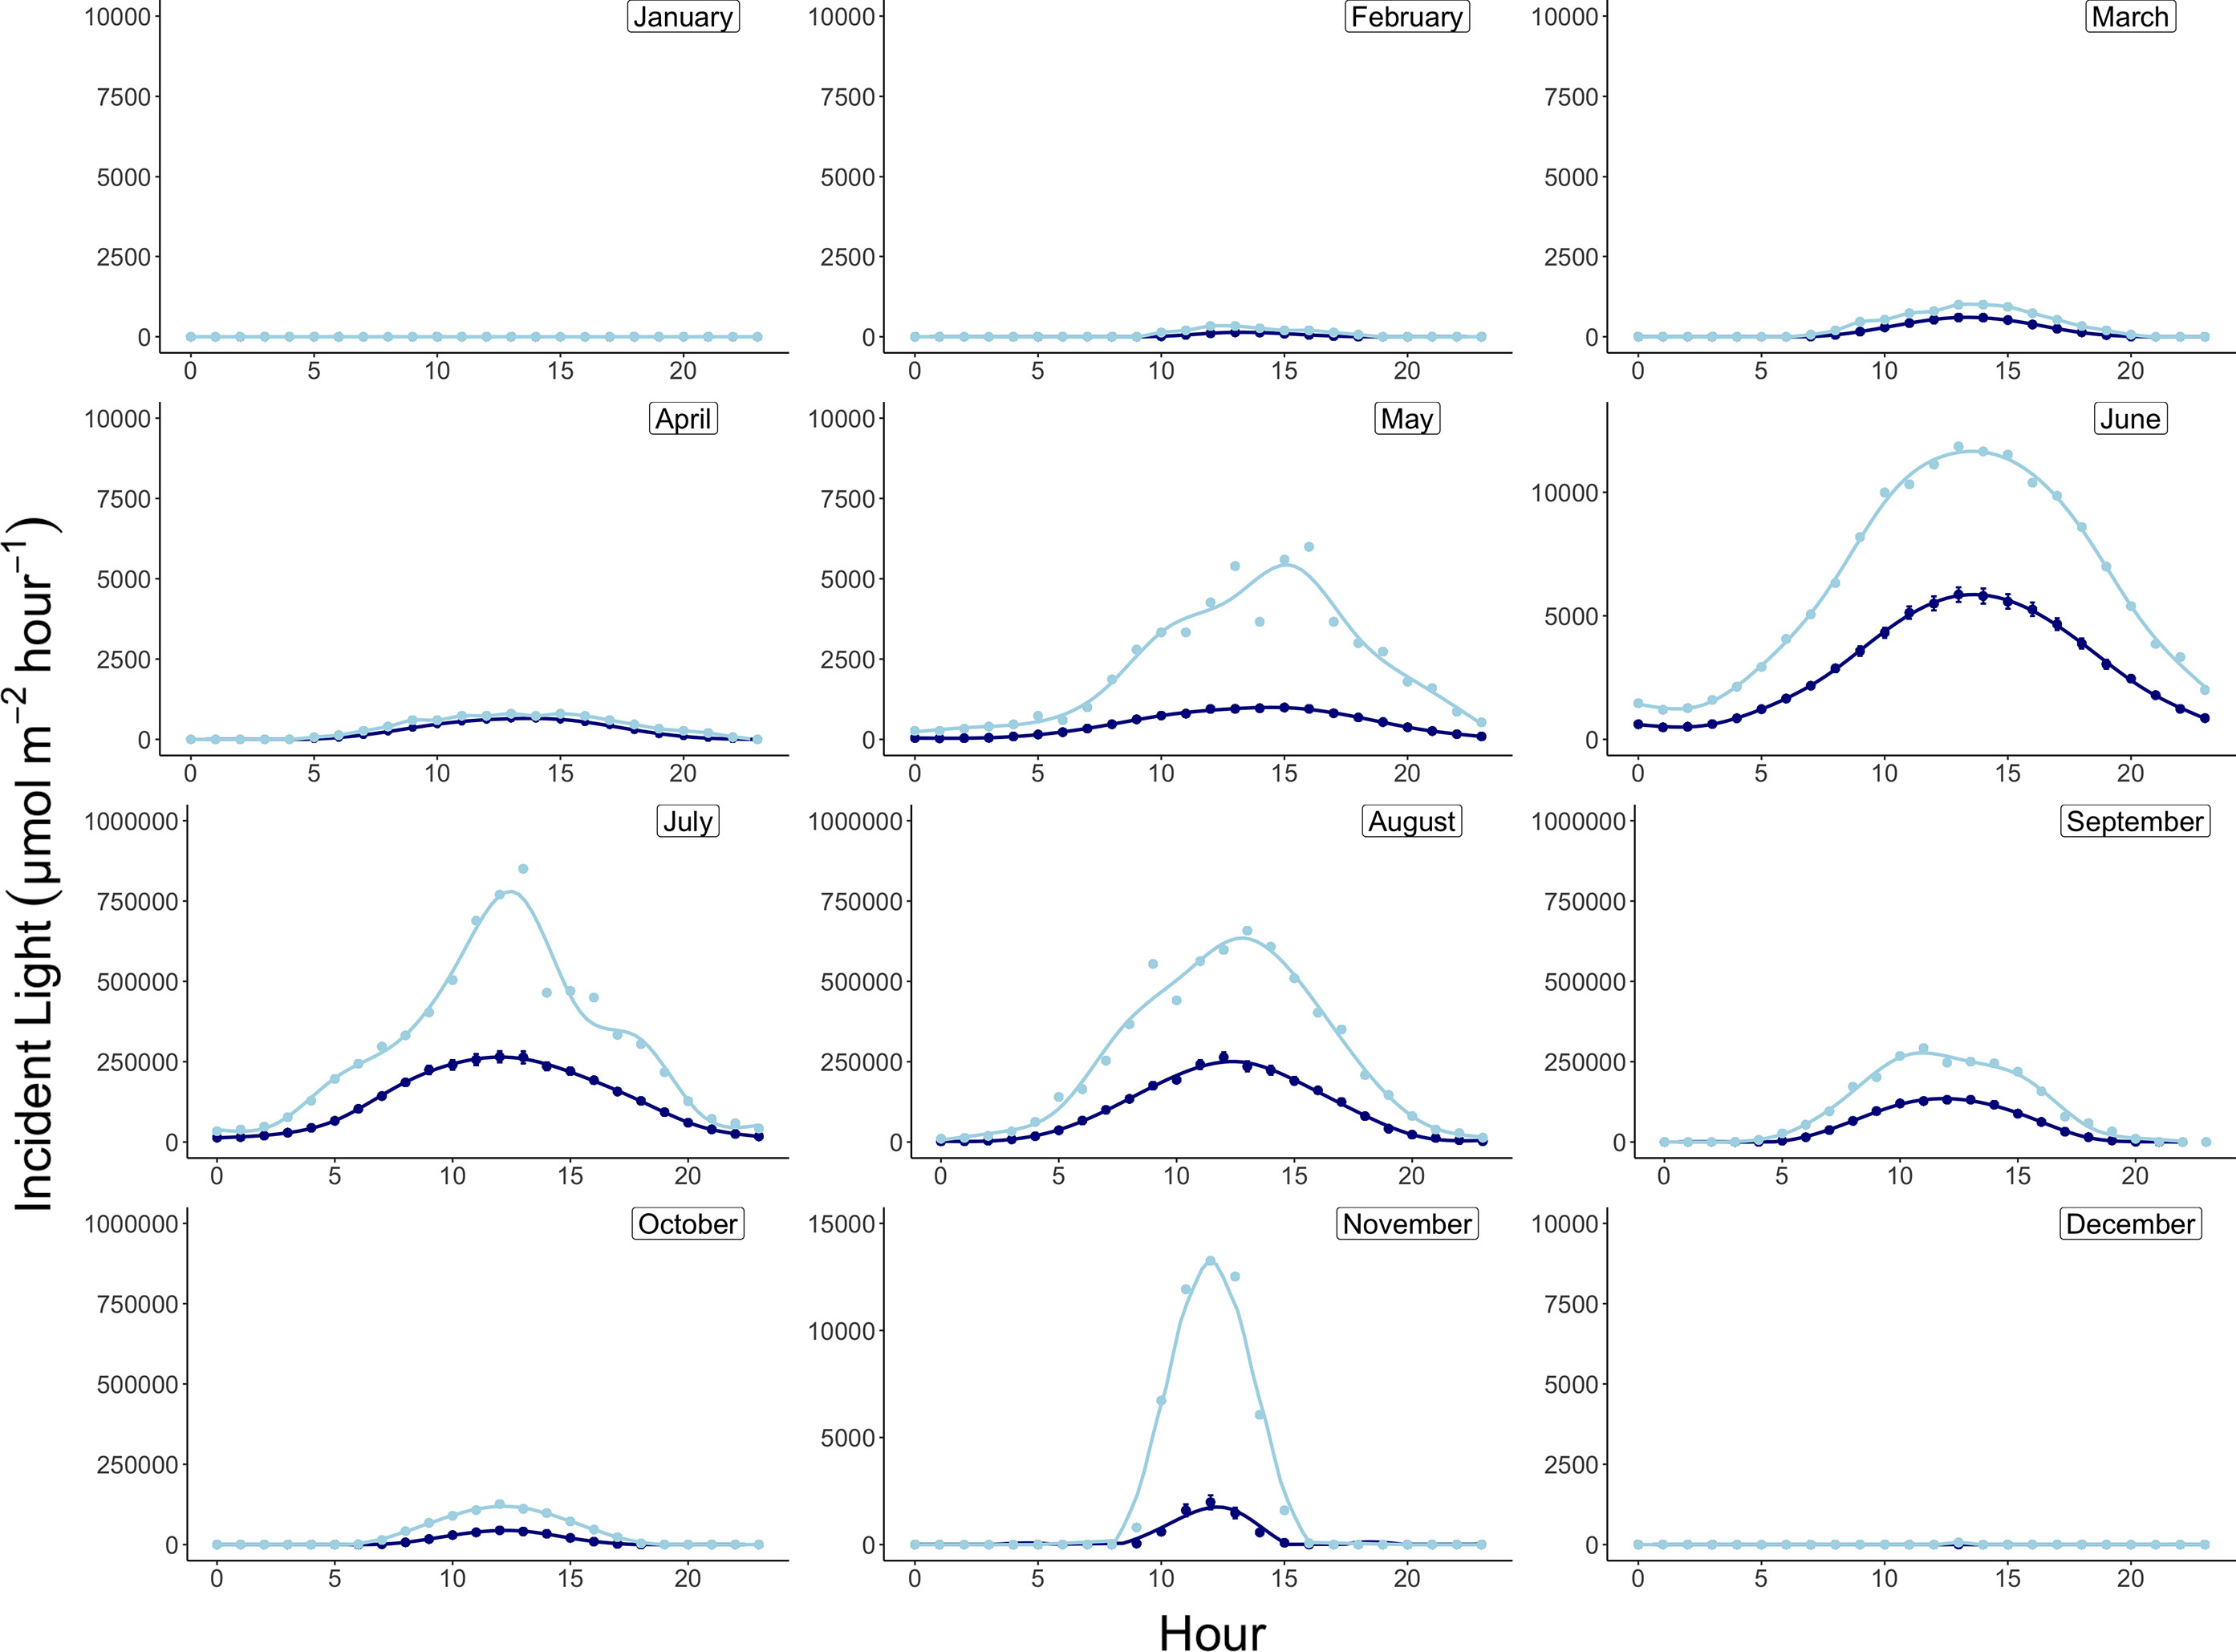
Figure 3 Daily average (navy) and maximum (light blue) incident light profiles by month at 15m depth in Arctic Bay, Nunavut, Canada across the experimental period. Note differences in y-axis scales.
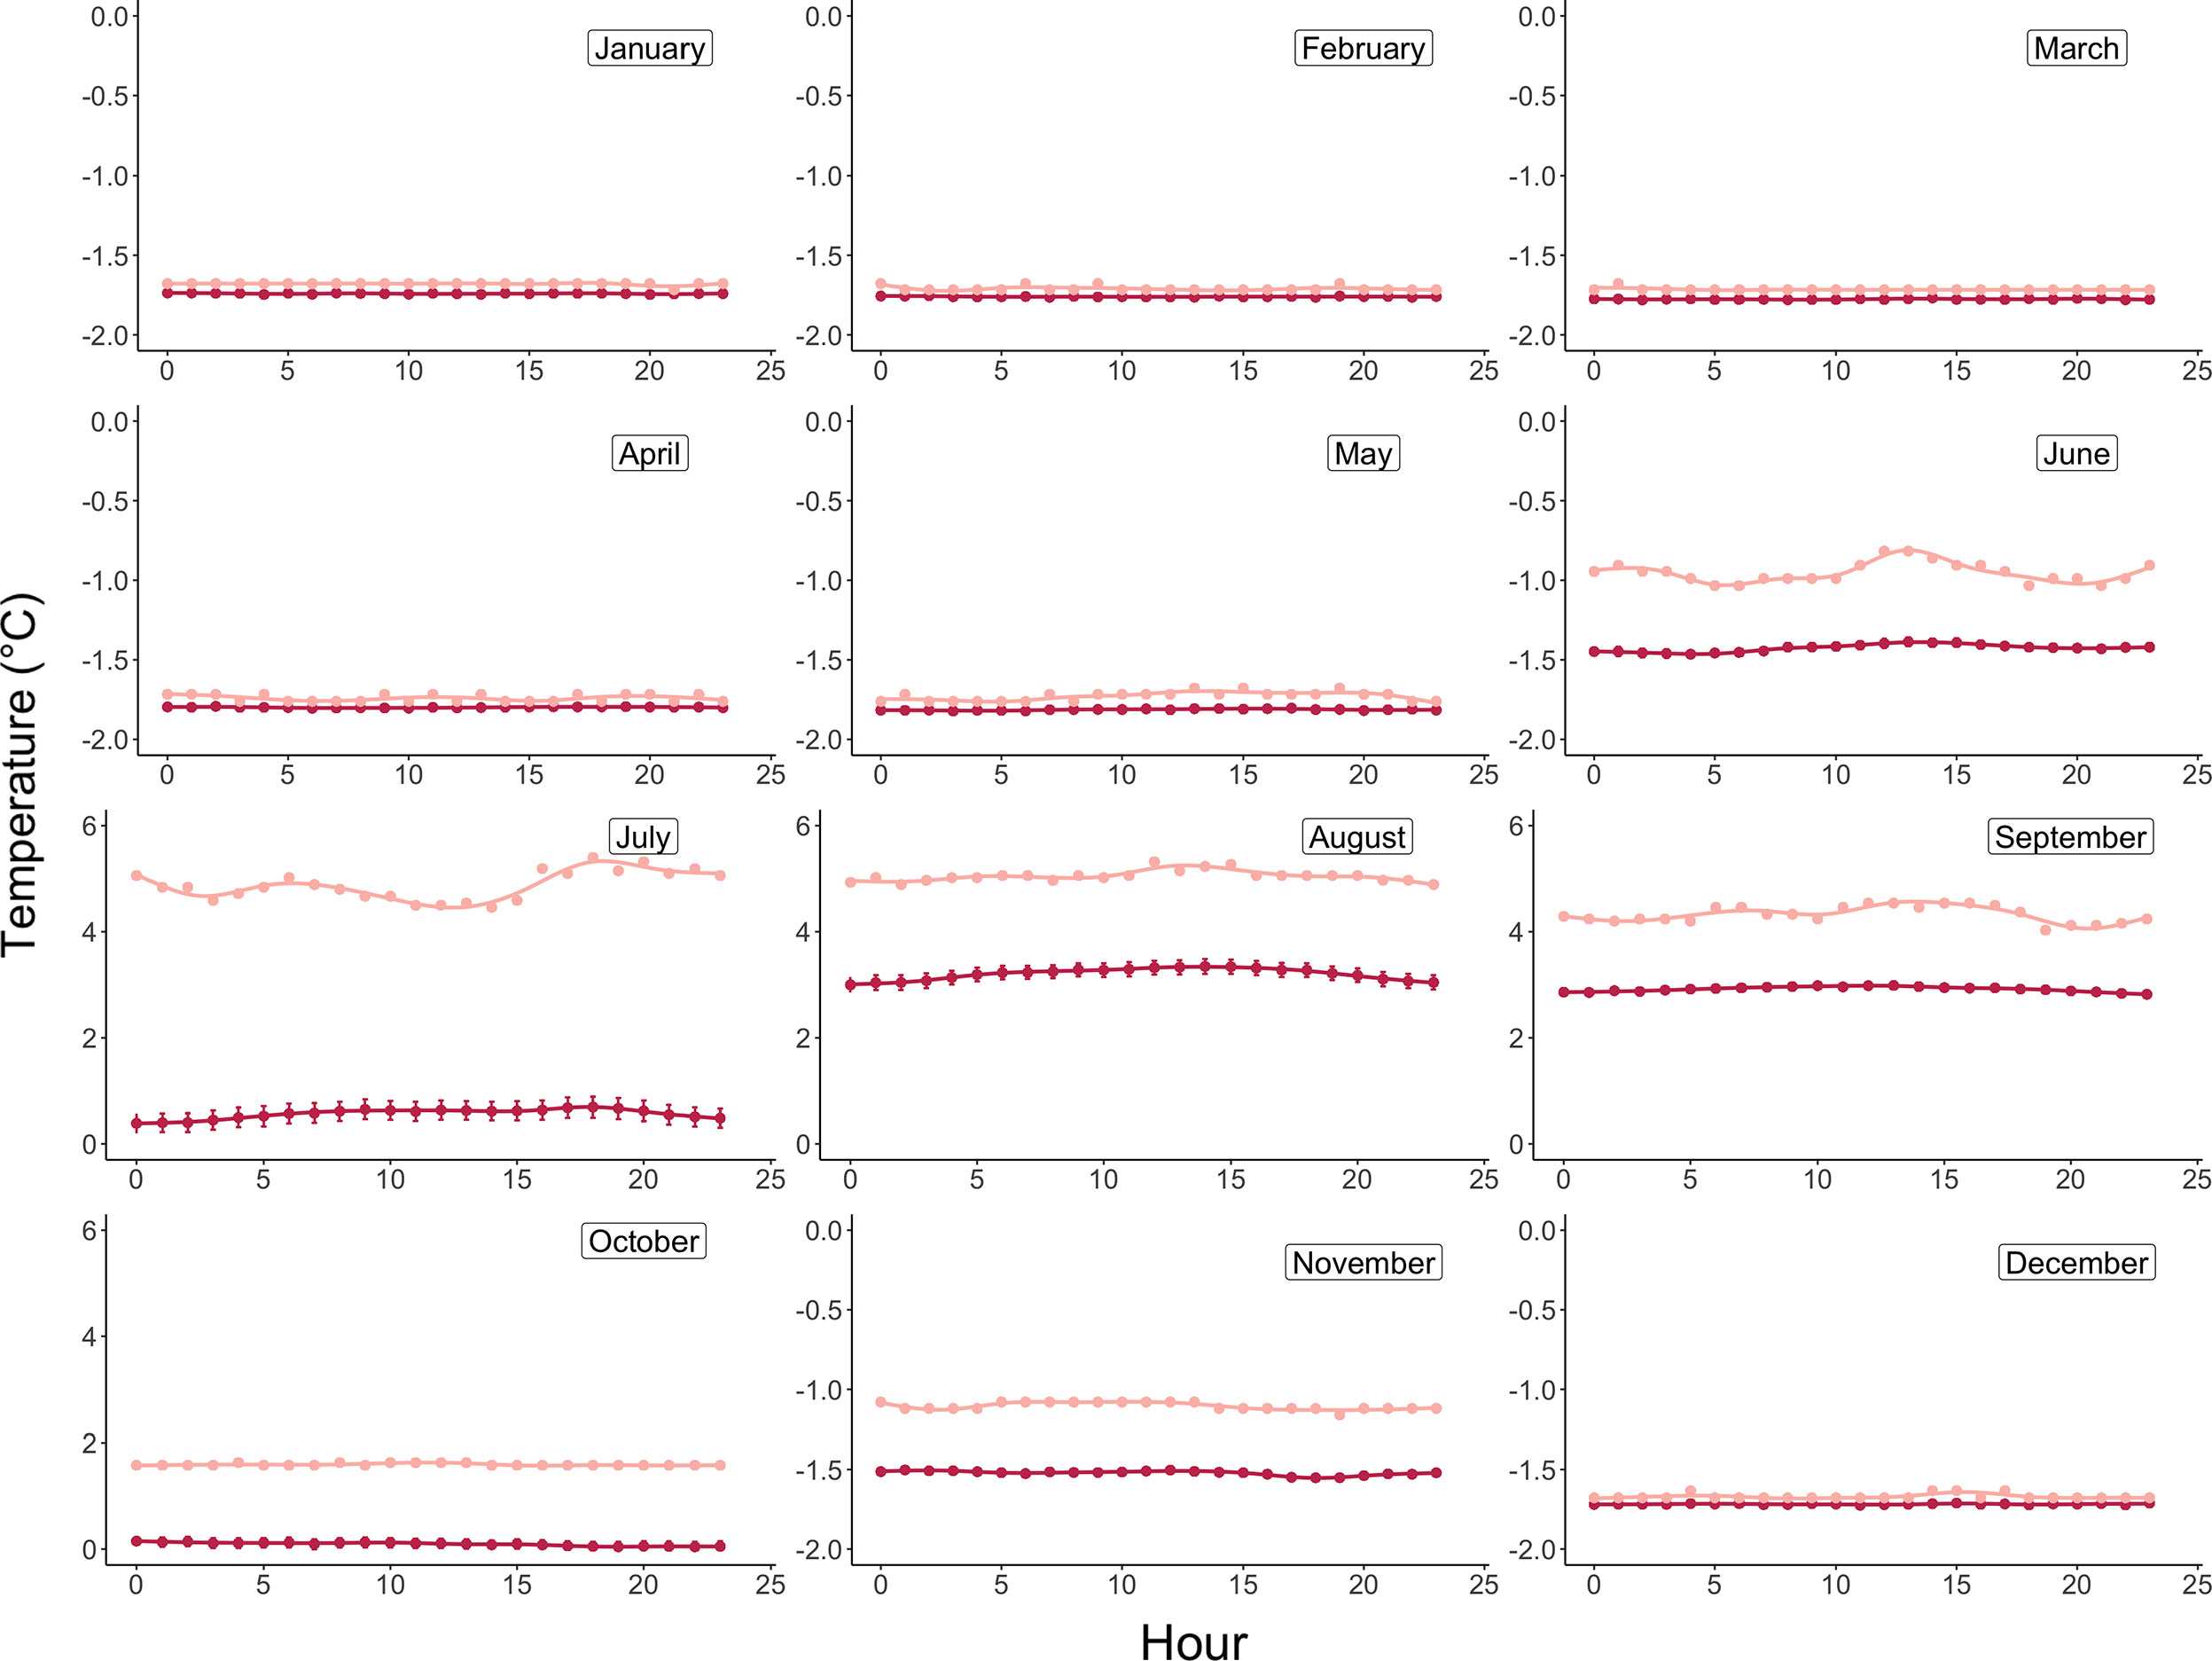
Figure 4 Daily average (maroon) and maximum (pink) temperature profiles by month at 15m depth in Arctic Bay, Nunavut, Canada across the experimental period. Note differences in y-axis scales.
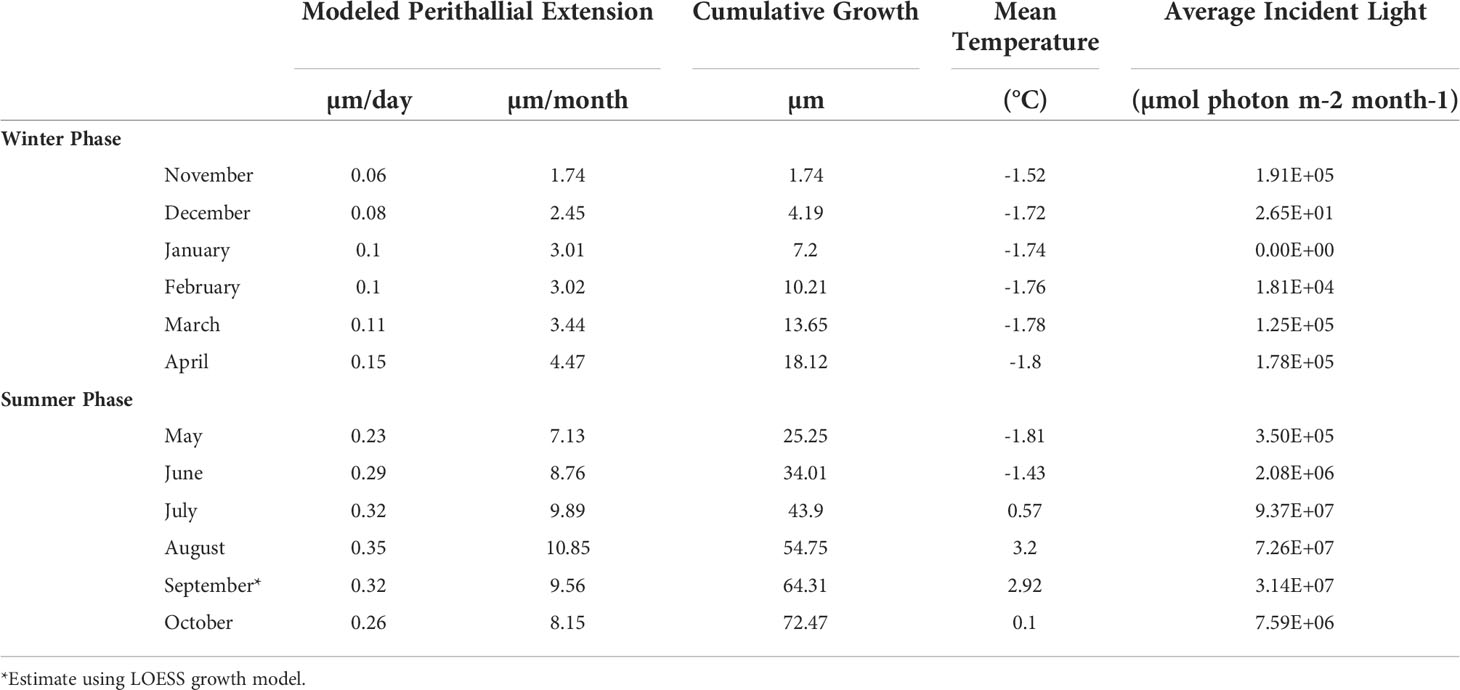
Table 2 Modeled C. compactum extension rates and monthly average temperature and incident light energies.
2.3 Algal growth
2.3.1 Linear extension measurement
Algae sections were prepared at University of Toronto Mississauga, where specimens were first cut using a wetted diamond-coated circular saw, and then sectioned to a thickness of 4 to 5 mm with a petrographic trim saw equipped with a diamond-coated blade and affixed to glass slides using Crystalbond™ epoxy. An Accutom 100 precision grinder was used to create a flat surface, and algal sections were then polished to a grit size of 3µm. Sections were then photomicrographed with a Nikon AZ100 on-axis macroscope equipped with a Nikon DS-Ril digital cooled camera head and a fluorescence module at Northeastern University’s Marine Science Center to quantify linear extension (growth) of the perithallial skeleton during the experimental period. Linear extension of the perithallium was measured as the average distance from the calcein marker to the meristem by taking an average area of growth divided by the lateral distance of the calcein marker under this area (see Figure 5). Due to the image resolution and because all growth estimates for subsequent collections are referenced to the first month of experimental growth, which includes the period during which the algae were stained with calcein dye, the average thickness (3.75 µm) of the calcein line was removed from all linear extension measurements used in subsequent analyses. Linear extension was measured across the entire surface of the sectioned alga. Multiple measurements of linear extension across the surface of a single algal section, or, in some cases, multiple sections of the same alga, averaged to yield a mean rate of linear extension for each specimen.
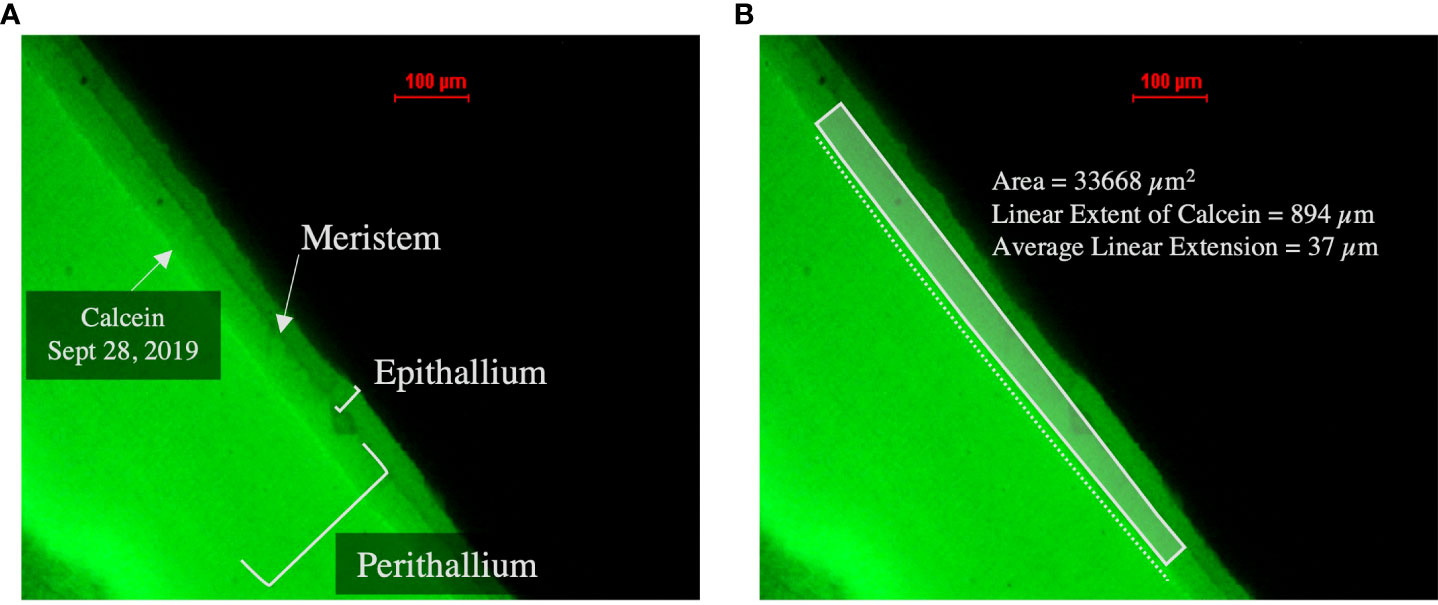
Figure 5 Fluorescent microscope images of representative C. compactum sample. (A) Image depicting calcein line (indicating initiation of experimental period September 28, 2019), meristem, epithallial skeleton and perithallial skeleton. (B) Image depicting calculation of average linear extension, measured by obtaining an area above the calcein line and below the meristem divided by the lateral distance of the calcein marker below this area.
Growth rate modeling for each month of the experimental period was conducted using a LOESS local regression model describing the average algal extension at each sample time-point. The model span was set to 70% to best capture the shape of the growth extension data and to avoid overfitting of the observed cumulative growth over time (see section 3.3.1 and Figure 6).
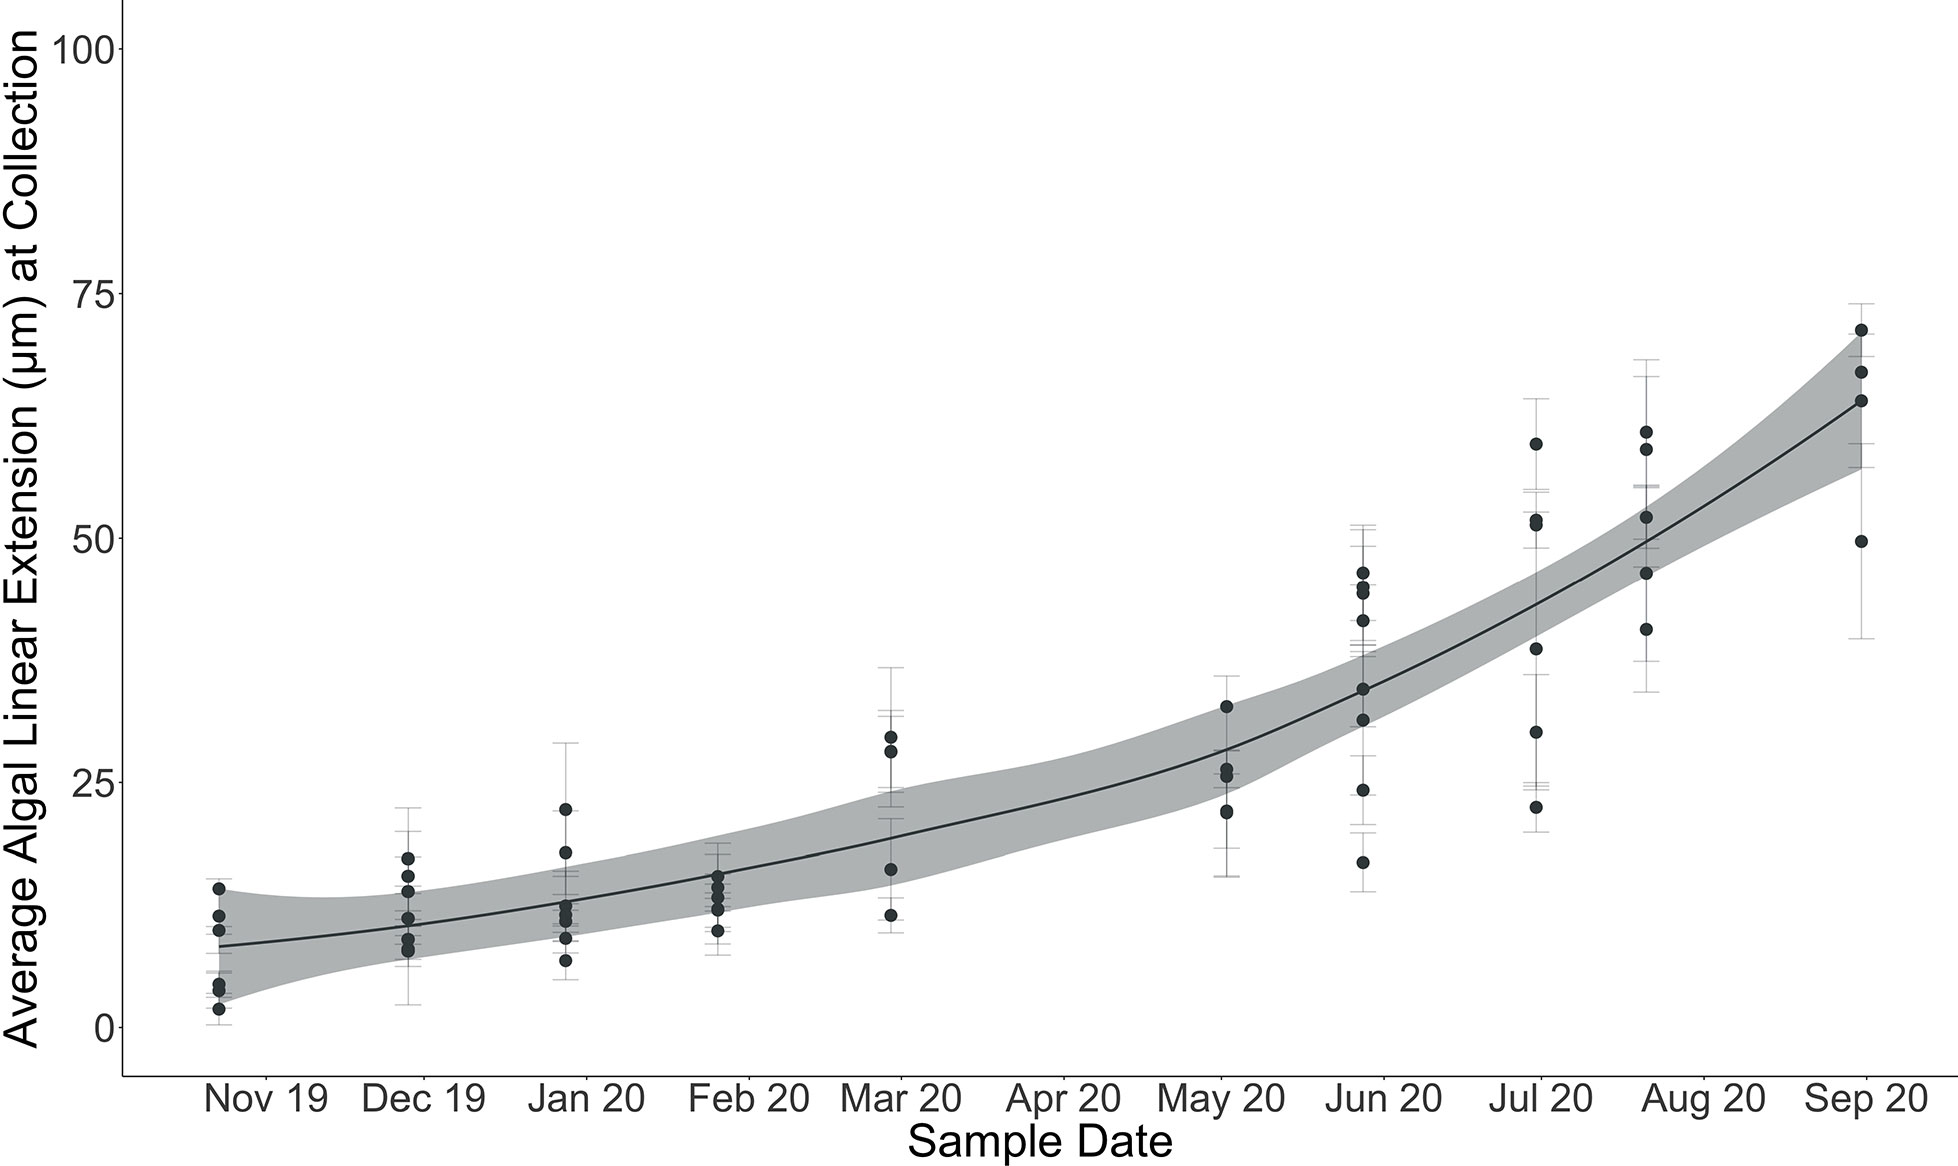
Figure 6 Average algal linear extension (µm) at each sample collection (October 28, 2019, through August 31, 2020). Error bars indicate standard error on mean algal linear extension computed from multiple linear extension measurements across individual algal surfaces. Locally weighted scatterplot smoothing (LOESS) model shown in solid line with shaded 95% confidence interval.
3 Results
3.1 Environmental data
Monthly average temperatures at the Ikpiarjuk (Arctic Bay) experimental array spanned a total of 5°C throughout the year, ranging from 3.2°C in August to -1.81°C in May (Figure 4 and Table 2). Incident light energy to the seafloor at 15 m depth ranged from a maximum of 9.37E07 µmol m-2 month-1 (3.02E06 µmol m-2 day-1) in July to a minimum of zero in January (Table 2). Sunlight declined by a factor of ten from October through November, as sea ice covered the bay in its entirety. However, a minimal amount of sunlight reached the seafloor through December, with complete darkness being reached in the month of January during the polar night. Sunlight was observed to return to the seafloor, despite the presence of sea ice, in the months of February and March, although the average daily incidence at 15 m was minimal. Sea-ice thickness was measured at several timepoints throughout the experiment. Sea-ice formation began during the month of October and grew to a maximum thickness of 160 cm above the algal array during the month of May. Sea-ice broke up during the second half of June and had completely disappeared by the first week of July 2020 (see Supplement S2 and Figure 8).
3.2 Algal growth
3.2.1 Linear extension
Linear extension could be measured for 60 of the 68 algae collected throughout the experiment (Tables 1; S1). Eight of the algae did not exhibit pronounced calcein markers for identifying the onset of the experimental period. Linear extension of the perithallial skeleton through time across the experiment ranged from an average ( ± SE) of 8 ± 1.8 µm by the end of October 2019 to an average ( ± SE) of 63 ± 4.7 µm by the end of August 2020 (n = 60). The maximum algal extension observed across the experiment was 79 µm for an individual collected in August 2020, and the minimum was 3.5 µm for an individual collected in October 2019.
3.2.2 Growth rate modeling
Cumulative growth across the experiment was modeled using local regression (LOESS model with a span of 70%, Figure 6) in order to produce monthly-resolved estimates of cumulative average linear extension across the entire experimental period. This allowed for the computation of predicted average cumulative growth for sample time points missing from the dataset (e.g., March). Using the modeled predictions for each month, monthly linear extension rates (defined here as the vertical growth of the perithallial skeleton) were quantified by subtracting the previous growth period’s modeled cumulative extension and dividing this value by the number of days in each respective month. This method assumes equal growth per day throughout each month of growth. Average monthly growth rates for the month of September (outside of the study period), were estimated using the same approach as above, where a local regression model describing the growth rates through time from January through December allowed for the interpolation of Septembers growth as 0.32 µm day-1. This approach yielded modeled algal extension rates ranging from a maximum of 10.86 µm month-1 during August to a minimum of 1.73 µm month-1 µm during the month of November (Figure 7 and Table 2). Approximately 54% of the annual algal growth occurs in the summer interval of June through the end of September. A total of 21% of the growth occurs in the transition months of October and May, and 25% occurs during the cold and dark winter interval of November through April. Linear extension rates presented here represent vertical skeletal extension, not added individual calcified cells. However, assuming published mean cell lengths (Adey et al., 2013: mean winter cell lengths equal to 9 µm and mean summer cell lengths equal 12µm), the algae in Arctic Bay would have produce a total of six to seven cells across the experiment, with approximately two of these cells produced during the winter season.
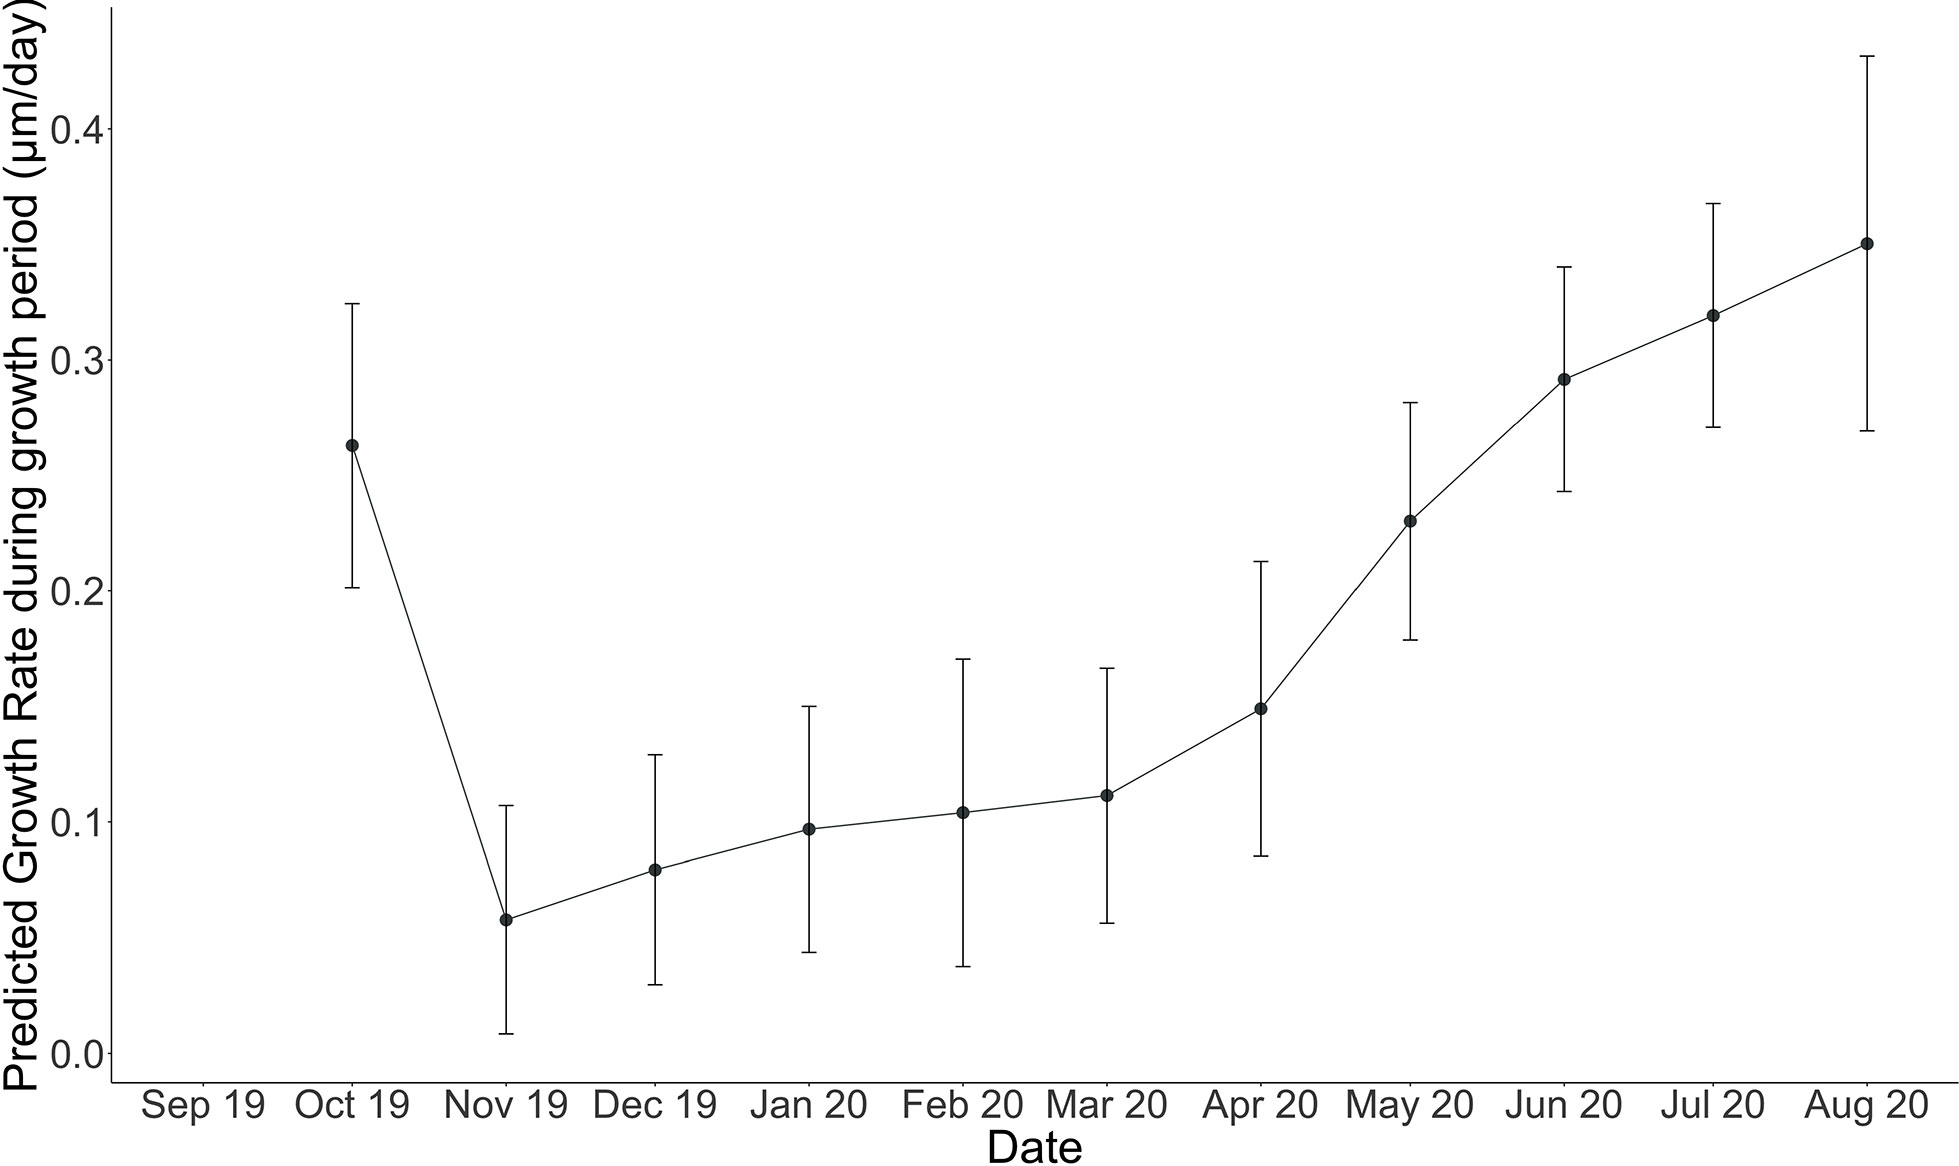
Figure 7 Modeled linear extension rate (µm/month) for each month (October 2019, through August 2020). Error bars indicate standard error on predicted algal linear extension rate computed using LOESS regression with a span of 0.7 or 70%.
4 Discussion
4.1 Annual algal growth
Cumulative growth across the experiment resulted in an average skeletal extension of 63 ± 4.7 µm from October 2019 through August 2020. Our modeling suggests that, including September’s estimated growth of 9.6 µm, Arctic Bay algae grew an average of approximately 72.5 µm in one year, which is consistent with previously observed Arctic Bay algal specimens ranging between 50 and 90 µm yr-1 (Adey et al., 2013; Halfar et al., 2013). Overall, growth rates indeed increase with both temperature and light energy throughout the year (see Figure S1). We posit that algal growth in the High Arctic is as limited by temperature as it is by light energy, although the weight of these factors influence growth disproportionately throughout the year, such that there exist two fundamentally different growing periods that are bracketed by two transition periods. Figure 8 illustrates the modeled growth rates of Arctic Bay algae from this experiment in relation to environmental variability of the incident light energy, temperature, and sea-ice thickness in the bay. There is an appreciable amount of growth that continues to occur through the cold and dark winter months. We define here a Summer Phase of algal growth as growth occurring during the months of June through September, the Winter Phase of algal growth occurring during the months of November through April, and two transition periods occurring during the months of May and October, as detailed below.
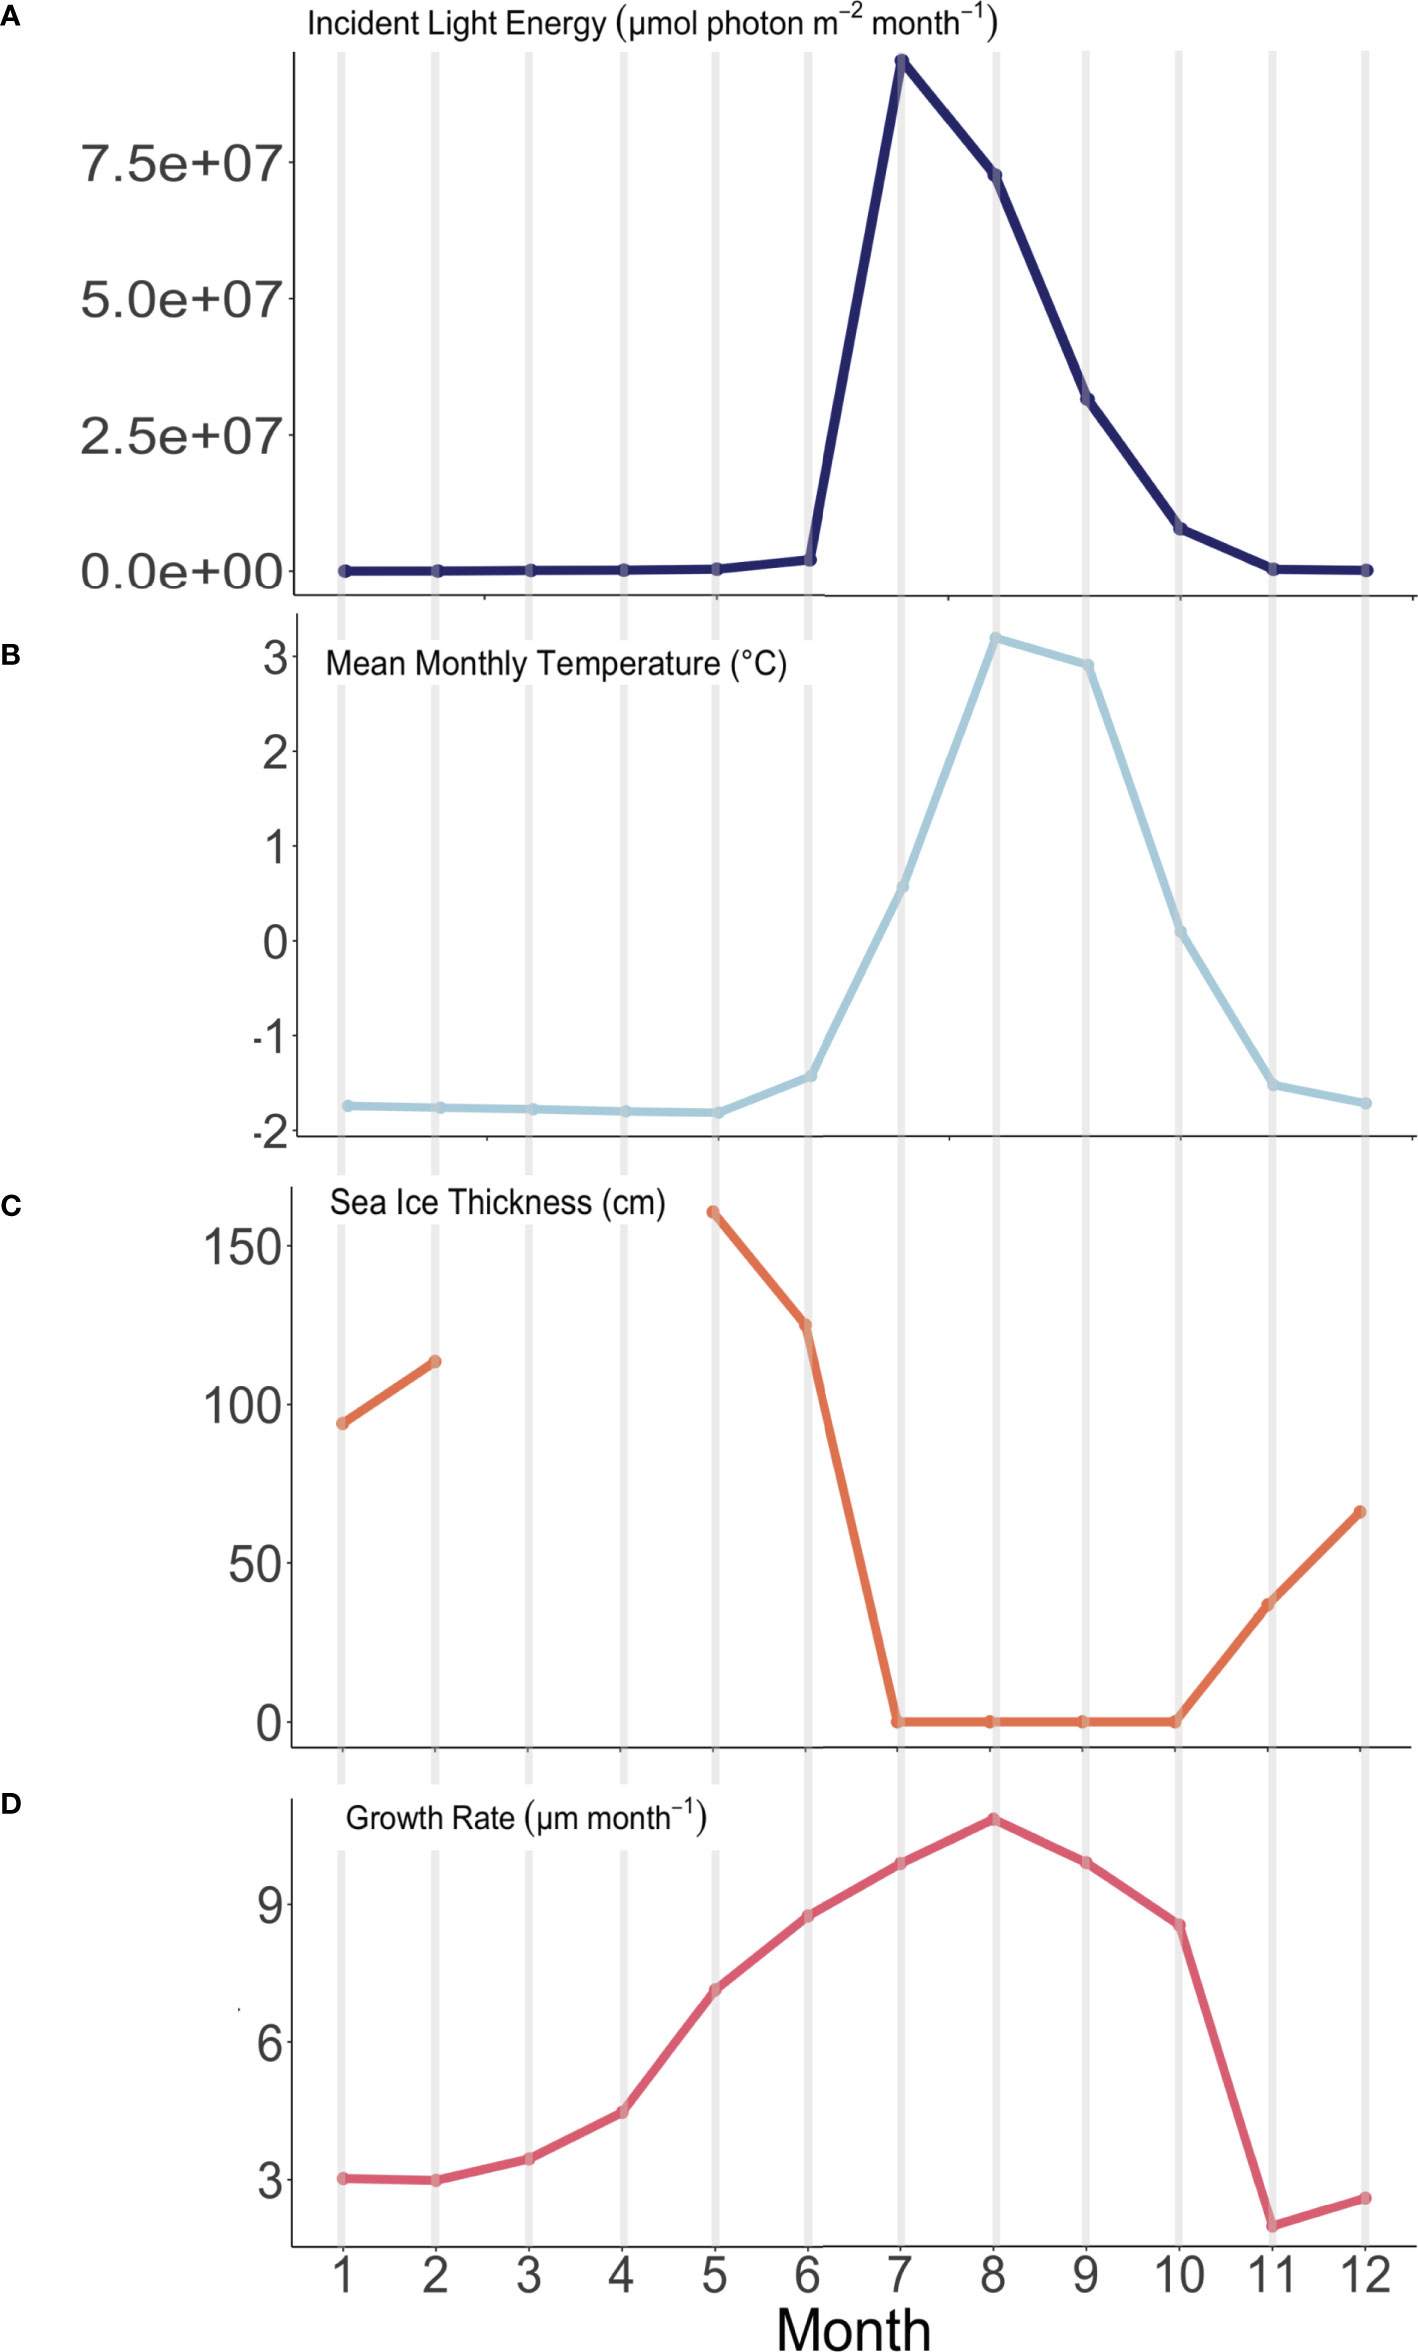
Figure 8 Observed environmental variability and modeled algal growth rates through time (January – month 1 through December – month 12) at the experimental array in Arctic Bay, NU. (A) Incident light energy (µmol photon m-2 month-1), (B) Average monthly temperature (°C), (C) sea-ice thickness (cm), and (D) modeled algal growth rate (µm month-1).
4.2 Winter phase growth
Our results also provide the first in situ evidence that algal growth continues through the cold, dark sea-ice covered months, as predicted both by Halfar et al. (2013) work illustrating that Mg/Ca recorded in the skeleton of C. compactum is representative of the sea-ice covered -1.8°C waters that exist during the coldest and darkest months of the year, as well as the experimental work by Williams et al. (2018) showing that C. compactum growth continues for at least one month in complete darkness. This growth of C. compactum in the dark was previously linked to the utilization of starch stored in the perithallial tissue (Freiwald and Henrich, 1994; Williams et al., 2018). Here, we observe a sharp decline in growth rates from October through November (Figure 8), as shore-fast sea-ice develops, and as sunlight declines. However, we observe a continuation in growth rates during the Winter Phase across the following five to six months as darkness continues and temperatures continue to drop (Table 2 and Figures 8, 9). We hypothesize that this reflects the slow activation of stored starch nodules (photosynthate) deep in the perithallium (Figure 10; Williams et al., 2018). Although growth is occurring, it is significantly less than would be expected in the absence of sea-ice during this time, especially as the sunlight begins to return to Arctic Bay in February. Indeed, growth appears to slow acorss the months of January through February. However, looking closely only at the Winter Phase months (Table 2), a slight increase in light energy to the seafloor as the polar night ends (November – January) may also contribute to the steady increase in growth rates through time, even as temperatures continue to drop and sea-ice builds. While utilization of stored photosynthate from warm and bright summer months is likely the main driver of continued growth in the winter phase, it may be possible that light energy reaching the seafloor even before the sea-ice breakup could contribute to the onset of photosynthesis. This is especially evident for growth during the transition from the Winter Phase to the Summer Phase during the month of May, where temperature reaches its minimum, but incident light begins to increase slightly (Table 2).

Figure 9 Average monthly temperature (°C) and incidence light energy (µmol photon m-2 month-1) trajectory for the Arctic Bay, NU experimental array colour and size indicate average modeled algal growth rate (µm month-1). Small inlay figure shows growth rates from November through the month of May. Black numbers beside each point also indicate average modeled algal growth rate (µm month-1).
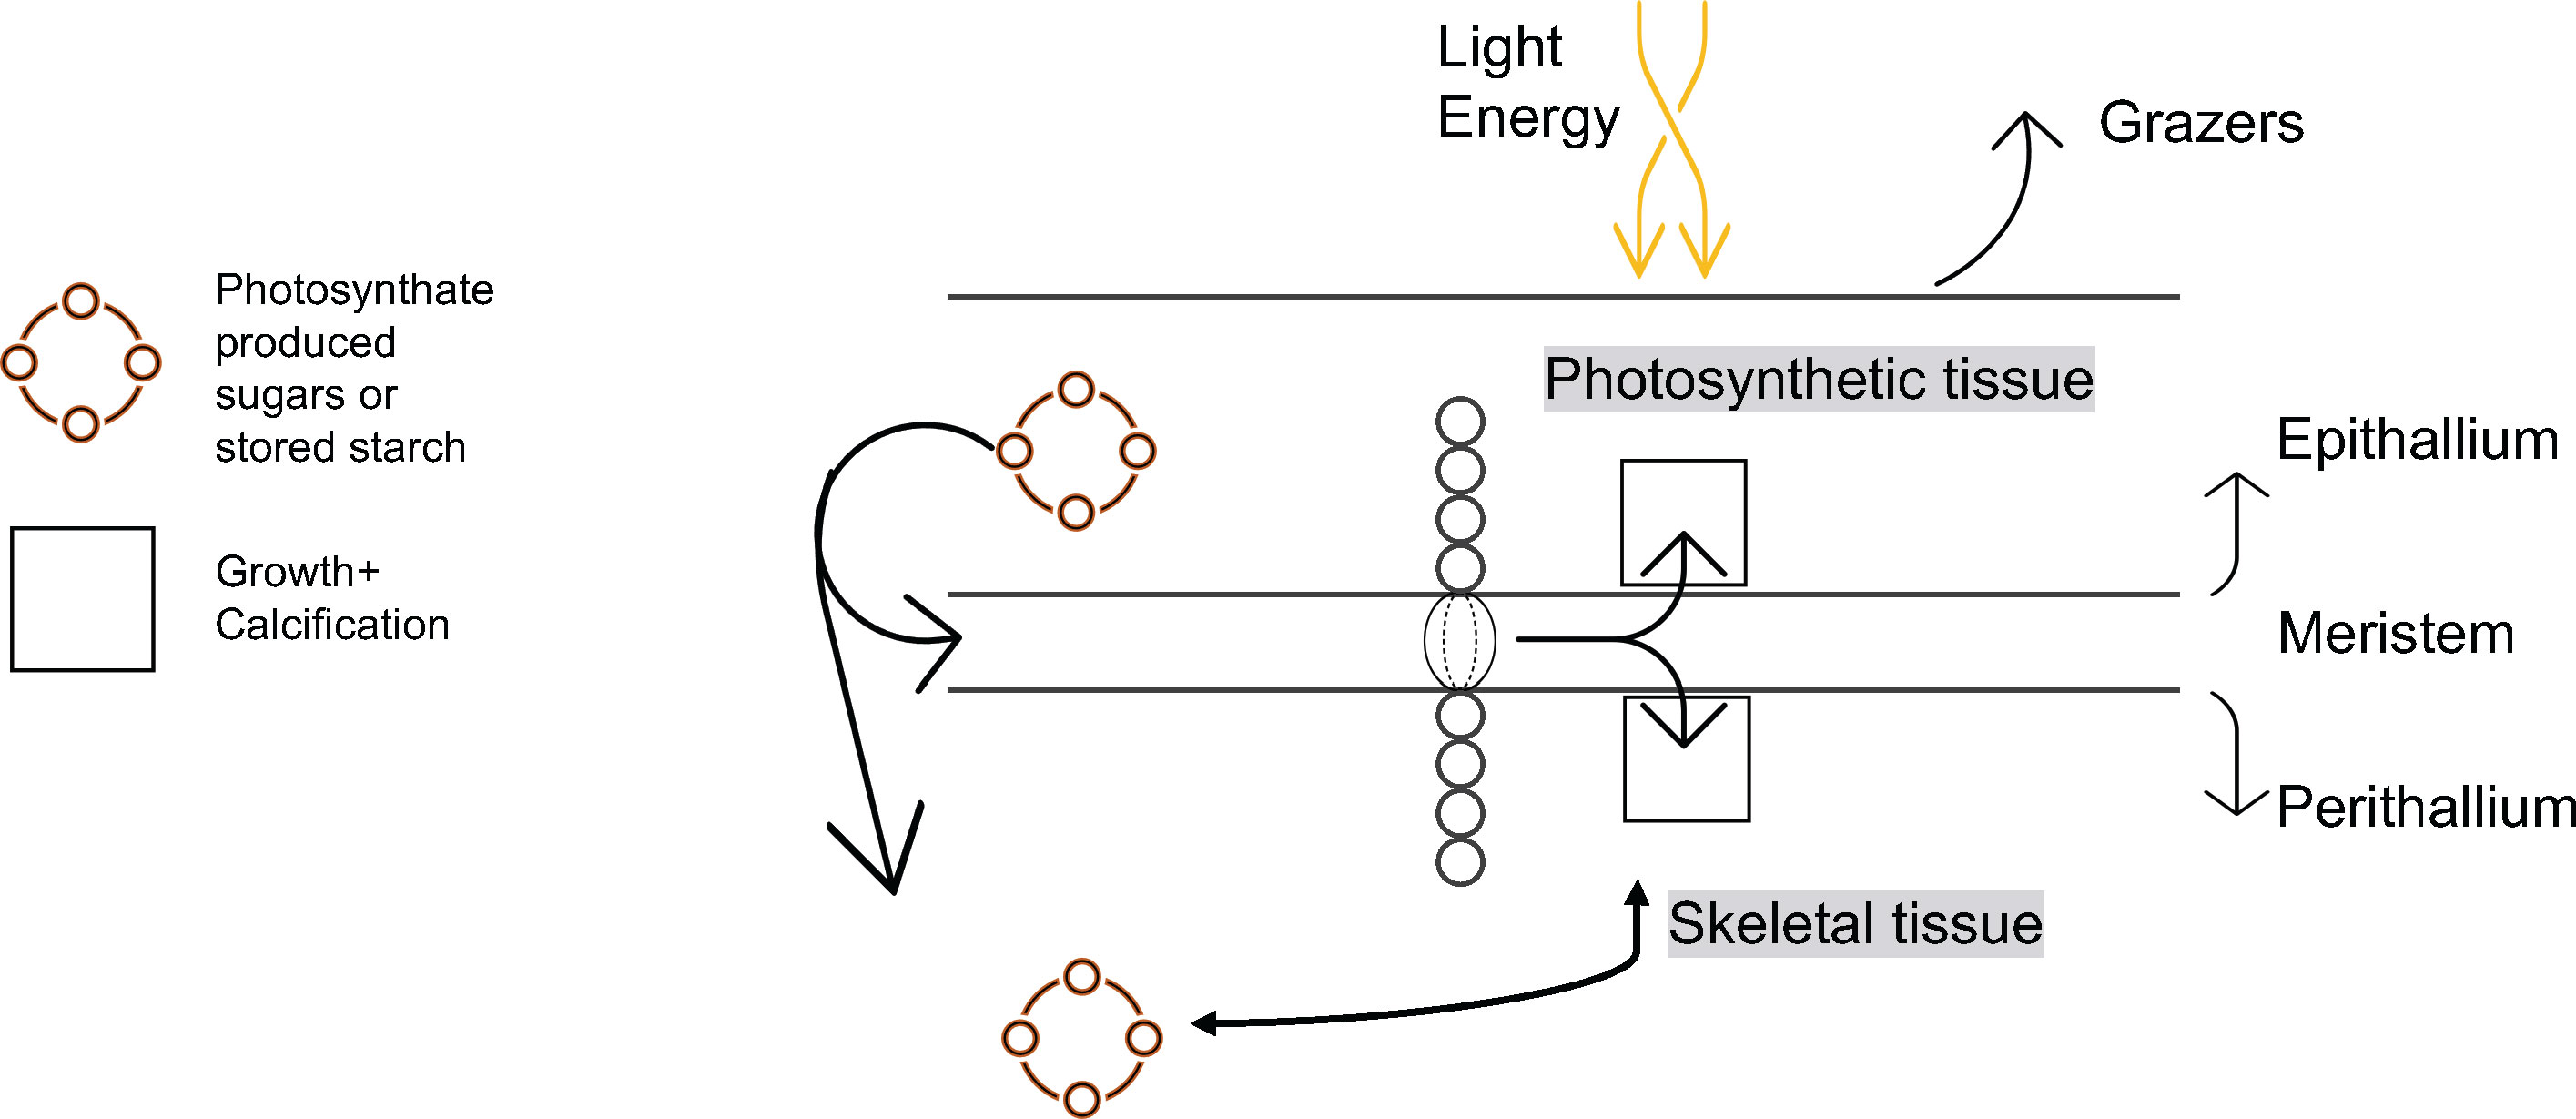
Figure 10 Schematic representation of algal growth and calcification.
Roberts et al. (2002) investigated two dominant Greenland crustose coralline red algae species that had compensation irradiances (the point at which photosynthetic activity exceeds respiration) of 0.7 – 1.8 µmol photons m-2 s-1. This type of light regime would only be possible in the months of June through October in Arctic Bay. Unfortunately, no reports of experimental growth and photosynthetic rates in such low light conditions for C. compactum are currently available, nor has the compensation irradiance for C. compactum been determined. Therefore, this hypothesis of low-light photosynthesis cannot be explicitly tested within the scope of this study and would require future experimental analysis of photosynthetic activity under low-light conditions, and the determination of C. compactum’s photosynthetic compensation point. Alternatively, some Arctic crustose coralline algae may have the capacity for dark CO2 fixation (Kremer, 1981; Freiwald and Henrich, 1994; Hofmann et al., 2018). If C. compactum can fix carbon independent of light availability, perhaps dark carbon fixation also contributes to continued calcification and linear extension through the winter months. Although outside the scope of this paper, dark fixation is another possible mechanism on which these High Arctic algae may rely for growth during long, dark winter months.
4.3 Summer phase growth
During the Summer Phase, algal growth is dictated by a combination of increased temperatures and light energy. We interpret the 12.6% increase (of total range) in algal growth rates between June and July as likely controlled by the marked increase in light energy, which totals 97.7% of the total light energy range observed (Figure 9). The marked increase in light energy far outweighs the increase in temperature during this period, which is only 39.8% of the total range. The growth rate increase of 11% of the total range from the month of July through August, where algal growth is highest, is likely controlled by the increase in temperature, which rose 53% of the total 5°C range even as light energy began to decline (Figure 9). Finally, growth rates decline from their maximum in August through the month of October, driven by similar declines in both light energy (by 69%) and temperature (by 62%) as the algae enter the Winter Phase, once again relying on built up stores of photosynthate acquired through the warm and bright Summer Phase (Figure 9).
4.4 Agreement with previous work
Overall, our observation of growth on a sub-annual scale agrees with the field work of Halfar et al. (2008), which shows that in the Gulf of Maine the relationship between seawater temperature and annual averages of δ18O in C. compactum are strongest for the months of June through September (indicating fastest growth in these months), are weaker in October through December and May, and are poor in the months of January through March. Importantly, we also observe continued growth through the darkest and coolest months of the year as predicted from experimental work (Williams et al., 2018) and archival work (e.g. Halfar et al., 2013). However, our work suggests that dark, winter growth does not entirely cease after one or two months of darkness as previously hypothesized, suggesting that either (a) photosynthetic activity and energy stores through the productive summer months are sufficient to sustain algal growth throughout the year, (b) low light levels to the seafloor reappearing after the polar night are enough to stimulate some photosynthetic activity, or some combination of (a) and (b). Further work evaluating calcification in the photosynthetically active epithallial layer and experimental work evaluating the evaluating photosynthesis under different low-light regimes and exposure lengths would further elucidate this alga’s capacity for growth in the High Arctic.
4.5 Implications
The use of algal growth band thickness as a proxy for reconstructing sea-ice extent in the High Arctic relies on the assumption that continued (appreciable) winter growth lasts only one to two months after the onset of sea-ice in each locality. The discrepancy in growth expected in the absence of sea-ice can clearly be seen when comparing algal growth rates across a latitudinal (temperature) gradient, where growth at higher latitude, cooler and sea-ice covered locations drops at a faster rate than predicted by temperature alone (Halfar et al., 2013). This difference in growth rates is referred to as the ‘sea-ice delta’ (Halfar et al., 2013; supporting information Figure S1). Our work, however, suggests that upwards of ~45% of annual algal growth occurs during the months of November through June when sea-ice covers or is present in Arctic Bay. Because archival work relies on algal growth anomalies and not absolute differences in growth band thickness between successive years, our findings suggest that one can still reliably reconstruct anomalous sea-ice variability using growth-band anomalies. However, the sensitivity of the growth band sea-ice proxy may vary geographically (locally) according to the length and extent of the sea-ice season. For instance, in regions further north (e.g., 80°N latitude) where the polar night is longer, there could be a lower overall contribution of winter growth, making the proxy more sensitive to sea-ice cover in this region.
Although geochemical analysis of the algal growth in these Arctic Bay specimens is outside the scope of this paper, investigation of the Mg/Ca composition of the calcified skeleton relative to the light and temperature regimes of Arctic Bay may provide further insight into the use of Mg/Ca in addition to growth banding thickness as a proxy for sea-ice extent. In addition to geochemical signatures, evaluation of calcification and growth at the cellular level may yield further insights into sub-annual growth of this Arctic alga, especially regarding sea-ice extent and cover, which may yield additional independent proxies of sea-ice extent as well.
5 Conclusion
Here we quantify the in situ growth of wild specimens of C. compactum at a near monthly temporal resolution throughout an annual cycle, describing growth rates of these algae under sea-ice covered oceans. Our results agree with previous findings that C. compactum growth continues in dark, cold, sea-ice covered waters. Although previous studies suggest that this growth only persists for a month or two, we show that these algae continue to grow throughout the entire winter sea-ice season, amassing roughly 25% of their annual skeleton in the winter (November-April) months and another ~21% during the transition months of May and October. Critically, we need to better understand the physiological processes that support this sustained algal growth in the absence of light, including the role that photosynthate stored in the deep perithallial skeleton plays in sustaining this growth during dark, winter months. We also observe increases in growth rates during the warm and high-insolation months in Arctic Bay, reflective of the impact that temperature and light availability have on the growth of this species of crustose coralline alga. How other environmental changes will impact algal growth in the High Arctic, associated with changing sea-ice extent and other environmental perturbations (e.g., salinity, pH, cloudiness, turbidity, pCO2, and bottom shear stress), while beyond the scope of this paper, are certainly important to advance our understanding of the future of these organisms. However, owing to its current geographic range (reaching southward to the Gulf of Maine) and thermal range (-1.8°C in the High Arctic to 12°C in the Gulf of Maine), it is feasible to consider a scenario in which the growth of C. compactum will be enhanced bylengthening of the growing season that results from warming waters and shorter sea-ice seasons, potentially increasing the abundance of C. compactum in the Arctic.
Data availability statement
The original data presented in the study are included in the article and in the supplement and will be archived with the Biological and Chemical Oceanography Data Management Office. Further inquiries are welcome and should be directed to the corresponding author.
Author contributions
JH developed the concept for the field experiment. JG developed the methodology with input from JH and JR. JG conducted the field work and prepared the samples for analysis with guidance from JH. JG analysed and interpreted the data with input and guidance from JH, WA, and JR. JG wrote the original draft of the manuscript and JG, JH, WA, and JR contributed to editing and revision. All authors have agreed to the published version of the manuscript.
Funding
This research was funded by NSERC Discovery and NSERC Ship Time grants to JH and NSERC PGS-D (CGSD3-545886-2020) to JG as well as by NSF Marine Geology & Geophysics award 1459706 to JR.
Acknowledgments
We are indebted to the support from the Inuit community of Ikpiarjuk (Arctic Bay), Nunavut, Canada, without which this research would not be possible. We also thank the Brossier Family and the crew of the RV Vagabond (Louis Wilmotte and Natasha Leclerc) for their valued support of fieldwork, experimental deployment and, especially, for their sampling support over the winter. We thank the Nunavut Research Institute for the research license (0205319R-M to JH) to work in Arctic Bay, Evan Edinger for providing substrate maps and Alessio Scurci for his significant support preparing laboratory samples. JR acknowledges support from MIT Sea Grant award NA18OAR4170105. We also acknowledge Isaac Westfield for assisting with development of the stages used to deploy the algae and instrumentation to the field.
Conflict of interest
The authors declare that the research was conducted in the absence of any commercial or financial relationships that could be construed as a potential conflict of interest.
Publisher’s note
All claims expressed in this article are solely those of the authors and do not necessarily represent those of their affiliated organizations, or those of the publisher, the editors and the reviewers. Any product that may be evaluated in this article, or claim that may be made by its manufacturer, is not guaranteed or endorsed by the publisher.
Supplementary material
The Supplementary Material for this article can be found online at: https://www.frontiersin.org/articles/10.3389/fmars.2022.900033/full#supplementary-material
References
Adey W. H. (1965). The genus clathromorphum (Corallinaceae) in the gulf of Maine. Hydrobiologia 26 (3-4), 539–573. doi: 10.1007/bf00045545
Adey W. H. (1966). Distribution of saxicolous crustose corallines in the northwestern north Atlantic. J. Phycol. 2, 49–54. doi: 10.1111/j.1529-8817.1966.tb04593.x
Adey W. H. (1970). The effects of light and temperature on growth rates in boreal-subarctic crustose corallines. J. Phycol. 6 (3), 269–276. doi: 10.1111/j.1529-8817.1970.tb02392.x
Adey W. H., Chamberlain Y. M., Irvine L. M. (2005). An SEM-based analysis of the morphology, anatomy, and reproduction of lithothamnion tophiforme (Esper) unger (corallines, rhodophyta), with a comparative study of associated north Atlantic Arctic/Subarctic melobesioideae. J. Phycol. 41 (5), 1010–1024. doi: 10.1111/j.1529-8817.2005.00123.x
Adey W. H., Halfar J., Humphreys A., Suskiewicz T., Belanger D., Gagnon P., et al. (2015a). Subarctic rhodolith beds promote longevity of crustose coralline algal buildups and their climate archiving potential. Palaios 30 (4), 281–293. doi: 10.2110/palo.2014.075
Adey W. H., Halfar J., Williams B. (2013). “The coralline genus clathromorphum foslie emend. adey: Biological, physiological, and ecological factors controlling carbonate production in an Arctic-subarctic climate archive,” in Smithsonian Contributions to the marine sciences (Washington, DC: Smithsonian Institution Scholarly Press) 40, 1–p48.
Adey W. H., Hayek L.-A. C. (2011). Elucidating marine biogeography with macrophytes: Quantitative analysis of the north Atlantic supports the thermogeographic model and demonstrates a distinct subarctic region in the northwestern Atlantic. Northeastern Nat. 18, 1–128. doi: 10.1656/045.018.m801
Adey W. H., Hernandez-Kantun J. J., Johnson G., Gabrielson P. W. (2015b). DNA Sequencing, anatomy, and calcification patterns support a monophyletic, subarctic, carbonate reef-forming clathromorphum (Hapalidiaceae, corallinales, rhodophyta). J. Phycol. 51 (1), 189–203. doi: 10.1111/jpy.12266
Adey W. H., Steneck R. S. (2001). Thermogeography over time creates biogeographic regions: A temperature/space/time-integrated model and an abundance-weighted test for benthic marine algae. J. Phycol. 37 (5), 677–698. doi: 10.1046/j.1529-8817.2001.00176.x
Belt S. T., Massé G., Rowland S. J., Poulin M., Michel C., LeBlanc B. (2007). A novel chemical fossil of palaeo sea ice: IP25. Org. Geochem. 38 (1), 16–27. doi: 10.1016/J.ORGGEOCHEM.2006.09.013
Cai Q., Wang J., Beletsky D., Overland J., Ikeda M., Wan L. (2021). Accelerated decline of summer Arctic sea ice during 1850-2017 and the amplified Arctic warming during the recent decades. Environ. Res. Lett. 16, 8. doi: 10.1088/1748-9326/abdb5f
Comiso J. C., Meier W. N., Gersten R. (2017). Variability and trends in the Arctic Sea ice cover: Results from different techniques. J. Geophys. Res. Oceans 122 (8), 6883–6900. doi: 10.1002/2017JC012768
De Vernal A., Gersonde R., Goosse H., Seidenkrantz M.-S., Wolff E. W. (2013). Sea Ice in the paleoclimate system: The challenge of reconstructing sea ice from proxies – an introduction. Quat. Sci. Rev. 79, 1–8. doi: 10.1016/j.quascirev.2013.08.009
Freiwald A., Henrich R. (1994). Reefal coralline algal build-ups within the Arctic circle: Morphology and sedimentary dynaics under extreme environmental seasonality. Sedimentology 41, 963–984. doi: 10.1111/j.1365-3091.1994.tb01435.x
Gamboa G., Halfar J., Hetzinger S., Adey W., Zack T., Kunz B., et al. (2010). Mg/Ca ratios in coralline algae record northwest Atlantic temperature variations and north Atlantic oscillation relationships. J. Geophys. Res. 115, C12044. doi: 10.1029/2010JC006262
Halfar J., Adey W. H., Kronz A., Hetzinger S., Edinger E., Fitzhugh W. W. (2013). Arctic Sea-ice decline archived by multicentury annual-resolution record from crustose coralline algal proxy. Proc. Natl. Acad. Sci. 110 (49), 19737–19741. doi: 10.1073/pnas.1313775110
Halfar J., Steneck R. S., Joachimski M., Kronz A., Wanamaker A. D. (2008). Coralline red algae as high-resolution climate recorders. Geology 36, 463–466. doi: 10.1130/G24635A.1
Halfar J., Zack T., Kronz A., Zachos J. (2000). Growth and high-resolution paleoenvironmental signals of rhodoliths (coralline red algae): A new biogenic archive. J. Geophys. Res. 105, 22107–22116. doi: 10.1029/1999JC000128
Hetzinger S., Halfar J., Kronz A., Simon K., Adey W. H., Steneck R. S. (2017). Reproducibility of clathromorpum compactum coralline algal Mg/Ca ratios and comparison to high-resolution sea surface temperature data. Geochim. Cosmochim. Acta 220, 96–109. doi: 10.1016/j.gca.2017.09.044
Hetzinger S., Halfar J., Kronz A., Steneck R. S., Adey W., Lebednik P., et al. (2009). High-resolution Mg/Ca ratios in a coralline red alga as a proxy for Bering Sea temperature variations from 1902-1967. Palaios 24, 406–12. doi: 10.2110/palo.2008.p2108-2116r
Hetzinger S., Halfar J., Zajacz Z., Wisshak M. (2019). Early start of 20th-century Arctic sea-ice decline recorded in Svalbard coralline algae. Geology 47 (10), 963–967. doi: 10.1130/G46507.1
Hofmann L. C., Schoenrock K., de Beer D. (2018). Arctic Coralline algae elevate surface pH and carbonate in the dark. Front.Plant Sci. 9. doi: 10.3389/fpls.2018.01416
Kinnard C., Zdanowicz C. M., Fisher D. A., Isaksson E., de Vernal A., Thompson L. G. (2011). Reconstructed changes in Arctic sea ice over the past 1,450 years. Nature 479, 509–512. doi: 10.1038/nature10581
Kremer B. P. (1981). Aspects of carbon metabolism in marine macroalgae. Oceanogr. Mar. Biol. Ann. Rev. 19, 41–94.
Leclerc N., Halfar J., Hetzinger S., Chan P. T. W., Adey W., Tsay A., et al. (2022a). Suitability of the coralline alga clathromorphum compactum as an Arctic archive for past sea ice cover. Paleocean. Paleoclim. 37, e2021PA004286. doi: 10.1029/2021PA004286
Leclerc N., Halfar J., Porter T. J., Black B. A., Hetzinger S., Zulian M., et al. (2022b). Utility of dendrochronology crossdating methods in the development of Arctic coralline red algae clathromorphum compactum growth increcement chronology for Sea ice cover reconstruction. Front. Mar. Sci. 9. doi: 10.3389/fmars.2022.923088
Meier W. N., Hovelsrud G. K., Van Oort B. E. H., Key J. R., Kovacs K. M., Michel C., et al. (2014). Arctic Sea ice in transformation: A review of recent observed changes and impacts on biology and human activity. Rev. Geophys. 52 (3), 185–217. doi: 10.1002/2013RG000431
Polyak L., Alley R. B., Andrews J. T., Brigham-Grette J., Cronin T. M., Darby D. A., et al. (2010). History of sea ice in the Arctic. Quat. Sci. Rev. 29 (15-16), 1757–1778. doi: 10.1016/j.quascirev.2010.02.010
Rasher D. B., Steneck R. S., Halfar J., Kroeker K. J., Ries J. B., Tinker M. T., et al. (2020). Keystone predators govern the pathway and pace of climate impacts in a subarctic marine ecosystem. Science 369, 1351–1354. doi: 10.1126/science.aav7515
Roberts R. D., Kühl M., Nøhr Glud R., Rysgaard S. (2002). Primary production of crustose coralline red algae in a high Arctic fjord. J. Phycol. 38 (2), 273–283. doi: 10.1046/j.1529-8817.2002.01104.x
Schweiger A. J., Wood K. R., Zhang J. (2019). Arctic Sea ice volume variability over 1901-2010: A model-based reconstruction. J. Clim. 32, 4731–4752. doi: 10.1175/JCLI-D-19-0008.s1
Stroeve J., Notz D. (2018). Changing state of Arctic sea ice across all seasons. Environ. Res. Lett. 13. doi: 10.1088/1748-9326/aade56
Stroeve J. C., Serreze M. C., Kay J. E., Holland M. M., Meier W. N., Barrett A. P. (2012). The arctic’s rapidly shrinking sea ice cover: a research synthesis. Clim. Change 110, 1005–1027. doi: 10.1007/s10584-011-0101-1
Westfield I., Gunnell J., Rasher D. B., Williams B., Ries J. (2022). Cessation of hardground accrection by the cold-water coralline algae clathromorphum compactum and clathromorphum nereostratum predicted within two centuries. Geochem. Geophy. Geosy. 23 (5). doi: 10.1029/2021GC009942
Williams S., Adey W., Halfar J., Kronz A., Gagnon P., Belanger D., et al. (2018). Effects of light and temperature on mg uptake, growth, and calcification in the proxy climate archive clathromorphum compactum. Biogeosciences 15, 5745–5759. doi: 10.5194/bg-15-5745-2018
Keywords: coralline algae, growth monitoring, calcification, sea ice proxy, high arctic
Citation: Gould J, Halfar J, Adey W and Ries JB (2022) Growth as a function of sea ice cover, light and temperature in the arctic/subarctic coralline C. compactum: A year-long in situ experiment in the high arctic. Front. Mar. Sci. 9:900033. doi: 10.3389/fmars.2022.900033
Received: 19 March 2022; Accepted: 21 July 2022;
Published: 15 August 2022.
Edited by:
Kathryn Schoenrock, National University of Ireland Galway, IrelandReviewed by:
Jan Marcin Weslawski, Polish Academy of Sciences, PolandRobert Steneck, University of Maine, United States
Copyright © 2022 Gould, Halfar, Adey and Ries. This is an open-access article distributed under the terms of the Creative Commons Attribution License (CC BY). The use, distribution or reproduction in other forums is permitted, provided the original author(s) and the copyright owner(s) are credited and that the original publication in this journal is cited, in accordance with accepted academic practice. No use, distribution or reproduction is permitted which does not comply with these terms.
*Correspondence: Jessica Gould, gould.je@northeastern.edu