
Flood Models: An Exploratory Analysis and Research Trends
by
 , , , and
Fernando Morante-Carballo
1,2,3 ,
,
Néstor Montalván-Burbano
1,4 ,
,
Mijaíl Arias-Hidalgo
5,6,
Luis Domínguez-Granda
2,6,
Boris Apolo-Masache
1,5,6,* and
and
Paúl Carrión-Mero
1,5,* 1
Centro de Investigaciones y Proyectos Aplicados a las Ciencias de la Tierra (CIPAT), Campus Gustavo Galindo, ESPOL Polytechnic University, Km 30.5 Vía Perimetral, Guayaquil P.O. Box 09-01-5863, Ecuador
2
Facultad de Ciencias Naturales y Matemáticas (FCNM), Campus Gustavo Galindo, ESPOL Polytechnic University, Km 30.5 Vía Perimetral, Guayaquil P.O. Box 09-01-5863, Ecuador
3
Geo-Recursos y Aplicaciones (GIGA), Campus Gustavo Galindo, ESPOL Polytechnic University, Km 30.5 Vía Perimetral, Guayaquil P.O. Box 09-01-5863, Ecuador
4
Department of Business and Economy, University of Almería, Ctra, Sacramento s/n, La Cañada de San Urbano, 04120 Almería, Spain
5
Facultad de Ingeniería en Ciencias de la Tierra, Campus Gustavo Galindo, ESPOL Polytechnic University, Km 30.5 Vía Perimetral, Guayaquil P.O. Box 09-01-5863, Ecuador
6
Centro del Agua y Desarrollo Sustentable (CADS), Campus Gustavo Galindo, ESPOL Polytechnic University, Km 30.5 Vía Perimetral, Guayaquil P.O. Box 09-01-5863, Ecuador
*
Authors to whom correspondence should be addressed.
Water 2022, 14(16), 2488; https://doi.org/10.3390/w14162488
Submission received: 2 June 2022
/
Revised: 30 July 2022
/
Accepted: 9 August 2022
/
Published: 12 August 2022
(This article belongs to the Special Issue Advances in Flood Frequency and Inundation Modeling: Application of Statistical, Hydrodynamic, Remote Sensing, and Machine Learning Tools)
Abstract
:Floods can be caused by heavy rainfall and the consequent overflow of rivers, causing low-lying areas to be affected. Populated regions close to riverbeds are the sectors most affected by these disasters, which requires modelling studies to generate different scenarios. The work focuses on the bibliometric analysis of the search for topics such as flood modelling focused on the research, risk, and assessment of these catastrophes, aiming to determine new trends and tools for their application in the prevention of these natural disasters. The methodology consists of: (i) search criteria and database selection, (ii) pre-processing of the selected data and software, and (iii) analysis and interpretation of the results. The results show a wide range of studies for dimensional analysis in different flood scenarios, which greatly benefit the development of flood prevention and risk strategies. In addition, this work provides insight into the different types of software and modelling for flood analysis and simulation and the various trends and applications for future modelling.
1. Introduction
Floods resulting from overflowing rivers, canals and high rainfall have caused various socio-economic and environmental problems and loss of life throughout history, as in the case of Thailand [1], Ganges (India) [2,3], Magdalena river (Colombia) [4], Niger (Niger and Nigeria) [5,6], and Elba (Italy) [7].
Due to the frequency and damage to life and ecosystem, and as mentioned by Lim and Foo [8], these events are one of the most devastating natural disasters worldwide (40% of the total), affecting more than 4.2 billion people and economic damages exceeding 2.97 trillion dollars in the last 20 years. These effects cause the displacement of populations to more protected areas, as in Africa [9]. There are also alterations in the different ecosystems or natural heritage sites protected by UNESCO. Arrighi [10] highlights that out of 1121 sites, 35% of natural areas and 21% of mixed (cultural and natural) sites are exposed to flooding, especially in Europe, North America, and Asia-Pacific.
These areas also experience the so-called monsoons, strong winds that cause rainfall at any time of the year, causing drastic changes in the climate and extending several kilometers, as is the case in the western North Pacific [11]. Moreover, these events can occur abnormally, which directly affects the ecosystem, inhabitants and the productive sector in times of drought and floods [12,13], encouraging the prediction of these events using different tools such as remote sensing [14].
Another factor involved in flooding is climate change, one of the main influences on sea-level rise, with the rate of inundation increasing over time, as does the demographic of the population [15,16]. Studies such as Johnston et al. [17], highlighting the effects of flooding on the coasts of the United States caused by storm surges, sea level and land subsidence due to overexploitation of aquifers, predict a significant increase of 61% in the risk of flooding for their inhabitants. In addition, this factor influences the proliferation of other natural phenomena such as the South American monsoon system [18] and the El Niño phenomenon, one of the natural events that contributes considerably to the generation of floods and damages thousands of victims [19].
Due to various factors, the majority of floods can be in different types, such as (i) fluvial floods, mainly by the overflowing of rivers caused by heavy rains or upstream dams [20,21]; (ii) pluvial floods, which occurs in highly saturated or impermeabilized terrain (e.g., urban areas), due to heavy rains even in the summer season by to monsoon winds [22,23,24]; (iii) flash floods, caused by the sudden increase in the intensity of the rains and the influence of groundwater recharge and the release of water stored in dikes or dams (natural or artificial), destroying the natural and anthropogenic environment due to the speed and force of water [25,26,27]; and (iv) coastal floods, generally caused by the action of the wind in the waves of the sea and the seismic movement under it (e.g., tsunami), causing flooding on the coastal edges of the continent [28,29]. These events affect coastal areas, which are the most densely populated and developed places globally, and the most intensely impacted by marine and river flooding [30].
The overflowing of canals, rivers and dykes due to high rainfall is one of the leading causes of flooding [31]. For this reason, different studies have been carried out to reduce their impact, such as the construction of a lateral flood overflow channel [32], allowing the recovery of river habitat and influencing the environmental impacts caused by hydropower dams [33]. Likewise, heavy rainfall and collapse of the sewage and stormwater systems in urban areas are the leading causes of flooding, and failures in the storage capacity of wastewater treatment plants, leading to environmental pollution due to overflowing [34,35].
In general, periodic flooding causes environmental and socio-economic problems in a given sector; however, it is considered part of a natural cycle that can generate environmental and social benefits in areas with water scarcity [36]. Therefore, it is necessary to generate models to prevent damage caused by floods and to encourage water management as a solution to drought problems [37].
To achieve this aspiration, and according to the systematic review by Teng et al. [36], several studies and method types of modelling have been carried out for decades about floods (see Table 1). These simulations require various inputs such as the use of DEMs [38,39], analysis of extreme rainfall events [40], geomorphic catchment parameters (soil type and storage porosity [41,42,43,44], land use variability, roughness [45]), satellite rainfall estimation [46], and combination of geometric, and hydrodynamic aspects [47,48].
In general, all these studies contribute efficiently to the present field. However, limited research has aimed to compile information through publishing statistics about on flood modelling analysis, and risk assessment. Therefore, one way to compile previous experiences and analyse their internal structure is using a bibliometric analysis, which allows observing the behavior of different disciplines within a given field of study. This way, one can assess multidisciplinary scientific production, explore potential research areas, and determine potential trends [49].
In this context, review and bibliometric work has been carried out, focusing on (Table 2):
All those reports were focused on floods, their analysis, and risk prevention. However, little is known about the interrelationship of conceptual and empirical models as optimal tools to evaluate flood risk. Hence, what are the issues, tools, and trends of flood modelling research through bibliometric analysis and mapping?
For this reason, this research aims to determine trends and tools of flood modelling through analysis and bibliometric mapping across the Scopus and Web of Science (WoS) databases, to implement methods, tools, and solutions to these natural disasters.
The content of this research consists of (i) a brief introduction of the topic of interest, its content and achievements throughout time, (ii) a description of the materials, computational tools and methods applied for data selection, downloading and processing, (iii) results and discussions of the findings, and (iv) concluding remarks.
2. Materials and Methods
Exploratory analysis of a field of study can occur through systematic reviews [53]. These studies make it possible to analyse the intellectual structure of an entire topic of interest and present reliable information on the most representative findings and recent studies [54,55]. Bibliometric studies have a rigorous and formal analysis similar to the systematic (traditional way), allowing the exploration of different areas of knowledge and determining research trends [49]. Thus, the study focuses on this latter.
2.1. Research Approach: Bibliometric Analysis
A bibliometric analysis involves implementing optimal tools or software for the management of an extensive database, which holds the bibliographic data of the thousands of documents linked to this area of study [56]. Furthermore, considering quantitative research due to the use of numerical data, based on statistics and content analysis of the interrelated documents, a cumulative knowledge system or network can be constructed by showing the themes, theories, methods, groups and research trends within a field of interest [57,58]. These studies are of most interest in various subject areas [59,60,61,62].
2.2. Research Method
To carry out the objective of this article, a methodological process consisting of three phases was established (Figure 1): (i) search and selection of data, (ii) pre-processing of data and software, and (iii) analysis and interpretation of results.
2.2.1. Phase I. Search and Selection of Data
The quest for appropriate terms for the bibliometric study focuses on keywords associated with flood modelling using a bibliographic review and expert elicitation. The work carried out in the present theme (Table 2) allowed us to determine terms such as “flood” [50,52], “inundation” [36] and “flooding” [51], to which we added the term “model” and its synonyms to refer to the study of flood modelling. Furthermore, similar to the study by Díez-Herrero and Garrote [50], the search adjusted with the terms “risk”, “analysis”, and “assessment” with the objective of FRAs, which focus on reducing probability, risk and vulnerability to floods [63].
Researchers can download academic information from different databases like Google Scholar, Microsoft Academic, Scopus, Dimensions, Web of Science (WoS), and COCI from OpenCitations, multidisciplinary platforms with many documents commonly cited [64]. Therefore, based on the bibliographic review (Table 2), this study focuses on analyzing the data collected from Scopus and WoS. This decision is because those are multidisciplinary databases covering most internationally reputed peer-reviewed articles and journals [65,66,67]; they have an extensive field of analysis and are the most widely used within statistical automated literature review [68,69].
To fulfil the objective of this study, the search equation based on titles, abstracts and keywords exposed with the inclusion of Boolean operators: (TITLE-ABS-KEY (“flood model*”) OR TITLE-ABS-KEY (“flood modelling*”) OR TITLE-ABS-KEY (“inundation model*”) OR TITLE-ABS-KEY (“inundation modelling*”) OR TITLE-ABS-KEY (“flood inundation modelling*”)) AND (TITLE-ABS-KEY (“assessment*”) OR TITLE-ABS-KEY (“risk*”) OR TITLE-ABS-KEY (“analysis*”)).
Table 3 shows the number of publications for each keyword:
The search was carried out for all types of documents in April 2022 (albeit up to December 2021) and obtained 2070 publications in Scopus and 1494 in WoS, with their respective year of publication.
2.2.2. Phase II. Pre-Processing of Data and Software
From phase I, a resulting text file format (.txt) consolidated the information from Scopus and WoS. It contains the data of each publication, such as authors’ names, references, affiliations, number of citations, title and year of publication, which are necessary for a bibliometric analysis [70,71]. Nevertheless, this information requires pre-processing in different programs before bibliometric analysis, such as:
- ➢
- A combination of databases, was carried out through Bibliometrix 3.1 in RStudio programming language (version 4.1.2), obtaining a single record of the entire study area and using it for the bibliometric analysis [72].
- ➢
- Data cleaning, Microsoft Excel software (version 2021) used to read and modify the extracted “.xls” file, adjusting its content and eliminating non-useful information such as publications without authors and duplicate doi. In addition, this analysis focuses on publications in English because this language represents 92% of the entire database [73,74].
- ➢
- Bibliometric mapping, performed in Biblioshiny. It is a bibliometrix interface that allows the inclusion of bibliographic information from various databases such as Scopus, WoS, Dimensions, PubMed, and Cochrane [75]. This very recent package is also part of the R language, used for bibliometric and scientometric research [72,76,77,78].
2.2.3. Phase III. Analysis and Interpretation of Results
This paper examines the interactive graphics that represent the two main pillars of this bibliometric analysis:
- (1)
- (2)
3. Results
There were 2290 publications coming from the Scopus and WoS databases, where 1274 documents represented the combined database (Figure 2). To improve the quality of the information, this file was filtered in Microsoft Excel, excluding publications that either were not in English, with duplicate doi, or with missing information as authors, keywords, title, doi and abstract. Moreover, Figure 3 shows the content or contribution of each database, resulting in 2136 used publications.
Table 4 presents the general information from the two databases used to analyse the two bibliometric approaches (performance analysis and mapping of the intellectual structure).
3.1. Performance Analysis
3.1.1. Scientific Production and Development
Figure 4 shows the exponential growth of scientific production from 1972 to 2021. In that regard, according to Price’s Law [83], it can be established that this field of this study has promising research potential. During the period 2005–2021 there is a remarkable increase in production.
The study reviews 50 years of historical record; thus, the analysis focused on three critical periods strategically distributed according to the change in visible curvatures (Figure 4):
- Period I (1972–1994) has negligible growth due to only 29 publications in the first 23 years of study, referring to a nearly constant introduction and production stage, focusing on the generation of stochastic models based on mathematical and probabilistic formulations applied to the principle of continuity [84,85]. These models initiated the flood risk analysis, using extreme values of rainfall and runoff and associating them to a return period through methods such as Poisson’s [86,87]. However, in discrete models, Bayesian methods were used for better accuracy of the results, to avoid a linear relationship between the calculations and the input parameters [88,89];
- Period II (1995–2005) has 114 publications and linear growth during the following eleven years of study. It focuses on a phase of development and evolution of modelling, focusing on urban areas and 1D-2D hydrodynamic simulations [90,91], allowing for analysis of their effects and establishing prevention measures [92]. Since this period, different computational tools and devices have been used, which facilitate the collection and resolution of data for better accuracy of the simulations, for example, the use of Light Detection And Ranging (LIDAR) [93,94], essential for the optical resolution and digital construction of the terrain; and
- Period III (2006–2021) has an exponential growth due to the development of 1993 publications in the last 16 years, focusing on the development of mathematical, distributed and hydraulic modelling. These models at the beginning of the study and this stage relates to 1D and 2D (fluvial and coastal) shallow flood simulations [95], risk analysis, socio-economic consequences and morphological and hydrological data of the watersheds [96], further including 3D analysis in coastal systems and estuarine environments [97,98]. Furthermore, this period highlights the technological growth and the use of remote sensing in a more progressive way than in the previous period, with more powerful computational tools and modelling methods used for a better quality of results [36,99], as well as media as data sources [100,101]. In this context, significant advances have been made over the last decade, highlighting its impact on society worldwide [102,103], focusing mainly on the analysis and assessment of flood risks caused by climate change [104]. These are addressed through flood mapping to identify the most susceptible areas (local/global) and provide guidelines for forecasting and future risk assessment [105,106].
3.1.2. Cross-Country Scientific Contribution
The interrelationship between countries provides insight into knowledge development through collaboration between authors globally [107]. In this field of interest, 95 countries have collaborated in this field of research. From those, 50 countries have at least five articles in collaboration with others. In Figure 5, contributions appear in a range of colors (from deep blue to light blue).
The main contributor are institutions from the United States (USA), with 797 publications. In addition, the USA has collaborated with 51 countries in different topics such as the application of new methods for urban flood modelling [108], large-scale forecasting [109] and improvement of the spatio-temporal resolution of data [110]. Among these countries, participation with the United Kingdom, China, and Italy in various research studies such as coastal flood risk is noteworthy [111].
The second-largest contributor is the United Kingdom (UK), with 596 publications. They have cooperated with 38 countries on a wide range of research, including remote tool evaluation and resolution improvement in urban areas [112,113], as well as continental and global scale forecasting [109,114]. However, like the USA and China (third contributor with 455 publications), there is a similar interest in climate change and flood propagation [115]. In addition, China has collaborated with 34 countries, focusing on topics such as the assessment of flooding under extreme historical rainfall conditions [116], the recording of historical data for use and corroboration of results [117], and the evaluation of global modelling through satellite information [118].
In addition, Figure 6 shows the scientific collaboration in terms of citations. The United Kingdom presents 9305 citations due to the cooperation of its researchers with different academic institutions, followed by the United States and the Netherlands.
3.1.3. Featured Authors
By means of this kind of analysis, it was possible to know individually the researchers who have provided valuable information through these studies [119,120], in which there is a total of 5649 authors. Figure 7 is a statistical graph over time, showing the ten most productive and cited authors during this study period.
The top ten authors in this field have the following affiliations: University of Bristol (UK), University of California-Irvine (USA), Loughborough University (UK), European Centre for Medium-Range Weather Forecasts (UK), University of Science and Technology of China, University of Southampton (UK) y Ruhr-Universitat Bochum (Germany).
Overall, this range of contributors dates from 1999 to 2021, with Bates P. making the most significant scientific contribution (79 papers) and 1181 citations. His contributions began with a focus on river flow dynamics and floodplain dynamics [121]. Over the last decade, he has developed equations for a two-dimensional model [95]. In addition, in collaboration with other authors, Bates identified key challenges such as global terrain data, extreme flow generation, global river network and geometry, flood defenses, computational hydraulic engine and automation framework [122] (p. 3). In addition, Neal J. (45 papers and 434 citations) and Schumann G. (24 papers and 242 citations) have had a near-constant output since 2007 and maintain collaboration with Bates.
Table 5 shows the ten researchers with the highest number of citations, focusing on publications related to this field of study. These authors belong to countries such as the United Kingdom and the United States, which have the highest number of publications and citations worldwide, corroborating the previous results. Finally, the H-Index shows the authors’ impact, which corresponds to the ratio between the number of global citations and all the publications made, highlighting Beven K., Bates P. and Pappenberger F.
3.2. Mapping of the Intellectual Structure
3.2.1. Author Keyword Conceptual Structure
A clustering method based on Callon’s centrality and density within a matrix [123] was applied, to perform in-depth exploration of the issues involved in flood modelling. In that context, four different quadrants were explored, focusing on: (i) important and developed themes with strong linkages (driving themes), (ii) isolated and high centrality themes, (iii) emerging or declining themes and (iv) core and cross-cutting themes [124].
In period I, only the keyword “flood” is found as the driving theme that initiated this field of study. In contrast, in period II, its development or communication flow is integrated with other driving themes (Figure 8b), which would imply that research containing these words showed a more essential dominance in the study of that period. For example, the studies focused on land use change and the generation of digital terrain models (DEM) through LIDAR images, focusing on improving spatial resolution, determining the changes of that time, and predicting different events until the present. However, some themes had little influence and are almost in equilibrium between development and relevance degree (density and centrality). For example, since 2006, “remote sensing” (frequency: 74) and “gis” (69) have been integrated with “flood modelling” (361) (Figure 8c), which have moved from being essential to driving themes for monitoring satellite data and impact prediction [125,126]. Topics such as “flood” (240), “modelling” (46), “urban flood” (99) and “flood risk management” (42) show an increase in density together with several keywords from the previous period, raising their scientific interest from basic topics to the area close to the motor topics. Likewise, compared to the last period, there are topics such as “coastal flood” (45) that have decreased the degree of relevance, located in an isolated area of research with “sea-level rise” (30) and “storm surge” (30). Conversely, “flood risk” (94), “climate change” (76) and “flood hazard” (60) were found as emerging topics given their increased frequency and interest in different areas, providing research that focuses on atmospheric changes and their influence on floods.
It is essential to mention that the most current and representative topics of the evolution of this field of study are found in the last period. Hydrodynamic modelling is a fundamental topic linked to urban areas, so it is an appropriate method to simulate floods and analyze fluid dynamics, allowing better flood risk management in these sectors. This model method allows associating the movement of the flow in different dimensions (1D, 2D and 3D) through mathematical models for the prediction, analysis and simulation of various events. Hec-Ras (58) is a computational tool located in the center of the graph (Figure 8c), as well as “hydrological modelling” (43) and “hydraulic modelling” (63). Hec-Ras allows modelling floods; on the other hand, “hydrological modelling” and “hydraulic modelling”, due to the mentioned location, indicate that these issues are essential and are in force.
3.2.2. Author Keyword Trend Topics
This analysis makes it possible to know the field evolution of study according to the frequency of the main topics of interest [71]. Figure 9 shows the thematic development based on three keywords per year, located in the period with the most frequently developing research.
The topics with the most extended period correspond to studies related to dam break, “calibration” and the use of “gis”. In contrast, the issues with the shortest period represent recent studies such as “machine learning” and “hec-ras”.
In a nutshell, this analysis leads to the observed flood modelling (hydrodynamic and hydraulic) through various implements. Examples are the Digital Elevation Model (DEM) [127], Geographic Information Systems (GIS) [128] and remote sensing [36], as well as computational tools such as tools for risk and hazard analysis of these disasters that are being affected by climate change [129]. Moreover, machine learning is a computational method recently designed for this type of study [130]. As a result, different flood scenarios have been developed, and the suitable solutions for a given environment have been applied [131].
3.2.3. Trend Scientific Production
The Sankey diagram was utilized to understand the conceptual structure and evolution of the research area by preserving the flow of communication between the different fields [132]. In this way, based on a three-field plot, the interaction between three different categories and their communication flow (from left to right) was identified [71,133], showing the main themes of interest that link through 12 variables in each field established.
The authors visible in the AU column (Figure 10) collaborate with the United Kingdom (UK), where studies have focused on representative topics such as “flood modelling”, “flood risk”, “hydraulic modelling”, “urban flood” and “climate change”. Bates P. is the lead author of this field of study, collaborating with these countries except Korea and France.
4. Discussion
The evaluation of 50 years of scientific production in Scopus and WoS (1972–2021) identified three periods of publications representing 2136 documents. In Periods I and II (1972–2005, see Figure 4), studies were conducted on urban flooding, especially in disaster management and prevention, using models that have evolved in different dimensional approaches [90,91,92]. Since 2006 (Period III), the technological growth and use of remote sensing [36,93,99,134] allowed scientific production to increase by 93%.
4.1. Scientific Contribution by Country
Ninety-five countries have participated in this research topic. The United States stood out on top of with 797 publications and collaborated with 51 countries (Figure 5). These numbers are in agreement with other bibliometric studies on flooding [50,51,52]. Publications from this country are mainly related to modelling using GIS applications [135], LIDAR data [136] and high-resolution topography [137]. These have allowed the establishment of strategies for the management and prevention of floods that generate economic and human losses, especially in urban areas [138,139,140], and in different circumstances, such as tsunamis [141,142,143] and the effects of climate change [144,145,146,147]. In the impact analysis based on the number of citations (Figure 6), the United Kingdom is the country with the highest number (9305 in 596 publications) due to several studies such as the formulation of new equations for two-dimensional modelling [95], climate change and wetland loss [148], urban flood [134] and high-resolution hazard modelling at a global level [122].
4.2. Scientific Contribution by Authors
An analysis by authors worldwide indicates that there are three influential authors (Figure 7), researchers from the University of Bristol (United Kingdom) who have a large number of publications: (i) Bates P. (79 publications and 1181 citations), has been cited since 1999 on topics such as the application, development and challenges encompassing flood models [89,95,122,149]; (ii) Neal J. (45 publications and 434 citations), has focused on similar topics as Bates such as the application of two-dimensional models and flood mapping [150,151]; while (iii) Schumann G. (24 publications and 242 citations) is related to the previous researchers in the modelling of large-scale forecasts, in collaboration with other countries such as the USA and China [151]. In contrast, a citation analysis (Table 5) shows the integration of other researchers, such as Horritt M. and Fewtrell T. They are involved in several research projects mentioned above by researchers from the University of Bristol (Bates P., Neal J. and Schumann G.).
4.3. Analysis of Issues, Tools and Trends
Topics such as “flood” and “modelling” are essential topics relevant over time (Figure 8b). However, when combined they link to “flood modelling” (especially during the last decade), generating important research (Figure 9). The application and analysis of flood modelling allows one to support and quantify the effects caused by these disasters, facilitating the study of floods for damage prevention [95,134,152]. This topic started as a basic theme in flood forecasting and uncertainty (Figure 8b), developing in recent years as a driving theme within this field of study (Figure 8c).
Among the different modelling approaches is “hydraulic modelling”, with an increase similar to “GIS” (Figure 9), which denotes its link to flooding and damage prevention issues [153,154,155]. Another theme is “hydrodynamic modelling”, highlighted in the last decade (Figure 9). This links with an in-depth analysis of dynamic factors in floods, achieving assessments in the large floodplain and riverine areas [21,127,156], where “hec-ras” is an essential hydrodynamic modelling tool for these analyses. Based on a similar study, Teng et al. [36] mentioned the importance of this modelling for assessing the impact of tsunamis, dam failures or flash floods.
The use of various tools allows the generation of models and simulations, such as “gis”, which allows the processing of the information collected on rainfall, elevations, slopes, land use and geology [135,152,157], managing to generate thematic maps that show the vulnerable areas according to the flood probability index [91,158]. This tool has a long period of study (Figure 9), evolving from a basic theme to a driving theme within this field (see Figure 8b,c). Another computational tool is “hec-ras”, in which floods can be simulated and analyzed from different perspectives (Figure 8c) [159], as well as bringing together different modelling approaches for flood hazard analysis (see Figure 8c) [160]. From the second decade of the 21st century, this software has gained relevance in research on modelling types for flood hazard and risk assessment [128,161,162,163]. In the case of hec-ras [164], this could be due to its ease of use, free-license nature, especially in developing countries, compared to commercial or other similar computational packages.
The term “calibration” has been a constant topic for almost ten years (Figure 9). This is an indispensable tool and a fundamental requirement for the successful application of inundation models [165], mainly to increase the degree of reliability of results in these events (e.g., calibration of the Manning’s coefficient [166,167]). On the other hand, remote sensing has improved the resolution and extent of models and further risk evaluation, generating susceptibility maps for flood triggers [152,168,169,170]. This growth has been most evident since 2012 (Figure 9) and the linkage with various countries (Figure 10).
Climate change is related to the spread and increase of natural disasters [145,171], which are caused by variations in sea level, cyclonic tides, precipitation [172,173,174] and the variability of extreme events [104,175,176]. Furthermore, this topic can be considered an emerging theme due to the increase in research on flood modelling since 2014 (Figure 9), as evidenced by the scientific interest of several countries and researchers (see Figure 10), and the linking of flood risk and hazard analysis to these natural changes (Figure 8c). Therefore, their study is essential for the management and development of preventive strategies, reducing their impact on populated and environmentally vulnerable areas [177,178,179,180].
In the last three years of study, the term “machine learning” (Figure 9) benefits and increases the knowledge of flood simulations in a more automated way [131]. Moreover, it generates greater profitability and efficiency in flood forecasting, providing the model with autonomous development through a database and a set of algorithms such as artificial neural networks [181]. Also, since 2014, terms such as “urban flood” and “flash flood” have emerged that are driven mainly by the extreme rainfall of “climate change”, highlighting the importance of flash flood analysis and prevention in urbanized areas, linking to the previous terms “dam break” [40,182], which have remained constant over time in this field of study (Figure 9). The latter has been reflected in the application of hydrodynamic modelling, as studied by Teng et al. [36].
5. Conclusions
This study shows the development and evolution of this field of research, which relates to floods from a modelling perspective. This topic is considered a means for risk analysis and developing strategies for managing and evolving these events. Scientific production increased from 2006 onwards by formulating new equations for 1D and 2D flood modelling. In general, there are several issues for flood modelling that are of interest to academia: (i) the causes of climate change; (ii) effects on wetland loss; (iii) mapping of susceptibility zones; and (iv) application of new computer modelling tools in affected areas (urban areas, flood plains, levees, among others).
The United States has the largest distribution of researchers (Figure 5), which shows collaboration with more than 50% of countries publishing in this field. In contrast, when looking at the analysis by citations, most researchers belong to the United Kingdom with more than 596 publications (Table 4). However, these publications have a relationship with authors from the USA.
Various computational tools allow the generation of flood models, focusing on hydrology, hydraulics and hydrodynamics, generating event simulation, strategy planning, management and damage prevention. However, in this study, it has been determined that hydrodynamic modelling has a broad scientific interest worldwide through several researchers due to the analysis of the fluid dynamics in these disasters, which allows to have results more in line with reality.
Global study trends focused on:
- Flash floods have a more significant impact on urban areas due to the speed of propagation, economic damage, loss of human lives and triggering factors such as tsunamis or dam failures;
- Flood risk and hazard are analysis subjects through modelling for management and preventive strategies;
- Dam failures, with a focus on the impacts on urban areas due to their economic impact on society;
- Climate change is an important issue linked to flood modelling due to changes in the nature and the increased frequency of extreme events;
- Hydraulic and hydrodynamic modelling. Modelling topics focus on the controlling factors and aspects that cause floods. They also focus on flow dynamics in urban areas and river floodplains; and
- Machine learning is applied to flood modelling using a set of state-of-the-art data drive and black box algorithms to obtain reliable and accurate results, competing with physically based and hybrid (gray box) models.
- The computer tools with the most significant application in this field of study are:
- Geographic Information Systems (GIS) allowing the processing and mapping of flood-prone areas through hydrological and hydraulic data in a given area;
- Hec-Ras as an open-access multidisciplinary computational tool with a broad domain in modelling issues due to its versatility, free cost, and application in different dimensional approaches; and
- Remote sensing is essential for obtaining information that is difficult to access, improving the quality of results and extending the study area. Among the main derived products are Digital Elevation Models (DEM), soil type and land use maps, which are essential in developing simulations and analyses on various topics such as flooding, widely used in computational packages such as GIS and Hec-Ras.
The contribution of this study focuses on: (i) the opportunity to learn about the scientific collaboration between countries and authors, allowing the identification of recognized researchers in flood modelling, (ii) the most widely used models in the prevention and analysis of these disasters, (iii) the identification of the most relevant trends or research topics in this field of study, and (iv) efficient computational tools for obtaining reliable and accurate results.
Author Contributions
Conceptualization, P.C.-M., N.M.-B., F.M.-C., L.D.-G., M.A.-H. and B.A.-M.; methodology, P.C.-M., N.M.-B., F.M.-C. and B.A.-M.; software, N.M.-B. and B.A.-M.; validation, N.M.-B. and B.A.-M.; formal analysis, P.C.-M., N.M.-B., F.M.-C., L.D.-G., M.A.-H. and B.A.-M.; investigation, P.C.-M., N.M.-B., F.M.-C., L.D.-G., M.A.-H. and B.A.-M.; data curation, N.M.-B. and B.A.-M.; writing—original draft preparation, P.C.-M., N.M.-B., F.M.-C., L.D.-G., M.A.-H. and B.A.-M.; writing—review and editing, P.C.-M., N.M.-B., F.M.-C., L.D.-G., M.A.-H. and B.A.-M.; visualization, N.M.-B. and B.A.-M.; supervision, P.C.-M. and F.M.-C. All authors have read and agreed to the published version of the manuscript.
Funding
This research received no external funding.
Institutional Review Board Statement
Not applicable.
Informed Consent Statement
Not applicable.
Data Availability Statement
Not applicable.
Acknowledgments
This research study was possible with the valuable contribution of the “Registry of geological and mining heritage and its impact on the defense and preservation of geodiversity in Ecuador. Code: CIPAT-01-2018” and “Management and Evaluation of Scientific Research in Earth Sciences, Economy, Administration and its links with Society. Code: CIPAT-7-2022” academic research projects by ESPOL University and the support of Geo-resources and Applications GIGA, ESPOL. In addition, “Floodplain management in a context of global change. Code: FCV-24-2021” academic research projects by ESPOL University and AVSF-COSTEA Agency.
Conflicts of Interest
The authors declare no conflict of interest.
References
- Loc, H.H.; Park, E.; Chitwatkulsiri, D.; Lim, J.; Yun, S.-H.; Maneechot, L.; Phuong, D.M. Local rainfall or river overflow? Re-evaluating the cause of the Great 2011 Thailand flood. J. Hydrol. 2020, 589, 125368. [Google Scholar] [CrossRef]
- Wasson, R.; Sundriyal, Y.; Chaudhary, S.; Jaiswal, M.K.; Morthekai, P.; Sati, S.; Juyal, N. A 1000-year history of large floods in the Upper Ganga catchment, central Himalaya, India. Quat. Sci. Rev. 2013, 77, 156–166. [Google Scholar] [CrossRef]
- Auerbach, L.; Goodbred, S., Jr.; Mondal, D.; Wilson, C.; Ahmed, K.; Roy, K.; Steckler, M.; Small, C.; Gilligan, J.; Ackerly, B. Flood risk of natural and embanked landscapes on the Ganges–Brahmaputra tidal delta plain. Nat. Clim. Chang. 2015, 5, 153–157. [Google Scholar] [CrossRef]
- Moreno, J.; Sánchez, J.; Espitia, H. Optimization of a fuzzy model used for the prevention of floods in homes surrounding zones of risk in the river Magdalena. J. Intell. Fuzzy Syst. 2020, 39, 4533–4546. [Google Scholar] [CrossRef]
- Aich, V.; Liersch, S.; Vetter, T.; Fournet, S.; Andersson, J.C.; Calmanti, S.; van Weert, F.H.; Hattermann, F.F.; Paton, E.N. Flood projections within the Niger River Basin under future land use and climate change. Sci. Total Environ. 2016, 562, 666–677. [Google Scholar] [CrossRef] [PubMed]
- Ologunorisa, T.E.; Adeyemo, A. Public Perception of Flood Hazard in the Niger Delta, Nigeria. Environmentalist 2005, 25, 39–45. [Google Scholar] [CrossRef]
- Pranzini, E.; Rosas, V.; Jackson, N.L.; Nordstrom, K.F. Beach changes from sediment delivered by streams to pocket beaches during a major flood. Geomorphology 2013, 199, 36–47. [Google Scholar] [CrossRef]
- Lim, K.Y.; Foo, K.Y. A State-of-the-Art Review on the Unique Characteristics, Key Driving Causes and Mitigation Measures of the World Catastrophic Flood Disasters. In A System Engineering Approach to Disaster Resilience, Proceedings of the Virtual Conference on Disaster Risk Reduction (VCDRR 2021), Online Conference, 15–20 March 2021; Springer: Berlin/Heidelberg, Germany, 2022; pp. 229–246. [Google Scholar] [CrossRef]
- Kakinuma, K.; Puma, M.J.; Hirabayashi, Y.; Tanoue, M.; Baptista, E.A.; Kanae, S. Flood-induced population displacements in the world. Environ. Res. Lett. 2020, 15, 124029. [Google Scholar] [CrossRef]
- Arrighi, C. A Global Scale Analysis of River Flood Risk of UNESCO World Heritage Sites. Front. Water 2021, 3, 192. [Google Scholar] [CrossRef]
- Chou, C.; Huang, L.-F.; Tseng, L.; Tu, J.-Y.; Tan, P.-H. Annual Cycle of Rainfall in the Western North Pacific and East Asian Sector. J. Clim. 2009, 22, 2073–2094. [Google Scholar] [CrossRef]
- Shukla, R.P.; Shin, C. Distinguishing Spread Among Ensemble Members Between Drought and Flood Indian Summer Monsoon Years in the Past 58 Years (1958–2015) Reforecasts. Geophys. Res. Lett. 2020, 47, e2019GL086586. [Google Scholar] [CrossRef]
- Gadgil, S.; Gadgil, S. The Indian monsoon, GDP and agriculture. Econ. Polit. Wkly. 2006, 41, 4887–4895. [Google Scholar]
- Sanyal, J.; Lu, X.X. Application of Remote Sensing in Flood Management with Special Reference to Monsoon Asia: A Review. Nat. Hazards 2004, 33, 283–301. [Google Scholar] [CrossRef]
- Hauer, M.E.; Hardy, D.; Kulp, S.A.; Mueller, V.; Wrathall, D.J.; Clark, P.U. Assessing population exposure to coastal flooding due to sea level rise. Nat. Commun. 2021, 12, 6900. [Google Scholar] [CrossRef] [PubMed]
- Neumann, B.; Vafeidis, A.T.; Zimmermann, J.; Nicholls, R.J. Future Coastal Population Growth and Exposure to Sea-Level Rise and Coastal Flooding—A Global Assessment. PLoS ONE 2015, 10, e0131375. [Google Scholar] [CrossRef]
- Johnston, J.; Cassalho, F.; Miesse, T.; Ferreira, C.M. Projecting the effects of land subsidence and sea level rise on storm surge flooding in Coastal North Carolina. Sci. Rep. 2021, 11, 21679. [Google Scholar] [CrossRef]
- Teodoro, T.A.; Reboita, M.S.; Llopart, M.; da Rocha, R.P.; Ashfaq, M. Climate Change Impacts on the South American Monsoon System and Its Surface–Atmosphere Processes Through RegCM4 CORDEX-CORE Projections. Earth Syst. Environ. 2021, 5, 825–847. [Google Scholar] [CrossRef]
- Ciprian, F.A.G.; Luque, A.V.L.; Polo, J.E.R. Gestión de la ayuda humanitaria ante inundaciones causadas por el Fenómeno del Niño, mediante la óptima localización de sensores en las quebradas y ríos—caso del desborde del río Piura. In Engineering, Integration, and Alliances for a Sustainable Development. Hemispheric Cooperation for Competitiveness and Prosperity on a Knowledge-Based Economy, Proceedings of the 18th LACCEI International Multi-Conference for Engineering, Education and Technology, Online Conference, 27–31 July 2020; LACCEI: Buenos Aires, Argentina, 2020. [Google Scholar] [CrossRef]
- Ge, J.; Zhang, J.; Chen, C.; Ding, P. Impacts of fluvial flood on physical and biogeochemical environments in estuary–shelf continuum in the East China Sea. J. Hydrol. 2021, 598, 126441. [Google Scholar] [CrossRef]
- Xia, X.; Liang, Q.; Ming, X. A full-scale fluvial flood modelling framework based on a high-performance integrated hydrodynamic modelling system (HiPIMS). Adv. Water Resour. 2019, 132, 103392. [Google Scholar] [CrossRef]
- Lompi, M.; Tamagnone, P.; Pacetti, T.; Morbidelli, R.; Caporali, E. Impacts of Rainfall Data Aggregation Time on Pluvial Flood Hazard in Urban Watersheds. Water 2022, 14, 544. [Google Scholar] [CrossRef]
- Francipane, A.; Pumo, D.; Sinagra, M.; La Loggia, G.; Noto, L.V. A paradigm of extreme rainfall pluvial floods in complex urban areas: The flood event of 15 July 2020 in Palermo (Italy). Nat. Hazards Earth Syst. Sci. 2021, 21, 2563–2580. [Google Scholar] [CrossRef]
- Hjelmstad, A.; Shrestha, A.; Garcia, M.; Mascaro, G. Propagation of radar rainfall uncertainties into urban pluvial flood modeling during the North American monsoon. Hydrol. Sci. J. 2021, 66, 2232–2248. [Google Scholar] [CrossRef]
- Zhai, X.; Guo, L.; Liu, R.; Zhang, Y. Rainfall threshold determination for flash flood warning in mountainous catchments with consideration of antecedent soil moisture and rainfall pattern. Nat. Hazards 2018, 94, 605–625. [Google Scholar] [CrossRef]
- Philipp, A.; Grundmann, J. Integrated Modeling System for Flash Flood Routing in Ephemeral Rivers under the Influence of Groundwater Recharge Dams. J. Hydraul. Eng. 2013, 139, 1234–1246. [Google Scholar] [CrossRef]
- Perucca, L.P.; Angillieri, M.Y.E. Evolution of a debris-rock slide causing a natural dam: The flash flood of Río Santa Cruz, Province of San Juan—November 12, 2005. Nat. Hazards 2009, 50, 305–320. [Google Scholar] [CrossRef]
- Idier, D.; Pedreros, R.; Rohmer, J.; Le Cozannet, G. The Effect of Stochasticity of Waves on Coastal Flood and Its Variations with Sea-level Rise. J. Mar. Sci. Eng. 2020, 8, 798. [Google Scholar] [CrossRef]
- Esteban, M.; Takagi, H.; Mikami, T.; Aprilia, A.; Fujii, D.; Kurobe, S.; Utama, N.A. Awareness of coastal floods in impoverished subsiding coastal communities in Jakarta: Tsunamis, typhoon storm surges and dyke-induced tsunamis. Int. J. Disaster Risk Reduct. 2017, 23, 70–79. [Google Scholar] [CrossRef]
- Favaretto, C.; Martinelli, L.; Ruol, P. Coastal Flooding Hazard Due to Overflow Using a Level II Method: Application to the Venetian Littoral. Water 2019, 11, 134. [Google Scholar] [CrossRef]
- Nagumo, N.; Ohara, M.; Kuribayashi, D.; Sawano, H. The 2015 Flood Impact due to the Overflow and Dike Breach of Kinu River in Joso City, Japan. J. Disaster Res. 2016, 11, 1112–1127. [Google Scholar] [CrossRef]
- Fares, Y.R.; Herbertson, J.G. Behaviour of flow in a channel bend with a side overflow (flood relief) channel. J. Hydraul. Res. 1993, 31, 383–402. [Google Scholar] [CrossRef]
- Scruton, D.A.; Clarke, K.D.; Roberge, M.M.; Kelly, J.F.; Dawe, M.B. A case study of habitat compensation to ameliorate impacts of hydroelectric development: Effectiveness of re-watering and habitat enhancement of an intermittent flood overflow channel. J. Fish Biol. 2005, 67, 244–260. [Google Scholar] [CrossRef]
- Abbasi, H.; Zeynolabedin, A.; Bidhendi, G.N. Assessment of combined sewer overflows impacts under flooding in coastal cities. J. Water Clim. Chang. 2021, 12, 2460–2478. [Google Scholar] [CrossRef]
- Tao, J.; Li, Z.; Peng, X.; Ying, G. Quantitative analysis of impact of green stormwater infrastructures on combined sewer overflow control and urban flooding control. Front. Environ. Sci. Eng. 2017, 11, 11. [Google Scholar] [CrossRef]
- Teng, J.; Jakeman, A.J.; Vaze, J.; Croke, B.F.W.; Dutta, D.; Kim, S. Flood inundation modelling: A review of methods, recent advances and uncertainty analysis. Environ. Model. Softw. 2017, 90, 201–216. [Google Scholar] [CrossRef]
- Carrión-Mero, P.; Morante-Carballo, F.; Vargas-Ormaza, V.; Apolo-Masache, B.; Jaya-Montalvo, M. A Conceptual Socio-Hydrogeological Model Applied to Sustainable Water Management. Case Study of the Valdivia River Basin, Southwestern Ecuador. Int. J. Sustain. Dev. Plan. 2021, 16, 1275–1285. [Google Scholar] [CrossRef]
- Zhang, Y. Using LiDAR-DEM based rapid flood inundation modelling framework to map floodplain inundation extent and depth. J. Geogr. Sci. 2020, 30, 1649–1663. [Google Scholar] [CrossRef]
- Sanders, B.F. Evaluation of on-line DEMs for flood inundation modeling. Adv. Water Resour. 2007, 30, 1831–1843. [Google Scholar] [CrossRef]
- Elfeki, A.; Masoud, M.; Niyazi, B. Integrated rainfall–runoff and flood inundation modeling for flash flood risk assessment under data scarcity in arid regions: Wadi Fatimah basin case study, Saudi Arabia. Nat. Hazards 2017, 85, 87–109. [Google Scholar] [CrossRef]
- Ayoub, V.; Delenne, C.; Chini, M.; Finaud-Guyot, P.; Mason, D.; Matgen, P.; Maria-Pelich, R.; Hostache, R. A porosity-based flood inundation modelling approach for enabling faster large scale simulations. Adv. Water Resour. 2022, 162, 104141. [Google Scholar] [CrossRef]
- Ferrari, A.; Viero, D.P.; Vacondio, R.; Defina, A.; Mignosa, P. Flood inundation modeling in urbanized areas: A mesh-independent porosity approach with anisotropic friction. Adv. Water Resour. 2019, 125, 98–113. [Google Scholar] [CrossRef]
- Carrión-Mero, P.; Morante-Carballo, F.; Briones-Bitar, J.; Herrera-Borja, P.; Chávez-Moncayo, M.; Arévalo-Ochoa, J. Design of a Technical-Artisanal Dike for Surface Water Storage and Artificial Recharge of the Manglaralto Coastal Aquifer. Santa Elena Parish, Ecuador. Int. J. Sustain. Dev. Plan. 2021, 16, 515–523. [Google Scholar] [CrossRef]
- Herrera-Franco, G.; Carrión-Mero, P.; Aguilar-Aguilar, M.; Morante-Carballo, F.; Jaya-Montalvo, M.; Morillo-Balsera, M. Groundwater Resilience Assessment in a Communal Coastal Aquifer System. The Case of Manglaralto in Santa Elena, Ecuador. Sustainability 2020, 12, 8290. [Google Scholar] [CrossRef]
- Praskievicz, S.; Carter, S.; Dhondia, J.; Follum, M. Flood-inundation modeling in an operational context: Sensitivity to topographic resolution and Manning’s n. J. Hydroinform. 2020, 22, 1338–1350. [Google Scholar] [CrossRef]
- Yoshimoto, S.; Amarnath, G. Applications of Satellite-Based Rainfall Estimates in Flood Inundation Modeling—A Case Study in Mundeni Aru River Basin, Sri Lanka. Remote Sens. 2017, 9, 998. [Google Scholar] [CrossRef]
- Sharma, V.C.; Regonda, S.K. Two-Dimensional Flood Inundation Modeling in the Godavari River Basin, India—Insights on Model Output Uncertainty. Water 2021, 13, 191. [Google Scholar] [CrossRef]
- Carrión-Mero, P.; Montalván, F.; Morante-Carballo, F.; de Valgas, C.L.-F.; Apolo-Masache, B.; Heredia, J. Flow and Transport Numerical Model of a Coastal Aquifer Based on the Hydraulic Importance of a Dyke and Its Impact on Water Quality: Manglaralto—Ecuador. Water 2021, 13, 443. [Google Scholar] [CrossRef]
- Carrión-Mero, P.; Montalván-Burbano, N.; Morante-Carballo, F.; Quesada-Román, A.; Apolo-Masache, B. Worldwide Research Trends in Landslide Science. Int. J. Environ. Res. Public Health 2021, 18, 9445. [Google Scholar] [CrossRef] [PubMed]
- Díez-Herrero, A.; Garrote, J. Flood Risk Analysis and Assessment, Applications and Uncertainties: A Bibliometric Review. Water 2020, 12, 2050. [Google Scholar] [CrossRef]
- Da Silva, L.B.L.; Alencar, M.H.; de Almeida, A.T. Multidimensional flood risk management under climate changes: Bibliometric analysis, trends and strategic guidelines for decision-making in urban dynamics. Int. J. Disaster Risk Reduct. 2020, 50, 101865. [Google Scholar] [CrossRef]
- Emmer, A. GLOFs in the WOS: Bibliometrics, geographies and global trends of research on glacial lake outburst floods (Web of Science, 1979–2016). Nat. Hazards Earth Syst. Sci. 2018, 18, 813–827. [Google Scholar] [CrossRef]
- Crossan, M.M.; Apaydin, M. A Multi-Dimensional Framework of Organizational Innovation: A Systematic Review of the Literature. J. Manag. Stud. 2010, 47, 1154–1191. [Google Scholar] [CrossRef]
- Tranfield, D.; Denyer, D.; Smart, P. Towards a Methodology for Developing Evidence-Informed Management Knowledge by Means of Systematic Review. Br. J. Manag. 2003, 14, 207–222. [Google Scholar] [CrossRef]
- Phoong, S.Y.; Khek, S.L. The Bibliometric Analysis on Finite Mixture Model. SAGE Open 2022, 12, 1010. [Google Scholar] [CrossRef]
- Donthu, N.; Kumar, S.; Mukherjee, D.; Pandey, N.; Lim, W.M. How to conduct a bibliometric analysis: An overview and guidelines. J. Bus. Res. 2021, 133, 285–296. [Google Scholar] [CrossRef]
- Zhang, J.; Xiong, K.; Liu, Z.; He, L. Research progress and knowledge system of world heritage tourism: A bibliometric analysis. Heritage Sci. 2022, 10, 42. [Google Scholar] [CrossRef]
- Carrión-Mero, P.; Montalván-Burbano, N.; Paz-Salas, N.; Morante-Carballo, F. Volcanic Geomorphology: A Review of Worldwide Research. Geosciences 2020, 10, 347. [Google Scholar] [CrossRef]
- Zyoud, S.H.; Al-Jabi, S.W.; Amer, R.; Shakhshir, M.; Shahwan, M.; Jairoun, A.A.; Akkawi, M.; Abu Taha, A. Global research trends on the links between the gut microbiome and cancer: A visualization analysis. J. Transl. Med. 2022, 20, 83. [Google Scholar] [CrossRef]
- Mishra, H.G.; Pandita, S.; Bhat, A.A.; Mishra, R.K.; Sharma, S. Tourism and carbon emissions: A bibliometric review of the last three decades: 1990–2021. Tour. Rev. 2022, 77, 636–658. [Google Scholar] [CrossRef]
- Alam Khan, P.; Johl, S.K.; Akhtar, S.; Asif, M.; Salameh, A.A.; Kanesan, T. Open Innovation of Institutional Investors and Higher Education System in Creating Open Approach for SDG-4 Quality Education: A Conceptual Review. J. Open Innov. Technol. Mark. Complex. 2022, 8, 49. [Google Scholar] [CrossRef]
- Jiménez-Islas, D.; Pérez-Romero, M.E.; Río-Rama, M.D.L.C.D.; Flores-Romero, M.B. Mapping Research Trends in Publications Related to Bio-Jet Fuel: A Scientometric Review. Int. J. Des. Nat. Ecodynam. 2022, 17, 1–8. [Google Scholar] [CrossRef]
- Solin, L.; Skubincan, P. Flood risk assessment and management: Review of concepts, definitions and methods. Geogr. J. 2013, 65, 23–44. [Google Scholar]
- Martín-Martín, A.; Thelwall, M.; Orduna-Malea, E.; López-Cózar, E.D. Google Scholar, Microsoft Academic, Scopus, Dimensions, Web of Science, and OpenCitations’ COCI: A multidisciplinary comparison of coverage via citations. Scientometrics 2021, 126, 871–906. [Google Scholar] [CrossRef]
- Pranckutė, R. Web of Science (WoS) and Scopus: The Titans of Bibliographic Information in Today’s Academic World. Publications 2021, 9, 12. [Google Scholar] [CrossRef]
- Pasko, O.; Chen, F.; Oriekhova, A.; Brychko, A.; Shalyhina, I. Mapping the Literature on Sustainability Reporting: A Bibliometric Analysis Grounded in Scopus and Web of Science Core Collection. Eur. J. Sustain. Dev. 2021, 10, 303. [Google Scholar] [CrossRef]
- Kawuki, J.; Yu, X.; Musa, T.H. Bibliometric Analysis of Ebola Research Indexed in Web of Science and Scopus (2010–2020). BioMed. Res. Int. 2020, 2020, 5476567. [Google Scholar] [CrossRef]
- Echchakoui, S. Why and how to merge Scopus and Web of Science during bibliometric analysis: The case of sales force literature from 1912 to 2019. J. Mark. Anal. 2020, 8, 165–184. [Google Scholar] [CrossRef]
- Vera-Baceta, M.-A.; Thelwall, M.; Kousha, K. Web of Science and Scopus language coverage. Scientometrics 2019, 121, 1803–1813. [Google Scholar] [CrossRef]
- Da Silveira Barcellos, D.; Procopiuck, M.; Bollmann, H.A. Management of pharmaceutical micropollutants discharged in urban waters: 30 years of systematic review looking at opportunities for developing countries. Sci. Total Environ. 2022, 809, 151128. [Google Scholar] [CrossRef]
- Herrera-Franco, G.; Carrión-Mero, P.; Montalván-Burbano, N.; Mora-Frank, C.; Berrezueta, E. Bibliometric Analysis of Groundwater’s Life Cycle Assessment Research. Water 2022, 14, 1082. [Google Scholar] [CrossRef]
- Aria, M.; Cuccurullo, C. bibliometrix: An R-tool for comprehensive science mapping analysis. J. Informetr. 2017, 11, 959–975. [Google Scholar] [CrossRef]
- Pico-Saltos, R.; Carrión-Mero, P.; Montalván-Burbano, N.; Garzás, J.; Redchuk, A. Research Trends in Career Success: A Bibliometric Review. Sustainability 2021, 13, 4625. [Google Scholar] [CrossRef]
- Najmi, A.; Rashidi, T.H.; Abbasi, A.; Waller, S.T. Reviewing the transport domain: An evolutionary bibliometrics and network analysis. Scientometrics 2017, 110, 843–865. [Google Scholar] [CrossRef]
- Herrera-Franco, G.; Carrión-Mero, P.; Montalván-Burbano, N.; Caicedo-Potosí, J.; Berrezueta, E. Geoheritage and Geosites: A Bibliometric Analysis and Literature Review. Geosciences 2022, 12, 169. [Google Scholar] [CrossRef]
- Rodríguez-Soler, R.; Uribe-Toril, J.; Valenciano, J.D.P. Worldwide trends in the scientific production on rural depopulation, a bibliometric analysis using bibliometrix R-tool. Land Use Policy 2020, 97, 104787. [Google Scholar] [CrossRef]
- Maniu, I.; Costea, R.; Maniu, G.; Neamtu, B.M. Inflammatory Biomarkers in Febrile Seizure: A Comprehensive Bibliometric, Review and Visualization Analysis. Brain Sci. 2021, 11, 1077. [Google Scholar] [CrossRef] [PubMed]
- Della Corte, V.; Del Gaudio, G.; Sepe, F.; Luongo, S. Destination Resilience and Innovation for Advanced Sustainable Tourism Management: A Bibliometric Analysis. Sustainability 2021, 13, 12632. [Google Scholar] [CrossRef]
- Herrera-Franco, G.; Montalván-Burbano, N.; Carrión-Mero, P.; Jaya-Montalvo, M.; Gurumendi-Noriega, M. Worldwide Research on Geoparks through Bibliometric Analysis. Sustainability 2021, 13, 1175. [Google Scholar] [CrossRef]
- De Sousa, F.D.B. A simplified bibliometric mapping and analysis about sustainable polymers. Mater. Today Proc. 2022, 49, 2025–2033. [Google Scholar] [CrossRef]
- Montalván-Burbano, N.; Velastegui-Montoya, A.; Gurumendi-Noriega, M.; Morante-Carballo, F.; Adami, M. Worldwide Research on Land Use and Land Cover in the Amazon Region. Sustainability 2021, 13, 6039. [Google Scholar] [CrossRef]
- Morante-Carballo, F.; Montalván-Burbano, N.; Carrión-Mero, P.; Jácome-Francis, K. Worldwide Research Analysis on Natural Zeolites as Environmental Remediation Materials. Sustainability 2021, 13, 6378. [Google Scholar] [CrossRef]
- De Solla Price, D.J. Little Science, Big Science—And Beyond; Columbia University Press: New York, NY, 1963. [Google Scholar]
- Chow, V.T.; Prasad, T. Theory of stochastic modeling of watershed systems. J. Hydrol. 1972, 15, 261–284. [Google Scholar] [CrossRef]
- Ekanayake, S.T.; Cruise, J.F. Comparisons of Weibull- and exponential-based partial duration stochastic flood models. Stoch. Hydrol. Hydraul. 1993, 7, 283–297. [Google Scholar] [CrossRef]
- Nachtnebel, H.; Konecny, F. Risk analysis and time-dependent flood models. J. Hydrol. 1987, 91, 295–318. [Google Scholar] [CrossRef]
- Konecny, F.; Nachtnebel, H. Extreme value processes and the evaluation of risk in flood analysis. Appl. Math. Model. 1985, 9, 11–15. [Google Scholar] [CrossRef]
- Bates, B.C. Nonlinear, discrete flood event models, 2. Assessment of statistical nonlinearity. J. Hydrol. 1988, 99, 77–89. [Google Scholar] [CrossRef]
- Bates, B.C.; Townley, L.R. Nonlinear, discrete flood event models, 1. Bayesian estimation of parameters. J. Hydrol. 1988, 99, 61–76. [Google Scholar] [CrossRef]
- Hsu, M.; Chen, S.; Chang, T. Inundation simulation for urban drainage basin with storm sewer system. J. Hydrol. 2000, 234, 21–37. [Google Scholar] [CrossRef]
- Mark, O.; Weesakul, S.; Apirumanekul, C.; Aroonnet, S.; Djordjevic, S. Potential and limitations of 1D modelling of urban flooding. J. Hydrol. 2004, 299, 284–299. [Google Scholar] [CrossRef]
- Vis, M.; Klijn, F.; de Bruijn, K.; Van Buuren, M. Resilience strategies for flood risk management in the Netherlands. Int. J. River Basin Manag. 2003, 1, 33–40. [Google Scholar] [CrossRef]
- Casas, A.; Benito, G.; Thorndycraft, V.R.; Rico, M. The topographic data source of digital terrain models as a key element in the accuracy of hydraulic flood modelling. Earth Surf. Process. Landf. 2006, 31, 444–456. [Google Scholar] [CrossRef]
- Priestnall, G.; Jaafar, J.; Duncan, A. Extracting urban features from LiDAR digital surface models. Comput. Environ. Urban Syst. 2000, 24, 65–78. [Google Scholar] [CrossRef]
- Bates, P.D.; Horritt, M.S.; Fewtrell, T.J. A simple inertial formulation of the shallow water equations for efficient two-dimensional flood inundation modelling. J. Hydrol. 2010, 387, 33–45. [Google Scholar] [CrossRef]
- Scawthorn, C.; Flores, P.; Blais, N.; Seligson, H.; Tate, E.; Chang, S.; Mifflin, E.; Thomas, W.; Murphy, J.; Jones, C.; et al. HAZUS-MH Flood Loss Estimation Methodology. II. Damage and Loss Assessment. Nat. Hazards Rev. 2006, 7, 72–81. [Google Scholar] [CrossRef]
- Safavi, S.; Saghafian, B.; Hosseini, S.A. Characterizing flow pattern and salinity using the 3D MIKE 3 model: Urmia Lake case study. Arab. J. Geosci. 2020, 13, 115. [Google Scholar] [CrossRef]
- Fauzah, S.; Tarya, A.; Ningsih, N.S. Three-Dimensional Numerical Modelling of Tidal Current in Balikpapan Bay Using Delft 3D. IOP Conf. Series Earth Environ. Sci. 2021, 925, 12051. [Google Scholar] [CrossRef]
- Mason, D.; Giustarini, L.; Garcia-Pintado, J.; Cloke, H. Detection of flooded urban areas in high resolution Synthetic Aperture Radar images using double scattering. Int. J. Appl. Earth Obs. Geoinf. ITC J. 2014, 28, 150–159. [Google Scholar] [CrossRef]
- Li, Z.; Wang, C.; Emrich, C.T.; Guo, D. A novel approach to leveraging social media for rapid flood mapping: A case study of the 2015 South Carolina floods. Cartogr. Geogr. Inf. Sci. 2018, 45, 97–110. [Google Scholar] [CrossRef]
- Smith, L.S.; Liang, Q.; James, P.; Lin, W. Assessing the utility of social media as a data source for flood risk management using a real-time modelling framework. J. Flood Risk Manag. 2017, 10, 370–380. [Google Scholar] [CrossRef]
- Dottori, F.; Salamon, P.; Bianchi, A.; Alfieri, L.; Hirpa, F.A.; Feyen, L. Development and evaluation of a framework for global flood hazard mapping. Adv. Water Resour. 2016, 94, 87–102. [Google Scholar] [CrossRef]
- Yin, J.; Yu, D.; Yin, Z.; Liu, M.; He, Q. Evaluating the impact and risk of pluvial flash flood on intra-urban road network: A case study in the city center of Shanghai, China. J. Hydrol. 2016, 537, 138–145. [Google Scholar] [CrossRef]
- Rudd, A.C.; Kay, A.L.; Wells, S.C.; Aldridge, T.; Cole, S.J.; Kendon, E.J.; Stewart, E.J. Investigating potential future changes in surface water flooding hazard and impact. Hydrol. Process. 2020, 34, 139–149. [Google Scholar] [CrossRef]
- Winsemius, H.C.; Aerts, J.C.J.H.; Van Beek, L.P.H.; Bierkens, M.F.P.; Bouwman, A.; Jongman, B.; Kwadijk, J.C.J.; Ligtvoet, W.; Lucas, P.L.; Van Vuuren, D.P.; et al. Global Drivers of Future River Flood Risk. Nat. Clim. Change 2016, 6, 381–385. [Google Scholar] [CrossRef]
- Tehrany, M.S.; Pradhan, B.; Jebur, M.N. Flood susceptibility mapping using a novel ensemble weights-of-evidence and support vector machine models in GIS. J. Hydrol. 2014, 512, 332–343. [Google Scholar] [CrossRef]
- Carrión-Mero, P.; Montalván-Burbano, N.; Herrera-Narváez, G.; Morante-Carballo, F. Geodiversity and Mining Towards the Development of Geotourism: A Global Perspective. Int. J. Des. Nat. Ecodynam. 2021, 16, 191–201. [Google Scholar] [CrossRef]
- Yin, J.; Lin, N.; Yu, D. Coupled modeling of storm surge and coastal inundation: A case study in New York City during Hurricane Sandy. Water Resour. Res. 2016, 52, 8685–8699. [Google Scholar] [CrossRef]
- Emerton, R.E.; Stephens, E.M.; Pappenberger, F.; Pagano, T.C.; Weerts, A.H.; Wood, A.W.; Salamon, P.; Brown, J.D.; Hjerdt, N.; Donnelly, C.; et al. Continental and global scale flood forecasting systems. Wiley Interdiscip. Rev. Water 2016, 3, 391–418. [Google Scholar] [CrossRef]
- Wing, O.E.J.; Bates, P.D.; Smith, A.M.; Sampson, C.C.; Johnson, K.A.; Fargione, J.; Morefield, P. Estimates of present and future flood risk in the conterminous United States. Environ. Res. Lett. 2018, 13, 034023. [Google Scholar] [CrossRef]
- Yin, J.; Zhao, Q.; Yu, D.; Lin, N.; Kubanek, J.; Ma, G.; Liu, M.; Pepe, A. Long-term flood-hazard modeling for coastal areas using InSAR measurements and a hydrodynamic model: The case study of Lingang New City, Shanghai. J. Hydrol. 2019, 571, 593–604. [Google Scholar] [CrossRef]
- Wang, W.; Yang, X.; Yao, T. Evaluation of ASTER GDEM and SRTM and their suitability in hydraulic modelling of a glacial lake outburst flood in southeast Tibet. Hydrol. Process. 2012, 26, 213–225. [Google Scholar] [CrossRef]
- Wang, Y.; Chen, A.S.; Fu, G.; Djordjević, S.; Zhang, C.; Savić, D.A. An integrated framework for high-resolution urban flood modelling considering multiple information sources and urban features. Environ. Model. Softw. 2018, 107, 85–95. [Google Scholar] [CrossRef]
- Trigg, M.A.; Birch, C.E.; Neal, J.; Bates, P.; Smith, A.; Sampson, C.; Yamazaki, D.; Hirabayashi, Y.; Pappenberger, F.; Dutra, E.; et al. The credibility challenge for global fluvial flood risk analysis. Environ. Res. Lett. 2016, 11, 094014. [Google Scholar] [CrossRef]
- Chen, C.; Lin, Z.; Beardsley, R.C.; Shyka, T.; Zhang, Y.; Xu, Q.; Qi, J.; Lin, H.; Xu, D. Impacts of sea level rise on future storm-induced coastal inundations over Massachusetts coast. Nat. Hazards 2021, 106, 375–399. [Google Scholar] [CrossRef]
- Luo, P.; Mu, D.; Xue, H.; Ngo-Duc, T.; Dang, K.; Takara, K.; Nover, D.; Schladow, G. Flood inundation assessment for the Hanoi Central Area, Vietnam under historical and extreme rainfall conditions. Sci. Rep. 2018, 8, 12623. [Google Scholar] [CrossRef] [PubMed]
- Lau, A.Y.A.; Switzer, A.D.; Dominey-Howes, D.; Aitchison, J.; Zong, Y. Written records of historical tsunamis in the northeastern South China Sea—Challenges associated with developing a new integrated database. Nat. Hazards Earth Syst. Sci. 2010, 10, 1793–1806. [Google Scholar] [CrossRef]
- Wu, H.; Kimball, J.S.; Zhou, N.; Alfieri, L.; Luo, L.; Du, J.; Huang, Z. Evaluation of real-time global flood modeling with satellite surface inundation observations from SMAP. Remote Sens. Environ. 2019, 233, 111360. [Google Scholar] [CrossRef]
- Patra, S.K.; Bhattacharya, P.; Verma, N. Bibliometric Study of Literature on Bibliometrics. DESIDOC Bull. Inf. Technol. 2006, 26, 27–32. [Google Scholar] [CrossRef]
- Briones-Bitar, J.; Carrión-Mero, P.; Montalván-Burbano, N.; Morante-Carballo, F. Rockfall Research: A Bibliometric Analysis and Future Trends. Geosciences 2020, 10, 403. [Google Scholar] [CrossRef]
- Stewart, M.; Bates, P.; Anderson, M.; Price, D.; Burt, T. Modelling floods in hydrologically complex lowland river reaches. J. Hydrol. 1999, 223, 85–106. [Google Scholar] [CrossRef]
- Sampson, C.C.; Smith, A.M.; Bates, P.; Neal, J.; Alfieri, L.; Freer, J. A high-resolution global flood hazard model. Water Resour. Res. 2015, 51, 7358–7381. [Google Scholar] [CrossRef]
- Ho, Y.-S.; Satoh, H.; Lin, S.-Y. Japanese Lung Cancer Research Trends and Performance in Science Citation Index. Intern. Med. 2010, 49, 2219–2228. [Google Scholar] [CrossRef]
- Yu, Y.; Jin, Z.; Qiu, J. Global Isotopic Hydrograph Separation Research History and Trends: A Text Mining and Bibliometric Analysis Study. Water 2021, 13, 2529. [Google Scholar] [CrossRef]
- Overton, I.C. Modelling floodplain inundation on a regulated river: Integrating GIS, remote sensing and hydrological models. River Res. Appl. 2005, 21, 991–1001. [Google Scholar] [CrossRef]
- Komolafe, A.A. Integrated methodology for urban flood inundation modeling: A case study of Ichinomiya River Basin, Japan. Model. Earth Syst. Environ. 2021, 8, 2001–2010. [Google Scholar] [CrossRef]
- Teng, J.; Vaze, J.; Dutta, D.; Marvanek, S. Rapid Inundation Modelling in Large Floodplains Using LiDAR DEM. Water Resour. Manag. 2015, 29, 2619–2636. [Google Scholar] [CrossRef]
- Zeleňáková, M.; Fijko, R.; Labant, S.; Weiss, E.; Markovič, G.; Weiss, R. Flood risk modelling of the Slatvinec stream in Kružlov village, Slovakia. J. Clean. Prod. 2019, 212, 109–118. [Google Scholar] [CrossRef]
- Rangari, V.A.; Umamahesh, N.; Patel, A.K. Flood-hazard risk classification and mapping for urban catchment under different climate change scenarios: A case study of Hyderabad city. Urban Clim. 2021, 36, 100793. [Google Scholar] [CrossRef]
- Yang, T.; Sun, F.; Gentine, P.; Liu, W.; Wang, H.; Yin, J.; Du, M.; Liu, C. Evaluation and machine learning improvement of global hydrological model-based flood simulations. Environ. Res. Lett. 2019, 14, 114027. [Google Scholar] [CrossRef]
- Kabir, S.; Patidar, S.; Xia, X.; Liang, Q.; Neal, J.; Pender, G. A deep convolutional neural network model for rapid prediction of fluvial flood inundation. J. Hydrol. 2020, 590, 125481. [Google Scholar] [CrossRef]
- Kumar, R.; Singh, S.; Sidhu, A.; Pruncu, C. Bibliometric Analysis of Specific Energy Consumption (SEC) in Machining Operations: A Sustainable Response. Sustainability 2021, 13, 5617. [Google Scholar] [CrossRef]
- Fatehi, F.; Hassandoust, F.; Ko, R.K.; Akhlaghpour, S. General Data Protection Regulation (GDPR) in Healthcare: Hot Topics and Research Fronts. Stud. Health Technol. Inform. 2020, 270, 1118–1122. [Google Scholar] [CrossRef]
- Yu, D.; Lane, S.N. Urban fluvial flood modelling using a two-dimensional diffusion-wave treatment, part 1: Mesh resolution effects. Hydrol. Process. 2006, 20, 1541–1565. [Google Scholar] [CrossRef]
- Chen, J.; Hill, A.A.; Urbano, L.D. A GIS-based model for urban flood inundation. J. Hydrol. 2009, 373, 184–192. [Google Scholar] [CrossRef]
- Gallegos, H.A.; Schubert, J.E.; Sanders, B.F. Two-dimensional, high-resolution modeling of urban dam-break flooding: A case study of Baldwin Hills, California. Adv. Water Resour. 2009, 32, 1323–1335. [Google Scholar] [CrossRef]
- Sanders, B.F.; Schubert, J.E.; Detwiler, R.L. ParBreZo: A parallel, unstructured grid, Godunov-type, shallow-water code for high-resolution flood inundation modeling at the regional scale. Adv. Water Resour. 2010, 33, 1456–1467. [Google Scholar] [CrossRef]
- Schubert, J.E.; Sanders, B.F. Building treatments for urban flood inundation models and implications for predictive skill and modeling efficiency. Adv. Water Resour. 2012, 41, 49–64. [Google Scholar] [CrossRef]
- Feizizadeh, B.; Gheshlaghi, H.A.; Bui, D.T. An integrated approach of GIS and hybrid intelligence techniques applied for flood risk modeling. J. Environ. Plan. Manag. 2021, 64, 485–516. [Google Scholar] [CrossRef]
- Bozza, A.; Durand, A.; Confortola, G.; Soncini, A.; Allenbach, B.; Bocchiola, D. Potential of remote sensing and open street data for flood mapping in poorly gauged areas: A case study in Gonaives, Haiti. Appl. Geomat. 2016, 8, 117–131. [Google Scholar] [CrossRef]
- Tang, L.; Titov, V.V.; Chamberlin, C.D. Development, testing, and applications of site-specific tsunami inundation models for real-time forecasting. J. Geophys. Res. Earth Surf. 2009, 114, C12025. [Google Scholar] [CrossRef]
- Grilli, S.T.; Taylor, O.-D.S.; Baxter, C.D.; Maretzki, S. A probabilistic approach for determining submarine landslide tsunami hazard along the upper east coast of the United States. Mar. Geol. 2009, 264, 74–97. [Google Scholar] [CrossRef]
- Synolakis, C.E.; Bernard, E.N.; Titov, V.V.; Kânoğlu, U.; González, F.I. Validation and Verification of Tsunami Numerical Models. Pure Appl. Geophys. 2008, 165, 2197–2228. [Google Scholar] [CrossRef]
- Williams, D.M.; Erikson, L.H. Knowledge Gaps Update to the 2019 IPCC Special Report on the Ocean and Cryosphere: Prospects to Refine Coastal Flood Hazard Assessments and Adaptation Strategies with At-Risk Communities of Alaska. Front. Clim. 2021, 3, 761439. [Google Scholar] [CrossRef]
- Swain, D.L.; Wing, O.E.J.; Bates, P.D.; Done, J.M.; Johnson, K.A.; Cameron, D.R. Increased Flood Exposure Due to Climate Change and Population Growth in the United States. Earth’s Future 2020, 8, 1778. [Google Scholar] [CrossRef]
- Judi, D.R.; Rakowski, C.L.; Waichler, S.R.; Feng, Y.; Wigmosta, M.S. Integrated Modeling Approach for the Development of Climate-Informed, Actionable Information. Water 2018, 10, 775. [Google Scholar] [CrossRef]
- Miura, Y.; Qureshi, H.; Ryoo, C.; Dinenis, P.C.; Li, J.; Mandli, K.T.; Deodatis, G.; Bienstock, D.; Lazrus, H.; Morss, R. A methodological framework for determining an optimal coastal protection strategy against storm surges and sea level rise. Nat. Hazards 2021, 107, 1821–1843. [Google Scholar] [CrossRef]
- Nicholls, R.J. Coastal flooding and wetland loss in the 21st century: Changes under the SRES climate and socio-economic scenarios. Glob. Environ. Chang. 2004, 14, 69–86. [Google Scholar] [CrossRef]
- Pappenberger, F.; Beven, K.J.; Hunter, N.M.; Bates, P.; Gouweleeuw, B.T.; Thielen, J.; De Roo, A.P.J. Cascading model uncertainty from medium range weather forecasts (10 days) through a rainfall-runoff model to flood inundation predictions within the European Flood Forecasting System (EFFS). Hydrol. Earth Syst. Sci. 2005, 9, 381–393. [Google Scholar] [CrossRef]
- Neal, J.; Villanueva, I.; Wright, N.; Willis, T.; Fewtrell, T.; Bates, P. How much physical complexity is needed to model flood inundation? Hydrol. Process. 2011, 26, 2264–2282. [Google Scholar] [CrossRef]
- Schumann, G.J.-P.; Neal, J.C.; Voisin, N.; Andreadis, K.M.; Pappenberger, F.; Phanthuwongpakdee, N.; Hall, A.C.; Bates, P.D. A first large-scale flood inundation forecasting model. Water Resour. Res. 2013, 49, 6248–6257. [Google Scholar] [CrossRef]
- Kia, M.B.; Pirasteh, S.; Pradhan, B.; Mahmud, A.R.; Sulaiman, W.N.A.; Moradi, A. An artificial neural network model for flood simulation using GIS: Johor River Basin, Malaysia. Environ. Earth Sci. 2012, 67, 251–264. [Google Scholar] [CrossRef]
- Correia, F.N.; Rego, F.C.; Saraiva, M.D.G.; Ramos, I. Coupling GIS with Hydrologic and Hydraulic Flood Modelling. Water Resour. Manag. 1998, 12, 229–249. [Google Scholar] [CrossRef]
- Choné, G.; Biron, P.M.; Buffin-Bélanger, T.; Mazgareanu, I.; Neal, J.C.; Sampson, C.C. An assessment of large-scale flood modelling based on LiDAR data. Hydrol. Process. 2021, 35, e14333. [Google Scholar] [CrossRef]
- Lim, N.; Brandt, S. Flood map boundary sensitivity due to combined effects of DEM resolution and roughness in relation to model performance. Geomat. Nat. Hazards Risk. 2019, 10, 1613–1647. [Google Scholar] [CrossRef]
- Wu, X.; Wang, Z.; Guo, S.; Liao, W.; Zeng, Z.; Chen, X. Scenario-based projections of future urban inundation within a coupled hydrodynamic model framework: A case study in Dongguan City, China. J. Hydrol. 2017, 547, 428–442. [Google Scholar] [CrossRef]
- Souissi, D.; Zouhri, L.; Hammami, S.; Msaddek, M.H.; Zghibi, A.; Dlala, M. GIS-based MCDM—AHP modeling for flood susceptibility mapping of arid areas, southeastern Tunisia. Geocarto Int. 2020, 35, 991–1017. [Google Scholar] [CrossRef]
- Mojaddadi, H.; Pradhan, B.; Nampak, H.; Ahmad, N.; Ghazali, A.H.B. Ensemble machine-learning-based geospatial approach for flood risk assessment using multi-sensor remote-sensing data and GIS. Geomat. Nat. Hazards Risk. 2017, 8, 1080–1102. [Google Scholar] [CrossRef]
- Bezak, N.; Šraj, M.; Rusjan, S.; Mikoš, M. Impact of the Rainfall Duration and Temporal Rainfall Distribution Defined Using the Huff Curves on the Hydraulic Flood Modelling Results. Geosciences 2018, 8, 69. [Google Scholar] [CrossRef]
- David, A.; Schmalz, B. Flood hazard analysis in small catchments: Comparison of hydrological and hydrodynamic approaches by the use of direct rainfall. J. Flood Risk Manag. 2020, 13, e12639. [Google Scholar] [CrossRef]
- Farooq, M.; Shafique, M.; Khattak, M.S. Flood hazard assessment and mapping of River Swat using HEC-RAS 2D model and high-resolution 12-m TanDEM-X DEM (WorldDEM). Nat. Hazards 2019, 97, 477–492. [Google Scholar] [CrossRef]
- Jamali, B.; Bach, P.M.; Cunningham, L.; Deletic, A. A Cellular Automata Fast Flood Evaluation (CA-ffé) Model. Water Resour. Res. 2019, 55, 4936–4953. [Google Scholar] [CrossRef]
- Dasallas, L.; Kim, Y.; An, H. Case Study of HEC-RAS 1D–2D Coupling Simulation: 2002 Baeksan Flood Event in Korea. Water 2019, 11, 2048. [Google Scholar] [CrossRef]
- USACE. HEC-RAS, River Analysis System, User’s Manual, Version 5.0; US Army Corps of Engineers Hydrologic Engineering Center: Davis, CA, USA, 2016. [Google Scholar]
- Stephens, E.; Schumann, G.; Bates, P. Problems with binary pattern measures for flood model evaluation. Hydrol. Process. 2014, 28, 4928–4937. [Google Scholar] [CrossRef]
- Neal, J.C.; Odoni, N.A.; Trigg, M.A.; Freer, J.E.; Garcia-Pintado, J.; Mason, D.C.; Wood, M.; Bates, P.D. Efficient incorporation of channel cross-section geometry uncertainty into regional and global scale flood inundation models. J. Hydrol. 2015, 529, 169–183. [Google Scholar] [CrossRef]
- Yu, D.; Lane, S.N. Urban fluvial flood modelling using a two-dimensional diffusion-wave treatment, part 2: Development of a sub-grid-scale treatment. Hydrol. Process. 2006, 20, 1567–1583. [Google Scholar] [CrossRef]
- Tehrany, M.S.; Pradhan, B.; Jebur, M.N. Flood susceptibility analysis and its verification using a novel ensemble support vector machine and frequency ratio method. Stoch. Environ. Res. Risk. Assess. 2015, 29, 1149–1165. [Google Scholar] [CrossRef]
- Talukdar, S.; Ghose, B.; Shahfahad; Salam, R.; Mahato, S.; Pham, Q.B.; Linh, N.T.T.; Costache, R.; Avand, M. Flood susceptibility modeling in Teesta River basin, Bangladesh using novel ensembles of bagging algorithms. Stoch. Environ. Res. Risk. Assess. 2020, 34, 2277–2300. [Google Scholar] [CrossRef]
- Nhu, V.-H.; Thi Ngo, P.-T.; Pham, T.D.; Dou, J.; Song, X.; Hoang, N.-D.; Tran, D.A.; Cao, D.P.; Aydilek, I.B.; Amiri, M.; et al. A New Hybrid Firefly–PSO Optimized Random Subspace Tree Intelligence for Torrential Rainfall-Induced Flash Flood Susceptible Mapping. Remote Sens. 2020, 12, 2688. [Google Scholar] [CrossRef]
- Vamvakeridou-Lyroudia, L.; Chen, A.; Khoury, M.; Gibson, M.; Kostaridis, A.; Stewart, D.; Wood, M.; Djordjevic, S.; Savic, D. Assessing and visualising hazard impacts to enhance the resilience of Critical Infrastructures to urban flooding. Sci. Total Environ. 2020, 707, 136078. [Google Scholar] [CrossRef] [PubMed]
- Wu, L.; Taniguchi, K.; Tajima, Y. Impact of Climate Change on Flood Hazard at Airports on Pacific Islands: A Case Study of Faleolo International Airport, Samoa. J. Disaster Res. 2021, 16, 351–362. [Google Scholar] [CrossRef]
- Padulano, R.; Rianna, G.; Costabile, P.; Costanzo, C.; Del Giudice, G.; Mercogliano, P. Propagation of variability in climate projections within urban flood modelling: A multi-purpose impact analysis. J. Hydrol. 2021, 602, 126756. [Google Scholar] [CrossRef]
- Sassi, M.; Nicotina, L.; Pall, P.; Stone, D.; Hilberts, A.; Wehner, M.; Jewson, S. Impact of climate change on European winter and summer flood losses. Adv. Water Resour. 2019, 129, 165–177. [Google Scholar] [CrossRef]
- Mishra, B.; Emam, A.R.; Masago, Y.; Kumar, P.; Regmi, R.K.; Fukushi, K. Assessment of future flood inundations under climate and land use change scenarios in the Ciliwung River Basin, Jakarta. J. Flood Risk. Manag. 2018, 11, S1105–S1115. [Google Scholar] [CrossRef]
- Shrestha, B.B.; Perera, E.D.P.; Kudo, S.; Miyamoto, M.; Yamazaki, Y.; Kuribayashi, D.; Sawano, H.; Sayama, T.; Magome, J.; Hasegawa, A.; et al. Assessing flood disaster impacts in agriculture under climate change in the river basins of Southeast Asia. Nat. Hazards 2019, 97, 157–192. [Google Scholar] [CrossRef]
- Padulano, R.; Costabile, P.; Costanzo, C.; Rianna, G.; Del Giudice, G.; Mercogliano, P. Using the present to estimate the future: A simplified approach for the quantification of climate change effects on urban flooding by scenario analysis. Hydrol. Process. 2021, 35, e14436. [Google Scholar] [CrossRef]
- Pasquier, U.; Few, R.; Goulden, M.C.; Hooton, S.; He, Y.; Hiscock, K.M. “We can’t do it on our own!”—Integrating stakeholder and scientific knowledge of future flood risk to inform climate change adaptation planning in a coastal region. Environ. Sci. Policy 2020, 103, 50–57. [Google Scholar] [CrossRef]
- Monioudi, I.; Asariotis, R.; Becker, A.; Bhat, C.; Dowding-Gooden, D.; Esteban, M.; Feyen, L.; Mentaschi, L.; Nikolaou, A.; Nurse, L.; et al. Climate change impacts on critical international transportation assets of Caribbean Small Island Developing States (SIDS): The case of Jamaica and Saint Lucia. Reg. Environ. Chang. 2018, 18, 2211–2225. [Google Scholar] [CrossRef]
- Keller, L.; Zischg, A.P.; Mosimann, M.; Rössler, O.; Weingartner, R.; Martius, O. Large ensemble flood loss modelling and uncertainty assessment for future climate conditions for a Swiss pre-alpine catchment. Sci. Total Environ. 2019, 693, 133400. [Google Scholar] [CrossRef]
- Mosavi, A.; Ozturk, P.; Chau, K.-W. Flood Prediction Using Machine Learning Models: Literature Review. Water 2018, 10, 1536. [Google Scholar] [CrossRef]
- Azeez, O.; Elfeki, A.; Kamis, A.S.; Chaabani, A. Dam break analysis and flood disaster simulation in arid urban environment: The Um Al-Khair dam case study, Jeddah, Saudi Arabia. Nat. Hazards 2020, 100, 995–1011. [Google Scholar] [CrossRef]
Figure 1.
Methodological outline for bibliometric analysis and mapping of the research field.

Figure 2.
Distribution of publishing sources about floods.

Figure 3.
Contribution of databases (Scopus and WoS).

Figure 4.
The annual production of the study field from flood modelling.

Figure 5.
Country collaboration map.

Figure 6.
Top 20 countries by the number of citations.

Figure 7.
Top-Authors’ Production over time. Number (N) of articles y Totals Cites (TC) per year.

Figure 8.
The conceptual structure of author’s keywords during the three periods analysed. (a) Grouping of keywords in the first study period (1972–1994); (b) Conceptual structure of period II (1995–2005); (c) Current conceptual structure of keywords (period III, 2006–2021).
Figure 8.
The conceptual structure of author’s keywords during the three periods analysed. (a) Grouping of keywords in the first study period (1972–1994); (b) Conceptual structure of period II (1995–2005); (c) Current conceptual structure of keywords (period III, 2006–2021).

Figure 9.
Trend topic of authors’ keywords.

Figure 10.
Analysis of the Sankey diagram. Author–country–keyword intersection.


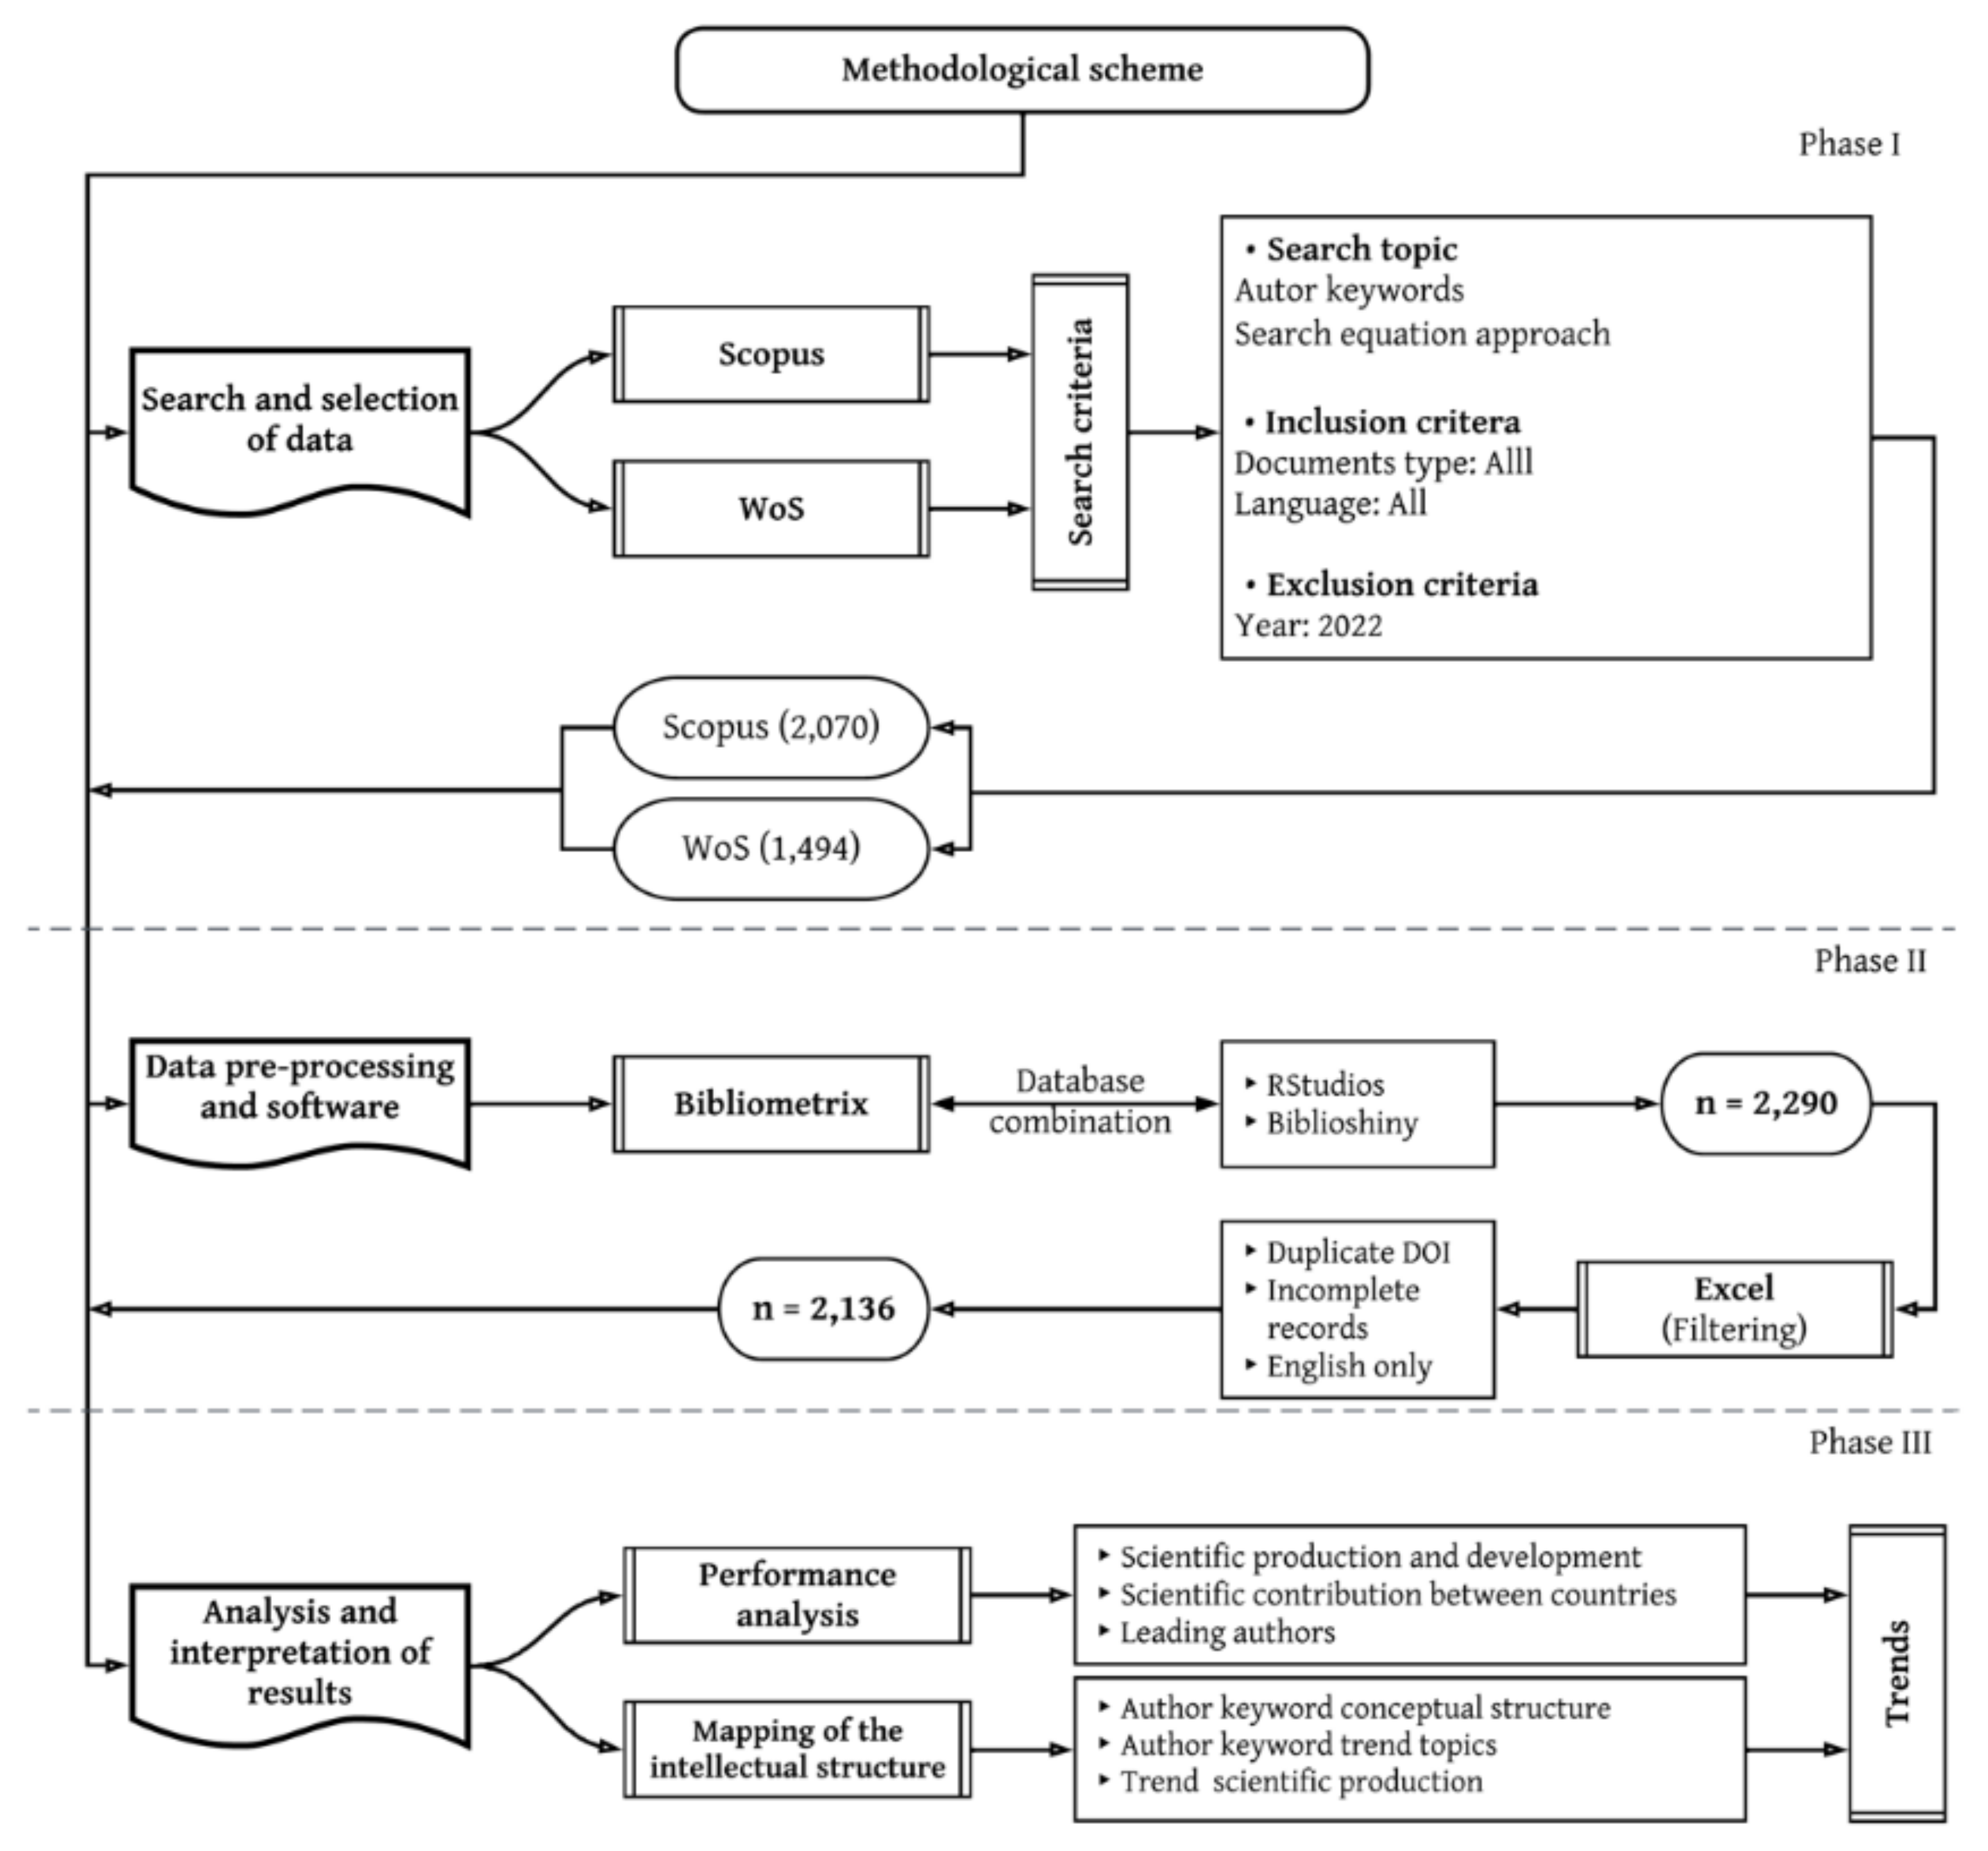
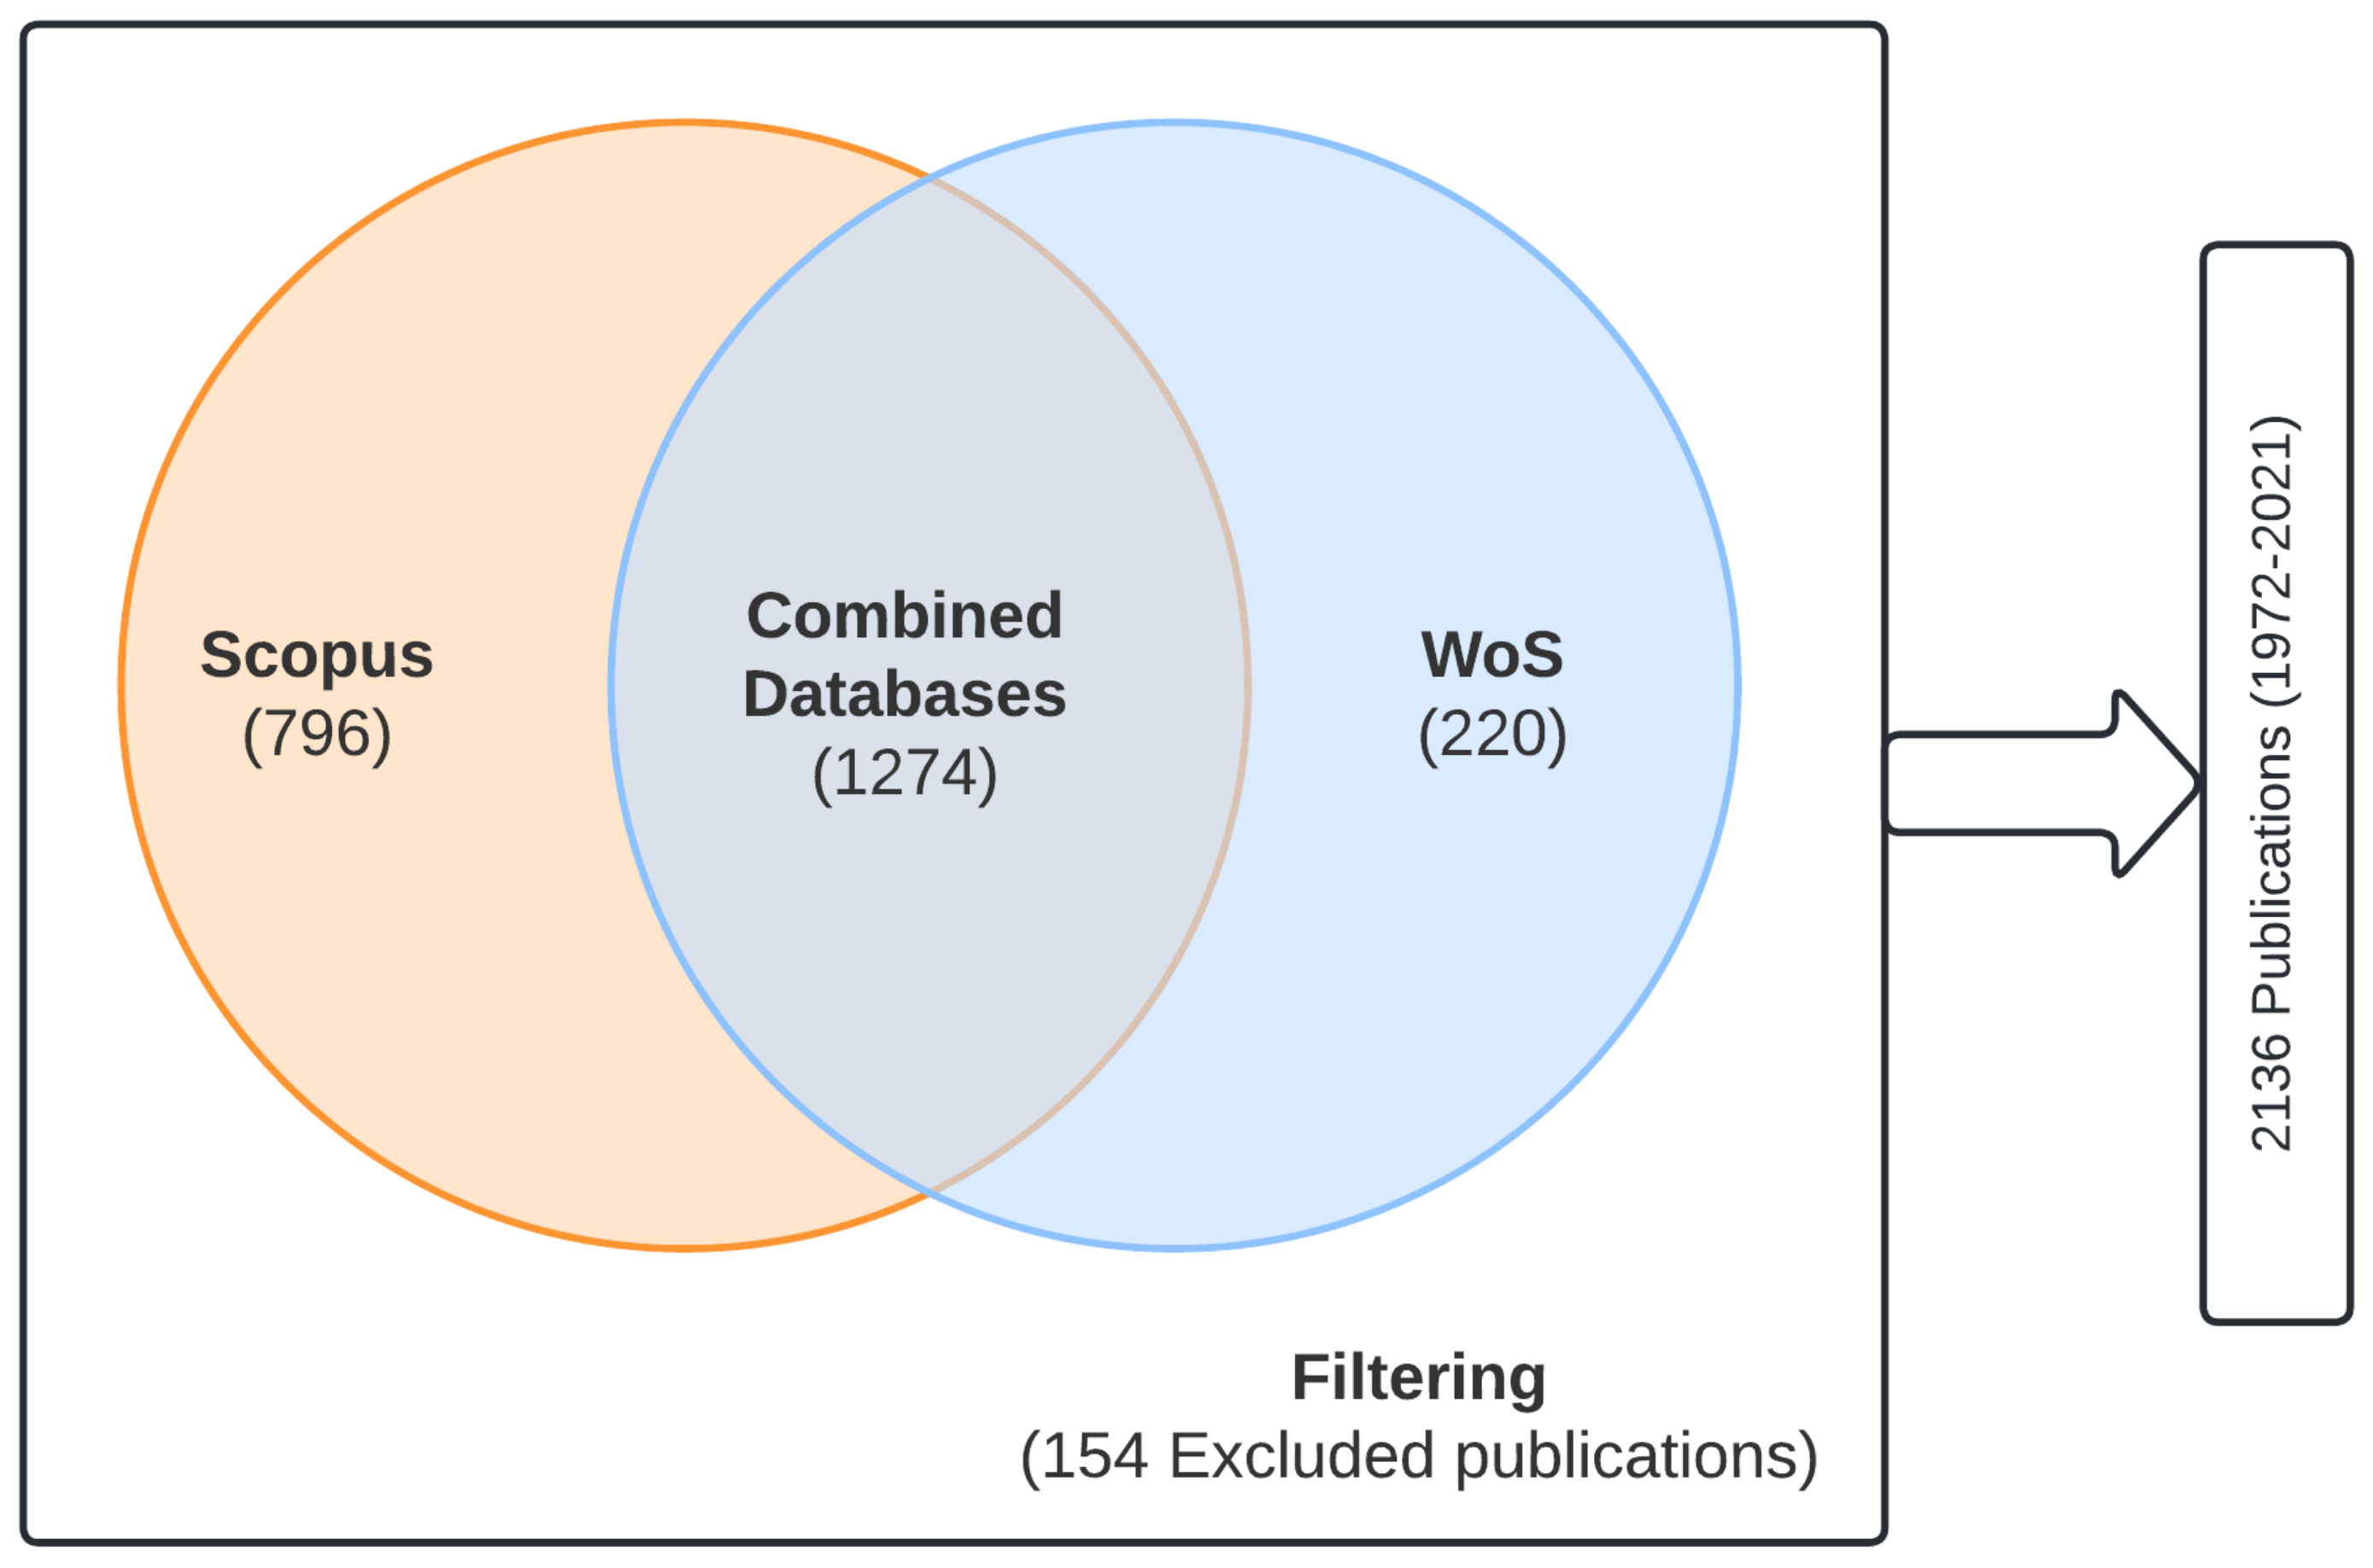
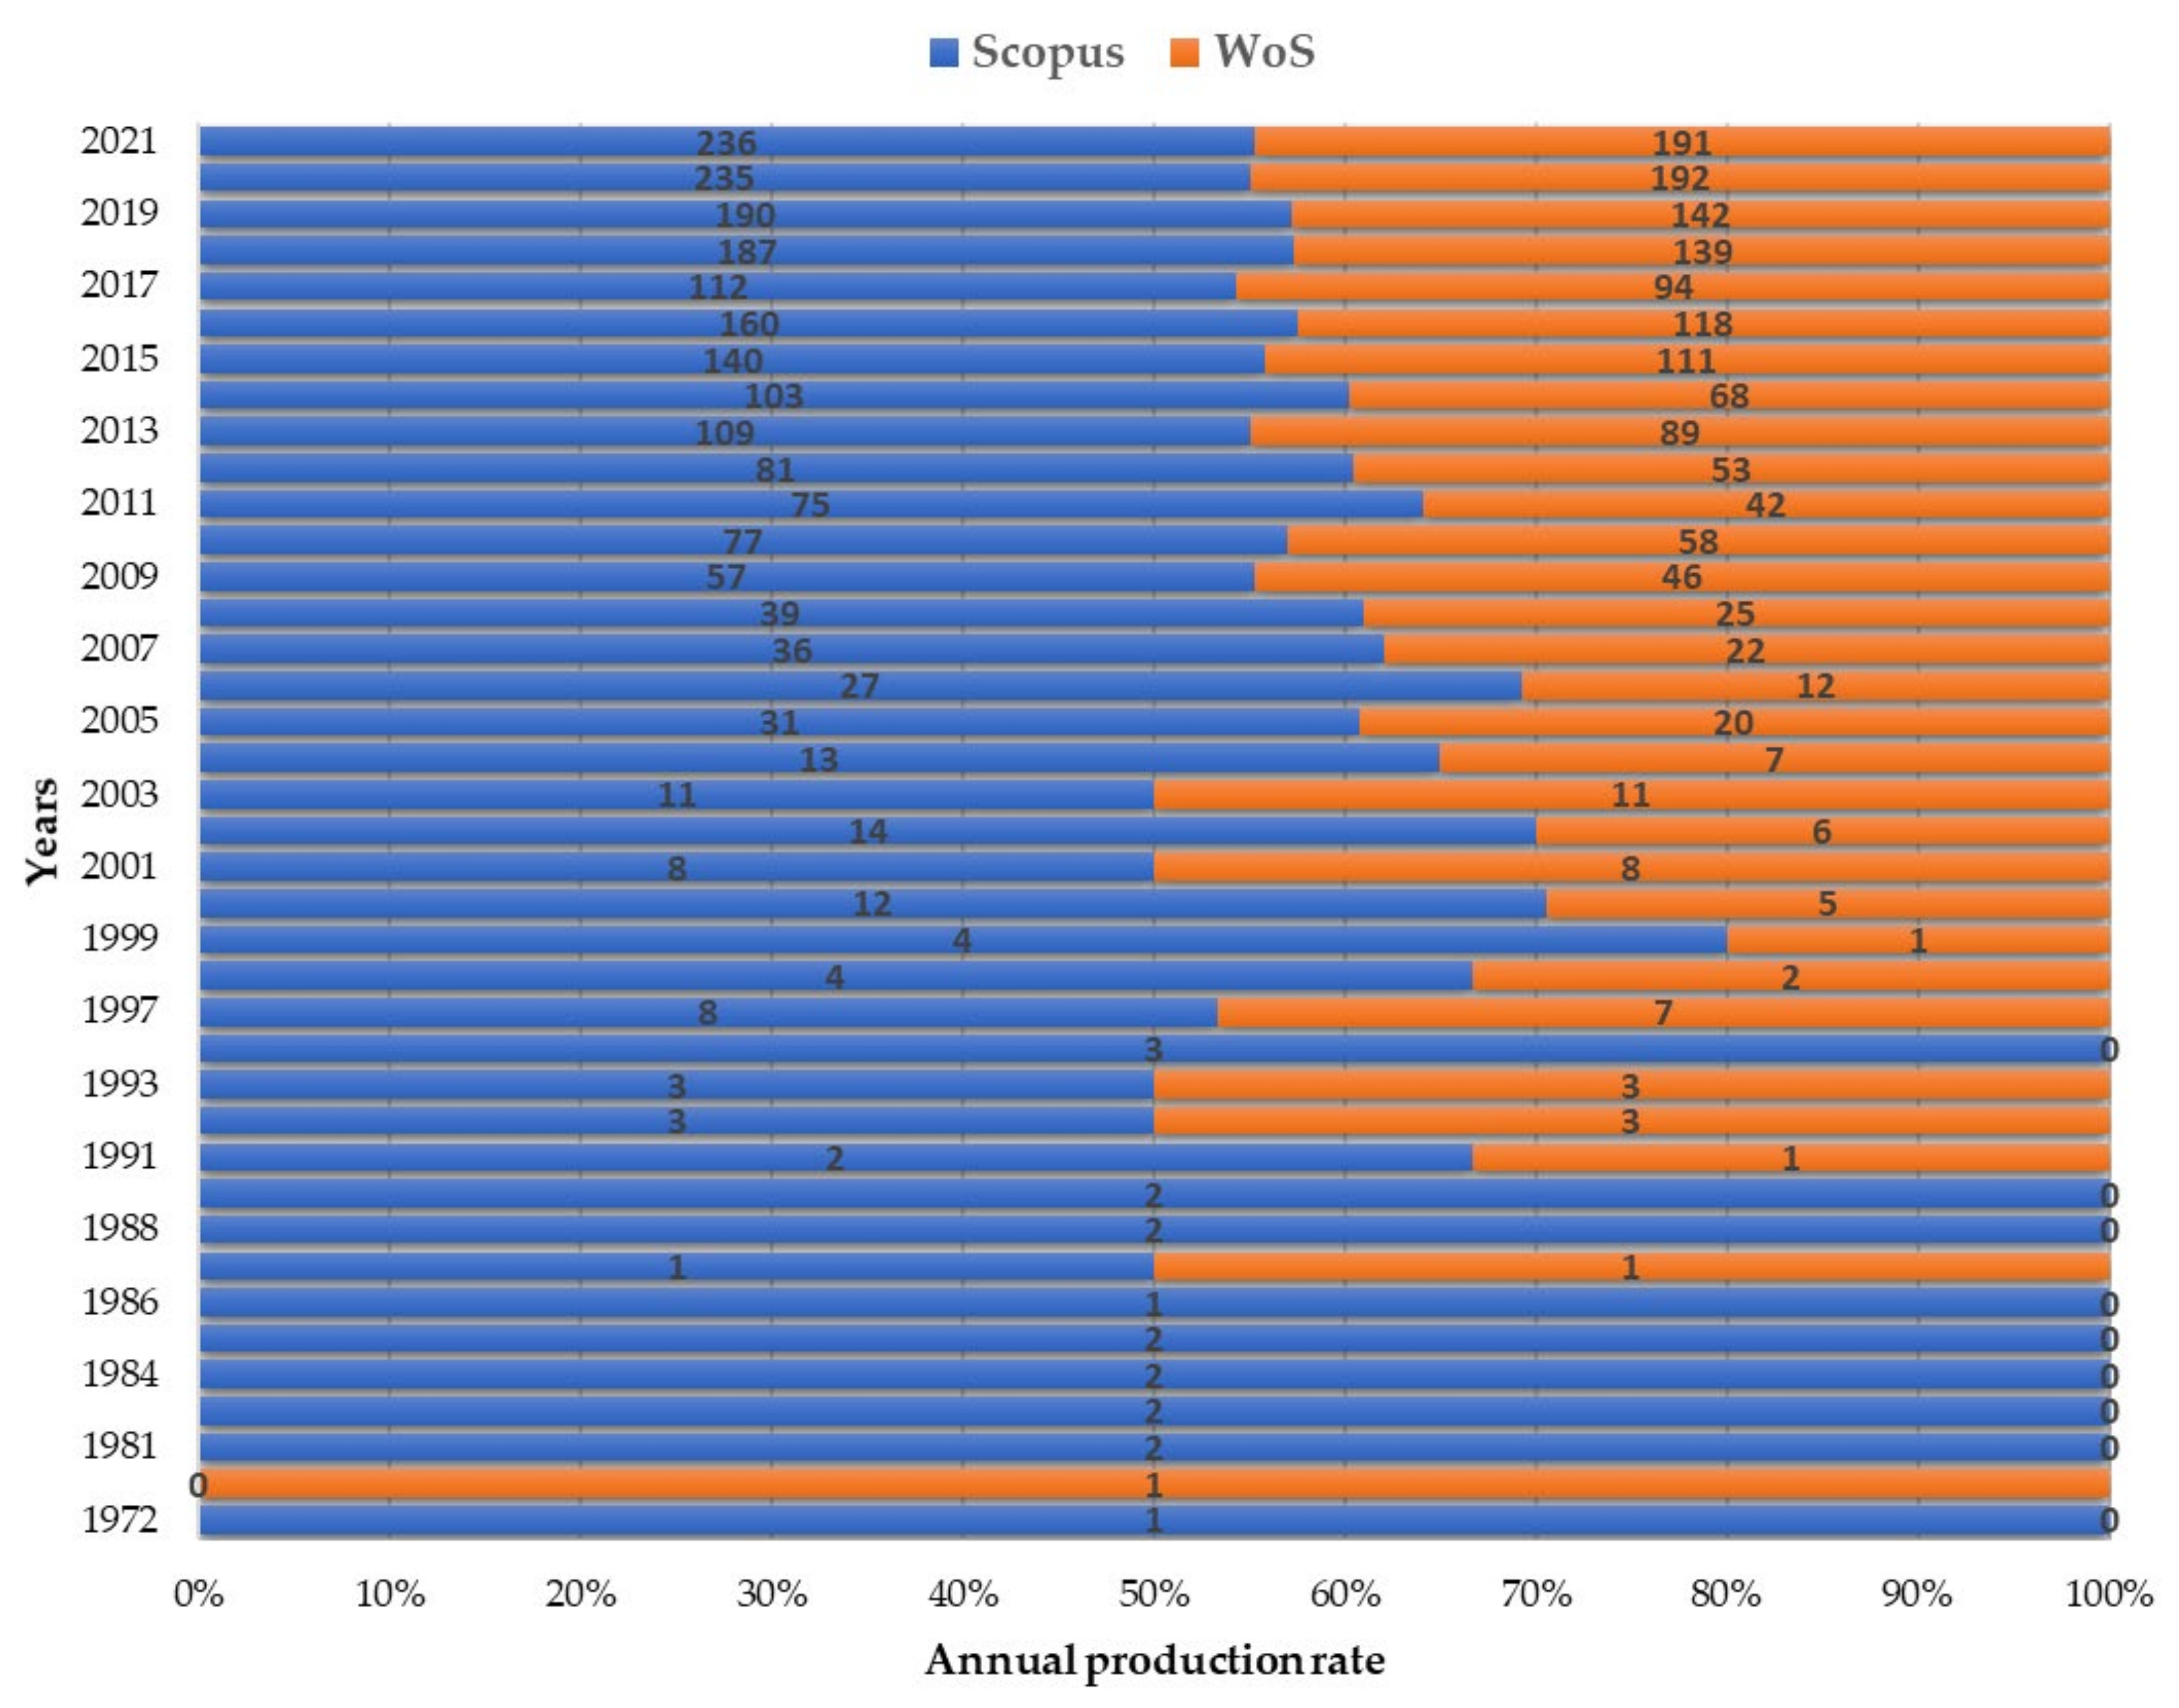
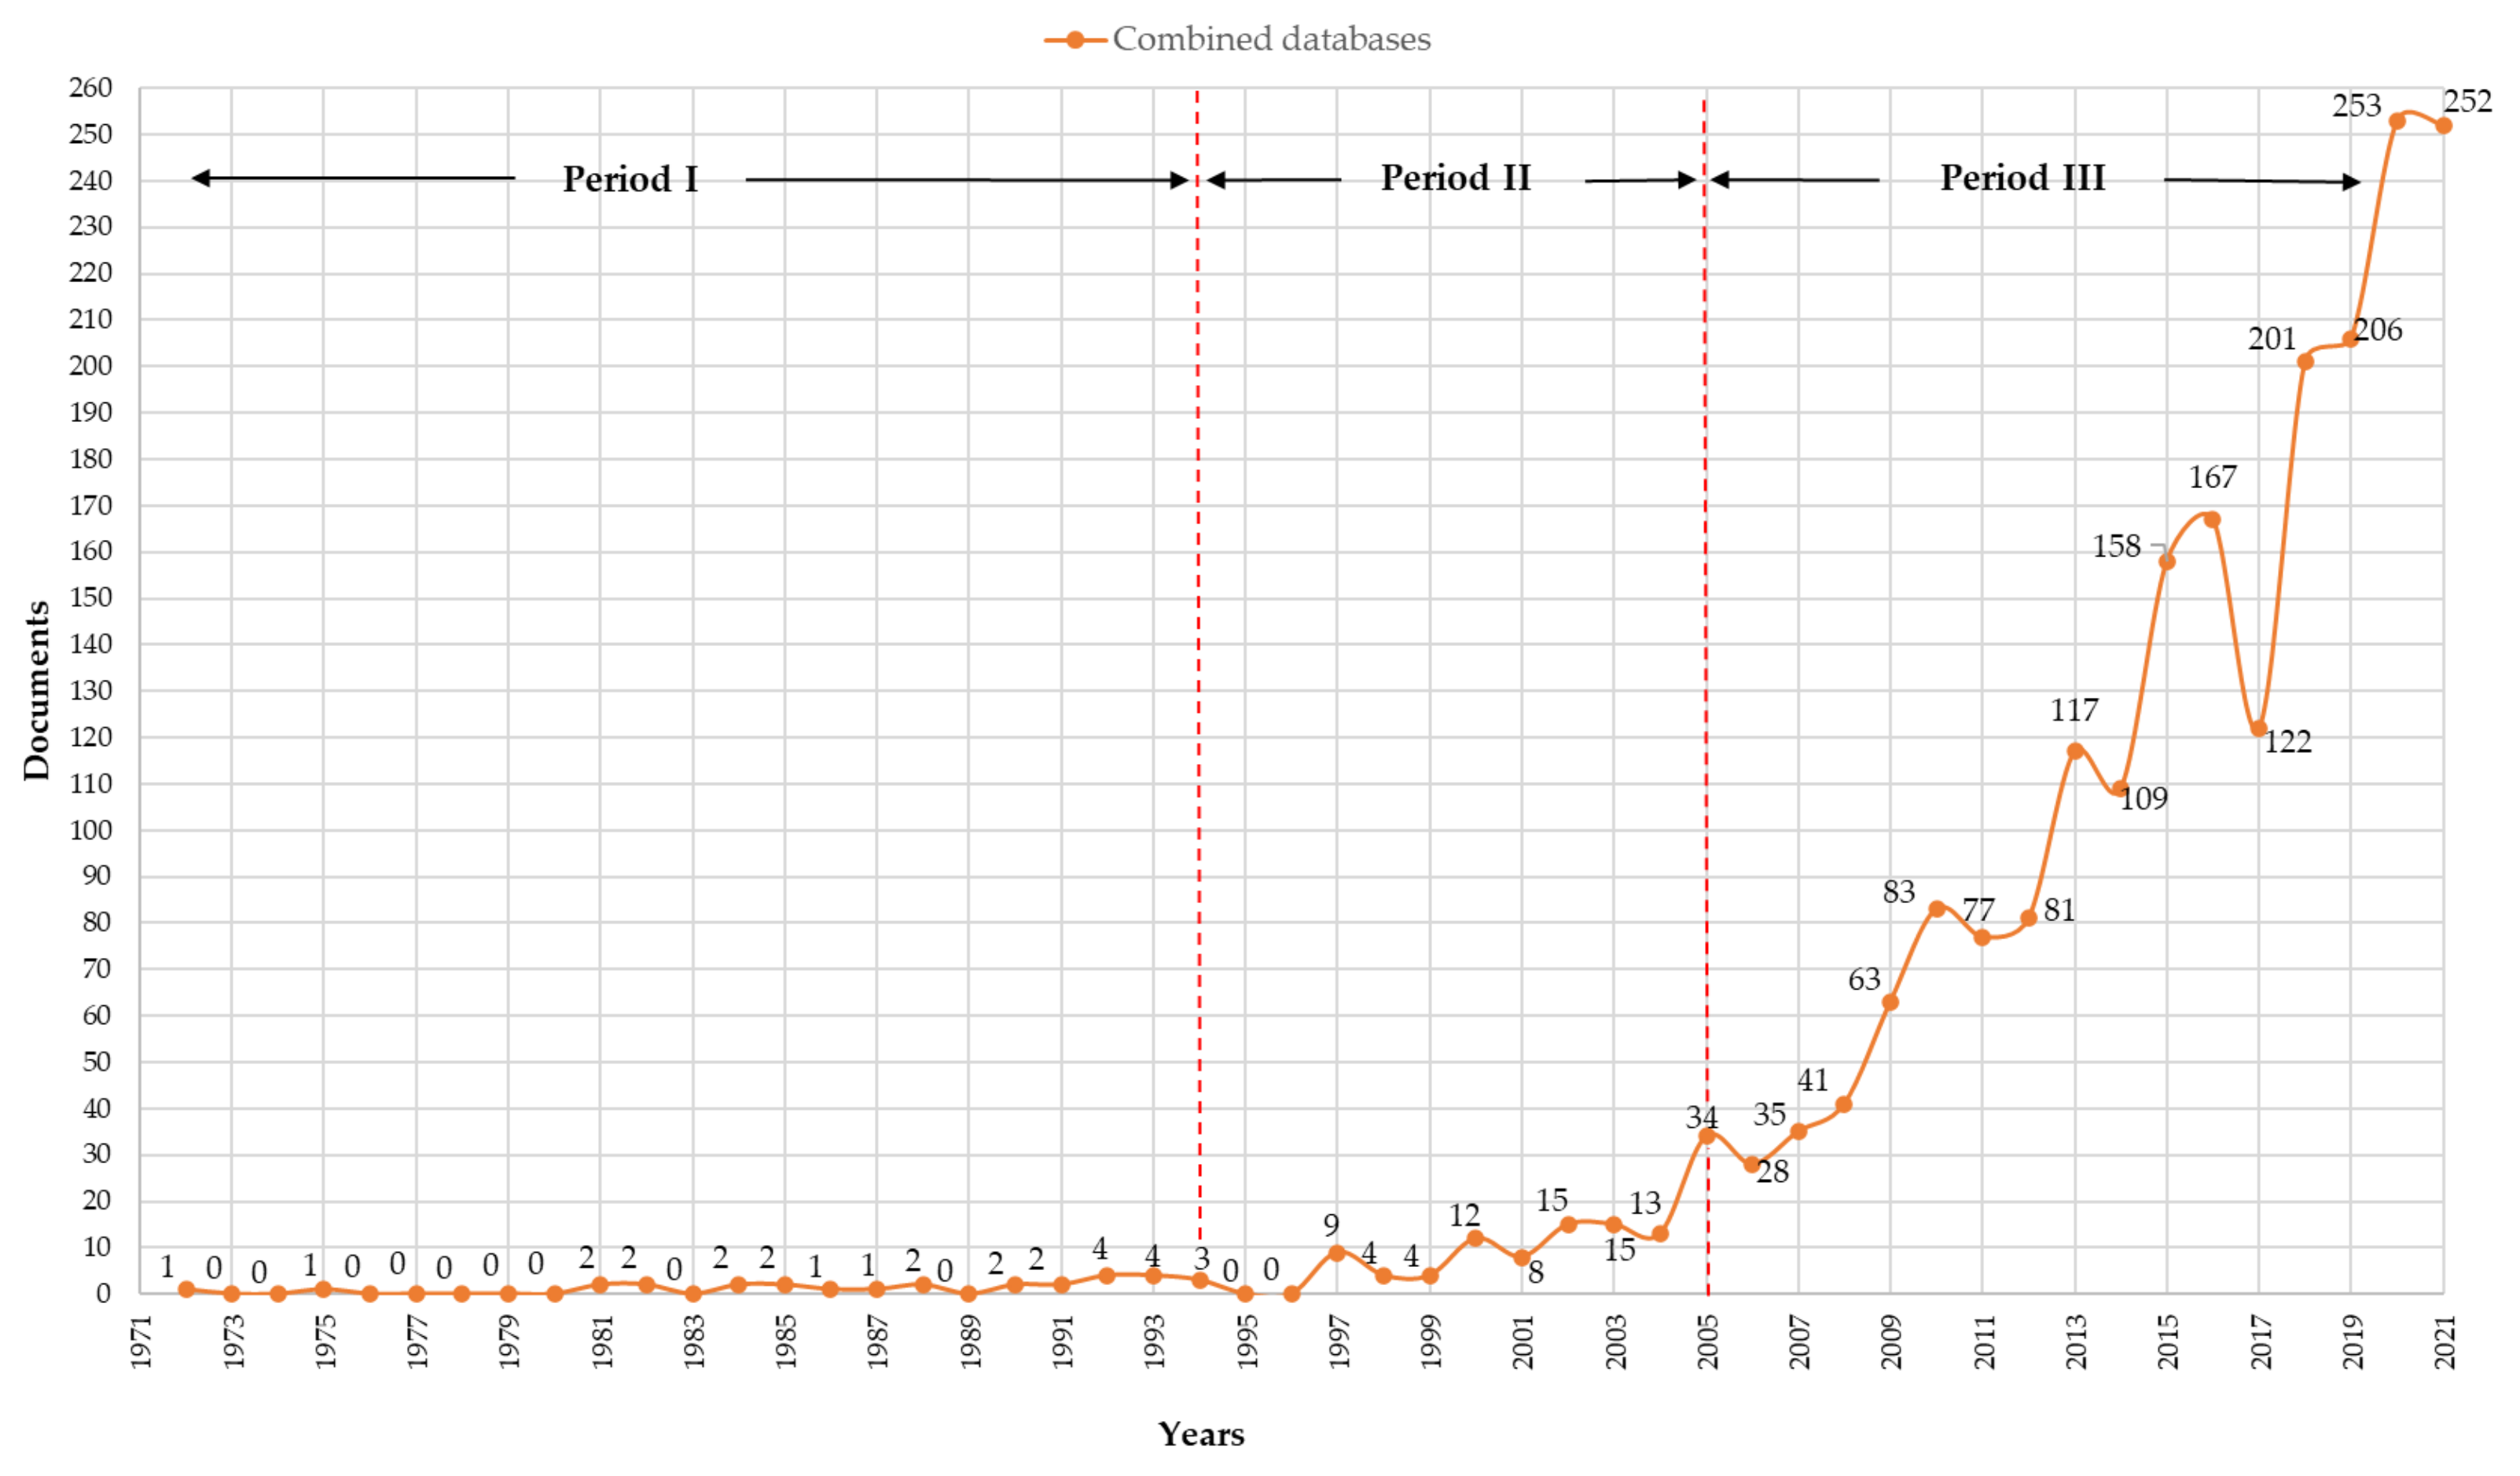
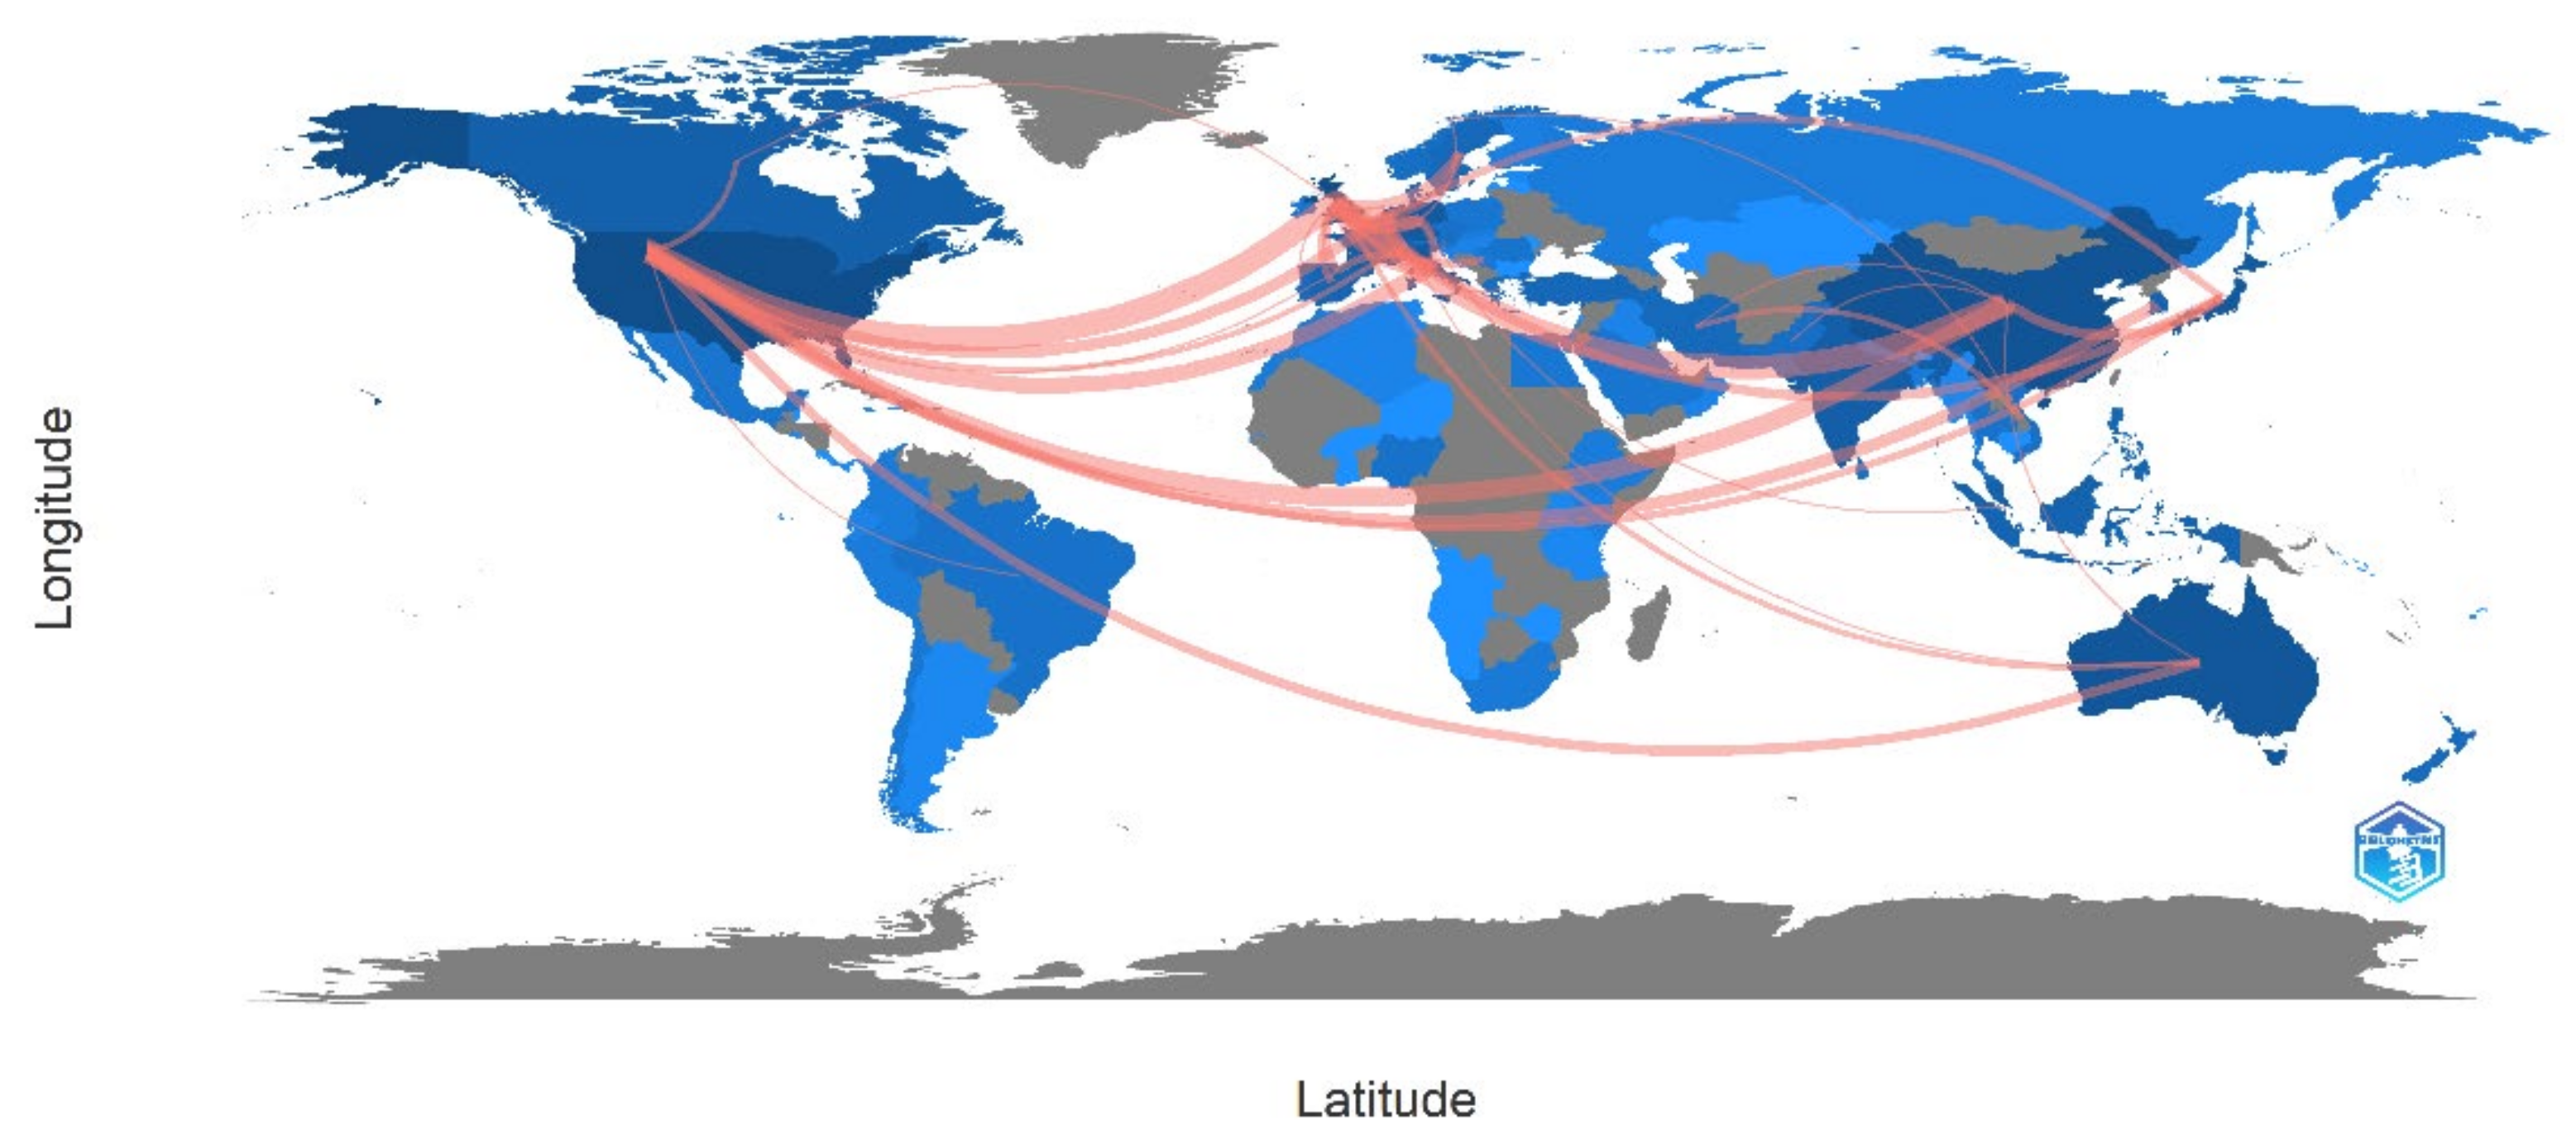
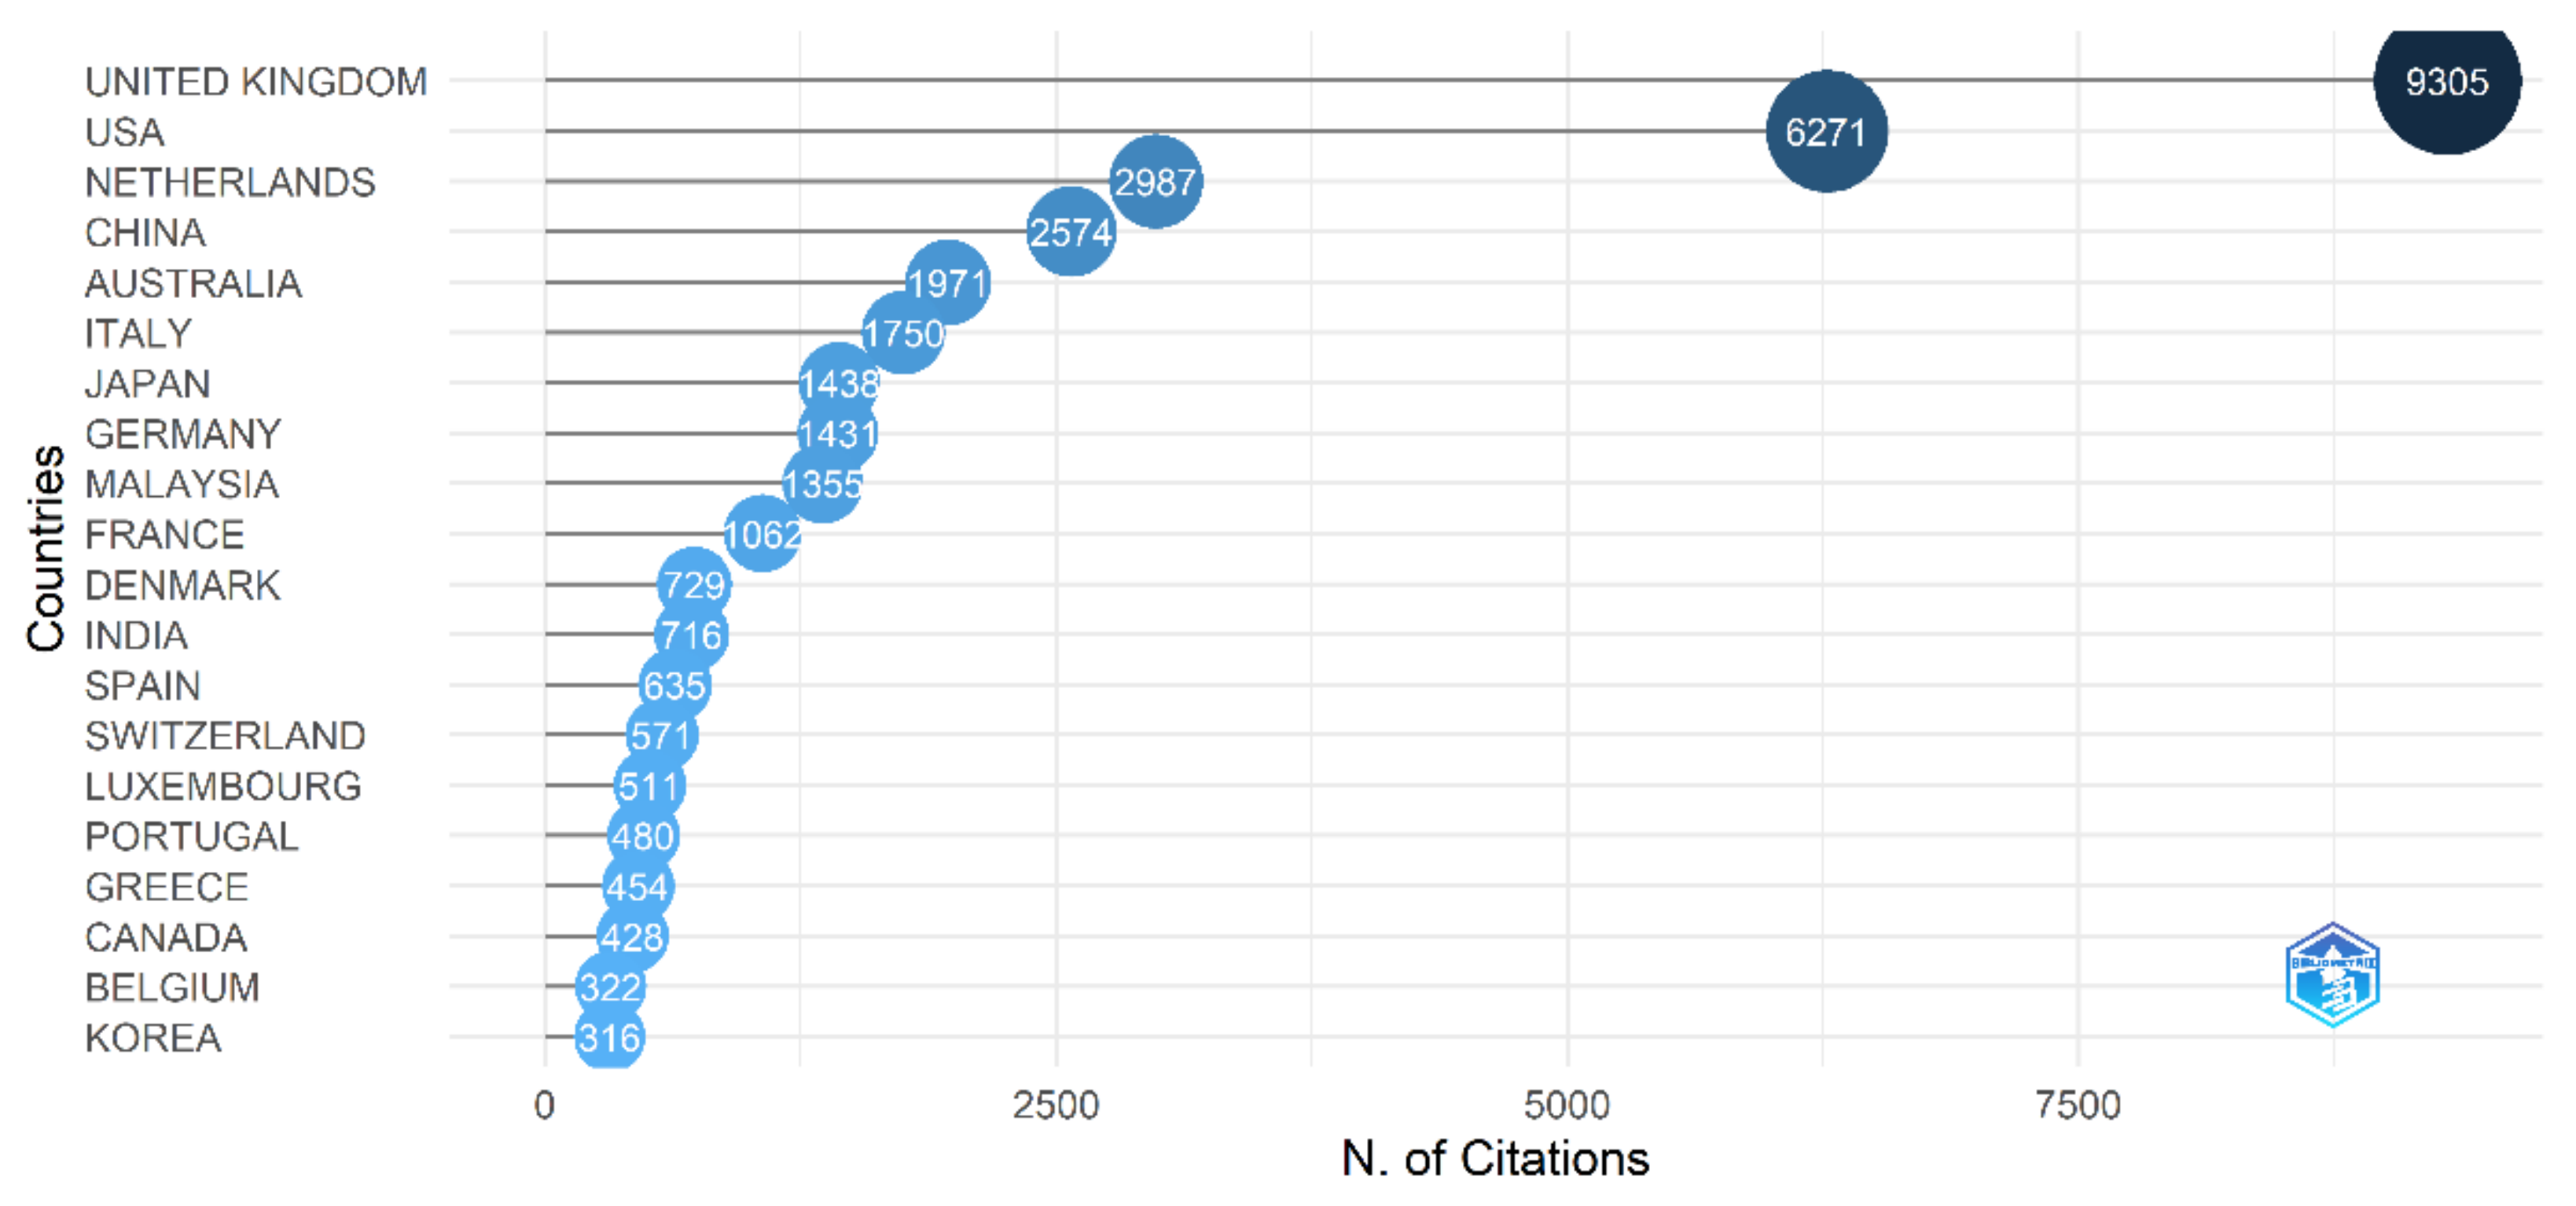
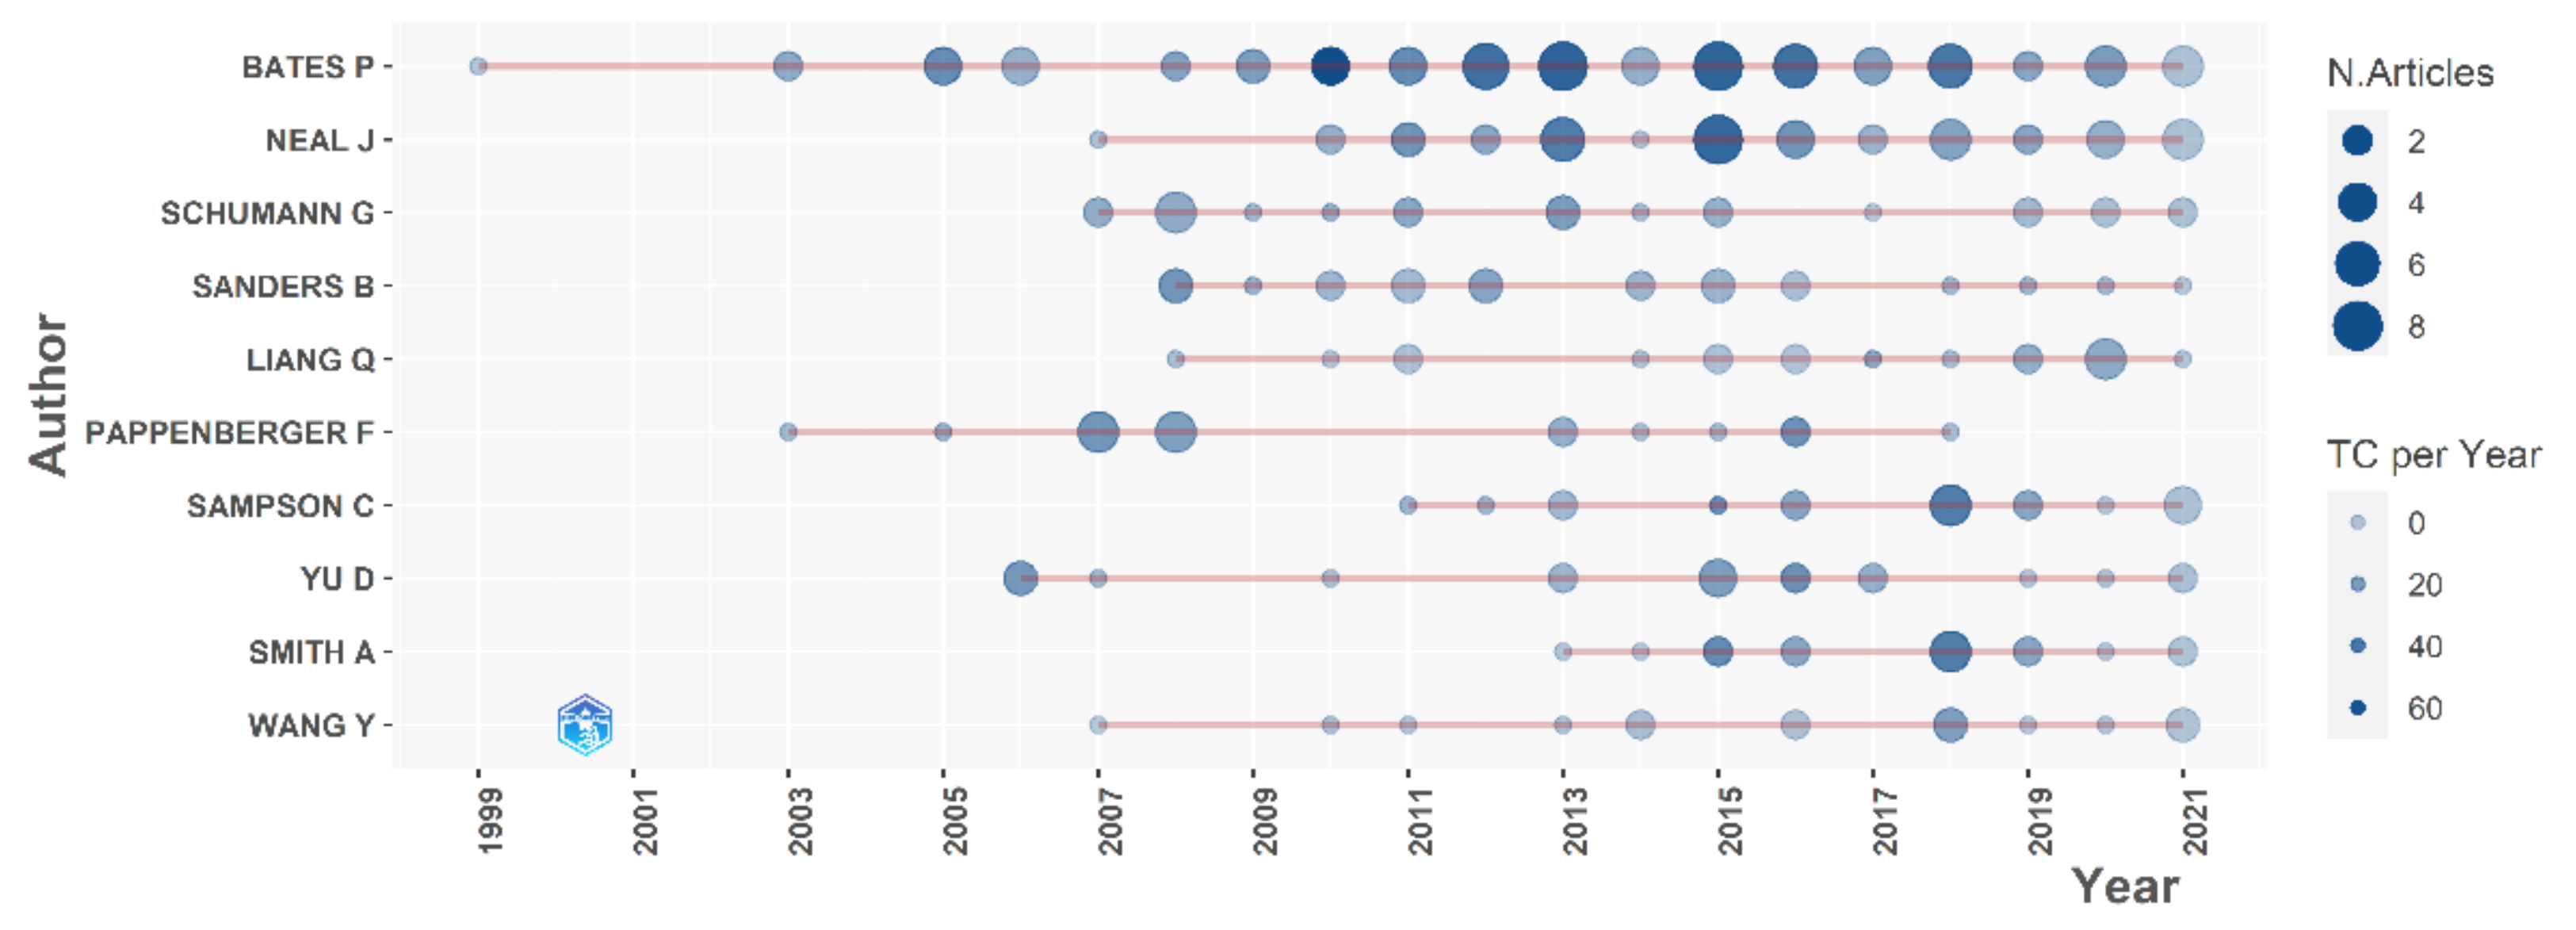
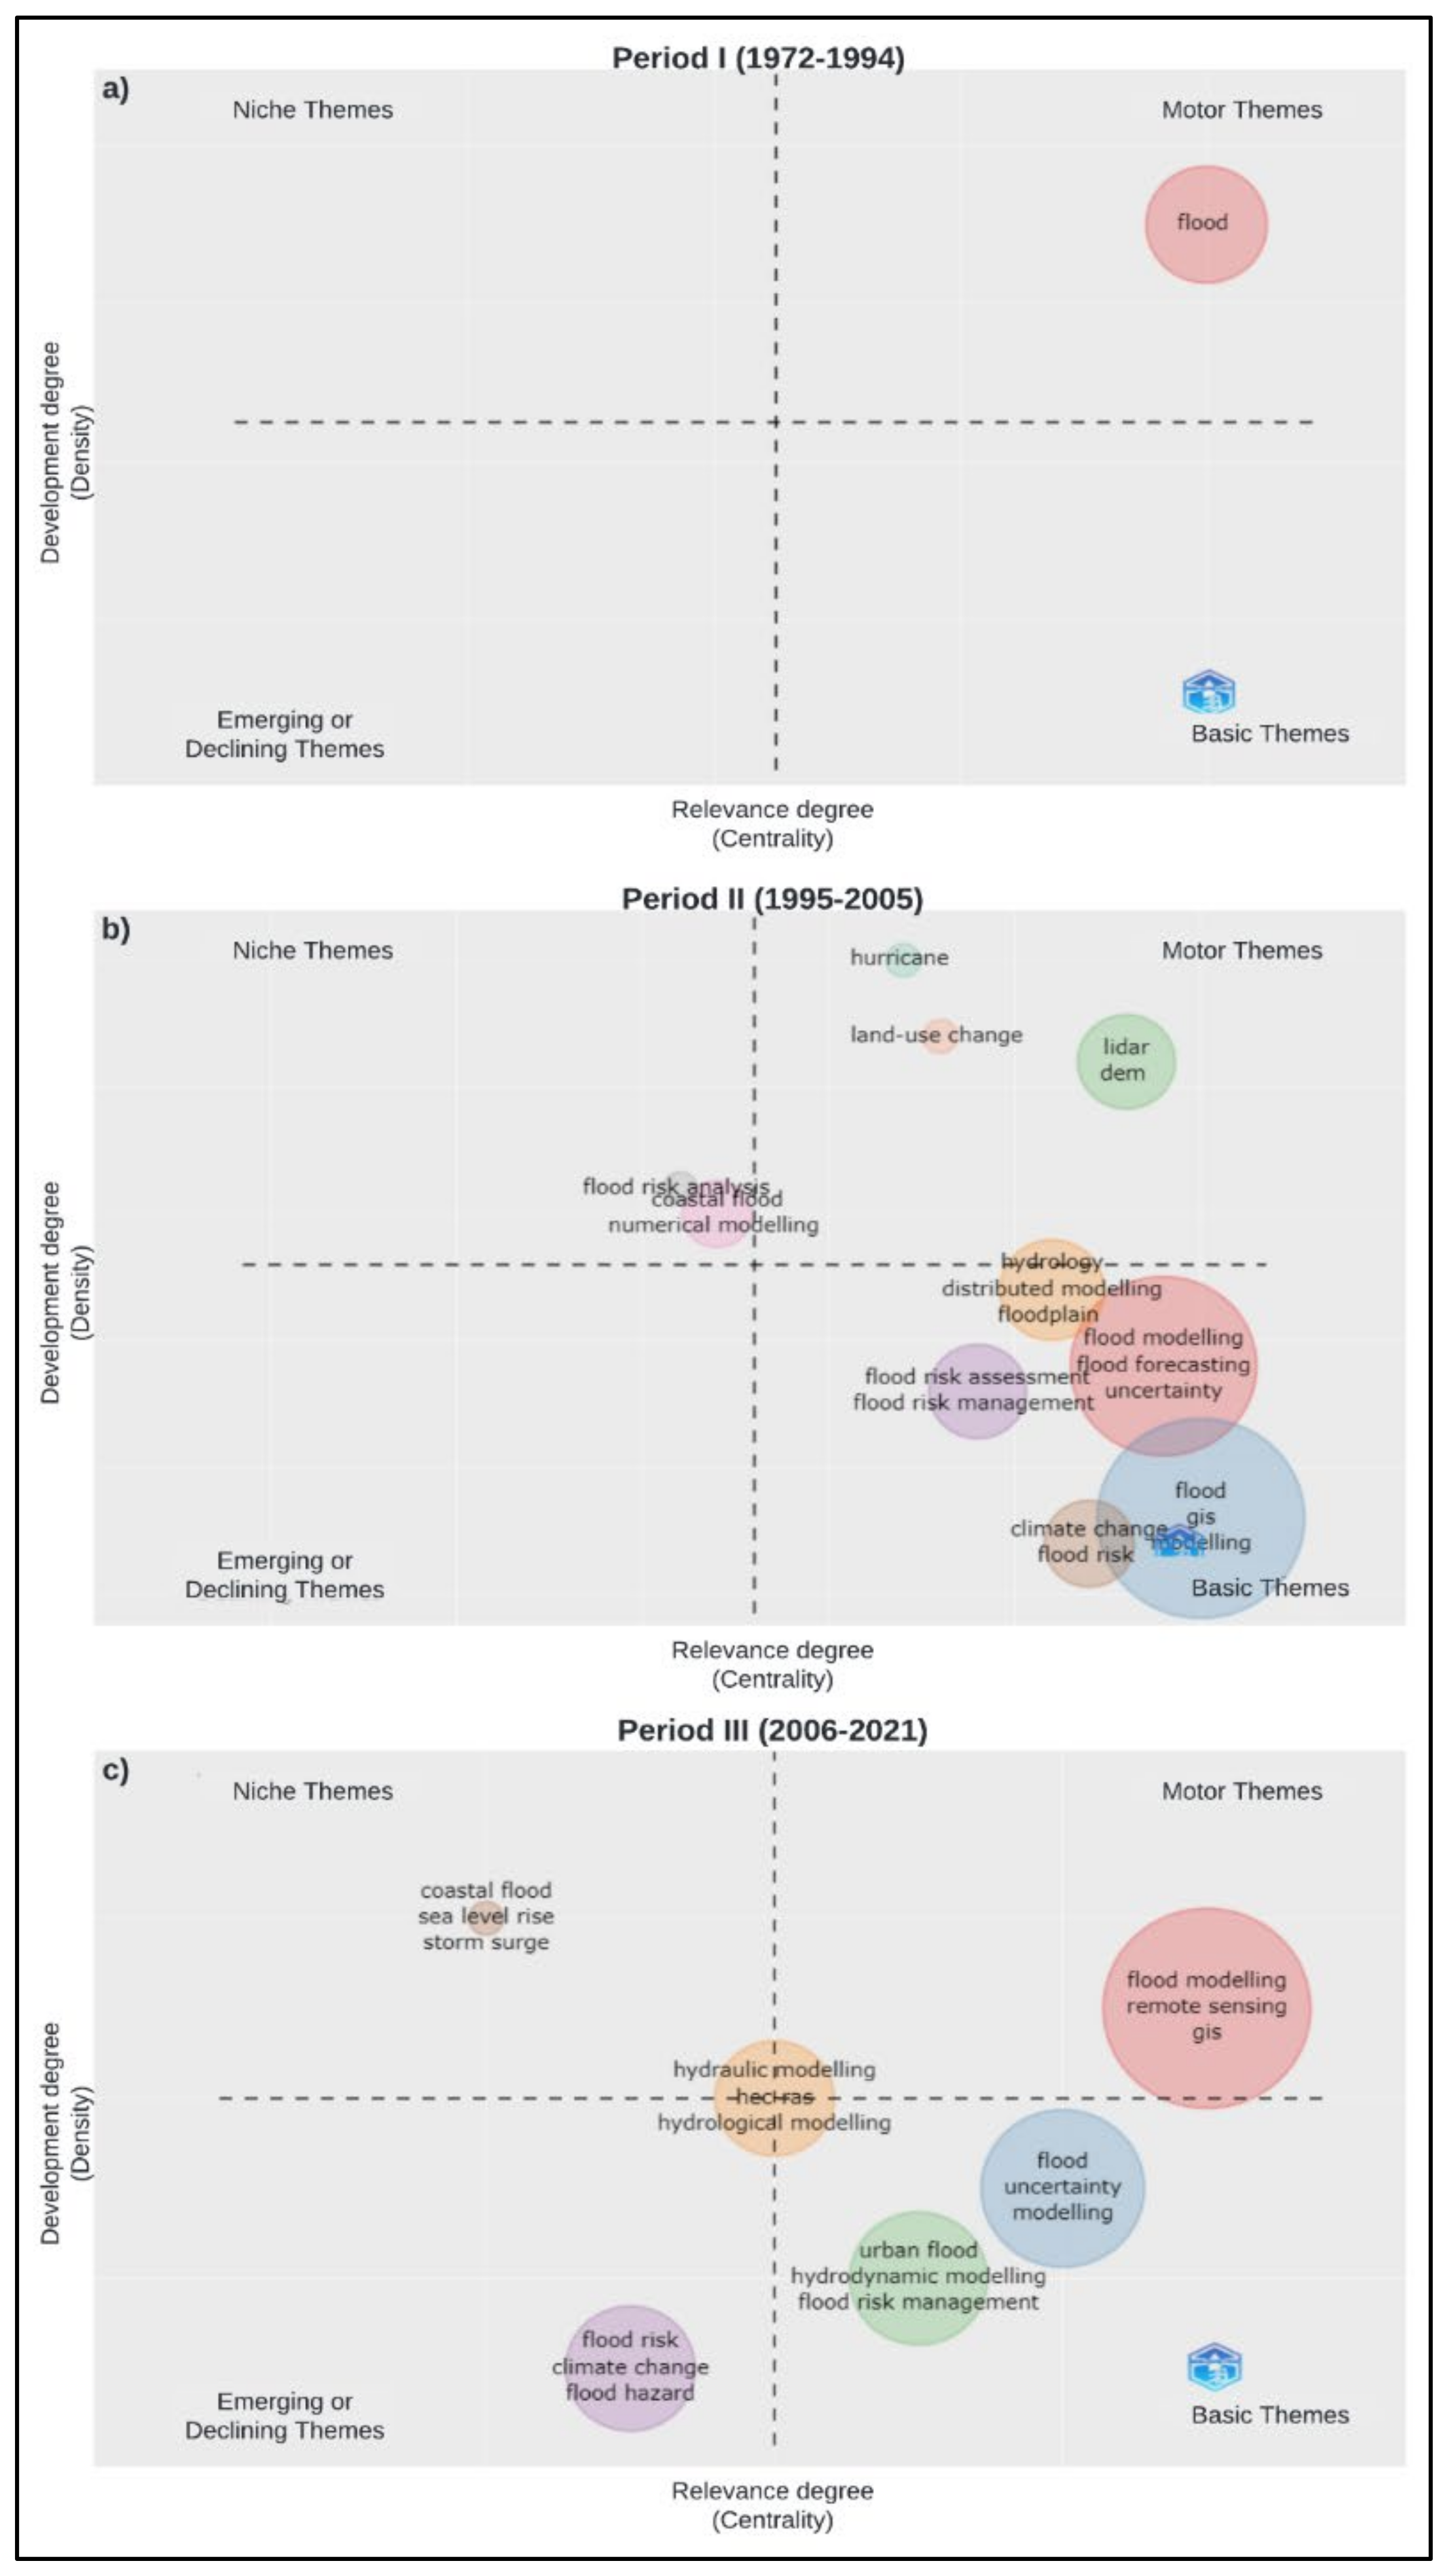
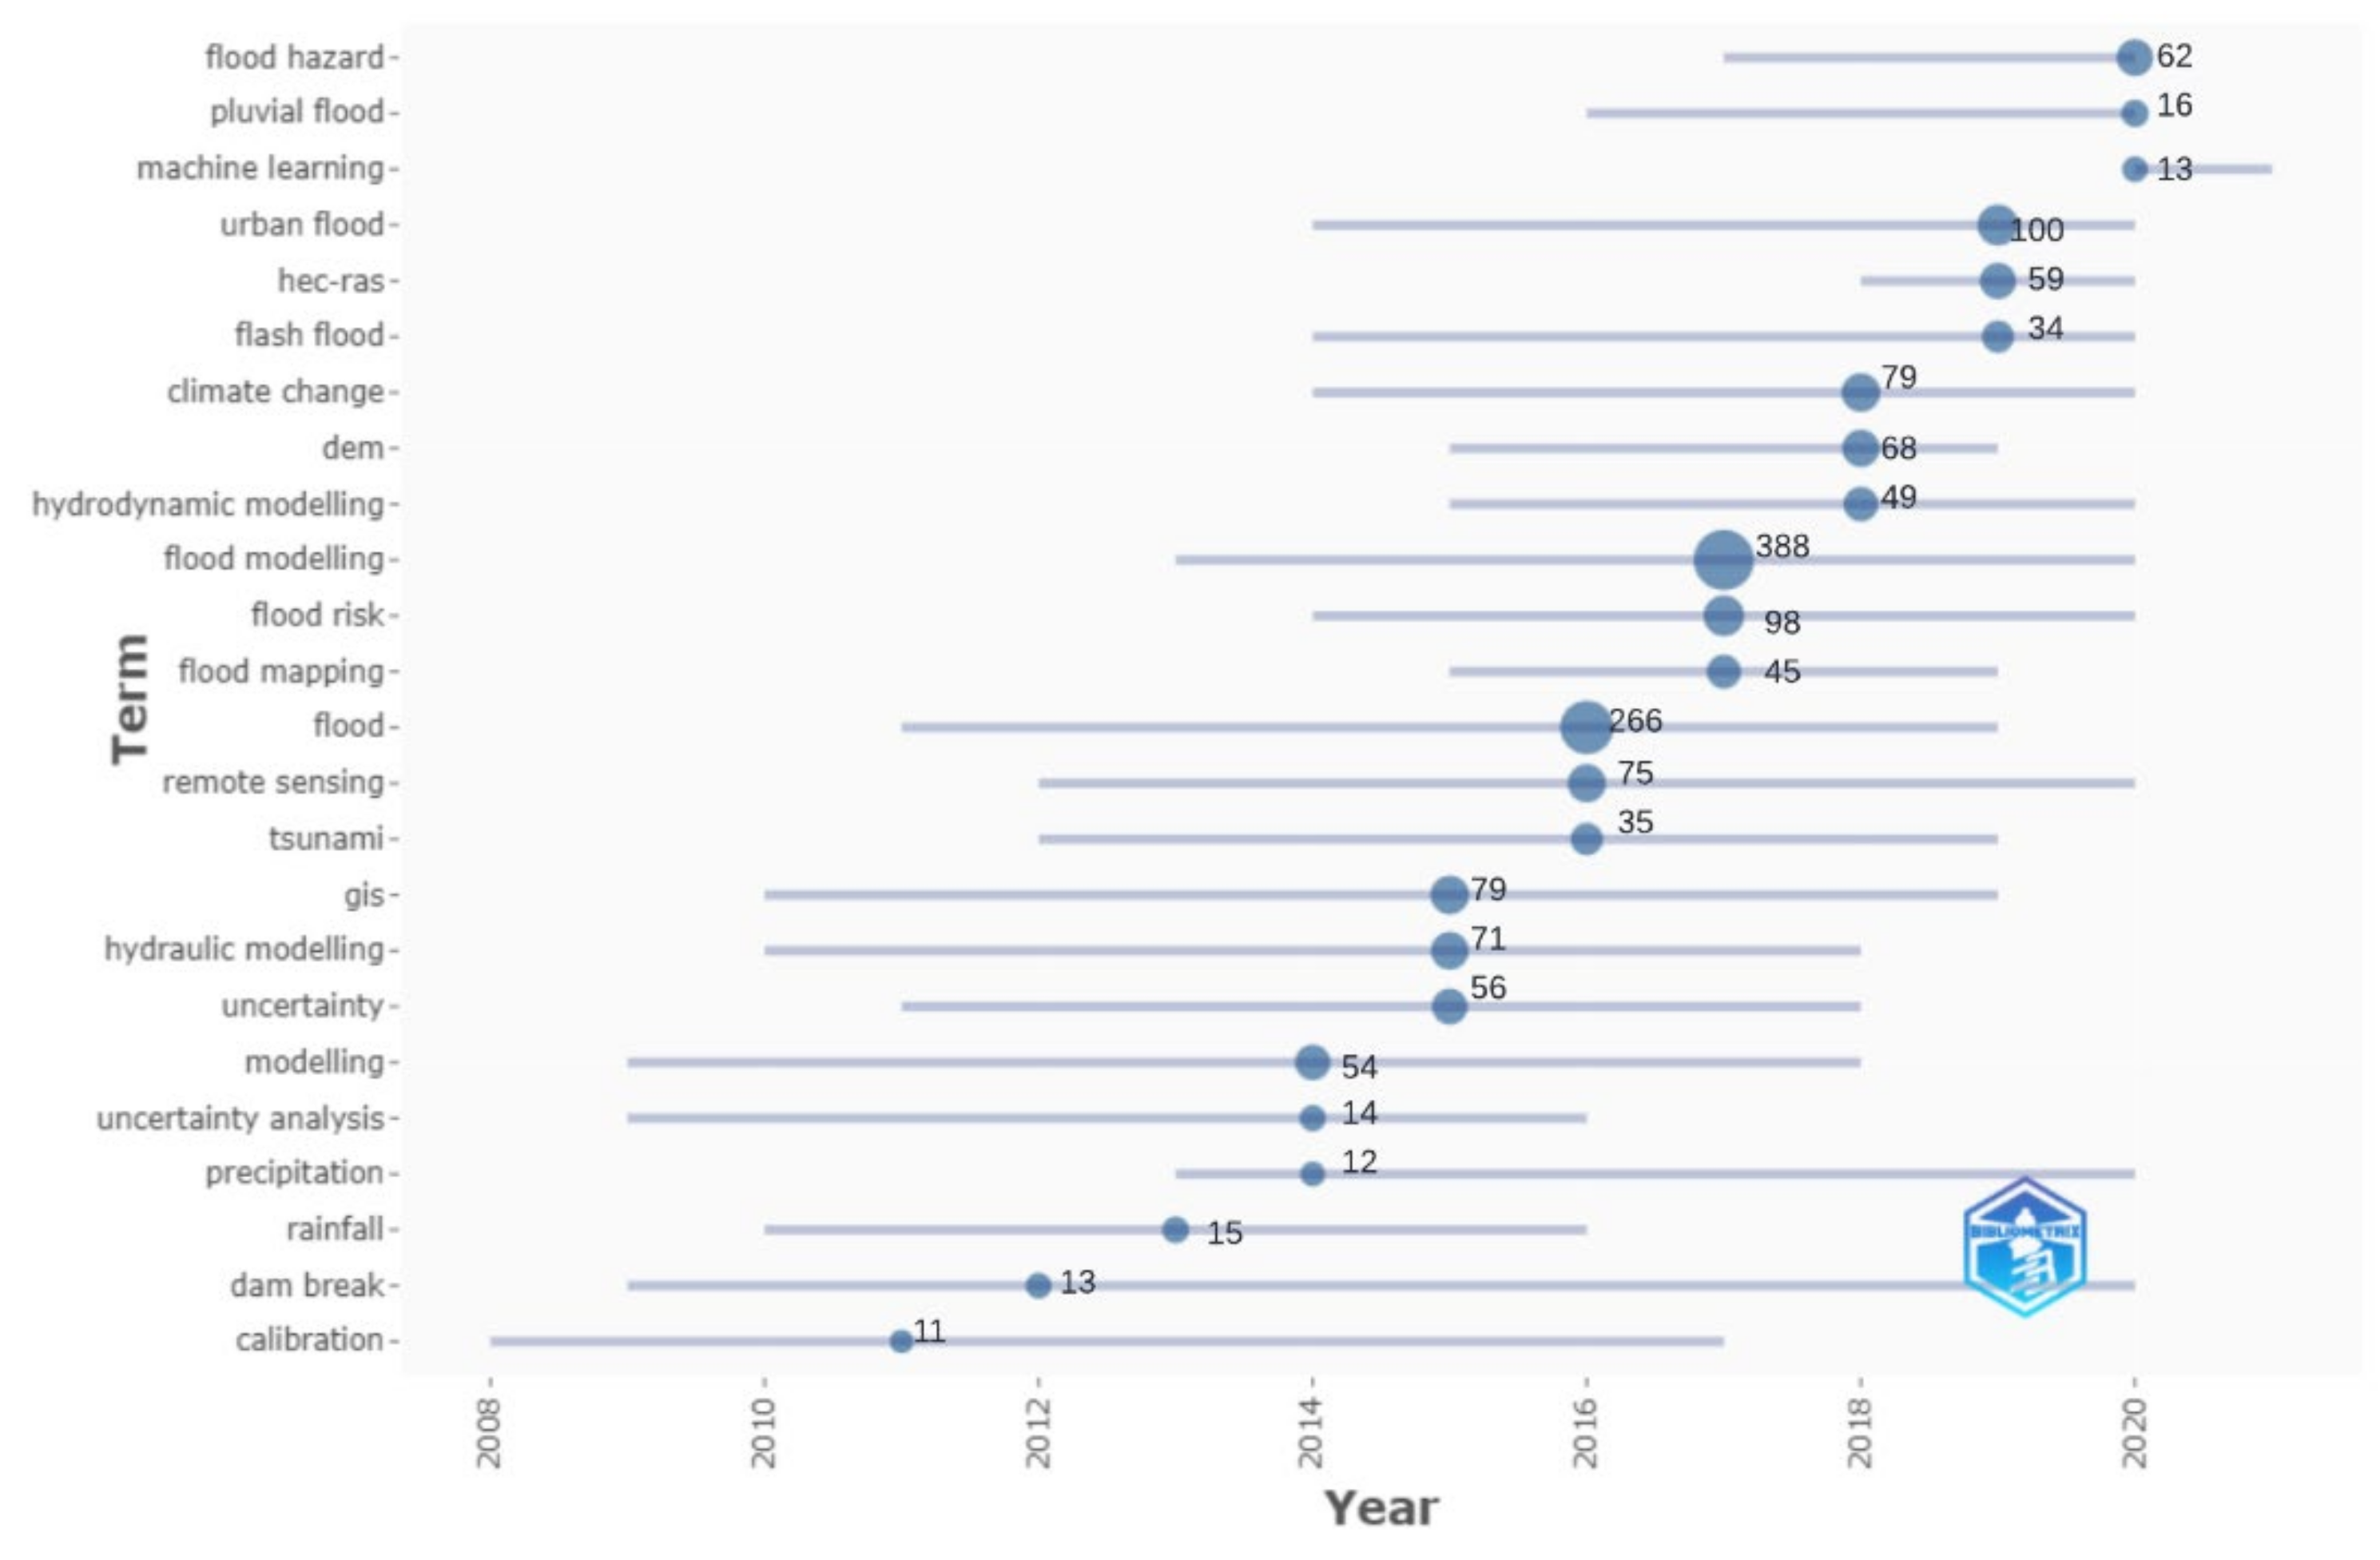
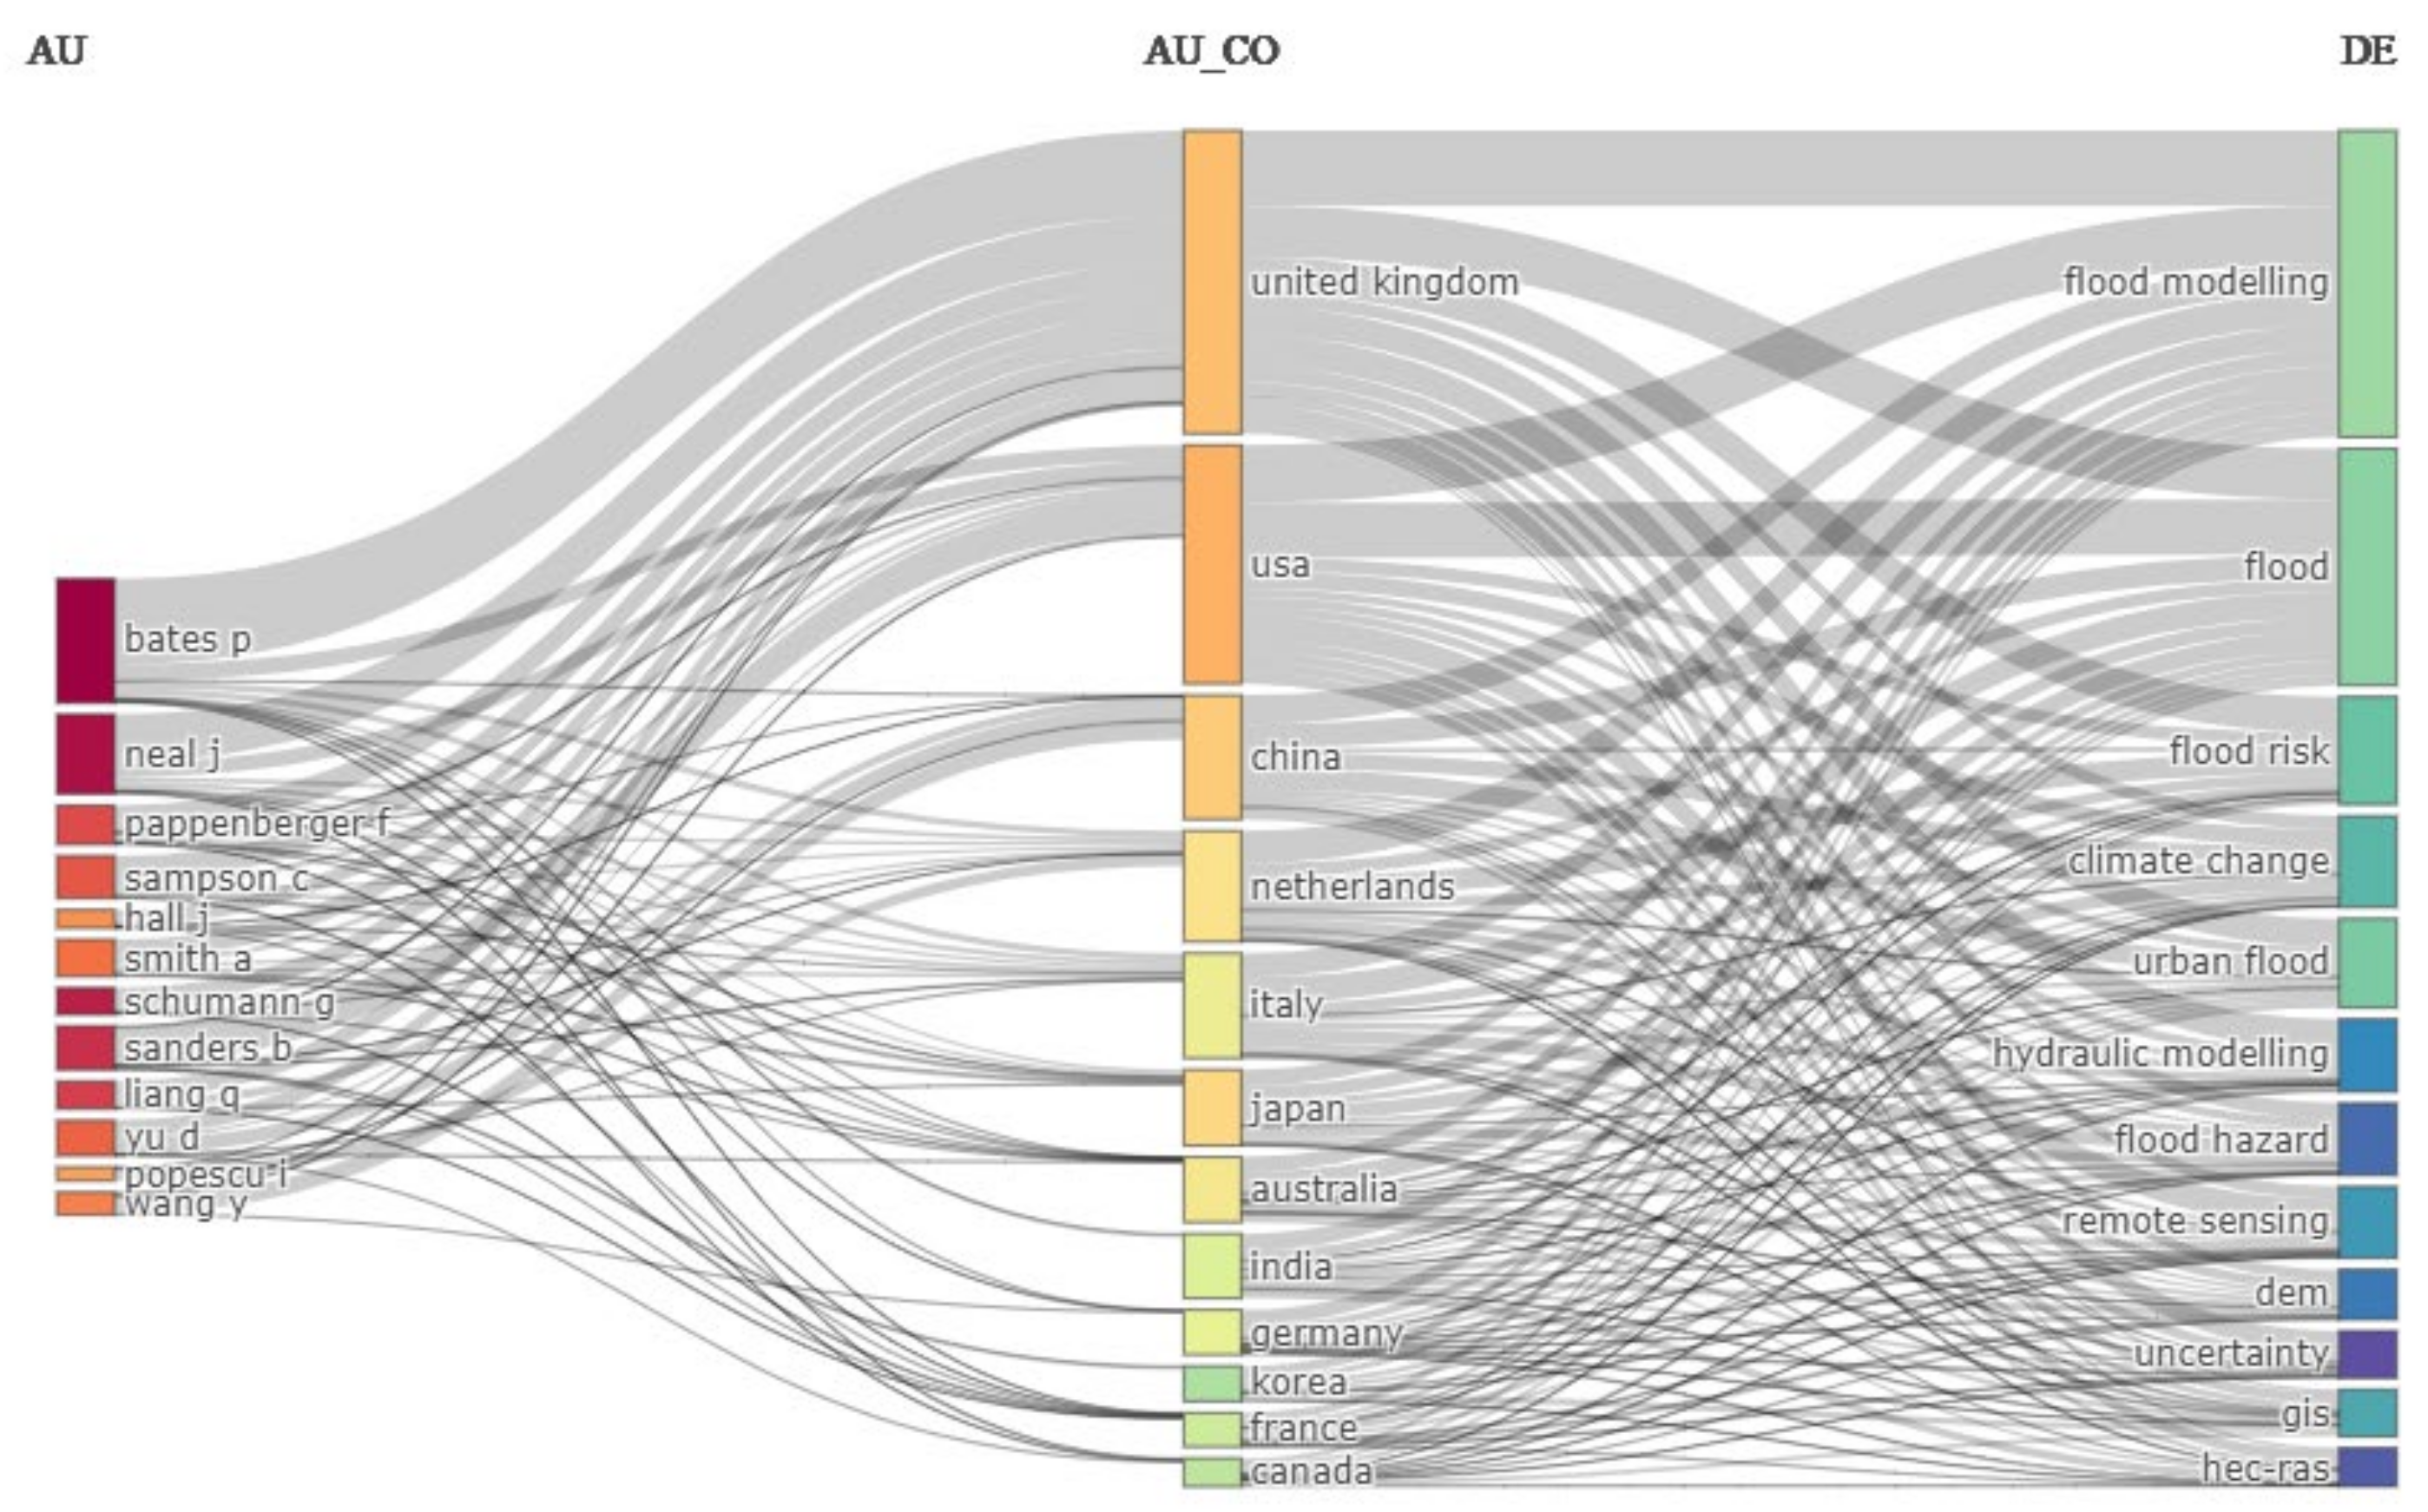
Table 1.
Classification of methods and models by their main characteristics [36].
Table 1.
Classification of methods and models by their main characteristics [36].
| Methods and Models | Main Characteristics |
|---|---|
| Empirical methods | Easy to implement and supports other modelling methods (calibration and data validation). |
| Hydrodynamic models | Focuses on simulating the movement of the flow in 1D, 2D and 3D through mathematical models. |
| Simplified conceptual models | It is efficient from a mathematical approach, does not require precision in the flow dynamics and has a low computational cost. |
Table 2.
Reviews and bibliometrics in the area of flood research.
| Title | Database | Objective | Sources |
|---|---|---|---|
| Flood Risk Analysis and Assessment, Applications and Uncertainties: A Bibliometric Review | Web of Science (WoS) (FRAn * > 9800 records) (FRAs ** > 7100 records) | To assess the historical development of Flood Risk Analysis and Assessment (FRA) and the prospects of emerging fields of application. | [50] |
| Multidimensional flood risk management under climate changes: Bibliometric analysis, trends and strategic guidelines for decision-making in urban dynamics | Web of Science (WoS) and Scopus (Elsevier) (52 documents) | Floods in the face of climate change and their impact on more frequent and more extensive flooding. | [51] |
| Flood inundation modelling: A review of methods, recent advances and uncertainty analysis | It does not present a database | Review state-of-the-art flood models to explore their advantages and limitations and discuss future approaches. | [36] |
| GLOFs in the WOS: bibliometrics, geographies and global trends of research on glacial lake outburst floods (Web of Science, 1979–2016) | Web of Science (WoS) (892 documents) | Glacial lake outburst flood research, global bibliometrics, geography and trends review. | [52] |
* FRAn: Flood Risk Analysis; ** FRAs: Flood Risk Assessment.
Table 3.
List of keywords and number of documents.
| Keywords | Results | |
|---|---|---|
| Scopus | Web of Science (WoS) | |
| “flood model” | 2164 | 1102 |
| “flood modelling” | 747 | 367 |
| “inundation model” | 1084 | 664 |
| “inundation modelling” | 257 | 133 |
| “flood inundation modelling” | 199 | 67 |
| (“flood model” OR “flood modelling” OR “inundation model” OR “inundation modelling” OR “overflow flood model*”) OR “overflow flood modelling” OR “flood inundation modelling”) AND (“assessment” OR “risk” OR “analysis”) | 2070 | 1494 |
| Scopus AND Web of Science (WoS) | ||
| (“flood model” OR “flood modelling” OR “inundation model” OR “inundation modelling” OR “overflow flood model*”) OR “overflow flood modelling” OR “flood inundation modelling”) AND (“assessment” OR “risk” OR “analysis”) | 2290 | |
Table 4.
Main data of the combined database.
| Main Information | Results |
|---|---|
| Documents production | |
| Sources (Journals, Books, among others) | 775 |
| Documents | 2136 |
| Average years from publication | 7.06 |
| Average citations per documents | 18.73 |
| Average citations per year per doc | 2.302 |
| References | 60,637 |
| Document contents | |
| Keywords | 4598 |
| Authors | 5649 |
| Author appearances | 8903 |
| Authors of single-authored documents | 107 |
| Authors of multi-authored documents | 5542 |
| Authors collaboration | |
| Single-authored documents | 118 |
| Documents per Author | 0.378 |
| Authors per Document | 2.64 |
| Co-Authors per Documents | 4.17 |
| Collaboration Index | 2.75 |
Table 5.
Leading authors by the number of citations in flood modelling. Total Cites (TC) and Number of Publications (NP).
Table 5.
Leading authors by the number of citations in flood modelling. Total Cites (TC) and Number of Publications (NP).
| Authors | Affiliation | Country | TC | NP | H-Index (Scopus) | H-Index (WoS) |
|---|---|---|---|---|---|---|
| Bates P. | University of Bristol | United Kingdom | 1181 | 79 | 84 | 82 |
| Neal J. | University of Bristol | United Kingdom | 434 | 45 | 41 | 38 |
| Horritt M. | Horritt Consulting, Ross-on-Wye | United Kingdom | 383 | 10 | 37 | 32 |
| Fewtrell T. | Willis Towers Watson, London | United Kingdom | 379 | 8 | 14 | 11 |
| Sanders B. | University of California, Irvine | United States | 267 | 23 | 41 | 41 |
| Sampson Christopher C. | Fathom, Bristol | United Kingdom | 246 | 19 | 21 | 21 |
| Schumann G. | University of Bristol | United Kingdom | 242 | 24 | 40 | 36 |
| Schubert J. | University of California, Irvine | United States | 238 | 14 | 17 | 18 |
| Pappenberger F. | European Centre for Medium-Range Weather Forecasts | United Kingdom | 233 | 19 | 56 | 56 |
| Beven K. | Lancaster Environment Centre, Lancaster | United Kingdom | 203 | 14 | 96 | 91 |
Publisher’s Note: MDPI stays neutral with regard to jurisdictional claims in published maps and institutional affiliations. |
© 2022 by the authors. Licensee MDPI, Basel, Switzerland. This article is an open access article distributed under the terms and conditions of the Creative Commons Attribution (CC BY) license (https://creativecommons.org/licenses/by/4.0/).
Share and Cite
MDPI and ACS Style
Morante-Carballo, F.; Montalván-Burbano, N.; Arias-Hidalgo, M.; Domínguez-Granda, L.; Apolo-Masache, B.; Carrión-Mero, P. Flood Models: An Exploratory Analysis and Research Trends. Water 2022, 14, 2488. https://doi.org/10.3390/w14162488
AMA Style
Morante-Carballo F, Montalván-Burbano N, Arias-Hidalgo M, Domínguez-Granda L, Apolo-Masache B, Carrión-Mero P. Flood Models: An Exploratory Analysis and Research Trends. Water. 2022; 14(16):2488. https://doi.org/10.3390/w14162488
Chicago/Turabian StyleMorante-Carballo, Fernando, Néstor Montalván-Burbano, Mijaíl Arias-Hidalgo, Luis Domínguez-Granda, Boris Apolo-Masache, and Paúl Carrión-Mero. 2022. "Flood Models: An Exploratory Analysis and Research Trends" Water 14, no. 16: 2488. https://doi.org/10.3390/w14162488
Note that from the first issue of 2016, this journal uses article numbers instead of page numbers. See further details here.