
Degradation Efficiency Analysis of Sulfadiazine in Water by Ozone/Persulfate Advanced Oxidation Process

1
Key Laboratory of Songliao Aquatic Environment, Ministry of Education, Jilin Jianzhu University, Changchun 130118, China
2
Sino Pharmengin Corporation, Wuhan 430077, China
*
Author to whom correspondence should be addressed.
Water 2022, 14(16), 2476; https://doi.org/10.3390/w14162476
Submission received: 29 June 2022
/
Revised: 26 July 2022
/
Accepted: 8 August 2022
/
Published: 11 August 2022
(This article belongs to the Section Wastewater Treatment and Reuse)
Abstract
:Antibiotics are a new class of organic compounds that have antibacterial and anti-inflammatory effects in the clinic, but their widespread use has serious adverse effects on the natural water environment. Sulfadiazine (SDZ) is a typical kind of antibiotic, and the treatment effect of the traditional biochemical degradation process has not been ideal. Thus, in order to find a more efficient and clean degradation method, we investigated the degradation effect of ozone/persulfate (O3/PMS) advanced oxidation process (AOPs) on SDZ in prepared water and natural water for the first time and compared it with the experimental results of ozone (O3) and ozone/ultraviolet (O3/UV) methods. The experimental results showed that when the initial mass concentration of O3 was 3 mg/L, the initial mass concentration of SDZ was 10 mg/L, the temperature was 25 °C, the pH was 6.8 ± 0.1, the Kobs of O3/PMS was 0.2497 min−1, and the Kobs values of O3 and O3/UV were 0.1242 and 0.1328 min−1, respectively. The time required for O3/PMS to degrade SDZ below the detection limit (0.01 mg/L) was about 7 min shorter than that of O3 and O3/UV. It was found that in O3/PMS, the increase in the initial mass concentration of SDZ inhibited its degradation, and the increase in the initial mass concentration of ozone increased the degradation rate of sulfadiazine. The degradation process conformed to the pseudo-first-order reaction kinetic equation. O3/PMS was suitable for weak alkaline environments. When pH was 9, the concentration of free radicals was the highest. Excessive alkalinity led to mutual quenching of free radicals and reduced the degradation rate. The mineralization effect of O3/PMS was slightly worse than that of the O3/UV process, but O3/PMS effectively degraded SDZ and fluorescent substances dissolved in water, with good prospects in practical engineering applications.
1. Introduction
Antibiotics are chemical substances produced by or synthesized in the metabolic processes of higher animals, plants, or microorganisms (including fungi, bacteria, and actinomycetes). They can selectively inhibit or kill some microorganisms and pathogenic cells at low concentrations. The appearance and successful application of antibiotics have significantly reduced the incidence and mortality of various infectious diseases. In addition, they can effectively treat various bacterial infectious diseases, protect the healthy development of human beings, and promote the development of chemistry, biology, and other basic sciences [1,2]. In 1950, the U.S. Food and Drug Administration (FDA) first approved the addition of antibiotics to animal feed in a sub-therapeutic dose, improving the feed conversion rate and promoting animal growth. Since then, antibiotics have been widely promoted in animal husbandry [3,4,5,6,7].
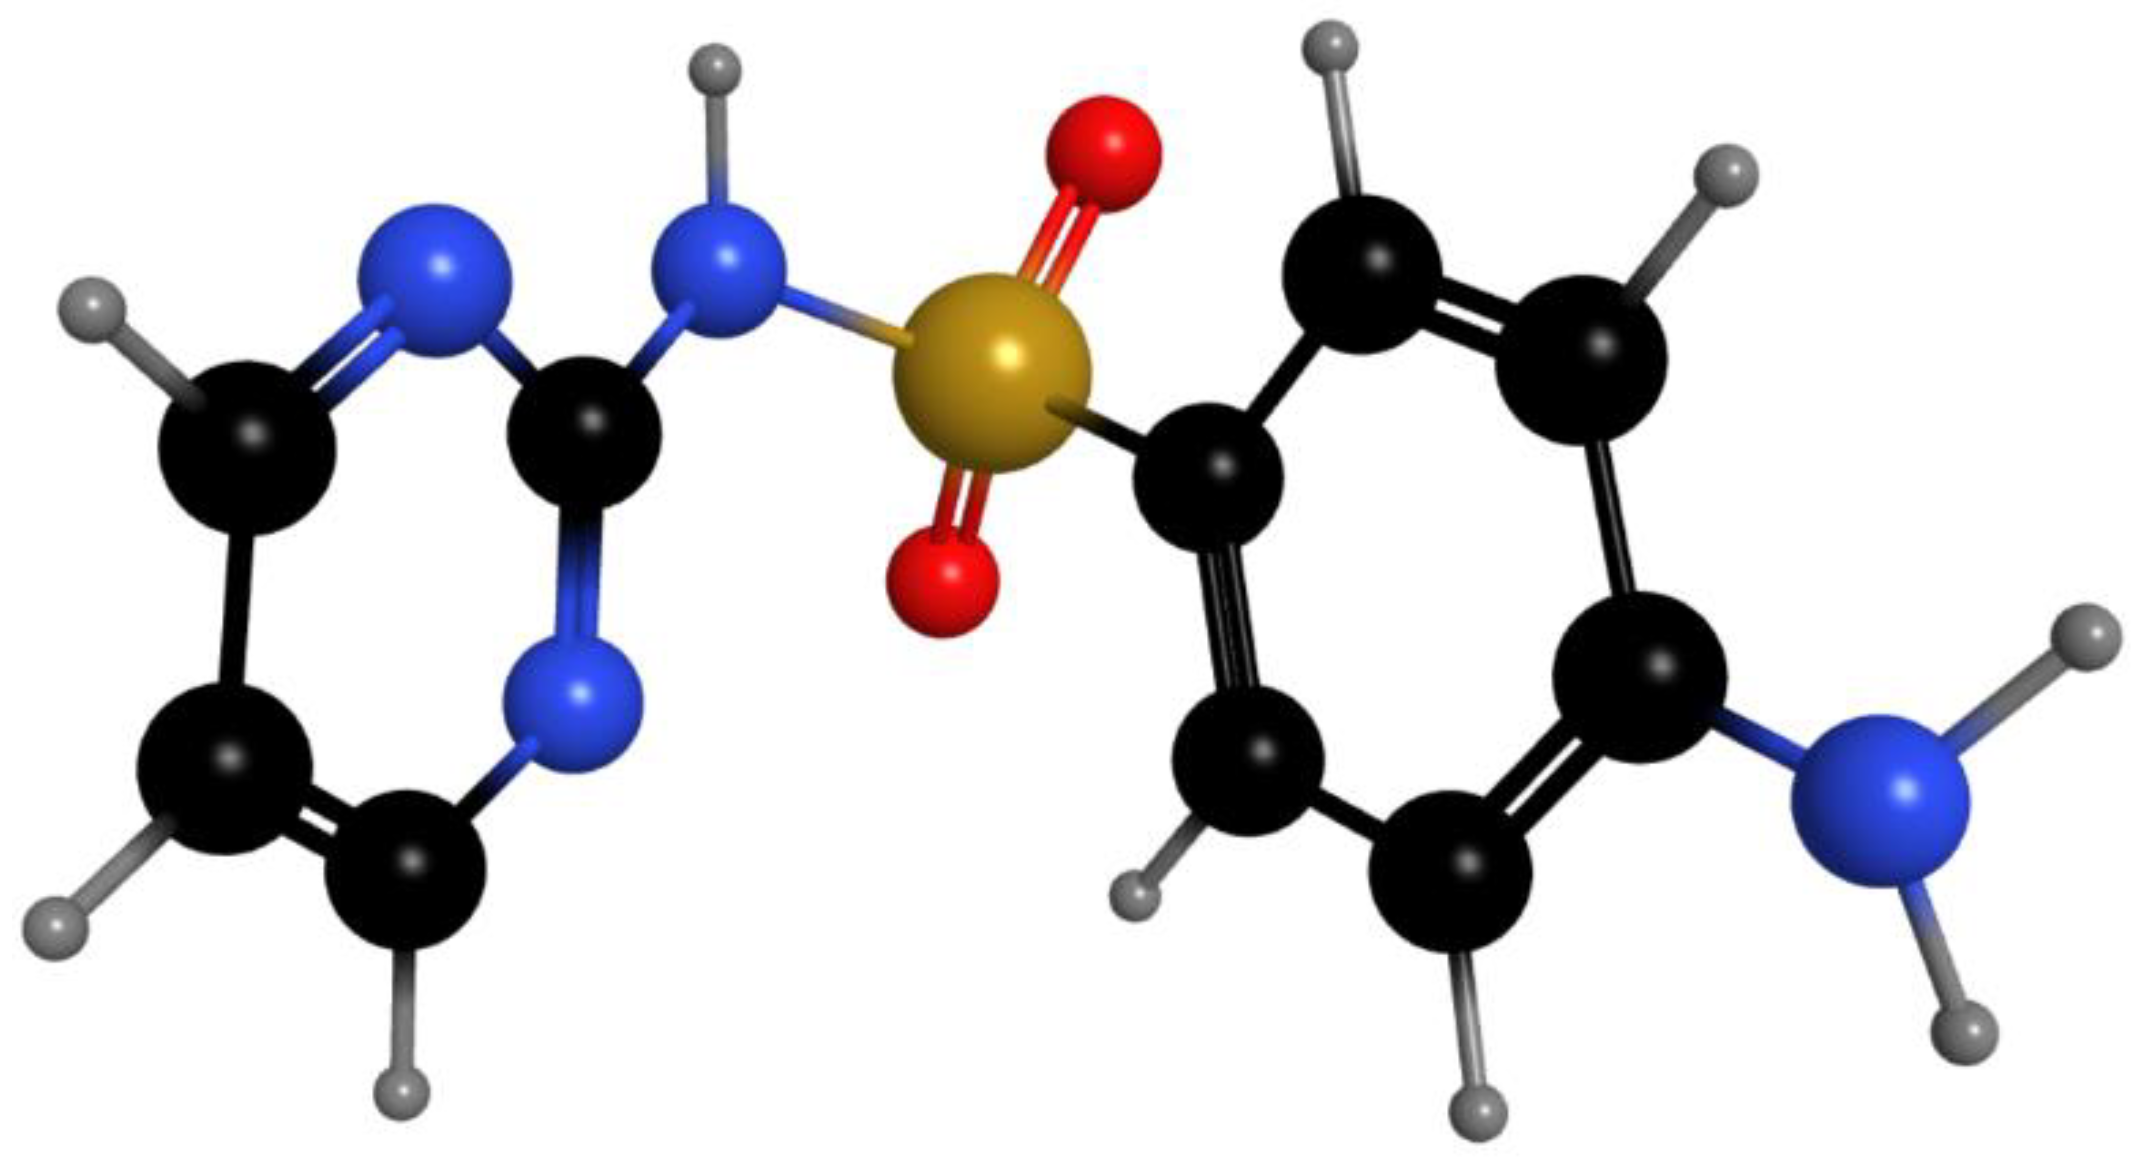
However, after antibiotics enter the human body or animals, only 20–30% can be absorbed. The remaining antibiotics are eliminated from the body in the form of parent or intermediate into surface water bodies or sewage treatment plants, which increases the evolutionary selection pressure of the microbial community in the environment [8,9,10,11]. Furthermore, antibiotics are toxic to microorganisms and can inhibit the biochemical system of conventional sewage treatment. Therefore, general domestic sewage treatment plants cannot effectively remove and degrade antibiotics in water, resulting in the discharge of some untreated antibiotics into natural water bodies, which makes them have a high detection frequency in the water environment, and the detection mass concentration ranges from ng/L to mg/L [12,13,14,15,16,17,18,19,20]. As a typical sulfonamide antibiotic, sulfadiazine, with the structure diagram shown in Figure 1, has vigorous antibacterial activity and is widely used in animal husbandry, so it is frequently detected in natural water [21,22,23,24].
AOPs have been applied in the treatment of landfill leachate, industrial wastewater, and medical wastewater, and can effectively reduce the pollution of chemical oxygen demand (COD), biochemical oxygen demand (BOD), and ammonia nitrogen (NH4+-N) in water. In addition, they can improve the biodegradability of wastewater [25,26,27]. Existing research results on AOPs show that the ozone-advanced oxidation process can remove antibiotics from water [28,29]. However, the separate ozone oxidation process has disadvantages: low ozone utilization rate, expensive treatment cost, incomplete degradation of antibiotics, selectivity of ozone oxidation, and poor oxidation effect on some organic substances [30,31]. The ozone combination can solve the above problems, improve ozone utilization, and produce more non-selective hydroxyl radicals (·OH) [32,33,34]. At present, AOPs based on the sulfate radical (SO4−·) are widely concerned because SO4−· has high oxidation redox potential (ORP) (Eθ = 2.5–3.1V), a longer half-life (30–40 μs), and a broad pH application range [35,36,37]. In O3/PMS’s oxidation process, O3 acts as a strong oxidant to activate PMS to produce ·OH and SO4−·. The reaction process is shown in Equations (1)–(7) [38].
We compared the degradation effect and oxidizing ability of SDZ by the three most practical ozone-based advanced oxidation technologies, namely, O3/PMS, O3, and O3/UV, and the most suitable process for degrading SDZ in the water among the three methods was selected. The effects of single factors such as the dosage of O3 and PMS, the initial concentration of SDZ, and the initial pH on the removal effect and the research on the mineralization effect were investigated, and the optimal reaction conditions of O3/PMS were determined. At the same time, a synchronous comparative analysis of O3/PMS was carried out with the O3 and O3/UV processes to provide data support for practical engineering applications. Based on the single factor influence experiment, the degradation and mineralization process dynamics of SDZ were analyzed to help the subsequent modeling and prediction of the degradation effect of O3/PMS degradation SDZ.
2. Experimental Materials and Methods
2.1. Experimental Device
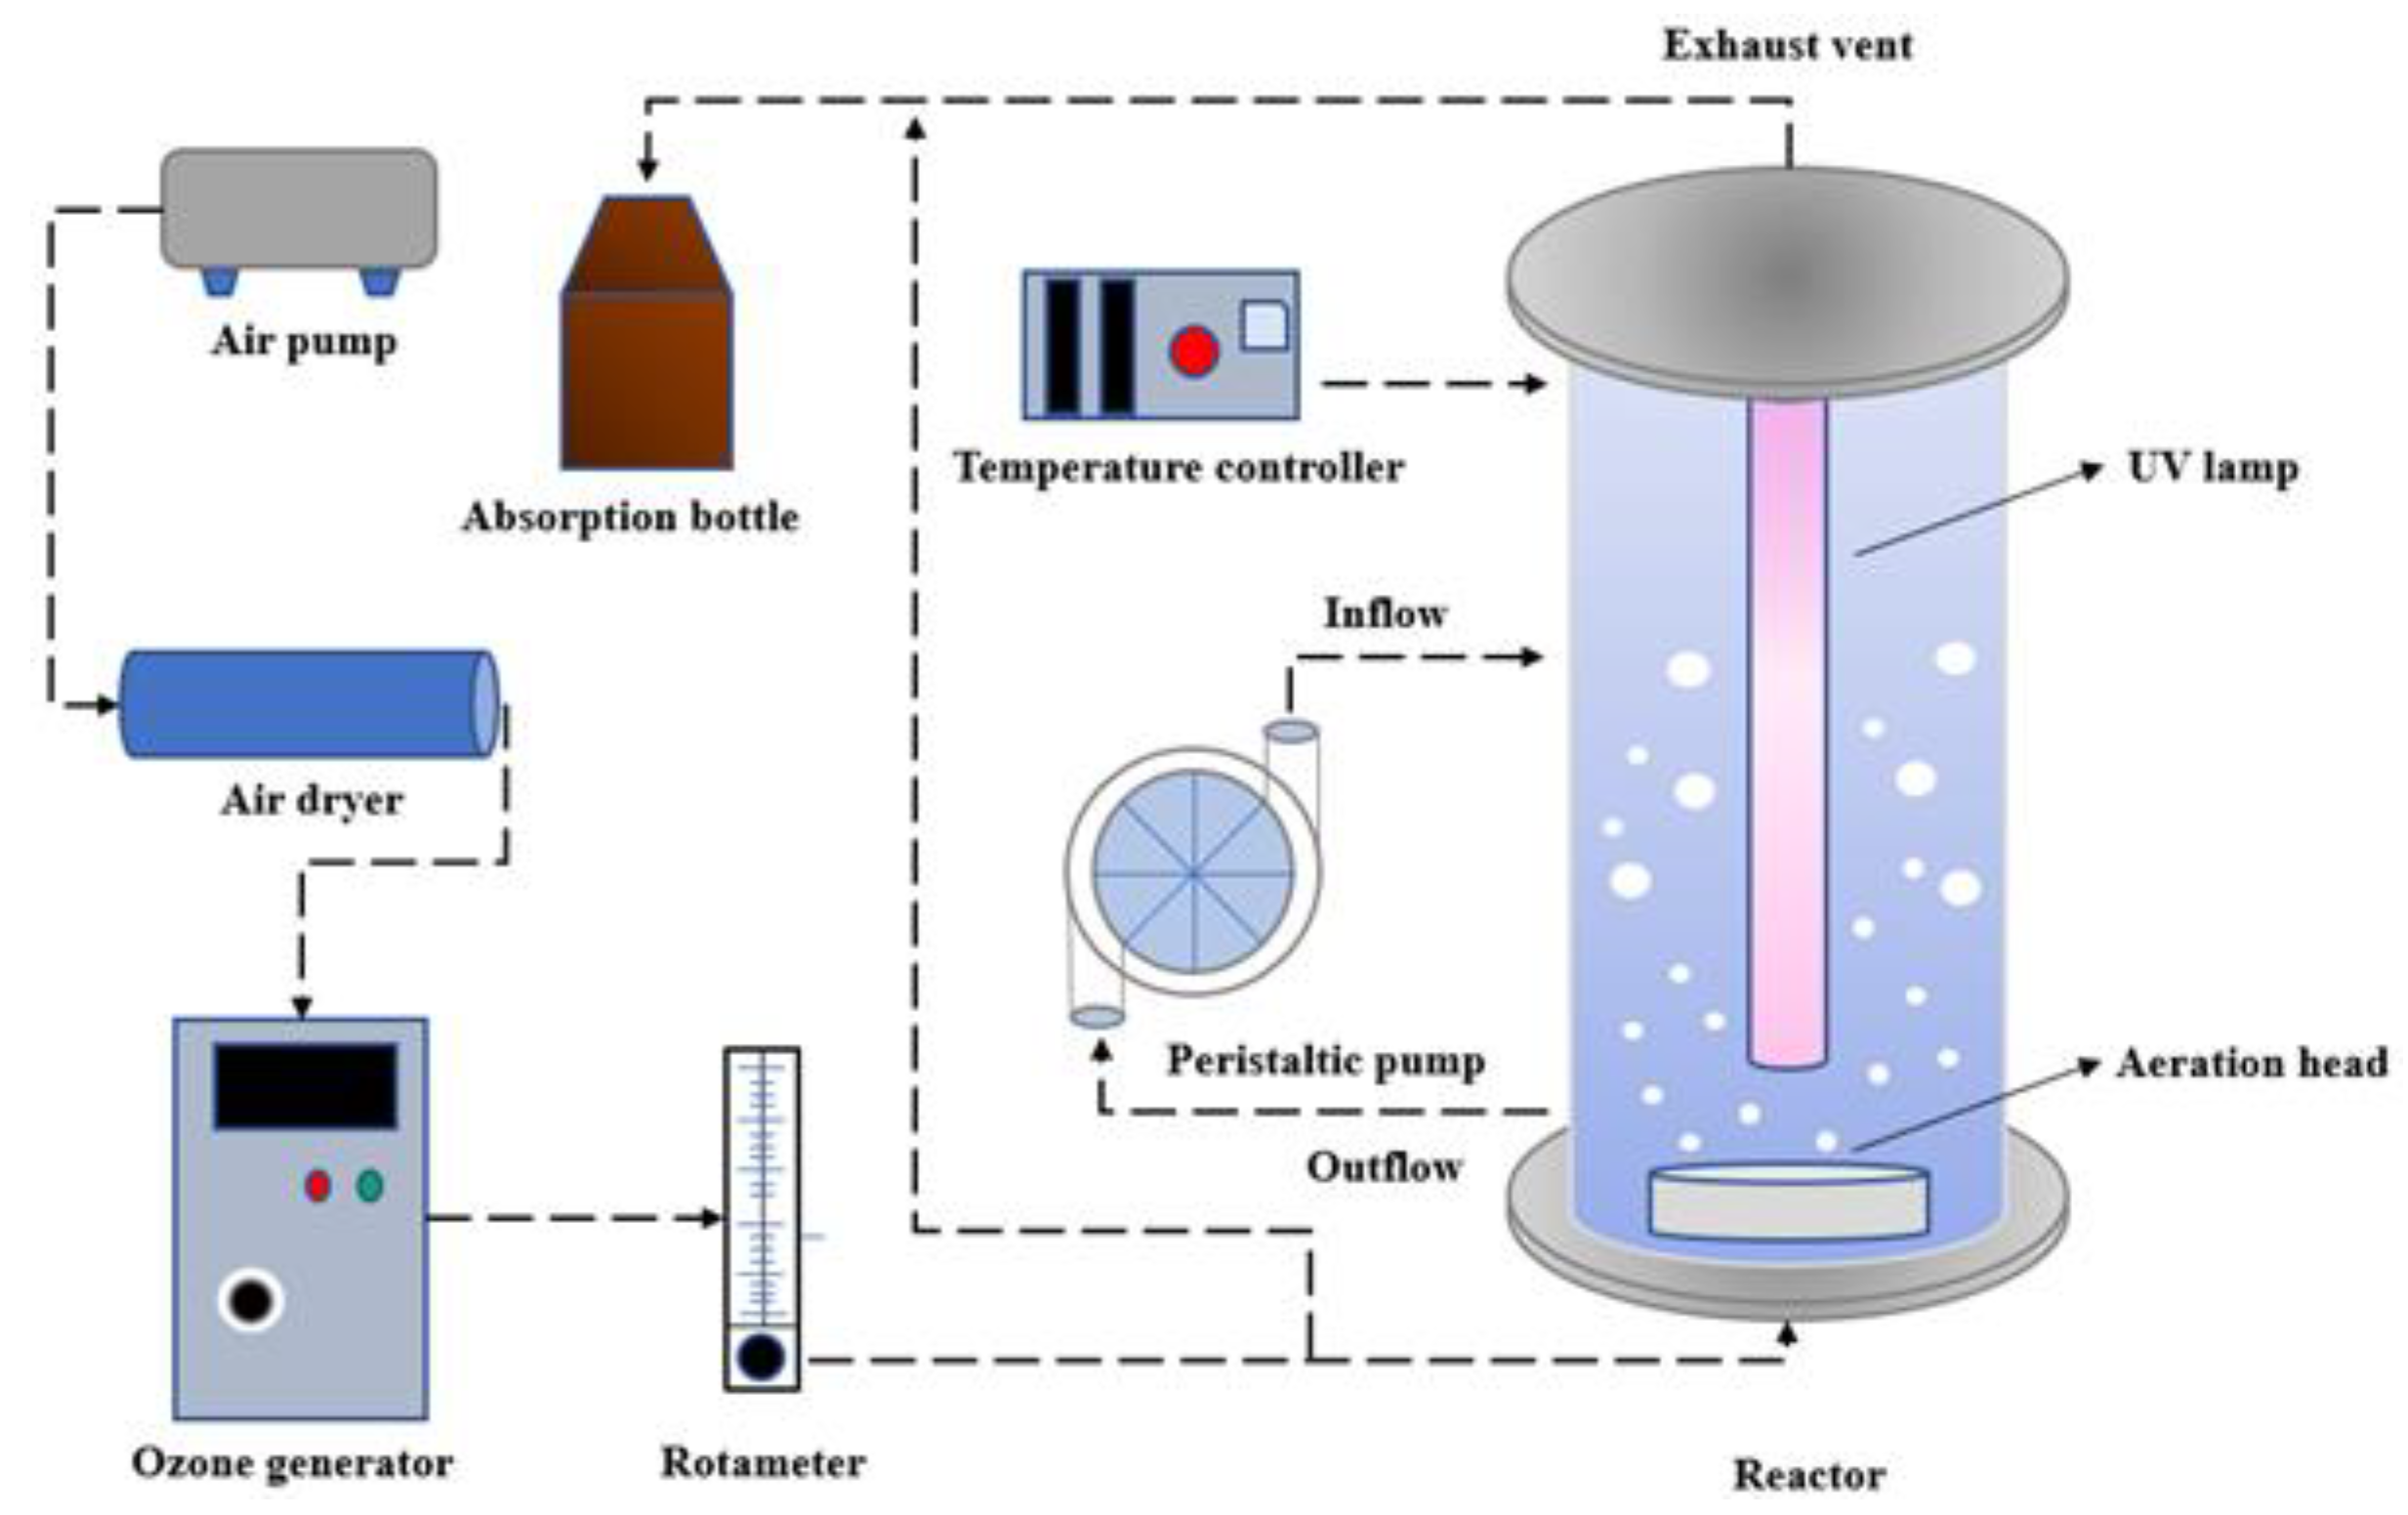
The experimental device was divided into three parts, as shown in Figure 2: (1) the ozone-generating part, which consisted of an air pump, air dryer, and ozone generator; (2) the reactor part, composed of a plexiglass column reaction vessel (diameter: 15 cm, height: 50 cm), aeration head, and peristaltic pump; and (3) the tail gas absorption part, which consisted of a tail gas absorption bottle containing potassium iodide solution.
The reaction was carried out in the reactor. The gas flow was 1 L/min and the volume of the reaction solution was 5 L. The initial pH of the solution was 6.8 ± 0.1 and was adjusted by 9.8 g/L sulfuric acid solution and 4 g/L sodium hydroxide. The temperature control device controlled the temperature at 25 ± 0.5 °C. The ozone generator was connected to the tail gas collection device, which was operated for 10 min in advance to stabilize it; then, the liquid to be reacted was added, and the peristaltic pump started to circulate the water in the reactor. At the time of ozone introduction, 5 mL samples were taken every 2 min for 0–20 min, and sodium thiosulfate (Na2S2O3) solution with a concentration of 158 g/L was added immediately to quench the residual ozone in the water, and the reaction was stopped. The concentration of SDZ in the solution was detected by high-performance liquid chromatography (HPLC).
2.2. Experimental Materials
The SDZ was purchased from Beijing Bailingwei Technology Co., Ltd. (Beijing, China). Potassium peroxymonosulfate, formic acid, and acetonitrile were purchased from Shanghai McLean Biochemical Technology Co., Ltd. (Shanghai, China). Sodium thiosulfate, anhydrous sodium sulfate, sodium nitrate, sodium chloride, sodium bicarbonate, tert-butanol, anhydrous ethanol, and potassium iodide were purchased from the Tianjin Jindong Tianzheng fine chemical reagent factory (Tianjin, China). Among them, formic acid and acetonitrile were chromatographically pure and the rest were analytically pure. The concentration of SDZ was ≥99%. The water intake location of the natural water body is Yangjiaweizi Watershed, Erdao District, Yitong River, Changchun City, Jilin Province. See Table 1 for specific parameters of water quality. After filtering with qualitative filter paper, the river water was spiked with 10 mg/L SDZ solution for the experiment.
2.3. Analytical Method
With SDZ mother liquor configuration, 50 mg SDZ was placed into a 1 L brown volumetric flask, fixed in ultrapure water, and stirred on a heated magnetic stirrer at 30 °C for 6 h until complete dissolution. The SDZ concentration determination method was HPLC with the Agilent1200 system (Beijing, China) and Waters Symmetry C18 (4.6 × 150 mm, 5 μm column) column (Milford, CT, USA). The column temperature was controlled at 30 ± 1 °C, and the mobile phase ratio was 0.1% formic acid: acetonitrile = 83:17 (v/v). The flow rate was 1 mL/min, and the detection wavelength was 270 nm. The ozone concentration was measured by iodimetry (GB 28232–2020). Total organic carbon (TOC) was analyzed by a TOC analyzer (Vario TOC select, elemental) (Hanau, Germany). The fluorescent substances were analyzed by an absorption three-dimensional fluorescence spectrometer (aqualog-800-c, Horiba Scientific) (Kyoto, Japan). The water quality indexes in natural water bodies were determined according to the environmental protection industry standards of the People’s Republic of China. Thus, rapid digestion spectrophotometry (HJ/T 399–2007) was adopted to test COD, and TN was determined using an alkaline potassium persulfate digestion ultraviolet spectrophotometry (HJ 636–2012). Nessler reagent spectrophotometry (HJ 535–2009) was used to test NH4+-N, and TP was determined using an ammonium molybdate spectrophotometry (GB/T 11893–1989). All experiments were repeated three times, the average value was taken, and the data were analyzed by Origin 2021 from OriginLab, (Northampton, MA, USA).
3. Results and Discussion
3.1. Comparison of SDZ Degradation Efficiency between O3/PMS and O3 and O3/UV
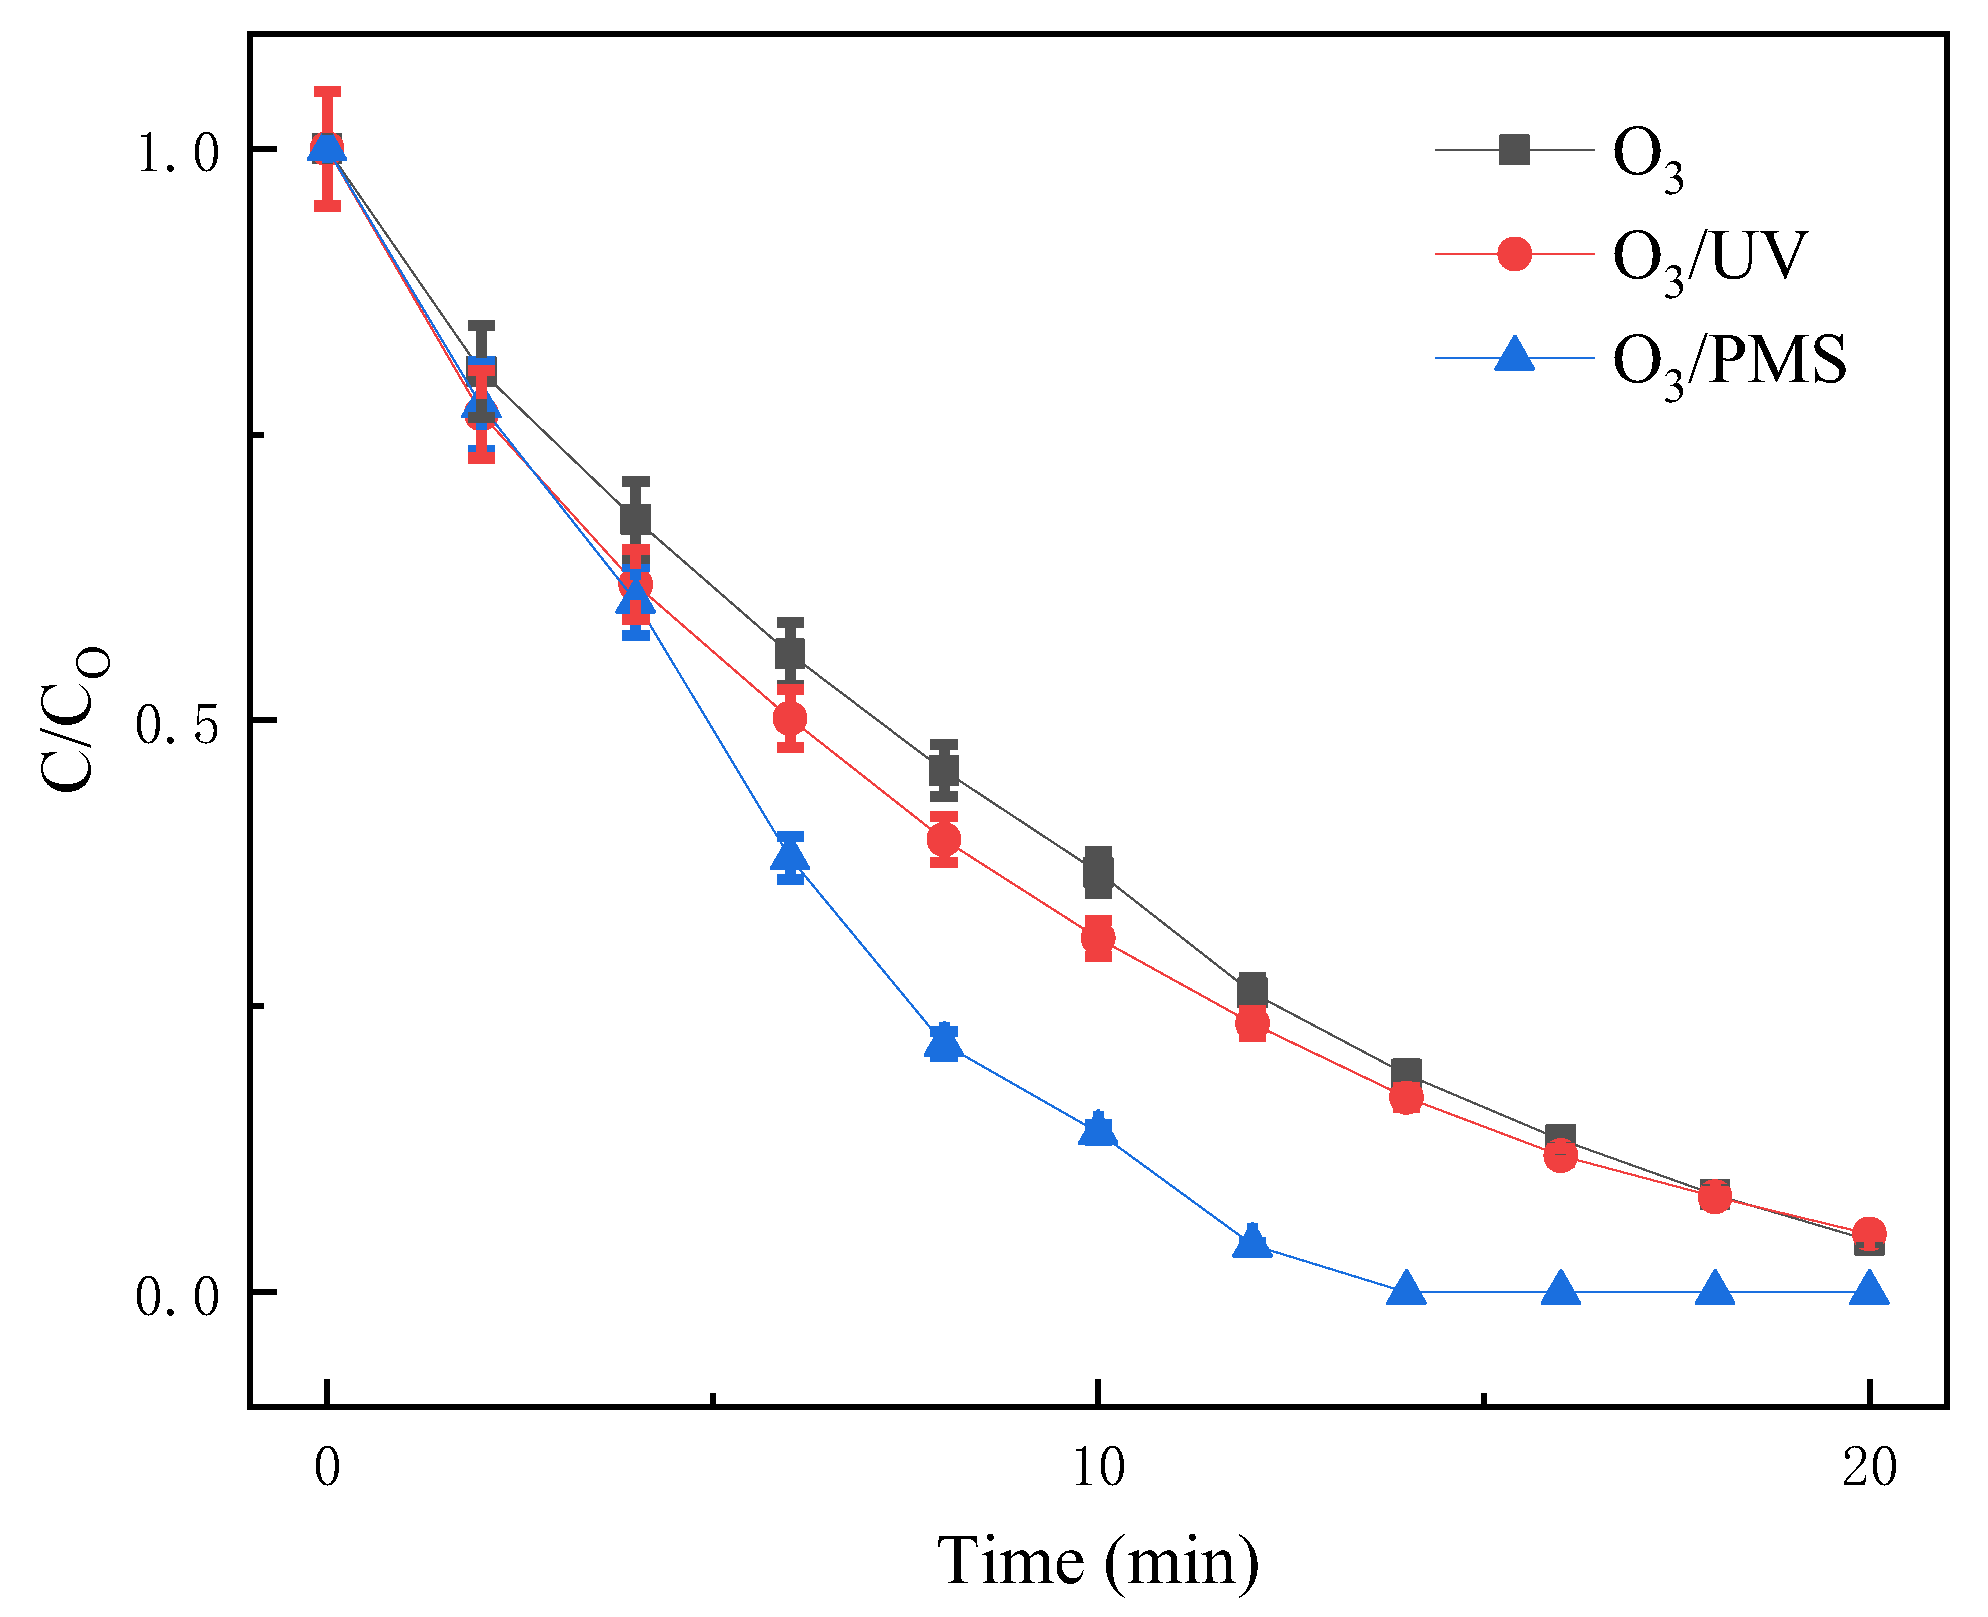
When the initial mass concentration of SDZ was 10 mg/L, the mass concentration of O3 was 3 mg/L, the temperature was 25 ± 0.5 °C, and the initial pH of the solution was 6.8 ± 0.1. The degradation efficiency of SDZ by the O3/PMS (PMS concentration was 22.8 mg/L) advanced oxidation method was investigated and compared with that of O3 and O3/UV (the UV wavelength is 254 nm because O3 has good absorption performance [39]). Figure 3 shows the results. At the same time, the degradation efficiency of O3, O3/UV, and O3/PMS on SDZ was analyzed and compared using the pseudo-first-order kinetic model. The results are shown in Table 2. Kobs is a pseudo-first-order kinetic reaction rate constant, which is used to reflect the attenuation of SDZ in water samples. The larger the Kobs, the faster the degradation rate of SDZ [40].
It can be seen from Figure 3 and Table 2 that there was little difference between the degradation effect of O3 alone and O3/UV on SDZ, both of which reached a degradation rate of more than 94% within 20 min, and the reaction rate was not different. However, in the middle stage of the O3/UV reaction, the reaction rate was faster than that of O3 alone. This was because in the O3/UV system, UV radiation accelerated ozone decomposition and produced ·OH with a more robust oxidation capacity to accelerate the degradation of SDZ, which was the same as the research results of Zizeng Yang [41]. For O3/PMS, the experimental data showed that O3/PMS reached a 95.9% SDZ degradation rate at 12 min, and SDZ degraded below the detection limit at 13 min, while the degradation rates of O3 and O3/UV were only 73.8% and 76.5%, respectively, at 12 min. It can be seen from the experimental results that the oxidation ability of the O3/PMS system was much stronger than that of O3 alone and O3/UV. This was because O3, as a strong oxidant, activated PMS to produce ·OH and SO4−· so that the two free radicals with strong oxidation in the reaction system acted simultaneously and enhanced the degradation effect of SDZ.
In addition, when detecting the ozone concentration in the solution, it was found that the ozone concentration of O3 alone remained unchanged, while the ozone concentration in O3/PMS and O3/UV was at a low level, which indicated that PMS and UV promoted the decomposition of ozone. Therefore, in the process of degradation of SDZ by O3/PMS, O3 and PMS were not the superposition of different treatment effects but had the ability of synergy. In conclusion, O3/PMS was significantly better than the other two methods in the treatment effect.
3.2. O3/PMS Single Factor Influence Experiment
3.2.1. Effect of Initial Mass Concentration of SDZ on Degradation Efficiency
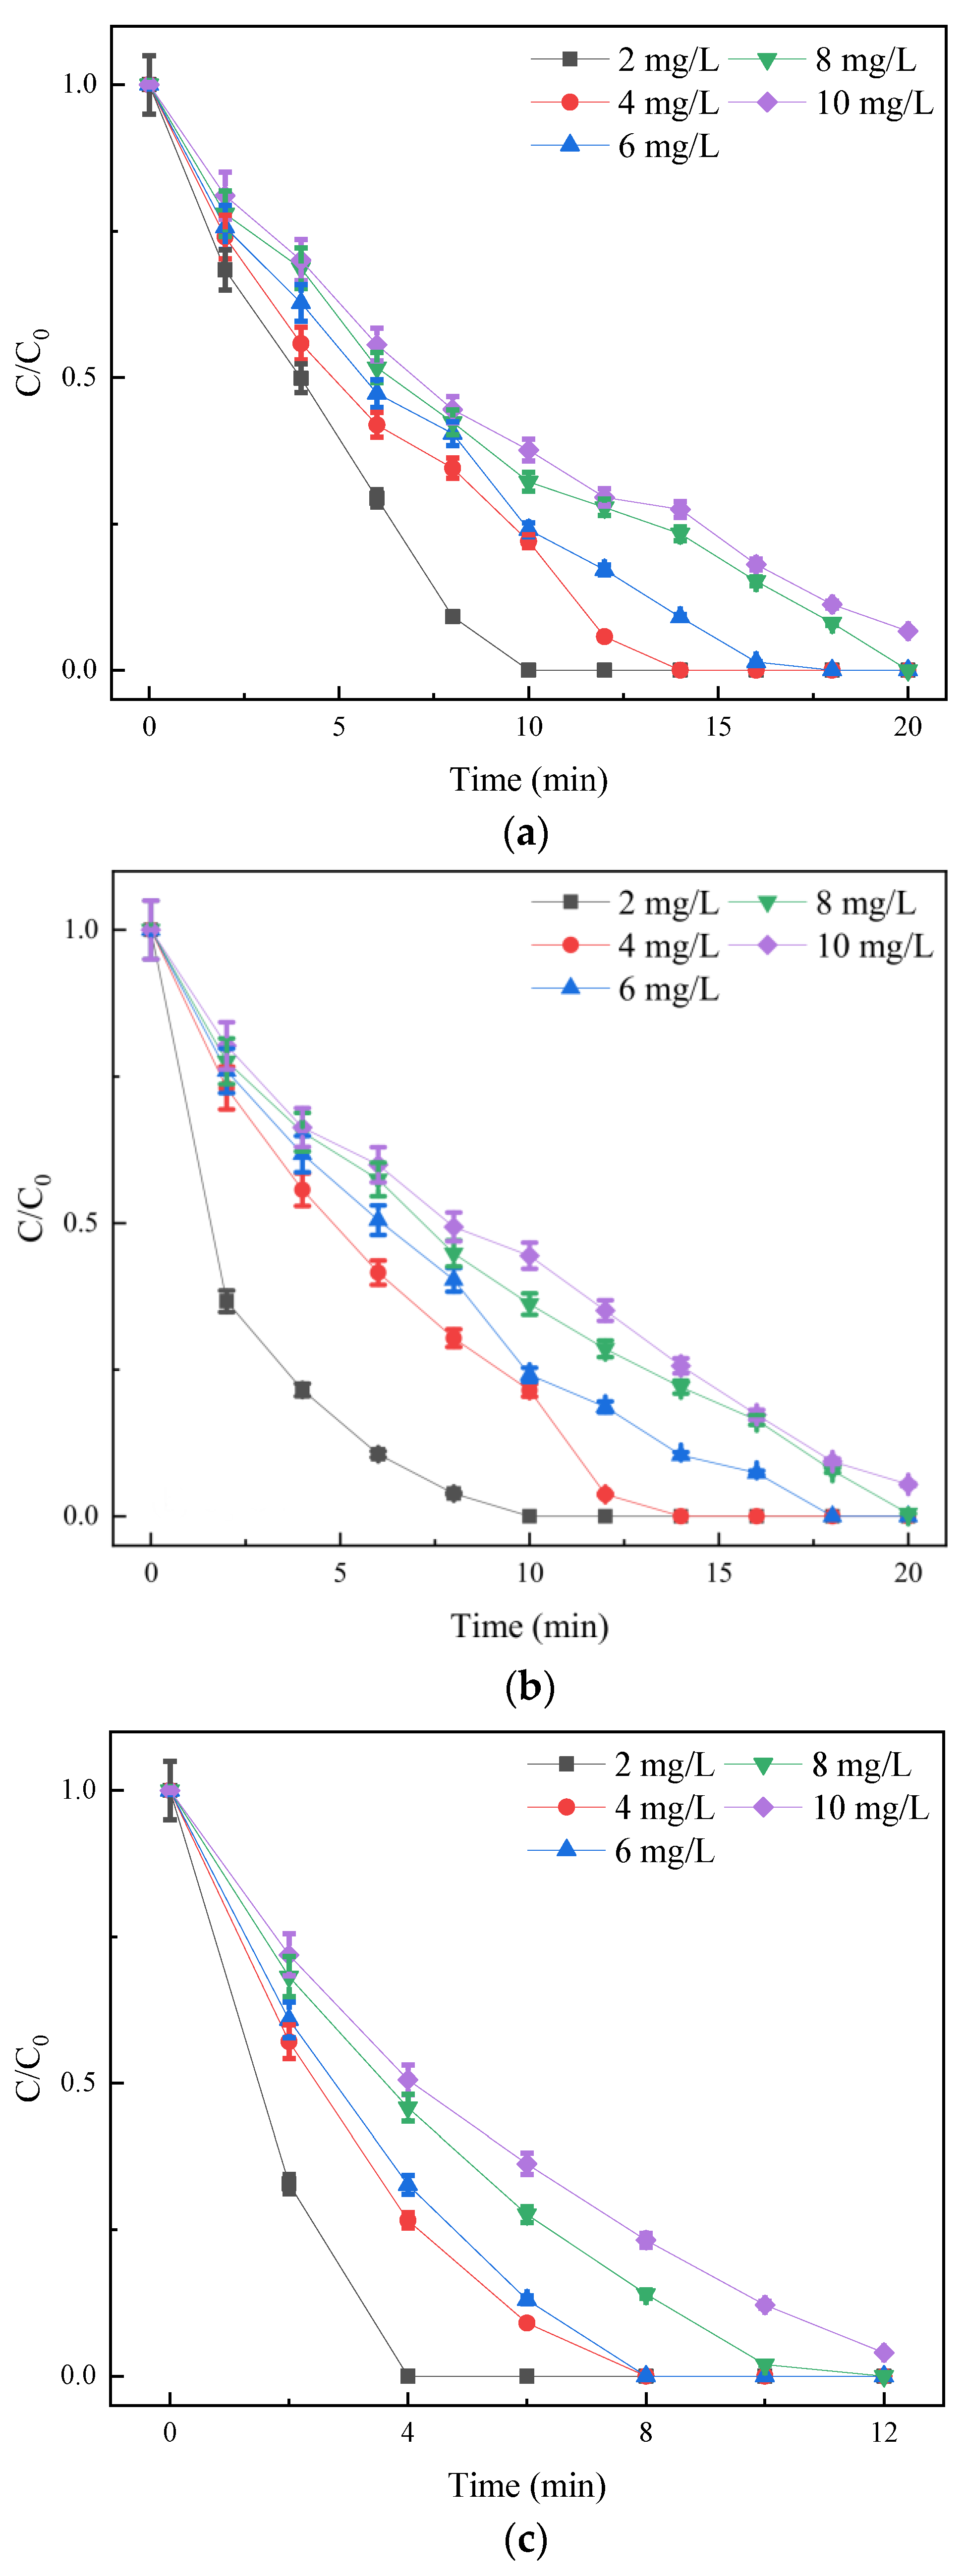
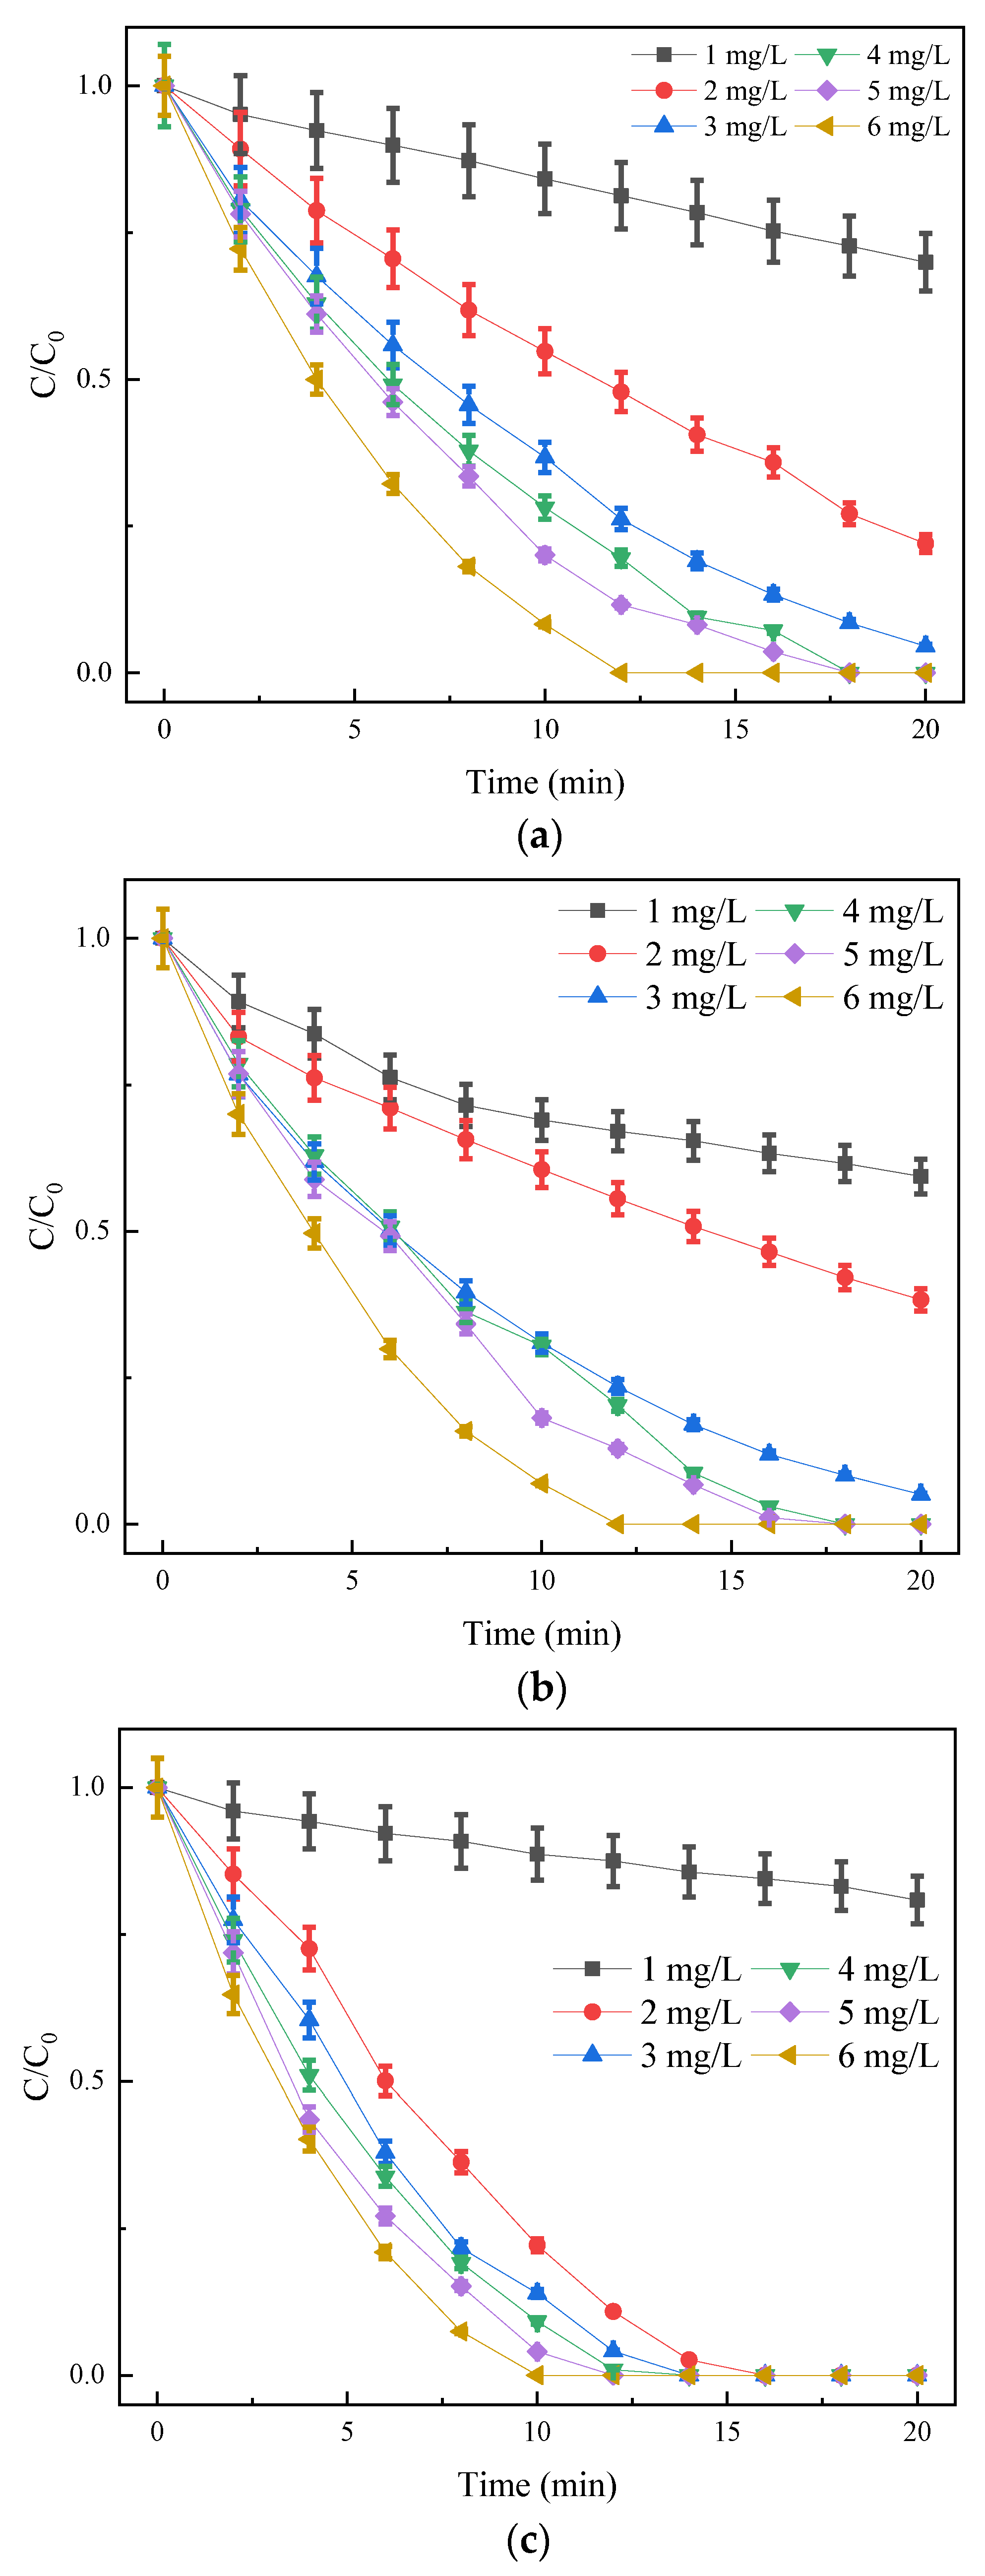
The initial mass concentration of O3 in this experiment was 3 mg/L, the concentration of PMS was 22.8 mg/L, and the initial pH of the solution was 6.8 ± 0.1. The initial mass concentration of SDZ was set with five concentration gradients of 2, 4, 6, 8, and 10 mg/L. The experimental results are shown in Figure 4, and the pseudo-first-order rate constants are shown in Table 3.
It can be seen from Figure 4 and Table 3 that the increase in the initial mass concentration of SDZ inhibited the degradation efficiency of SDZ by the three treatment methods. The data in Table 3 show that the degradation of SDZ by the three treatment methods met the pseudo-first-order reaction kinetics, and the reaction rate constant (Kobs) of SDZ gradually decreased with the increase in the initial mass concentration of SDZ. In the O3 reaction system, the degradation of SDZ was mainly divided into direct ozone oxidation and ·OH indirect oxidation. The ozone oxidation ability was slightly weak, mainly ·OH oxidation. O3/UV included two kinds of oxidation in O3, and the UV photolysis effect produced by UV was feeble [42], so the ·OH oxidation effect still dominated it. In O3/PMS, oxidation was caused mainly by ·OH and SO4− produced in the system. The increase in the initial mass concentration of SDZ led to the increase in intermediate products in the process of oxidative degradation of SDZ. These intermediates were oxidized and finally converted into CO2 and H2O. They competed with SDZ for oxidants, decreasing the concentration of oxidants acting on SDZ, thereby reducing the degradation rate of SDZ. Comparing the three methods, the Kobs of O3/PMS was higher than that of O3 and O3/UV, indicating that the reaction rate of SDZ degradation by O3/PMS was significantly higher than that of the other two treatment methods.
3.2.2. Effect of Oxidant Dosage on Degradation Efficiency
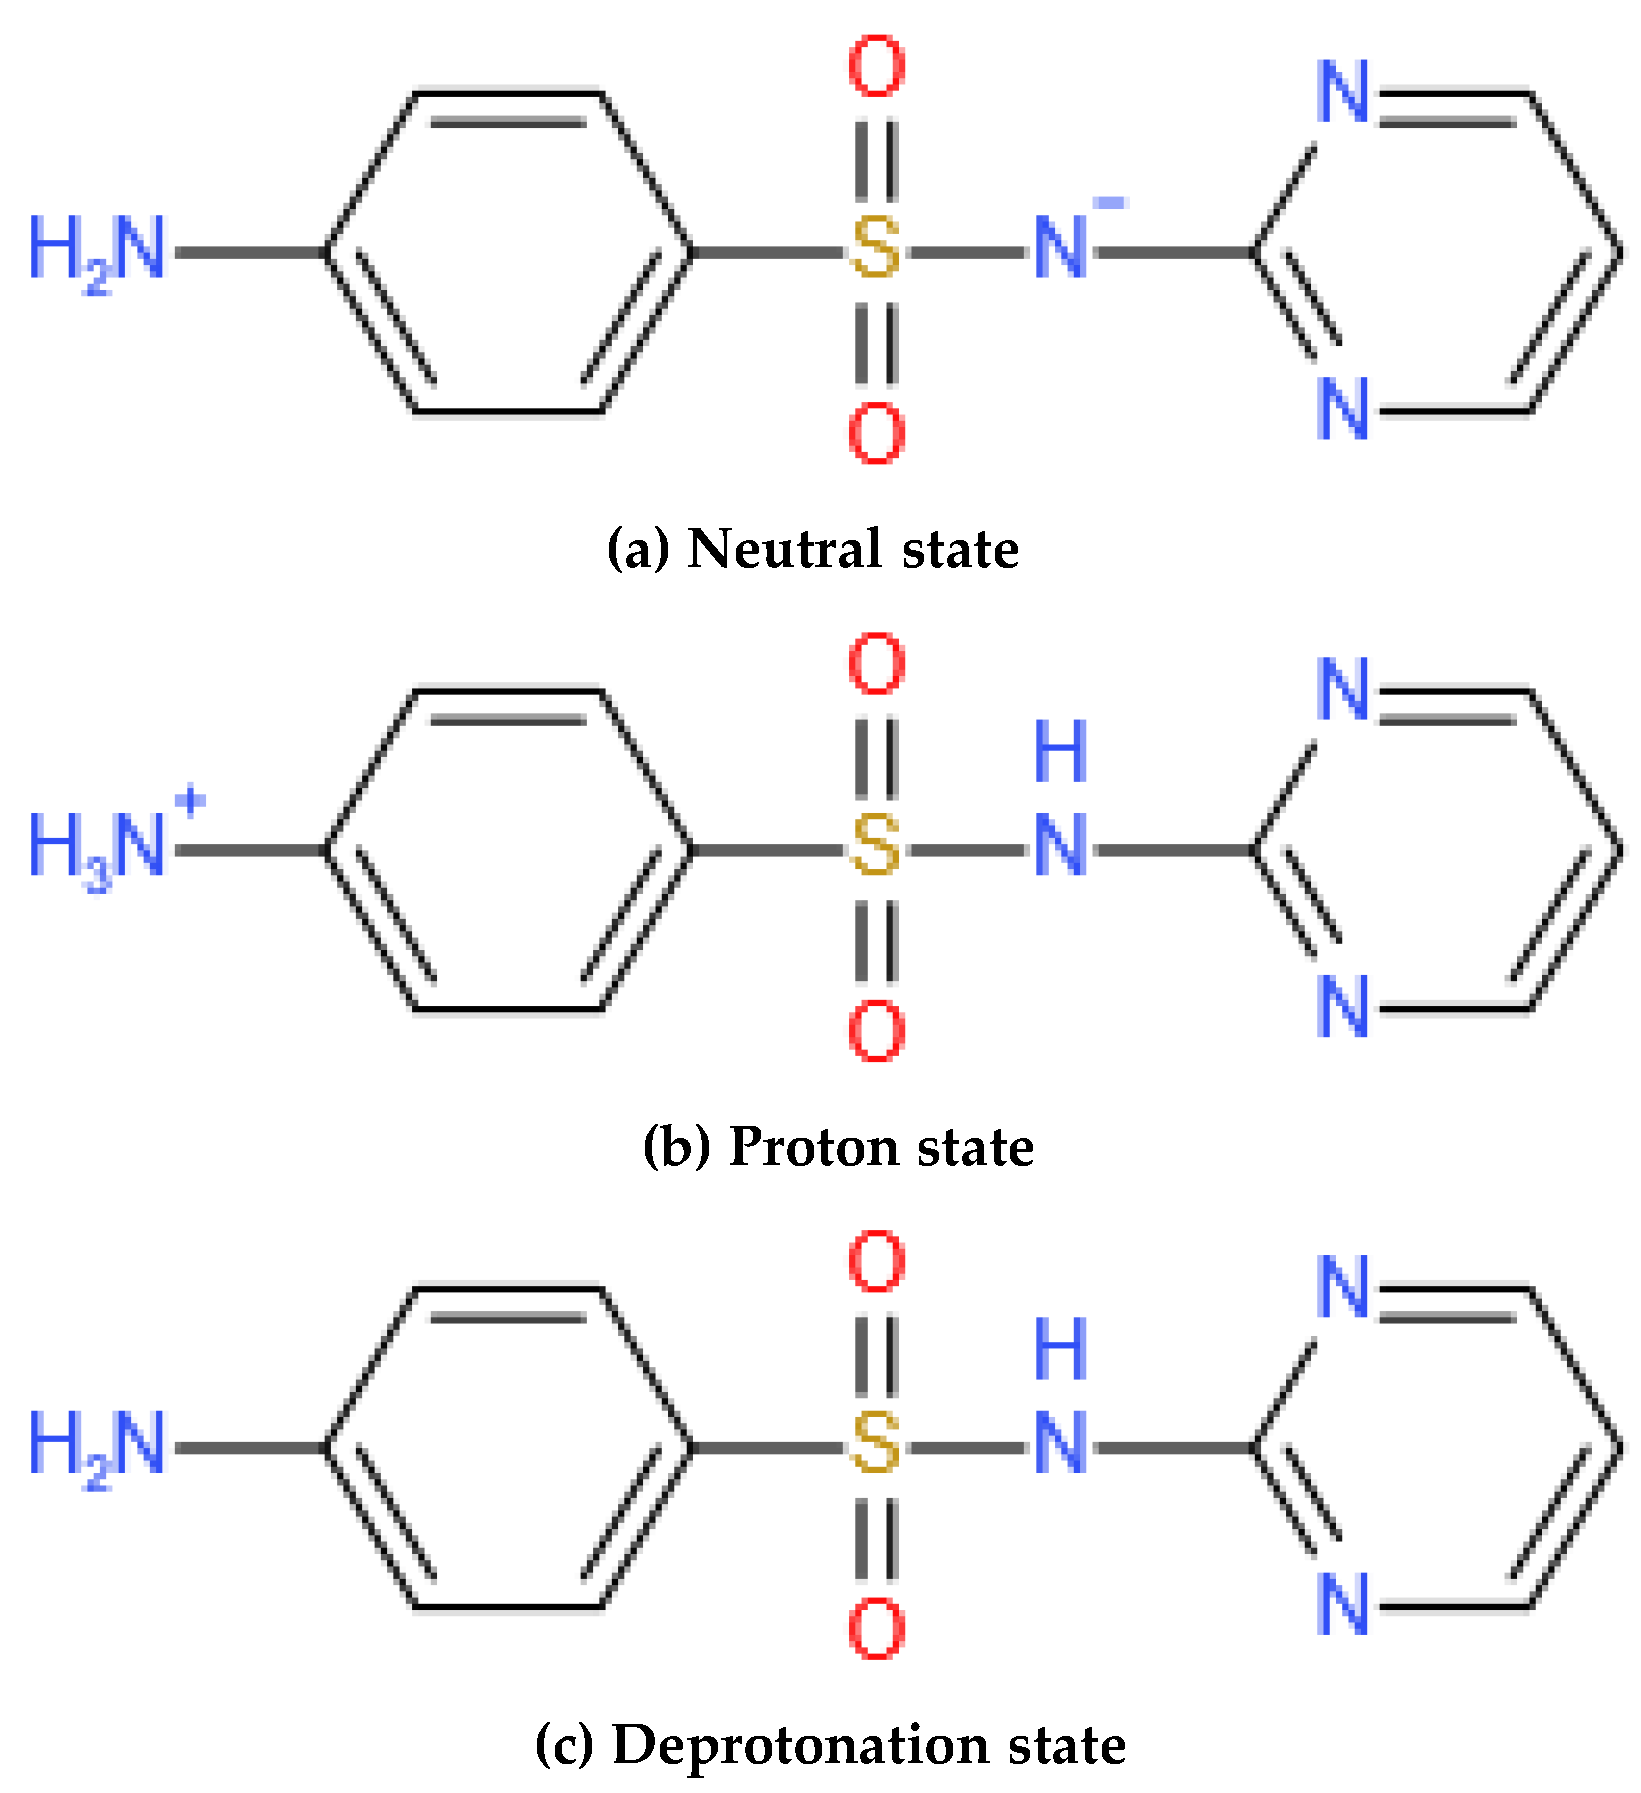
The oxidants in the test included O3 and PMS. To investigate the effect of the dosage of two oxidants on the degradation effect of SDZ, the initial mass concentration of SDZ was set as 10 mg/L, and the initial pH of the solution was 6.8 ± 0.1. When investigating the influence of O3 dosage, the mass concentrations were set as 1, 2, 3, 4, 5, and 6 mg/L. Moreover, the PMS concentration was maintained at 22.8 mg/L. When investigating the influence of PMS dosage, its concentration was set to 5.7, 11.4, 17.1, 22.8, 28.5, and 34.2 mg/L, and the ozone mass concentration was maintained at 3 mg/L. The test results are shown in Figure 5, and the pseudo-first-order rate constants are shown in Table 4 and Table 5.
As shown in Figure 5, the degradation efficiency of SDZ increased with the increase in ozone concentration. When the ozone concentration was 1 mg/L, O3, O3/UV, and O3/PMS degradation rates in 20 min were 30%, 40.6%, and 19.1%, respectively. When the ozone concentration increased to 6 mg/L, O3 and O3/UV degraded SDZ below the detection limit in 12 min, while it took only 10 min to degrade SDZ below the detection limit in the O3/PMS system. The 20 min degradation efficiency of O3/PMS was lower than that of O3 and O3/UV (when the O3 concentration was 1 mg/L) because the ozone concentration was too low. In O3/PMS, firstly, enough ozone was needed to oxidize and activate PMS. When the initial O3 concentration was low, this process consumed O3, so there was not enough O3 to participate in the subsequent degradation process of SDZ. With the increase in ozone dosage, the degradation efficiency of the three processes was significantly improved because the more significant the ozone dosage, the stronger the promotion of free radicals. From the comparison of Kobs values corresponding to O3 dosage from 2 mg/L to 6 mg/L in the three processes, it can be seen that the reaction rate of O3/PMS increased with the increase in ozone dosage, and the reaction rate of each dosage was greater than that of O3 and O3/UV under the same conditions.
For the dosage of PMS, when the dosage increased from 5.7 to 22.8 mg/L, the 12 min degradation rate of SDZ increased from 84.6% to 91.3%, which indicated that the reaction rate remained almost unchanged as the dosage continued to increase, and the degradation rate was not much improved. This phenomenon may be that excessive HSO5− reacted with ·OH and SO4−· to produce fewer oxidizing species (Equations (8) and (9)) [43,44]. Another reason was that ·OH and SO4−· quench each other, decreasing the SDZ degradation rate (Equations (10)–(12)) [45,46,47]. Therefore, the larger the ozone dosage, the higher the degradation rate of SDZ, and there was an optimal dosage of PMS. Excessive PMS reacted with free radicals and caused mutual quenching between free radicals, but could not further effectively promote the degradation of pollutants.
3.2.3. Effect of Initial pH on Degradation Efficiency
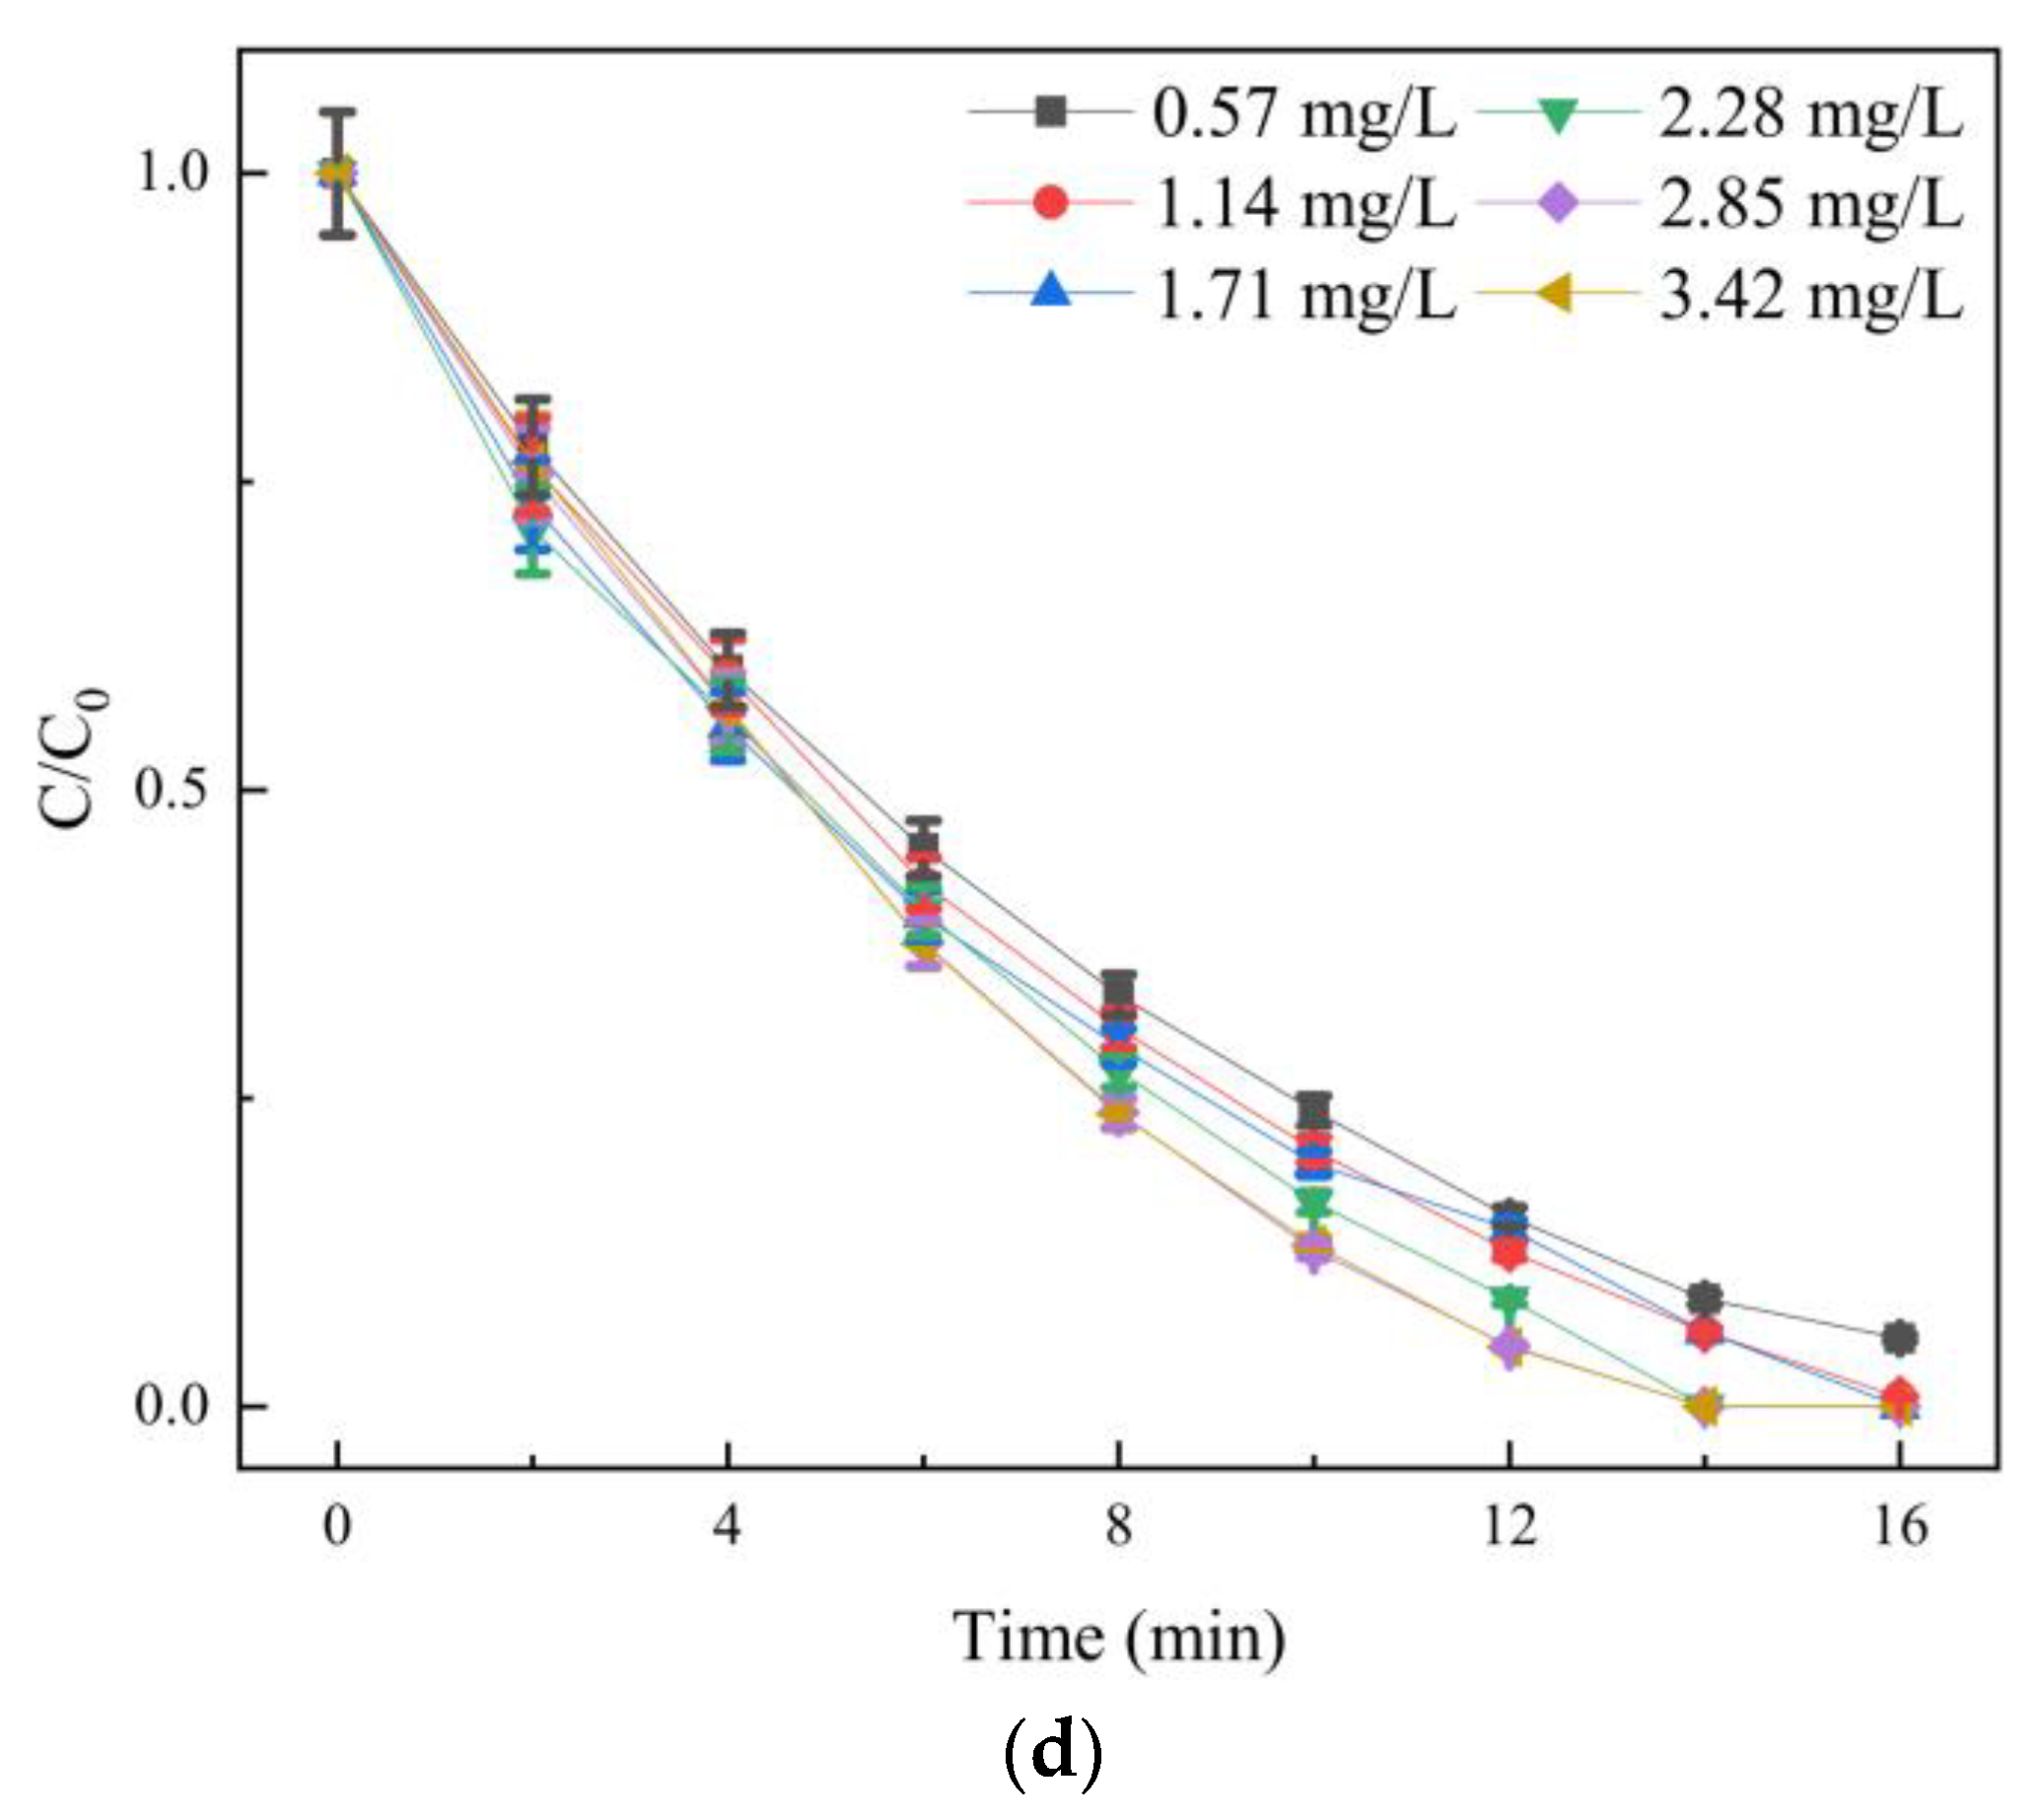
To investigate the effect of initial pH on the degradation efficiency of SDZ, the initial mass concentration of O3 was 3 mg/L, the initial concentration of PMS was 22.8 mg/L, and the initial mass concentration of SDZ was 10 mg/L. In addition, the pH was set to 3, 5, 7, 9, and 11 gradients. The test results are shown in Figure 6, and the pseudo-first-order rate constant is shown in Table 6.
pH is the critical factor affecting the advanced ozone oxidation process. As shown in Figure 6, although the three processes effectively degraded SDZ, whether acidic, neutral, or alkaline, the pH of the solution significantly impacted the degradation rate of SDZ. The degradation rates of O3 and O3/UV increased with the increase in pH. The degradation rates were 76.4% and 78.5%, respectively, at pH 3 and 14 min, and 86.6% and 92.3%, respectively, at pH 11 and 14 min. O3/PMS showed the best degradation effect at pH 9, and the degradation rate reached 92.2% at 10 min. The continuous increase in pH led to the decline in the SDZ degradation effect.
The pH of the reaction system is essential for the ozonation process because the oxidation species involved in the degradation of SDZ were different in different pH environments. In an acidic environment, ozone decomposition was very slow due to the lack of OH−, and ozone molecules in the reaction system continued accumulating, thus directly oxidizing SDZ in molecular form. In an alkaline environment, OH− initiated the decomposition of ozone molecules to generate OH− [48,49], and ozone molecules and ·OH simultaneously participate in the oxidation of SDZ. Although the concentration of ozone molecules decreased, the concentration of ·OH with more vital oxidation ability increased [50,51,52], so it generally showed a better oxidation effect under alkaline conditions. For O3/PMS, it showed the most substantial synergistic effect between O3 and PMS at pH 9. OH− caused ozone decomposition to produce ·OH, which accelerated the decomposition of PMS [44]. When the pH continued to rise, more free radicals were produced in the system, and their mutual quenching was the possible reason for the decline in the SDZ degradation effect.
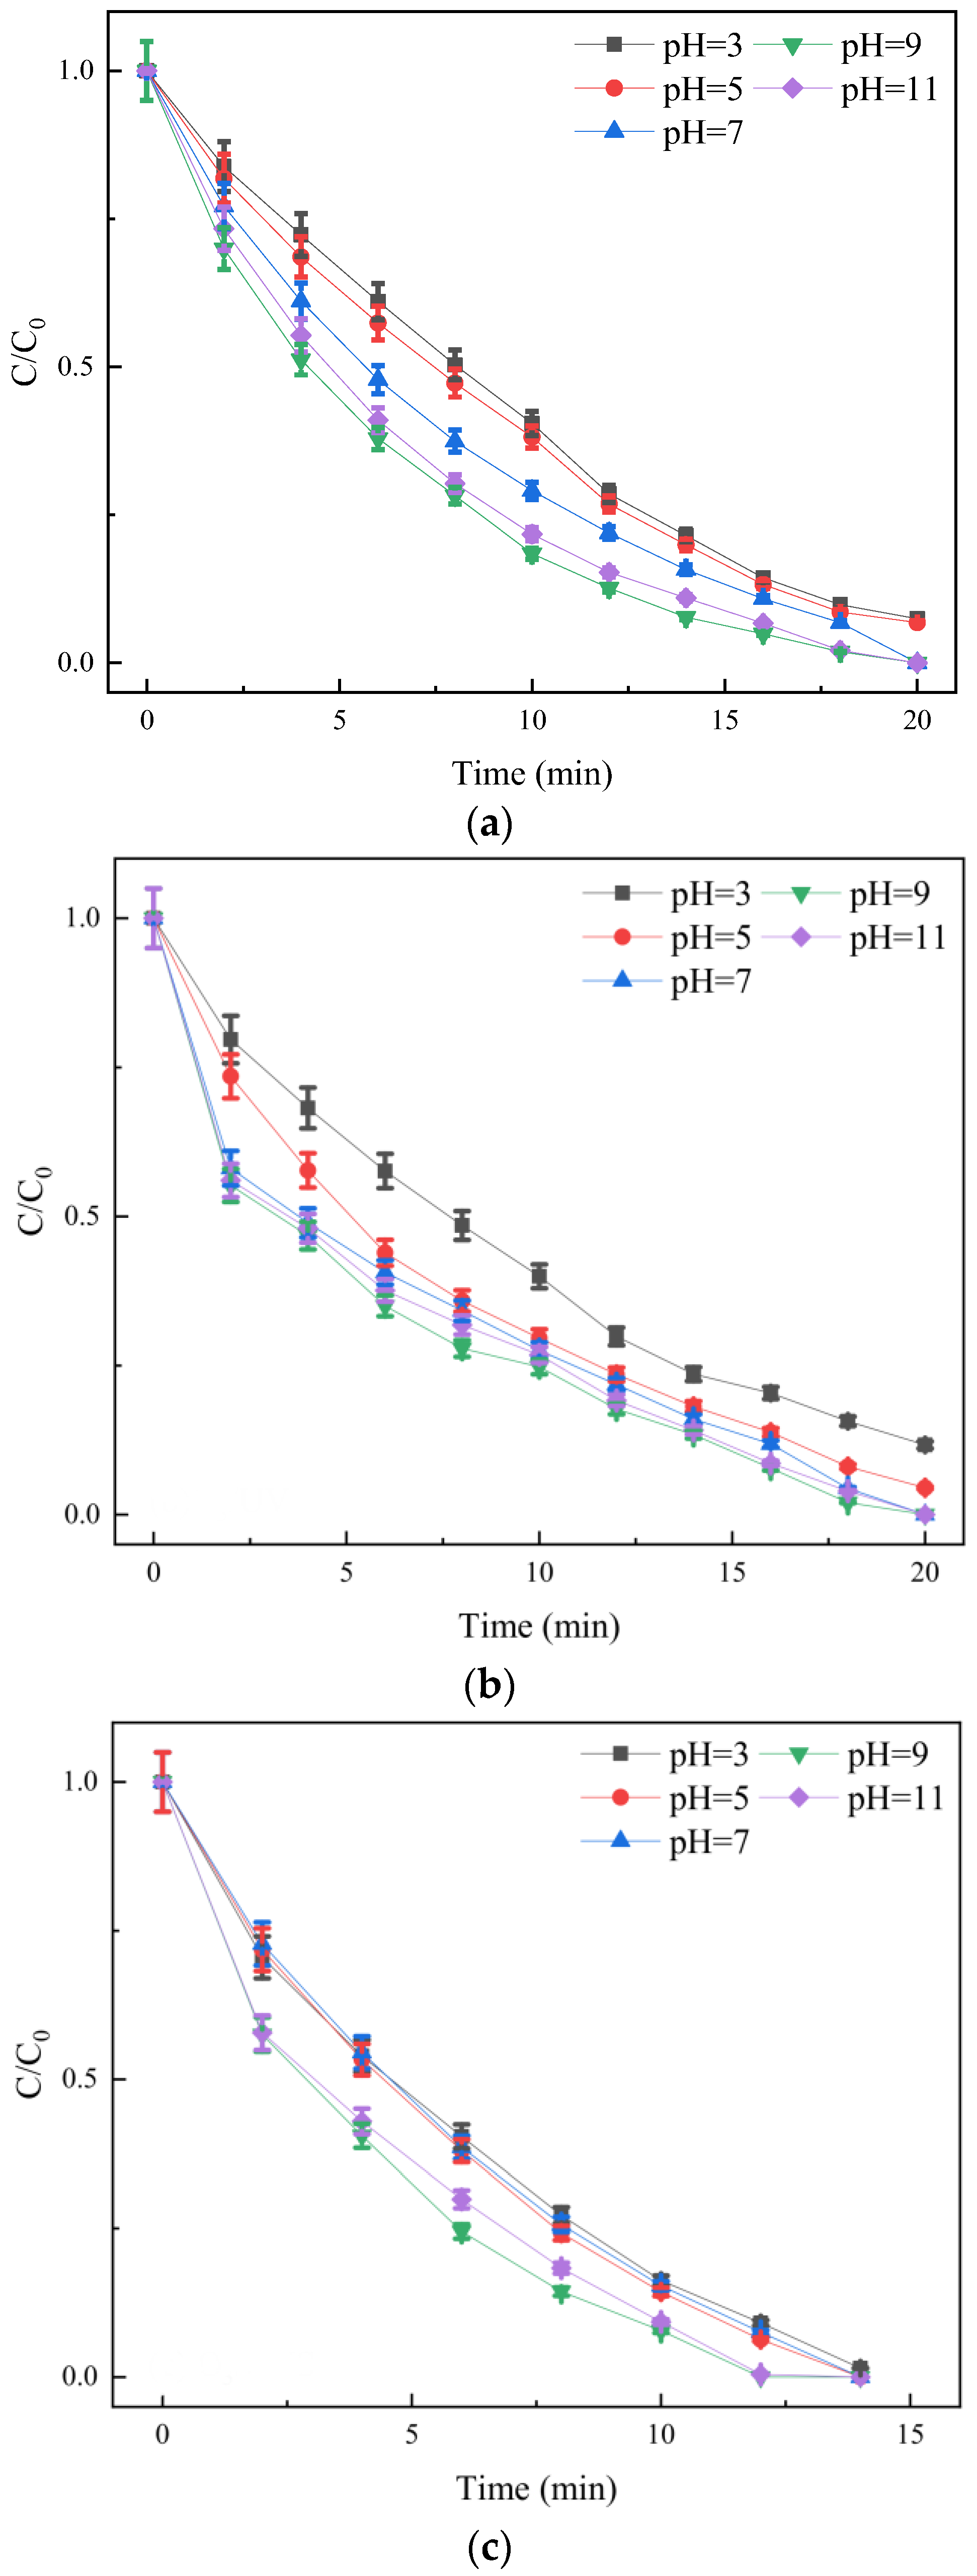
In addition, according to the chemical formula structure of SDZ (Figure 7), SDZ has two functional groups, which made it show different dissociation states at different pH values: protonated, neutral, and deprotonated. With the increase in solution pH value, the main existing form of SDZ in water changed from proton to neutral and then to a deprotonation state. Compared with the proton state and neutral state, the deprotonation state was easier to react with oxidant, which was consistent with the result mentioned above that O3/PMS had the best degradation efficiency of SDZ at pH 9 [41].
3.3. Mineralization Effect of O3, O3/UV, and O3/PMS on SDZ
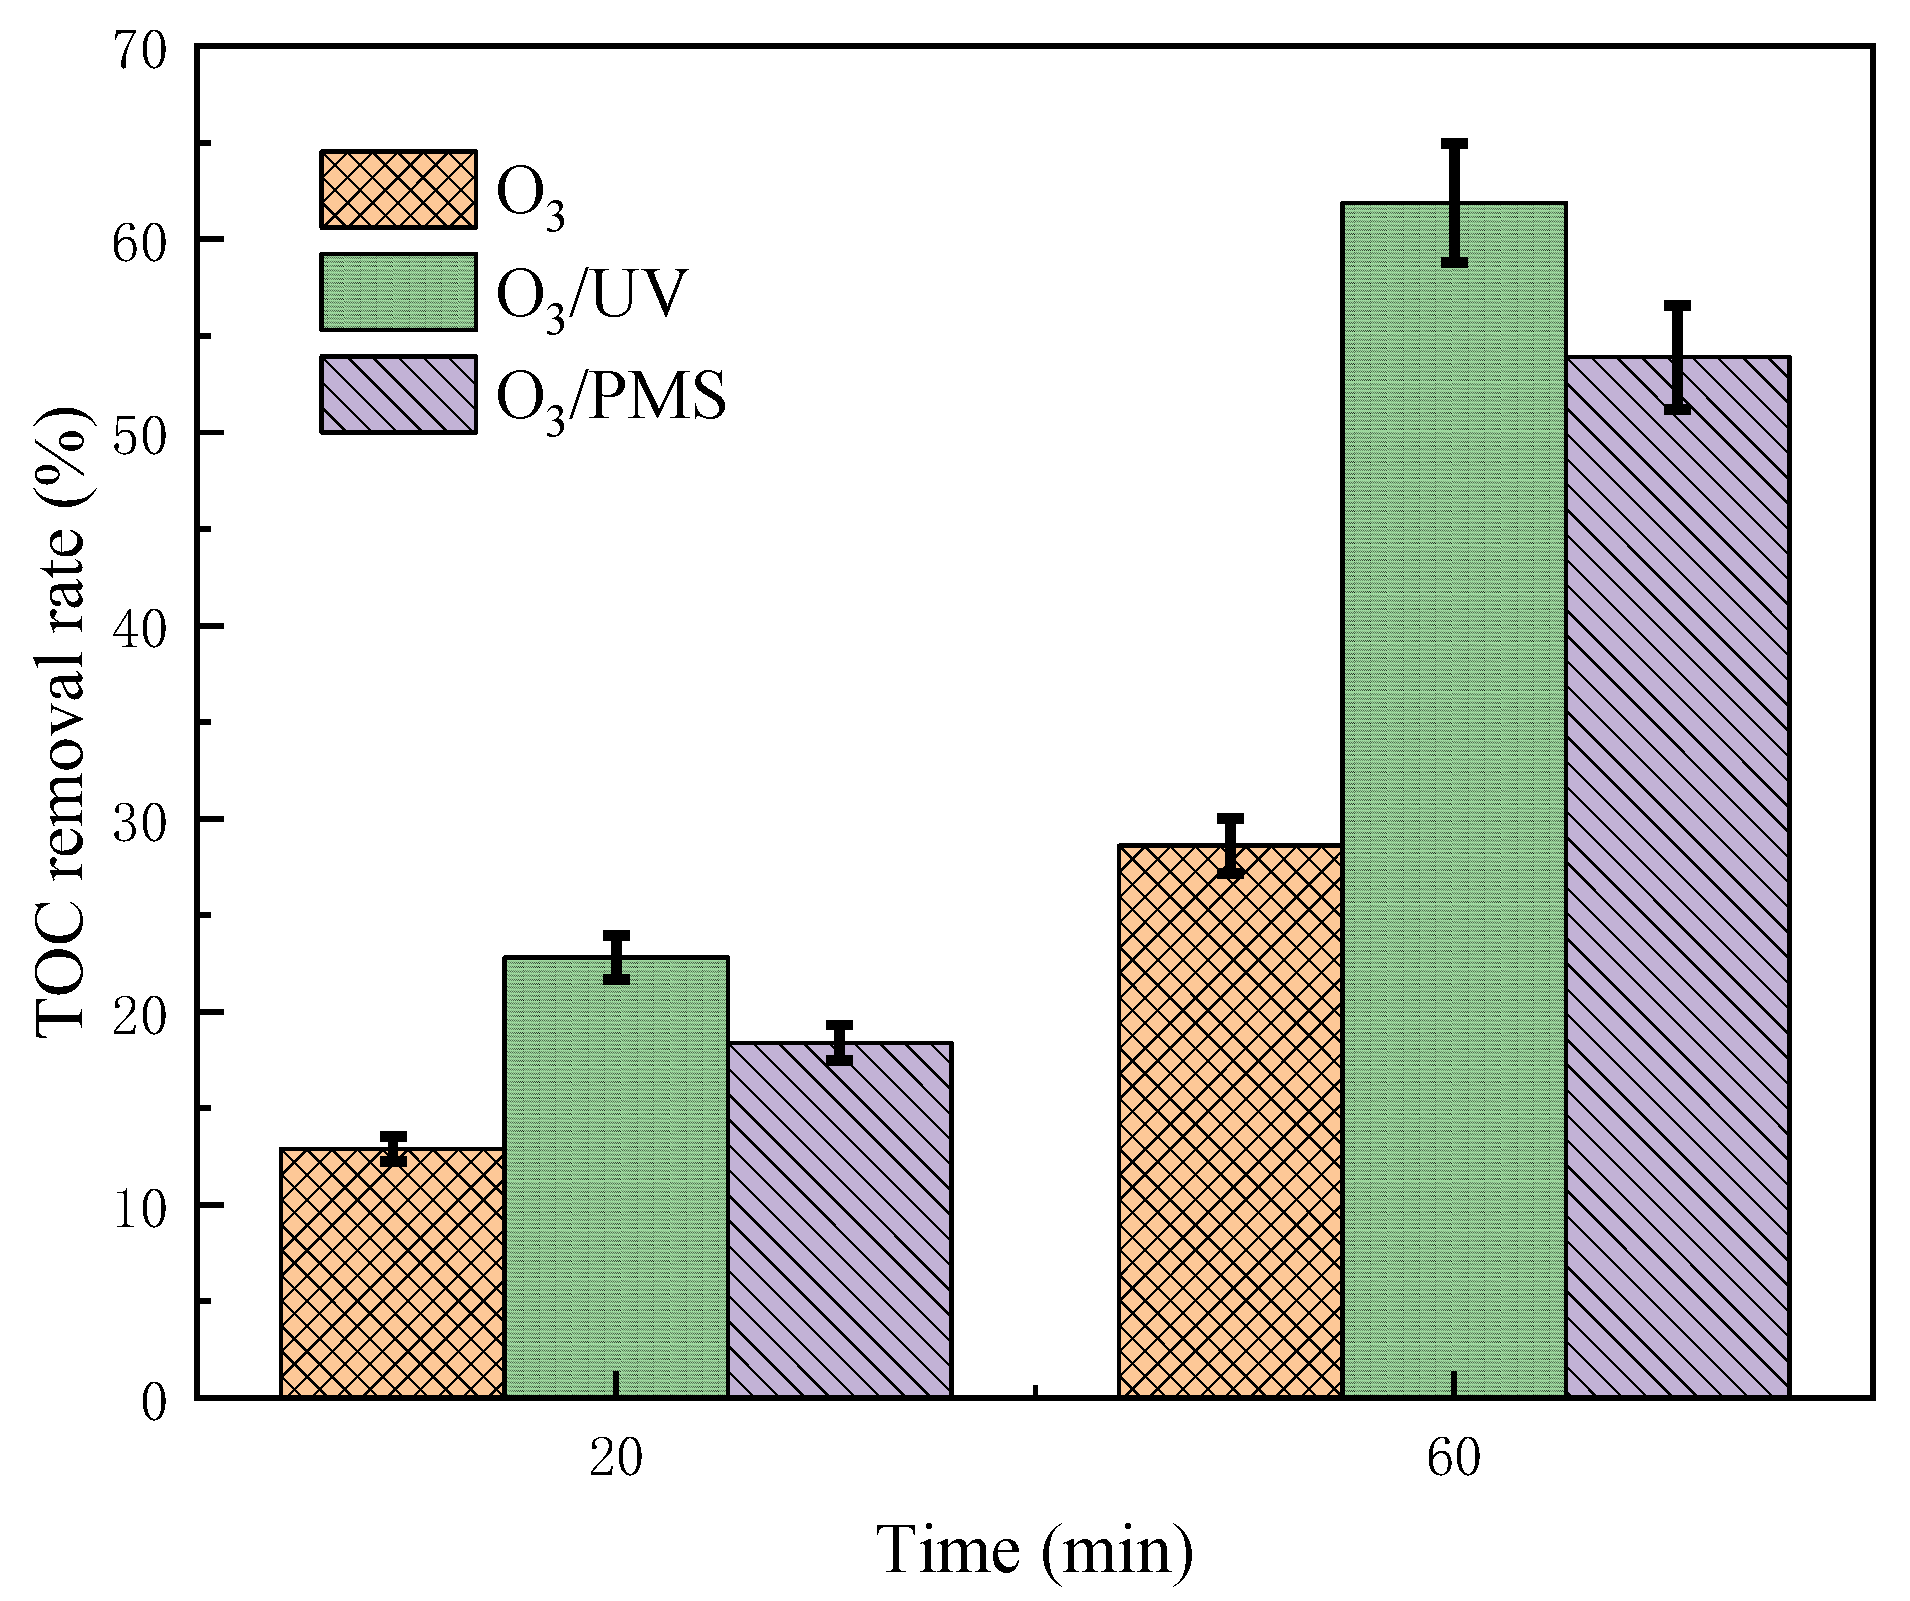
The initial mass concentration of O3 was 3 mg/L, the PMS concentration was 22.8 mg/L, the initial mass concentration of SDZ was 10 mg/L, and the pH was 6.8 ± 0.1. The mineralization of SDZ oxidized by the three processes was investigated. The experimental results are shown in Figure 8.
The test data in Figure 3 show that the degradation rate of SDZ by the three methods reached more than 94% within 20 min. However, as shown in Figure 8, the removal rate of TOC (total organic carbon) within 20 min was not high. The highest was O3/UV, as the removal rate of TOC reached 22.9%. O3/PMS was slightly lower, 18.4%, and the lowest removal rate was only 12.9% with O3. This showed that although the three methods degraded SDZ well within 20 min, they produced a large number of intermediate products, and the oxidation process was not complete. After 40 min of continuous oxidation, the removal rate of TOC in O3/UV was still the highest, reaching 61.9% and more than 54% in O3/PMS, while the removal rate of TOC by O3 only reached 28.6%. This showed that the intermediate products produced in the process of oxidizing SDZ were not easy to oxidize and degraded directly by ozone molecules, while ·OH reacted directly with it. Therefore, the reaction between ·OH and organic matter was not selective, and the oxidation process was more thorough, which completely oxidized the organic matter to improve the removal rate of TOC. Therefore, it can be speculated that ·OH played an essential role in the oxidation of O3/UV and O3/PMS.
3.4. Radical Quenching Experiment of Sulfadiazine Degradation by Ozone/Persulfate
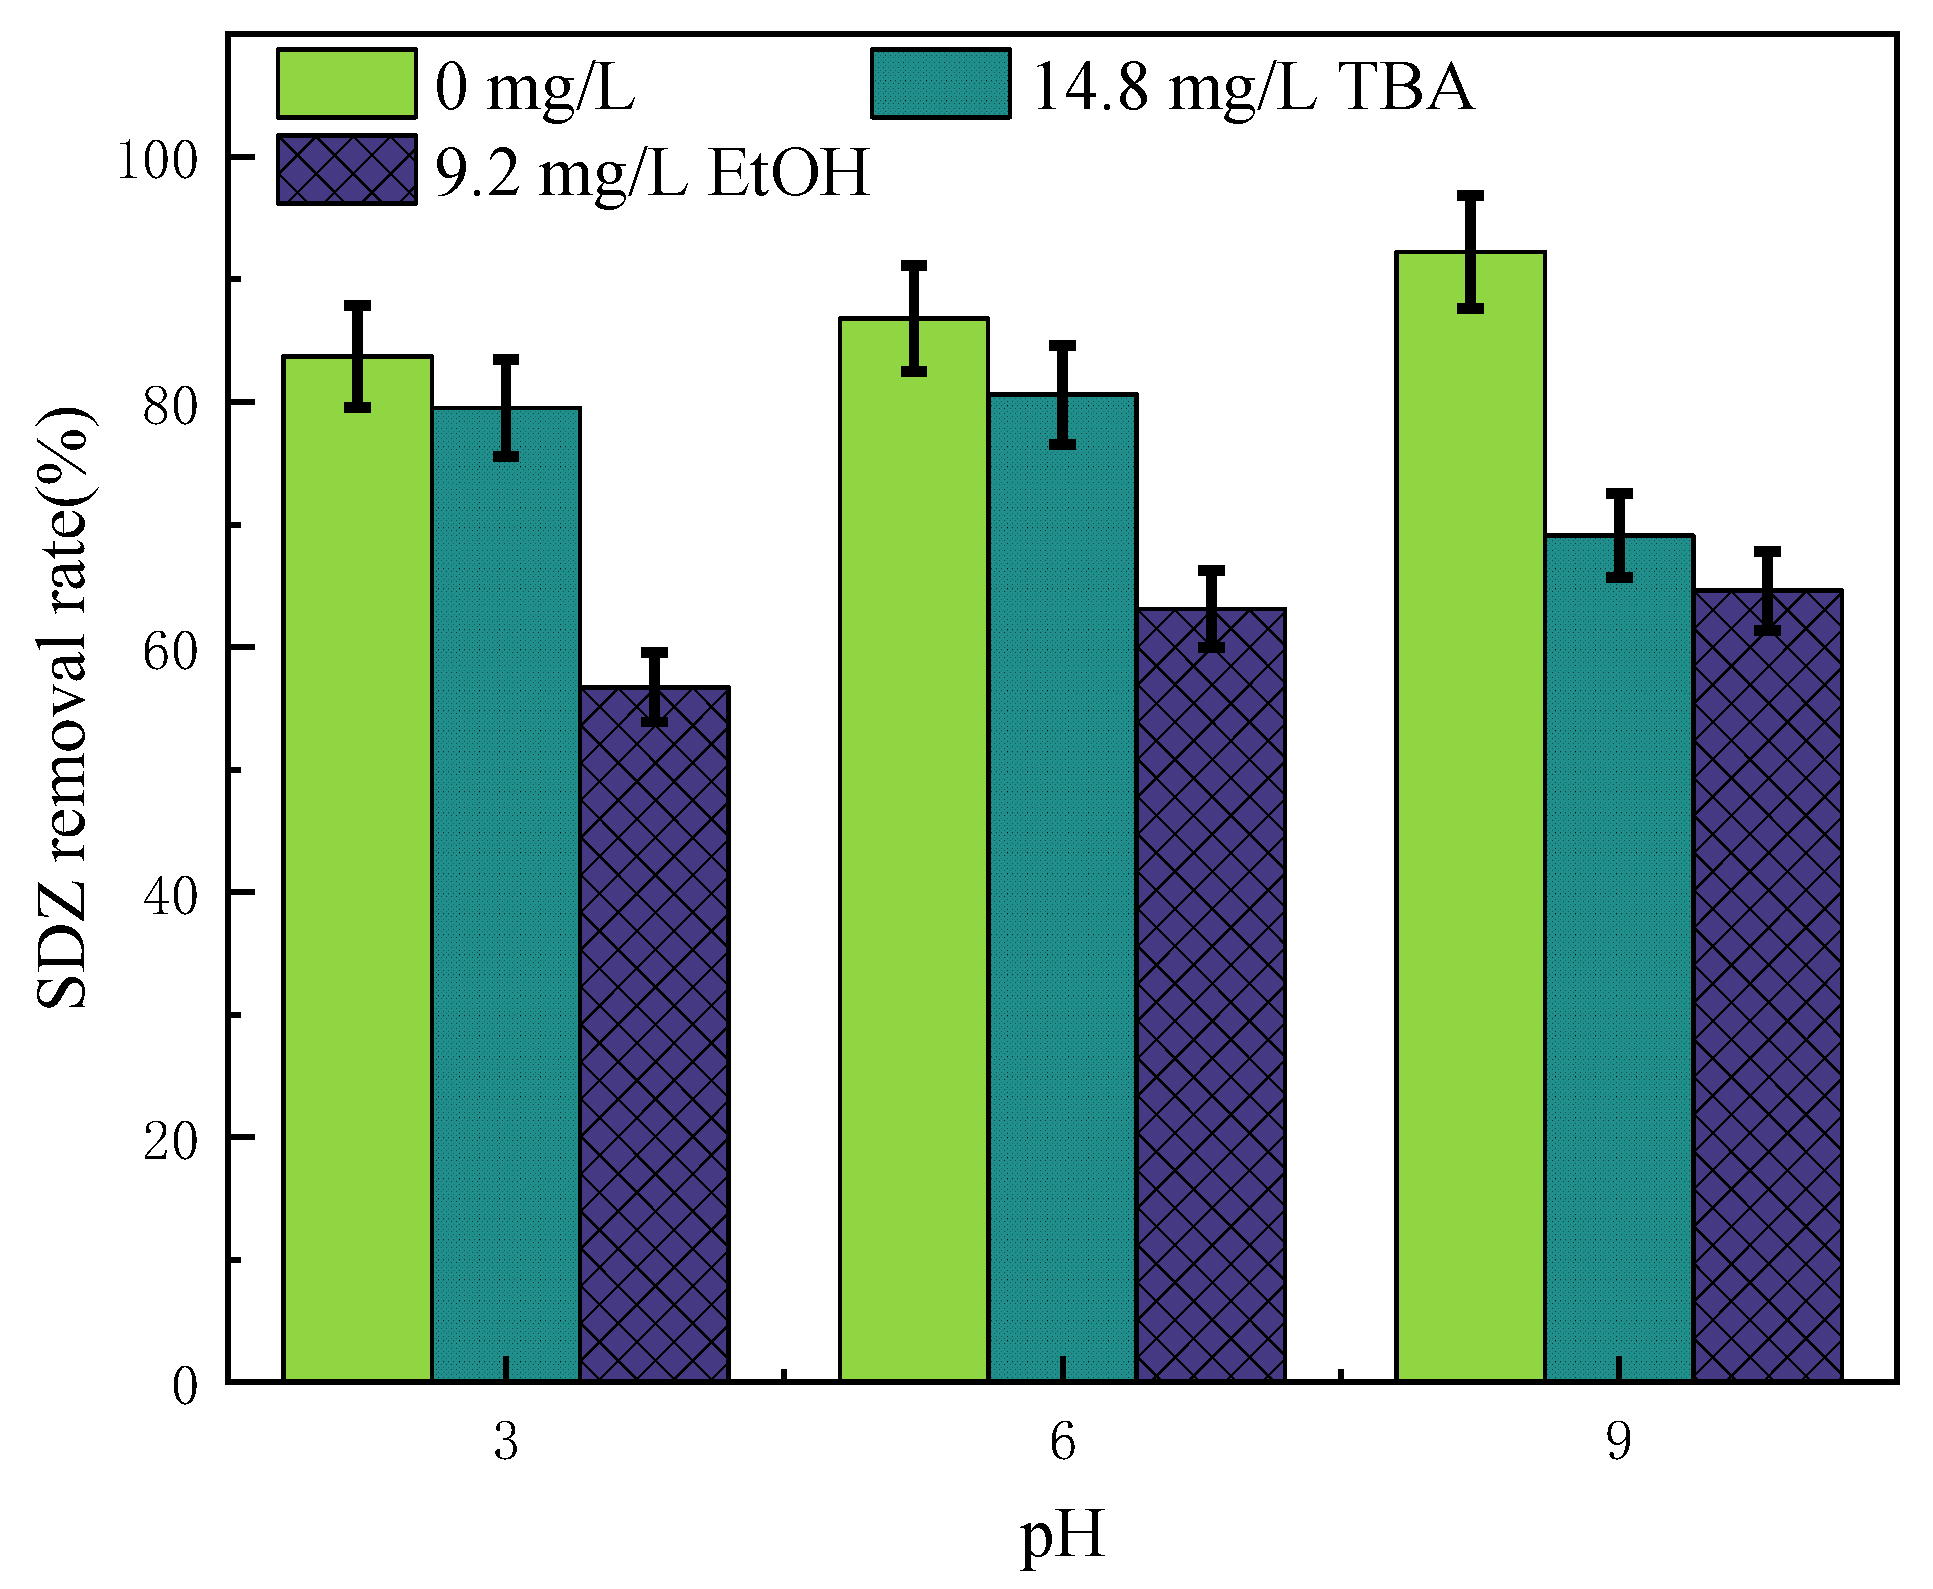
In order to study the effects of ·OH and SO4−· free radicals in O3/PMS on the degradation process of sulfadiazine, tert-Butanol (TBA) was selected as the ·OH quencher, and ethanol (EtOH) was selected as the quencher of ·OH and SO4−· for experiments.
The reaction rate constants of TBA with ·OH and SO4−· were 3.8~7.6 × 10⁸ M−1s−1 and 4.0~9.1 × 10⁵ M−1s−1, quenching only ·OH in the presence of ·OH. The reaction rate constants of EtOH with ·OH and SO4− were 1.2~2.8 × 10⁹ M−1s−1 and 1.6~7.7 × 10⁷ M−1s−1 reacted with both at the same time, so it was considered that EtOH quenched two free radicals at the same time [53]. The experiment was carried out under the following conditions: temperature, 25 ± 0.5 °C; PMS concentration, 22.8 mg/L; initial SDZ concentration, 10 mg/L; ozone concentration, 3 mg/L; pH, 3, 6, and 9; TBA and EtOH concentration, 14.8 and 9.2 mg/L; reaction time, 10 min.
The experimental results are shown in Figure 9. According to the experimental results, the degradation of SDZ by O3/PMS was close to the endpoint when the reaction was carried out for 10 min. The degradation rate of the zero-concentration group under three different pH conditions exceeded 80%, while the degradation rate of the best weak alkaline group (pH = 9) exceeded 90%. At pH 3, the addition of TBA had little effect on the degradation of sulfadiazine, but the addition of EtOH had a significant effect, and the degradation rate decreased by 27%. This may be due to the inhibition of the generation of ·OH under acidic conditions, and only SO4− played the main oxidation role in the two free radicals. At pH 9, the effect of TBA increased significantly, and the effect of EtOH weakened. The reason is that in alkaline conditions, there are many ways of ·OH generation in O3/PMS, including O3 activating PMS to produce ·OH, OH− reacting with O3 to produce ·OH, and SO4−· reacting with OH− to convert to ·OH (see Equations (13) and (14) for details), which led to the dominant position of ·OH in the two free radicals in an alkaline environment.
3.5. Degradation Test of SDZ in Natural Water
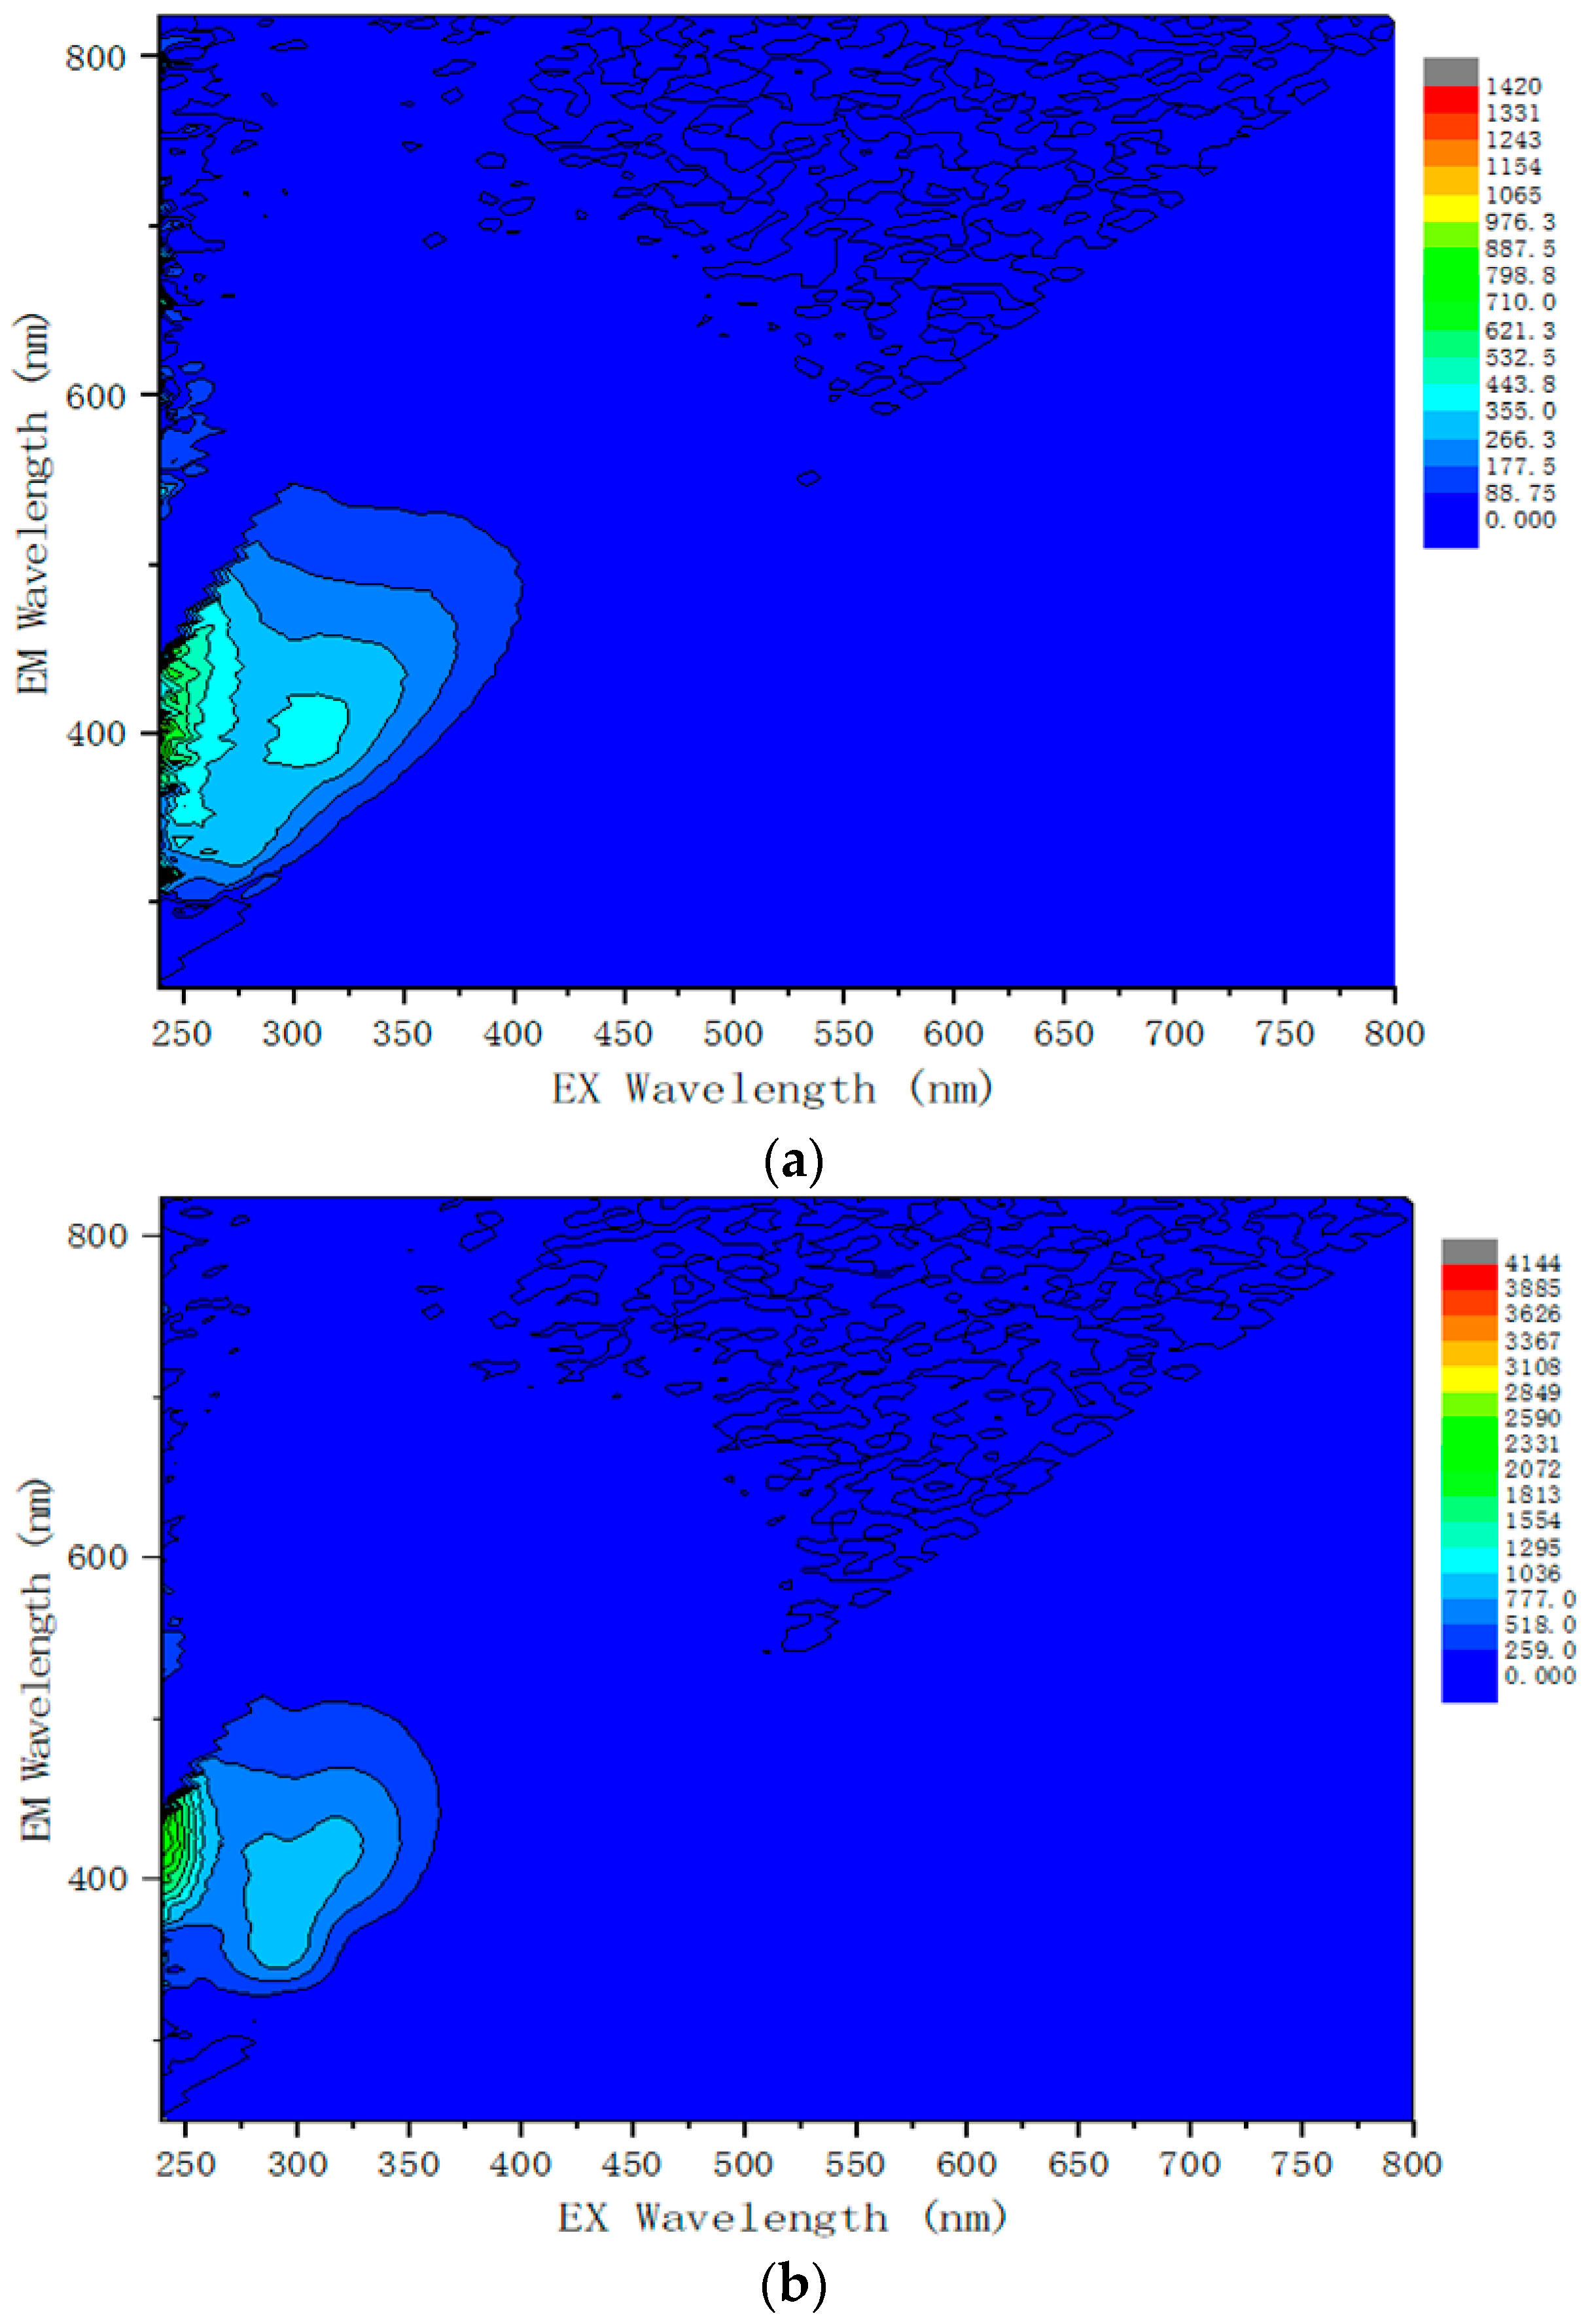
The oxidative degradation experiment of SDZ in natural water was carried out in O3/PMS. Absorption-three-dimensional fluorescence spectroscopy (Horiba Scientific aqualog-800-c) was used to measure water samples in the experiment. The excitation light source was a deuterium lamp, and the photomultiplier tube (PMT) voltage was 500 V. The response time was 0.5 s and the scanning speed was 2400 nm/min. The excitation wavelength scanning range was 200–400 nm with a step size of 2 nm. The emission wavelength scanning range was 250–500 nm with a 2 nm step size. The slit width was 5 nm [54]. The test results are shown in Figure 10 and Figure 11. As shown in Figure 10, from the change process of the three-dimensional fluorescence spectrum, the natural river water used for the test contained a variety of fluorescent organics, mainly humic acid, chlorophyll, fulvic acid, etc. After 20 min of degradation treatment, the concentrations of various organic substances in water decreased. After 60 min of treatment, most detectable organics degraded to a lower concentration, and the fluorescence almost disappeared, indicating that O3/PMS can effectively remove a variety of fluorescent organics in water. It can be seen from Figure 11 that under the condition of river water quality, compared with the degradation test results of SDZ in pure water, the efficiency of O3/PMS oxidative degradation of SDZ was significantly inhibited. This was mainly due to the competition of various types of organics in natural water for active oxidizing substances in the oxidation system. Therefore, although the degradation efficiency of SDZ was reduced under the condition of river water quality, the application of O3/PMS in the advanced treatment of actual water bodies to degrade this kind of pollutants still had good prospects.
4. Conclusions
- (1)
- In this experiment, the O3/PMS process was used for the first time to degrade the typical antibiotic SDZ. The combination of O3 and PMS produced an apparent synergistic effect and improved the degradation efficiency of SDZ. Under the experimental conditions of initial SDZ concentration of 10 mg/L, ozone concentration of 3 mg/L, and pH of 6.8 ± 0.1, the time required for O3/PMS to degrade SDZ below the detection limit was 8 min less than that of O3 and O3/UV. Existing studies show that the treatment effect of a single UV factor was poor, and even the O3/UV combined process can only achieve limited improvement. The Kobs value increased from 0.1456 to 0.193 min−1, while the O3/PMS process Kobs was 0.2504 min−1.
- (2)
- The single factor experiment showed that the degradation rate of SDZ by O3/PMS decreased with the increase in the initial concentration of SDZ and increased with the increase in ozone concentration. There was an optimal concentration of PMS. The most suitable pH range was weak alkalinity, and the factors affecting the degradation of SDZ by the three processes agree with the pseudo-first-order reaction kinetic equation.
- (3)
- The strong oxidation ability of O3/PMS was attributed to the formation of ·OH and SO4−. When the reaction was carried out for 60 min, it had a nearly 54% mineralization effect on SDZ, slightly lower than 62% of O3/UV. When SDZ was degraded in natural water, O3/PMS showed efficient degradation of fluorescent organics, significantly better than other ozone-advanced oxidation processes.
- (4)
- Future research should focus on the insufficient mineralization ability of O3/PMS and apply it to the degradation of more sulfonamides to improve the stability and applicability of this technology. In addition, the influencing factors need to be modeled and calculated to provide data prediction and a theoretical analysis basis for the specific practical application of this method.
Author Contributions
Conceptualization, H.L.; methodology, W.F.; software, Q.L.; validation, W.F.; formal analysis, W.F.; investigation, W.F. and Q.L.; resources, H.L.; data curation, Q.L.; writing—original draft preparation, H.L.; writing—review and editing, W.F.; visualization, H.L.; supervision, H.L.; project administration, H.L.; funding acquisition, H.L. All authors have read and agreed to the published version of the manuscript.
Funding
This work was supported by the National Natural Science Foundation of China (no. 52070087).
Institutional Review Board Statement
Not applicable.
Informed Consent Statement
Not applicable.
Data Availability Statement
Not applicable.
Acknowledgments
We thank the help from Xiaoling Wang, Jianhui Wang, and Zhihao Ye during this experimental study.
Conflicts of Interest
The authors declare no conflict of interest.
References
- Qiao, M.; Chen, W.D.; Su, J.Q.; Zhang, B.; Zhang, C. Fate of tetracyclines in swine manure of three selected swine farms in China. J. Environ. Sci. 2012, 24, 1047–1052. [Google Scholar] [CrossRef]
- Chee-Sanford, J.C.; Mackie, R.I.; Koike, S.; Krapac, I.G.; Lin, Y.F.; Yannarell, A.C.; Maxwell, S.; Aminov, R.I. Fate and transport of antibiotic residues and antibiotic resistance genes following land application of manure waste. J. Environ. Qual. 2009, 38, 1086–1108. [Google Scholar] [CrossRef] [PubMed]
- Pan, X.; Qiang, Z.M.; Ben, W.W.; Chen, M.X. Residual veterinary antibiotics in swine manure from concentrated animal feeding operations in Shandong Province, China. Chemosphere 2011, 84, 695–700. [Google Scholar] [CrossRef] [PubMed]
- Hvistendahl, M. China takes aim ai rampant antibiotic resistance. Science 2012, 336, 795. [Google Scholar] [CrossRef]
- Meyer, E.; Gastmeier, P.; Deja, M.; Schwab, F. Antibiotic consumption and resistance: Data from Europe and Germany. Int. J. Med. Microbiol. 2013, 303, 388–395. [Google Scholar] [CrossRef] [PubMed]
- Zhu, Y.G.; Johnson, T.A.; Su, J.Q.; Qiao, M.; Guo, G.X.; Stedtfeld, R.D.; Hashsham, S.A.; Tiedje, J.M. Diverse and abundant antibiotic resistance genes in China swine farms. Proc. Natl. Acad. Sci. USA 2013, 110, 3435–3440. [Google Scholar] [CrossRef] [PubMed]
- Zhang, Q.Q.; Ying, G.G.; Pan, C.G.; Liu, Y.S.; Zhao, J.L. A comprehensive evaluation of antibiotics emission and fate in the river basins of China: Source analysis, multimedia modelling, and linkage to bacterial resistance. Environ. Sci. Technol. 2015, 49, 6772–6782. [Google Scholar] [CrossRef]
- Sassman, S.A.; Lee, L.S. Sorption of three tetracyclines by several soils: Assessing the role of pH and cation exchange. Environ. Sci. Technol. 2005, 39, 7452–7459. [Google Scholar] [CrossRef]
- Pruden, A.; Pei, R.; Storteboom, H.; Carlson, K.H. Antibiotic resistance genes as emerging contaminants: Studies in northern Colorado. Environ. Sci. Technol. 2006, 40, 7445–7450. [Google Scholar] [CrossRef]
- Gao, L.H.; Shi, Y.L.; Li, W.H.; Liu, J.M.; Cai, Y.Q. Occurrence, distribution and bioaccumulation of antibiotics in the Haihe River in China. J. Environ. Monit. 2012, 14, 1248. [Google Scholar] [CrossRef]
- Su, J.Q.; Huang, F.Y.; Zhu, Y.G. Antibiotic resistance genes in the environment. Biodivers. Sci. 2013, 21, 481–487. [Google Scholar]
- Jia, A.; Hu, J.Y.; Wu, X.Q.; Peng, H.; Wu, S.M.; Dong, Z.M. Occurrence and source apportionment of sulfonamides and their metabolites in Liaodong Bay and the adjacent Liao River basin, north China. Environ. Toxicol. Chem. 2011, 30, 1252–1260. [Google Scholar] [CrossRef] [PubMed]
- Wu, L.Q.; Qian, M.R.; Lu, L.Z.; Tao, Z.R.; Li, G.Q.; Feng, S.L.; Chen, Z.M.; Li, R.; Fang, L.Z. Anitiobic residues in waste waters from main livestock farms in Zhejiang Province. Acta Agric. Zhejiangensis 2012, 24, 699–705. [Google Scholar]
- Chen, J.P.; Yang, Y.L.; Wu, Z.Q.; Peng, G.H. Pollution of antibiotics in livestock wastewater and the environmental water in Jiangxi Province. J. Anhui Agri Sci 2015, 43, 224–227. [Google Scholar]
- Peng, X.Z.; Wang, Z.D.; Kuang, W.X.; Tan, J.H.; Li, K. A preliminary study on the occurrence and behavior of sulfonamides, ofloxacin and chloramphenicol antimicrobials in wastewaters of two sewage treatment plants in Guangzhou, China. Sci. Total Environ. 2006, 371, 314–322. [Google Scholar] [CrossRef]
- Garcia-Galan, M.J.; Diaz-Cruz, M.S.; Barcelo, D. Determination of 19 sulfonamides in environmental water samples by automated on-line solid-phase extraction-liquid chromatography-tandem mass spectrometry (SPE-LC-MS/MS). Talanta 2010, 81, 355–366. [Google Scholar] [CrossRef]
- Wei, R.C.; Ge, F.; Huang, S.Y.; Chen, M.; Wang, R. Occurrence of veterinary antibiotics in animal wastewater and surface water around farms in Jiangsu Province, China. Chemosphere 2011, 82, 1408–1414. [Google Scholar] [CrossRef]
- Gao, L.H.; Shi, Y.L.; Li, W.H.; Niu, H.Y.; Liu, J.M.; Cai, Y.Q. Occurrence of antibiotics in eight sewage treatment plants in Beijing, China. Chemosphere 2012, 86, 665–671. [Google Scholar] [CrossRef]
- Lian, Z.R.; He, X.L.; Wang, J.T. Determination of Sulfadiazine in Jiaozhou Bay using molecularly imprinted solid-phase extraction followed by high-performance liquid chromatography with a diode-array detector. J. Chromatogr. B 2014, 957, 53–59. [Google Scholar] [CrossRef]
- Tlili, I.; Caria, G.; Ouddane, B.; Ghorbel-Abid, I.; Ternane, R.; Trabelsi-Ayadi, M.; Net, S. Simultaneous detection of antibiotics and other drug residues in the dissolved and particulate phases of water by an off-line SPE combined with on-line SPE-LC-MS/MS: Method development and application. Sci. Total Environ. 2016, 563–564, 424–433. [Google Scholar] [CrossRef]
- Chen, H.Y.; Jing, L.J.; Teng, Y.G.; Wang, J.S. Characterisation of antibiotic in a large-scale river system of China: Occurrence pattern, spatiotemporal distribution and environmental risks. Sci. Total Environ. 2018, 618, 409–418. [Google Scholar] [CrossRef] [PubMed]
- Afsa, S.; Hamden, K.; Martin, P.A.L.; Mansour, H.B. Occurrence of 40 pharmaceutically active compounds in hospital and urban wastewaters and their contribution to Mahdia coastal seawater contamination. Environ. Sci. Pollut. Res. 2020, 27, 1941–1955. [Google Scholar] [CrossRef]
- Ngigi, A.N.; Magu, M.M.; Muendo, B.M. Occurrence of antibiotics residues in hospital wastewater, wastewater treatment plant, and in surface water in Nairobi County, Kenya. Environ. Monit. Assess. 2020, 192, 18. [Google Scholar] [CrossRef] [PubMed]
- Wu, Q.; Pan, C.G.; Wang, Y.H.; Xiao, S.K.; Yu, K.F. Antibiotics in a subtropical food wed from the Beibu Gulf, South China: Occurrence, bioaccumulation and trophic transfer. Sci. Total Environ. 2021, 751, 141718. [Google Scholar] [CrossRef] [PubMed]
- Manna, M.; Sen, S. Advanced oxidation process: A sustainable technology for treating refractory organic compounds present in industrial wastewater. Environ. Sci. Pollut. Res. 2022. [Google Scholar] [CrossRef] [PubMed]
- Li, S.; Yang, Y.L.; Zheng, H.S.; Zheng, Y.J.; Jing, T.; Ma, J.; Nan, J.; Leong, Y.K.; Chang, J.S. Advanced oxidation process based on hydroxyl and sulfate radicals to degrade refractory organic pollutants in lanfill leachate. Chemosphere 2022, 297, 134214. [Google Scholar] [CrossRef] [PubMed]
- Hien, N.T.; Nguyen, L.H.; Van, H.T.; Nguyen, T.D.; Nguyen, T.H.V.; Chu, T.H.H.; Nguyen, T.V.; Trinh, V.T.; Vu, X.H.; Aziz, K.H.H. Heterogeneous catalyst ozonation of Direct Black 22 from aqueous solution in the presence of metal slags origi-nating from industrial solid wastes. Sep. Purif. Technol. 2020, 233, 115961. [Google Scholar] [CrossRef]
- Foroughi, M.; Khiadani, M.; Kakhki, S.; Kholghi, V.; Naderi, K.; Yektay, S. Effect of ozonation-based disinfection methods on the removal of antibiotic resistant bacteria and resistance genes (ARB/ARGs) in water and wastewater treatment: A systematic review. Sci. Total Environ. 2022, 811, 151404. [Google Scholar] [CrossRef]
- Issaka, E.; AMU-Darko, J.N.O.; Yakubu, S.; Fapohunda, F.O.; Ali, N. Bilal. M. Advanced catalytic ozonation for degradation of pharmaceutical pollutants-A review. Chemosphere 2022, 289, 133208. [Google Scholar] [CrossRef] [PubMed]
- Kanakaraju, D.; Glass, B.D.; Oelgemoller, M. Advanced oxidation process-mediated removal of pharmaceuticals from water: A review. J. Environ. Manag. 2018, 219, 189–207. [Google Scholar] [CrossRef] [PubMed]
- Pandis, P.K.; Kalogirou, C.; Kanellou, E.; Vaitsis, C.; Savvidou, M.G.; Sourkouni, G.; Zorpas, A.A.; Argirusis, C. Key Points of Advanced Oxidation Processes (AOPs) for Wastewater, Organic Pollutants and Pharmaceutical Waste Treatment: A Mini Review. ChemEngineering 2022, 6, 8. [Google Scholar] [CrossRef]
- Aziz, K.H.H. Application of different advanced oxidation processes for the removal of chloroacetic acids using a planar falling film reactor. Chemosphere 2019, 228, 377–383. [Google Scholar] [CrossRef]
- Asghar, A.; Lutze, H.V.; Tuerk, J.; Schmidt, T.C. Influence of water matrix on the degradation of organic micropollutants by ozone based processes: A review on oxidant scavenging mechanism. J. Hazard. Mater. 2022, 429, 128189. [Google Scholar] [CrossRef] [PubMed]
- Mora, A.S.; McBeath, S.T.; Cid, C.A.; Hoffmann, M.R.; Graham, N.J.D. Diamond electrode facilitated electrosynthesis of water and wastewater treatment oxidants. Curr. Opin. Electroche. 2022, 32, 100899. [Google Scholar] [CrossRef]
- Jaafarzadeh, N.; Ghanbari, F.; Ahmadi, M.; Omidinasab, M. Efficient integrated processes for pulp and paper wastewater treatment and phytotoxicity reduction: Permanganate, Electro-Fenton and Co3O4/UV/peroxymonosulfate. Chem. Eng. J. 2017, 308, 142–150. [Google Scholar] [CrossRef]
- Jaafarzadeh, N.; Ghanbari, F.; Omidinasab, M. Combined electrocoagulation and UV-based sulfate radical oxidation processes for treatment of pulp and paper wastewater. Process Saf. Environ. Prot. 2016, 102, 462–472. [Google Scholar] [CrossRef]
- Hu, P.D.; Long, M.C. Cobalt-catalyzed sulfate radical-based advanced oxidation: A review on heterogeneous catalysts and applications. Appl. Catal. B 2016, 181, 103–117. [Google Scholar] [CrossRef]
- Wen, G.; Wang, S.B.; Wang, T.; Feng, Y.B.; Chen, Z.H.; Lin, W.; Huang, T.L.; Ma, J. Inhibition of bromate formation in the O3/PMS process by adding low dosage of carbon materials: Efficiency and mechanism. Chem. Eng. J. 2020, 402, 126207. [Google Scholar] [CrossRef]
- Zhao, G.Y. Research on Emerging Contaminants Removal from Drinking Water by UV-Micro O3 Process; Southeast University: Nanjing, China, 2014. (In Chinese) [Google Scholar]
- Simonin, J.P. On the comparison of pseudo-second order rate laws in the modeling of adsorption kinetics. Chem. Eng. J. 2016, 300, 254–263. [Google Scholar] [CrossRef]
- Yang, Z.Z. Performance and Mechanism for Degradation of Sulfadiazine in Water by UV/O3 Process; Harbin Institute of Technology: Harbin, China, 2016. (In Chinese) [Google Scholar]
- Wang, Y.B.; Wang, S.P.; Wang, Z.; Zhou, R.F.; Chang, J. Degradation effect and kinetics of ibuprofen in water by UV/O3 advanced oxidation. Ind. Water Treat. 2020, 40, 40–43. [Google Scholar]
- Yuan, Z.; Sui, M.H.; Yuan, B.J.; Li, P.; Wang, J.Y.; Qin, J.; Xu, G.Y. Degradation of ibuprofen using Ozone combined with peroxymonosulfate. Environ. Sci. Water Res. Technol. 2017, 3, 960–969. [Google Scholar] [CrossRef]
- Maruthamuthu, P.; Neta, P. Radiolytic chain decomposition of peroxomonophosphoric and peroxomonosulfuric acids. J. Phys. Chem. B 1977, 81, 937–940. [Google Scholar] [CrossRef]
- Neta, P.; Huie, R.E.; Ross, A.B. Rate constants for reactions of inorganic radicals in aqueous solution. J. Phys. Chem. Ref. Data 1988, 17, 1027–1284. [Google Scholar] [CrossRef]
- Buxton, G.V.; Greenstock, C.L.; Helman, W.P.; Ross, A.B. Critical review of rate for reactions of hydrates electrons, hydrogen atoms and hydroxyl radicals (OH/·O−) in aqueous solution. J. Phys. Chem. Ref. Data 1988, 17, 513–886. [Google Scholar] [CrossRef]
- Klaning, U.K.; Sehested, K.; Appelman, E.H. Laser flash photolysis and pulse radiolysis of aqueous solutions of the fluoroxysulfate ion, SO4F−. Inorg. Chem. 1991, 30, 3582–3584. [Google Scholar] [CrossRef]
- Sehested, K.; Holcman, J.; Bjergbakke, E.; Hart, E.J. Formation of Ozone in the reaction of OH with O3− and the decay of the ozonide ion radical at pH 10–13. J. Phys. Chem. 1984, 88, 269–273. [Google Scholar] [CrossRef]
- Elliot, A.J.; Mccracken, D.R. Effect of temperature on O− reactions and equilibria: A pulse radiolysis study. Radiat. Phys. Chem. 1989, 33, 69–74. [Google Scholar] [CrossRef]
- Chen, T.Y.; Kao, C.M.; Hong, A.; Lin, C.E.; Liang, S.H. Application of Ozone on the decolorisation of reactive dyes-Orange-13 and Blue-19. Desalination 2009, 249, 1238–1242. [Google Scholar] [CrossRef]
- Chu, W.; Ma, C.W. Quantitative prediction of direct and indirect dye ozonation kinetics. Water Res. 2000, 34, 3153–3160. [Google Scholar] [CrossRef]
- Shu, H.Y.; Chang, M.C. Decolorization effects of six azo dyes by O3, UV/O3 and UV/H2O2 processes. Dyes. Pigm. 2005, 65, 25–31. [Google Scholar] [CrossRef]
- Rong, S.P.; Sun, Y.B.; Zhao, Z.H. Degradation of sulfadiazine antibiotics by water falling film dielectric barrier discharge. Chin. Chem. Lett. 2014, 25, 187–192. [Google Scholar] [CrossRef]
- Murphy, K.R.; Hambly, A.; Singh, S.; Henderson, R.K.; Baker, A.; Stuetz, R.; Khan, S.J. Organic matter fluorescence in municipal water recycling schemes: Toward a unified PARAFAC Model. Environ. Sci. Technol. 2011, 45, 2909–2916. [Google Scholar] [CrossRef] [PubMed]
Figure 1.
Sulfadiazine (SDZ) structure diagram (black represents C-atom, blue represents N-atom, red represents O-atom, gray represents H-atom, and yellow represents S-atom).
Figure 1.
Sulfadiazine (SDZ) structure diagram (black represents C-atom, blue represents N-atom, red represents O-atom, gray represents H-atom, and yellow represents S-atom).

Figure 2.
Experimental device diagram.

Figure 3.
Degradation effect of different treatment methods on SDZ (reaction conditions: SDZ = 10 mg/L, O3 = 3 mg/L, T = 25 ± 0.5 °C, pH = 6.8 ± 0.1, O3/PMS (persulfate) (PMS = 22.8 mg/L), UV = 0.9 mw/cm2).
Figure 3.
Degradation effect of different treatment methods on SDZ (reaction conditions: SDZ = 10 mg/L, O3 = 3 mg/L, T = 25 ± 0.5 °C, pH = 6.8 ± 0.1, O3/PMS (persulfate) (PMS = 22.8 mg/L), UV = 0.9 mw/cm2).

Figure 4.
Effect of initial mass concentration of SDZ on degradation effect of O3, O3/UV, and O3/PMS (reaction conditions: SDZ = 2, 4, 6, 8, 10 mg/L, O3 = 3 mg/L, T = 25 ± 0.5 °C, pH = 6.8 ± 0.1, O3/PMS (PMS = 22.8 mg/L), UV = 0.9 mw/cm2). (a) O3, (b) O3/UV, (c) O3/PMS.
Figure 4.
Effect of initial mass concentration of SDZ on degradation effect of O3, O3/UV, and O3/PMS (reaction conditions: SDZ = 2, 4, 6, 8, 10 mg/L, O3 = 3 mg/L, T = 25 ± 0.5 °C, pH = 6.8 ± 0.1, O3/PMS (PMS = 22.8 mg/L), UV = 0.9 mw/cm2). (a) O3, (b) O3/UV, (c) O3/PMS.

Figure 5.
The effects of different oxidant dosages on SDZ degradation in O3, O3/UV, and O3/PMS processes (reaction conditions: SDZ = 10 mg/L, O3 = 3 mg/L, UV = 0.9 mw/cm2, T = 25 ± 0.5 °C, pH = 6.8 ± 0.1; (a–c) O3 = 1, 2, 3, 4, 5, 6 mg/L; (c) PMS = 22.8 mg/L; (d) PMS = 5.7, 11.4, 17.1, 22.8, 28.5, 34.2 mg/L, O3 = 3 mg/L). (a) Ozone dosage in O3, (b) Ozone dosage in O3/UV, (c) Ozone dosage in O3/PMS, (d) PMS dosage in O3/PMS.


Figure 6.
Effect of pH on SDZ degradation in O3, O3/UV, and O3/PMS processes (reaction conditions: pH = 3, 5, 7, 9, 11, SDZ = 10 mg/L, O3 = 3 mg/L, T = 25 ± 0.5 °C, O3 = 3 mg/L, PMS = 22.8 mg/L, UV = 0.9 mw/cm2). (a) O3, (b) O3/UV, (c) O3/PMS.
Figure 6.
Effect of pH on SDZ degradation in O3, O3/UV, and O3/PMS processes (reaction conditions: pH = 3, 5, 7, 9, 11, SDZ = 10 mg/L, O3 = 3 mg/L, T = 25 ± 0.5 °C, O3 = 3 mg/L, PMS = 22.8 mg/L, UV = 0.9 mw/cm2). (a) O3, (b) O3/UV, (c) O3/PMS.

Figure 7.
The structural formula of three forms of SDZ.

Figure 8.
Mineralization effect of O3, O3/UV, and O3/PMS on SDZ (reaction conditions: pH = 6.8 ± 0.1, SDZ = 10 mg/L, O3 = 3 mg/L, T = 25 ± 0.5 °C, O3 = 3 mg/L, PMS = 22.8 mg/L).
Figure 8.
Mineralization effect of O3, O3/UV, and O3/PMS on SDZ (reaction conditions: pH = 6.8 ± 0.1, SDZ = 10 mg/L, O3 = 3 mg/L, T = 25 ± 0.5 °C, O3 = 3 mg/L, PMS = 22.8 mg/L).

Figure 9.
The effects of TBA and EtOH on the degradation of sulfadiazine by O3/PMS at different pH levels (reaction conditions: pH = 3, 6, 9, SDZ = 10 mg/L, O3 = 3 mg/L, T = 25 ± 0.5 °C, O3 = 3 mg/L, PMS = 22.8 mg/L, TBA = 14.8 mg/L, EtOH = 9.2 mg/L).
Figure 9.
The effects of TBA and EtOH on the degradation of sulfadiazine by O3/PMS at different pH levels (reaction conditions: pH = 3, 6, 9, SDZ = 10 mg/L, O3 = 3 mg/L, T = 25 ± 0.5 °C, O3 = 3 mg/L, PMS = 22.8 mg/L, TBA = 14.8 mg/L, EtOH = 9.2 mg/L).

Figure 10.
Three-dimensional fluorescence spectrum of SDZ water sample under river water quality conditions (reaction conditions: excitation light source, deuterium lamp; photomultiplier tube (PMT) voltage, 500 V; response time, 0.5 s; scanning speed, 2400 nm/min; excitation wavelength scanning range was 200–400 nm, step size was 2 nm; emission wavelength scanning range was 250–500 nm, step size 2 nm; slit width, 5 nm). (a) Raw water, (b) Treatment for 20 min, (c) Treatment for 60 min.


Figure 11.
Degradation effect of O3/PMS on SDZ in different water samples (reaction conditions: pH = 6.8 ± 0.1, SDZ = 10 mg/L, O3 = 3 mg/L, T = 25 ± 0.5 °C, O3 = 3 mg/L, PMS = 22.8 mg/L).
Figure 11.
Degradation effect of O3/PMS on SDZ in different water samples (reaction conditions: pH = 6.8 ± 0.1, SDZ = 10 mg/L, O3 = 3 mg/L, T = 25 ± 0.5 °C, O3 = 3 mg/L, PMS = 22.8 mg/L).


Table 1.
Water quality analysis results of the Yitong River.
| Water Quality Index | Value |
|---|---|
| COD (mg/L) | 38.81 |
| Total nitrogen (TN, mg/L) | 4.39 |
| NH4+-N (mg/L) | 1.73 |
| Total phosphorus (TP, mg/L) | 0.16 |
Table 2.
Pseudo-first-order rate constant of SDZ degradation by O3, O3/UV, and O3/PMS (reaction conditions: SDZ = 10 mg/L, O3 = 3 mg/L, T = 25 ± 0.5 °C, pH = 6.8 ± 0.1, O3/PMS (PMS = 22.8 mg/L), UV = 0.9 mw/cm2).
Table 2.
Pseudo-first-order rate constant of SDZ degradation by O3, O3/UV, and O3/PMS (reaction conditions: SDZ = 10 mg/L, O3 = 3 mg/L, T = 25 ± 0.5 °C, pH = 6.8 ± 0.1, O3/PMS (PMS = 22.8 mg/L), UV = 0.9 mw/cm2).
| Treatment Process | Kobs (min−1) | R2 |
|---|---|---|
| O3 | 0.1456 | 0.9599 |
| O3/UV | 0.193 | 0.7255 |
| O3/PMS | 0.2504 | 0.9326 |
Table 3.
Pseudo-first-order rate constants of O3, O3/UV, and O3/PMS under different initial mass concentrations of SDZ (reaction conditions: SDZ = 2, 4, 6, 8, 10 mg/L, O3 = 3 mg/L, T = 25 ± 0.5 °C, pH = 6.8 ± 0.1, O3/PMS (PMS = 22.8 mg/L), UV = 0.9 mw/cm2).
Table 3.
Pseudo-first-order rate constants of O3, O3/UV, and O3/PMS under different initial mass concentrations of SDZ (reaction conditions: SDZ = 2, 4, 6, 8, 10 mg/L, O3 = 3 mg/L, T = 25 ± 0.5 °C, pH = 6.8 ± 0.1, O3/PMS (PMS = 22.8 mg/L), UV = 0.9 mw/cm2).
| Treatment Process | Mass Concentration (mg/L) | Kobs (min−1) | R2 |
|---|---|---|---|
| O3 | 2 | 0.2814 | 0.9195 |
| 4 | 0.2228 | 0.8428 | |
| 6 | 0.2048 | 0.8731 | |
| 8 | 0.1261 | 0.9624 | |
| 10 | 0.1242 | 0.9556 | |
| O3/UV | 2 | 0.3872 | 0.9893 |
| 4 | 0.2303 | 0.8369 | |
| 6 | 0.1930 | 0.7255 | |
| 8 | 0.1625 | 0.9737 | |
| 10 | 0.1328 | 0.9203 | |
| O3/PMS | 2 | 0.5563 | 0.9935 |
| 4 | 0.3979 | 0.9793 | |
| 6 | 0.3551 | 0.8767 | |
| 8 | 0.3363 | 0.9802 | |
| 10 | 0.2497 | 0.9389 |
Table 4.
Pseudo-first-order rate constants of O3, O3/UV, and O3/PMS under different ozone dosage conditions (reaction conditions: SDZ = 10 mg/L, O3 = 3 mg/L, UV = 0.9 mw/cm2, T = 25 ± 0.5 °C, pH = 6.8 ± 0.1, O3 = 1, 2, 3, 4, 5, 6 mg/L; PMS = 22.8 mg/L).
Table 4.
Pseudo-first-order rate constants of O3, O3/UV, and O3/PMS under different ozone dosage conditions (reaction conditions: SDZ = 10 mg/L, O3 = 3 mg/L, UV = 0.9 mw/cm2, T = 25 ± 0.5 °C, pH = 6.8 ± 0.1, O3 = 1, 2, 3, 4, 5, 6 mg/L; PMS = 22.8 mg/L).
| Treatment Process | Mass Concentration (mg/L) | Kobs (min−1) | R2 |
|---|---|---|---|
| O3 | 1 | 0.0730 | 0.9821 |
| 2 | 0.0174 | 0.9975 | |
| 3 | 0.1456 | 0.9599 | |
| 4 | 0.1646 | 0.9666 | |
| 5 | 0.2019 | 0.9670 | |
| 6 | 0.2436 | 0.9716 | |
| O3/UV | 1 | 0.0241 | 0.9322 |
| 2 | 0.0447 | 0.9928 | |
| 3 | 0.1930 | 0.7255 | |
| 4 | 0.1946 | 0.8941 | |
| 5 | 0.2441 | 0.8802 | |
| 6 | 0.2613 | 0.9692 | |
| O3/PMS | 1 | 0.0098 | 0.9888 |
| 2 | 0.2359 | 0.8774 | |
| 3 | 0.2504 | 0.9326 | |
| 4 | 0.3025 | 0.9390 | |
| 5 | 0.3158 | 0.9649 | |
| 6 | 0.3408 | 0.8539 |
Table 5.
Pseudo-first-order rate constants of O3/PMS under different PMS dosing concentrations (reaction conditions: SDZ = 10 mg/L, O3 = 3 mg/L, T = 25 ± 0.5 °C, pH = 6.8 ± 0.1, PMS = 5.7, 11.4, 17.1, 22.8, 28.5, 34.2 mg/L).
Table 5.
Pseudo-first-order rate constants of O3/PMS under different PMS dosing concentrations (reaction conditions: SDZ = 10 mg/L, O3 = 3 mg/L, T = 25 ± 0.5 °C, pH = 6.8 ± 0.1, PMS = 5.7, 11.4, 17.1, 22.8, 28.5, 34.2 mg/L).
| Treatment Process | Mass Concentration (mg/L) | Kobs (min−1) | R2 |
|---|---|---|---|
| O3/PMS | 5 | 0.1790 | 0.9783 |
| 10 | 0.1851 | 0.9687 | |
| 15 | 0.1954 | 0.9743 | |
| 20 | 0.2570 | 0.8570 | |
| 25 | 0.2405 | 0.9502 | |
| 30 | 0.2408 | 0.9480 |
Table 6.
Pseudo-first-order rate constants of O3, O3/UV, and O3/PMS processes at different pH (reaction conditions: pH = 3, 5, 7, 9, 11, SDZ = 10 mg/L, O3 = 3 mg/L, T = 25 ± 0.5 °C, O3 = 3 mg/L, PMS = 22.8 mg/L, UV = 0.9 mw/cm2).
Table 6.
Pseudo-first-order rate constants of O3, O3/UV, and O3/PMS processes at different pH (reaction conditions: pH = 3, 5, 7, 9, 11, SDZ = 10 mg/L, O3 = 3 mg/L, T = 25 ± 0.5 °C, O3 = 3 mg/L, PMS = 22.8 mg/L, UV = 0.9 mw/cm2).
| Treatment Process | pH | Kobs (min−1) | R2 |
|---|---|---|---|
| O3 | 3 | 0.1320 | 0.9732 |
| 5 | 0.1366 | 0.9750 | |
| 7 | 0.1433 | 0.9873 | |
| 9 | 0.1903 | 0.9496 | |
| 11 | 0.2042 | 0.9719 | |
| O3/UV | 3 | 0.1051 | 0.9937 |
| 5 | 0.1401 | 0.9694 | |
| 7 | 0.1421 | 0.9305 | |
| 9 | 0.1531 | 0.9466 | |
| 11 | 0.1733 | 0.8975 | |
| O3/PMS | 3 | 0.2594 | 0.8776 |
| 5 | 0.2194 | 0.9654 | |
| 7 | 0.2074 | 0.9726 | |
| 9 | 0.3663 | 0.9947 | |
| 11 | 0.2486 | 0.7970 |
Publisher’s Note: MDPI stays neutral with regard to jurisdictional claims in published maps and institutional affiliations. |
© 2022 by the authors. Licensee MDPI, Basel, Switzerland. This article is an open access article distributed under the terms and conditions of the Creative Commons Attribution (CC BY) license (https://creativecommons.org/licenses/by/4.0/).
Share and Cite
MDPI and ACS Style
Lu, H.; Feng, W.; Li, Q. Degradation Efficiency Analysis of Sulfadiazine in Water by Ozone/Persulfate Advanced Oxidation Process. Water 2022, 14, 2476. https://doi.org/10.3390/w14162476
AMA Style
Lu H, Feng W, Li Q. Degradation Efficiency Analysis of Sulfadiazine in Water by Ozone/Persulfate Advanced Oxidation Process. Water. 2022; 14(16):2476. https://doi.org/10.3390/w14162476
Chicago/Turabian StyleLu, Hai, Weihao Feng, and Qingpo Li. 2022. "Degradation Efficiency Analysis of Sulfadiazine in Water by Ozone/Persulfate Advanced Oxidation Process" Water 14, no. 16: 2476. https://doi.org/10.3390/w14162476
Note that from the first issue of 2016, this journal uses article numbers instead of page numbers. See further details here.