Hot and cold marine extreme events in the Mediterranean over the period 1982-2021
 Amelie Simon1,2
  Sandra M. Plecha1,2
  Ana Russo1,2*
  Ana Teles-Machado1,3
  Markus G. Donat4,5 Pierre-Amael Auger6
  Ricardo M. Trigo1,2,7
- 1Instituto Dom Luiz (IDL) Campo Grande, Lisboa, Portugal
- 2Faculdade de Ciências, Universidade de Lisboa, Campo Grande Lisboa, Portugal
- 3Instituto Português do Mar e da Atmosfera (IPMA), Rua Alfredo Magalhães Ramalho, Lisboa, Portugal
- 4Barcelona Supercomputing Center (Centro Nacional de Supercomputación BSC-CNS), Barcelona, Spain
- 5Institució Catalana de Recerca i Estudis Avançats (ICREA), Pg. Lluís Companys 23, Barcelona, Spain
- 6Univ. Brest, Centre national de larecherche scientifique (CNRS), Institut de recherche pour le développement (IRD), Ifremer, Laboratoire d’Oce´ anographie Physique et Spatiale (LOPS), Institut Universitaire Européen de la Mer (IUEM), Brest, France, Brest, France
- 7Departamento de Meteorologia, Universidade Federal do Rio de Janeiro, Rio de Janeiro, Brazil
Marine temperature extremes are anomalous ocean temperature events, often persisting over several weeks or longer, with potential impacts on physical and ecological processes that often encompass socio-economic implications. In recent years, a considerable effort has been directed at the development of metrics allowing an objective characterization of both marine heatwaves (MHWs) and marine cold spells (MCSs). However, the majority of these metrics do not consider explicitly the spatial extent of the events. Here, we rank and evaluate the relative importance of marine temperature extreme events thanks to a metric, called activity, that combines the number of events, duration, intensity and spatial extent. According to this definition, in the Mediterranean basin between 1982 and 2021, summer 2018 experienced slightly more MHW activity than summer 2003, documented as an exceptional extreme event. Besides, MHW activities were higher in the last two decades while winter MCS activities were higher in the 1980s-1990s. The highest MHW activities occurred preferentially in the western Mediterranean while the strongest MCS activities took place preferentially in the eastern Mediterranean. Moreover, the duration, mean intensity, and activity of the three strongest MHWs are twice as high as those of the three strongest MCSs. The long-term tendency of extreme events activity shows an accelerated increase for summer MHWs (about +150°C.days.10⁶km²) and a linear decrease for winter MCSs in the Mediterranean (about -60°C.days.10⁶km²) over the last four decades.
Introduction
Marine temperature extreme events such as marine heatwaves (MHWs) and marine cold spells (MCSs) are periods of extremes (high and low, respectively) ocean temperatures that persist for days to months (Hobday et al., 2016; Schlegel et al., 2021). On average, over the satellite record, the frequency, intensity, duration, and spatial extent of MHWs have increased substantially globally (Frölicher et al., 2018; Oliver et al., 2018), while MCSs have decreased (Schlegel et al., 2017; Schlegel et al., 2021). Both MHWs and MCSs have pushed some marine organisms, fisheries and ecosystems beyond the limits of their resilience (MHWs: Smale et al., 2019; Oliver et al., 2021; MCSs: see review in Schlegel et al., 2021). Marine temperature extreme events impact the ocean circulation and vertical turbulence with potential implications for deep nutrient upwelling and surface primary productivity (Auger et al., 2014). Marine extreme events (MEEs) also have the potential to impact weather patterns over land, via teleconnections, promoting the occurrence of drought, heavy precipitation or heatwave events (Collins et al., 2019). However, ranking the importance of marine extreme events is still very challenging due to the multiplicity of their characteristics, making it difficult to statistically correlate it to physical and biological processes. Therefore, to evaluate the impact of MEEs, a coherent and comparable framework should be addressed, which integrates these different characteristics.
Previous studies have applied different approaches to assess extreme thermal stress in the marine environment by using a fixed (Selig et al., 2010; Sorte et al., 2010) or cumulative (Eakin et al., 2010; Galli et al., 2017) threshold. Global initiatives have suggested the definition of standard metrics similar to those used for the atmospheric counterpart (e.g. Expert Team on Climate Change Detection and Indices (ETCCDI1); Zhang et al., 2011). This initiative can be considered as an important contribution to the expansion of the application of the temperature extremes metrics to the marine environment. Hobday et al. (2016) proposed a definition to objectively quantify a MHW as a discrete prolonged anomalously warm water event in a particular location with a seasonal varying threshold. The set of proposed metrics allows the analysis of MHWs in terms of their duration, intensity and cumulative intensity, among other aspects. Hobday et al. (2018) provided a refined definition that categorizes the severity of MHWs allowing the identification of the most extreme events based on multiple thresholds. Schlegel et al. (2017) ranked the top three MHWs and MCSs off the South African coast based on the cumulative intensity at different discrete localizations. However, one of the caveats of these previous studies is that the characterization is specific to individual grid point locations and none of the definitions takes into account the spatial extension of MEEs. Gupta et al. (2020) identified the most extreme events over the entire globe considering the spatial extent but not explicitly. The authors incorporated the spatial dimension by manually selecting regions that contained semi-contiguous areas of the largest cumulative intensity MHW occurring simultaneously. This method, however, can not be automatically applied within a comparable framework. To identify spatially coherent independent events along a north-south oriented coastal region, Pietri et al. (2021) assumed that two MHW events could be considered as the same event when separated by less than 200 km in latitude. Darmaraki et al. (2019b) identified summer MHW based on a criterion that at least 20% of the Mediterranean surface was experiencing such an event, aggregating grid points that are “activated” in a MHW state every day but are not necessarily contiguous. They also introduced the severity of an event (same name but different implications from the severity categorization of Hobday et al., 2018) being the spatiotemporal sum of the cumulative intensity of events when spreading on at least 20% of the Mediterranean. However, they did not consider the cumulative impact of small spatial events, nor investigated extreme cold events. These methods can inform on the spatial extent of an independent event but do not allow a systematic comparison of the physical importance of marine extreme events in any domain. Here we adapt the work of Darmaraki et al. (2019b), presenting a general methodology for any region to rank all aggregated marine extreme events, which allows for a systematic comparison of their physical importance.
The 2003 summer MHW which affected the Mediterranean was one of the firstly identified events. It is commonly referred to as a notable event (Grazzini and Viterbo, 2003; Darmaraki et al., 2019a; Gupta et al., 2020) and a strong event according to the severity classification of Hobday et al. (2018). This event led to ecosystem mass mortality of marine species in the northwest Mediterranean (Schiaparelli et al., 2007; Garrabou et al., 2009; Marbà and Duarte, 2010). It has been shown that this anomalous ocean warming was driven by atmospheric forcing preliminary through weak winds speed leading to (i) a shallow mixed-layer depth and (ii) low latent heat loss from the ocean and, to a lesser extent, through intermittent advection of warm air (Sparnocchia et al., 2006; Olita et al., 2007; Twardosz et al., 2021a). This MHW has amplified the summer 2003 European atmospheric heat wave, with coastal areas of western Mediterranean suffering continuous above-average temperatures between June and August 2003 (Feudale and Shukla, 2007; García-Herrera et al., 2010). Apart from the exceptional 2003 event, other recent notable events in the Mediterranean have been identified either in the eastern or western basins. Less severe events were reported in the western Mediterranean in autumn 1999, summer 2006 and autumn 2008 (Bensoussan et al., 2010; Huete-Stauffer et al., 2011; Hobday et al., 2018). Ibrahim et al. (2021) found in the spring 2020 the discrete eastern Mediterranean MHW with the highest anomalous mean intensity of 6.35°C in the Levantine Sea (at a specific location, without taking into account the spatial extent). By manually taking into account the spatial extent of the events from 1982 to 2017, Gupta et al. (2020) detected, in addition to summer 2003 MHW, the summer 2015 as a remarkable MHW in the eastern Mediterranean. Therefore, in general, MHWs may concern one or both Mediterranean basins. For the same period, Darmaraki et al. (2019a) also concluded that the two most severe summer MHWs took place in 2003 and 2015 followed by summer 2012. They found that for each of these three observed events, the maximum spatial coverage was about 90% of the Mediterranean but with no information on detailed spatial distribution. We are not aware of other studies using a common framework including the recent years 2018-2021 and with a distinction between Mediterranean basins.
Contrasting with MHWs, MCSs have received less attention in the Mediterranean sea. Rohling et al. (1998), by using paleo-records, suggest that cold air outbreaks led to abrupt MCSs in the western Mediterranean during Heinrich events. Schlegel et al. (2021) were the first to quantify and report on MCS occurrence and trends in a global context. They show that the frequency and intensity declined globally over the last four decades, with no exception in the Mediterranean Sea. MCSs often result from wind-driven sensible and latent heat loss, vertical mixing and coastal upwelling (Schlegel et al., 2021), for example in association with the cold and dry winds blowing in winter over the Mediterranean (Herrmann et al., 2008). MCSs likely drive unusual deep nutrient loads in the surface potentially promoting primary productivity (Auger et al., 2014). To the best of our knowledge, no studies have been published ranking MCSs over the last four decades in the Mediterranean.
In this paper, we use a common framework to identify the most active summer hot and winter cold marine extreme events, including their spatial extent, for the basin-wide Mediterranean and the western and eastern Mediterranean basins during the period 1982-2021.
Data & methodology
The methodology to evaluate marine temperature extreme event’s physical importance within a predefined domain and predefined time range (such as a season, a month, etc.) is provided in three steps: (i) detection of events, (ii) calculation of the activity metric within the time range for each year and each grid point location of the domain, (iii) ranking according to the total activity (sum of the activity of each grid point over the domain).
First, daily sea-surface temperature (SST) from NOAA OISSTV2 (Reynolds et al., 2007; Huang et al., 2020) from 1st January 1982 to 23rd November 2021 at a regular resolution of 0.25°x0.25° (1440x720 number of cells) was used to detect MEEs. Both MHWs and MCSs in the Mediterranean over the period 1982-2021 were identified following the approach from Hobday et al. (2016). We commonly define a MEE for which in a location (grid point) the daily SST exceeds (for MHWs) or falls below (for MCSs) a certain threshold for at least five consecutive days. An event is considered to be the same when two events occur within less than 2 days’ interval. The threshold is chosen to be the commonly used 90th percentile for MHWs and the 10th percentile for MCSs of the daily SST observed over the period 1982-2021. Detected extremes events are characterized by their occurrence, duration and mean intensity, among other commonly used properties (Hobday et al., 2016).
Then, to assess extreme events of specific time ranges of a year, we define for each grid point the extreme events activity (in °C.days.km²) as follows:
Time Range, is a period of the year (for example, first of June to end of September), the range being the same for all years;
EE ∈ time range, is an extreme event that occurs within the time range
mean intensityEE, is the mean temperature anomaly, w.r.t. the threshold, during the EE, in °C (as defined in Hobday et al., 2016);
durationEE∩time range, is the portion of the total duration of the EE that remains within the considered time range, in days;
areaEE, is the area affected by the discrete EE, in km2.
The activity is calculated for a time range (e.g., season, month) and for each grid point of a domain and it is defined as the sum of all the events occurring within the time range, of the product of each event’s characteristics (i.e., mean intensity, proportion of duration and the affected area). For this metric, if a MEE starts before and/or finishes after the time range, the accounted activity will refer only to the fraction occurring within the time range. The mean intensity of the entire event is used in the calculation of the activity, whether the event takes place entirely within the considered time range or not. One should note that more than one extreme event per cell can happen during the time range. This activity metric is in line with the severity metric proposed by Darmaraki et al. (2019b). The major difference to Darmaraki et al. (2019b) is that we take into account every event, whether the daily spatial extent of MHWs in the Mediterranean exceeds 20% or not. This modification allows for a generalized approach on any domain.
In this study, the time range chosen to evaluate MHW activity comprises the summer months from 1st of June to 30th of September (JJAS), as MHWs tend to occur in the calendar summer (Darmaraki et al., 2019b; Gupta et al., 2020). We would like to emphasize that this metric can be used for any other season and for smaller or longer time ranges. The same procedure is applied for MCSs from 1st of December of the year n-1 to 31th of March of the year n (DJFM). December 1981 is not taken into account and therefore, the year 1982 only considers the sum of January to March 1982. Afterwards, we rank the yearly total activity (from the largest to the smallest), based on the proposed activity coefficient.
This study will focus on three different regions: (i) the whole Mediterranean basin, (ii) the western Mediterranean limited west of Italy and (iii) the eastern Mediterranean limited east of Italy, following the separation given by the World Ocean Atlas 2018 (Boyer et al., 2018). The separation between west and east is based on the local bathymetry and is defined by the inclined black line in Figure 1 (located in the middle of the Mediterranean, linking northern Africa and Sicily).
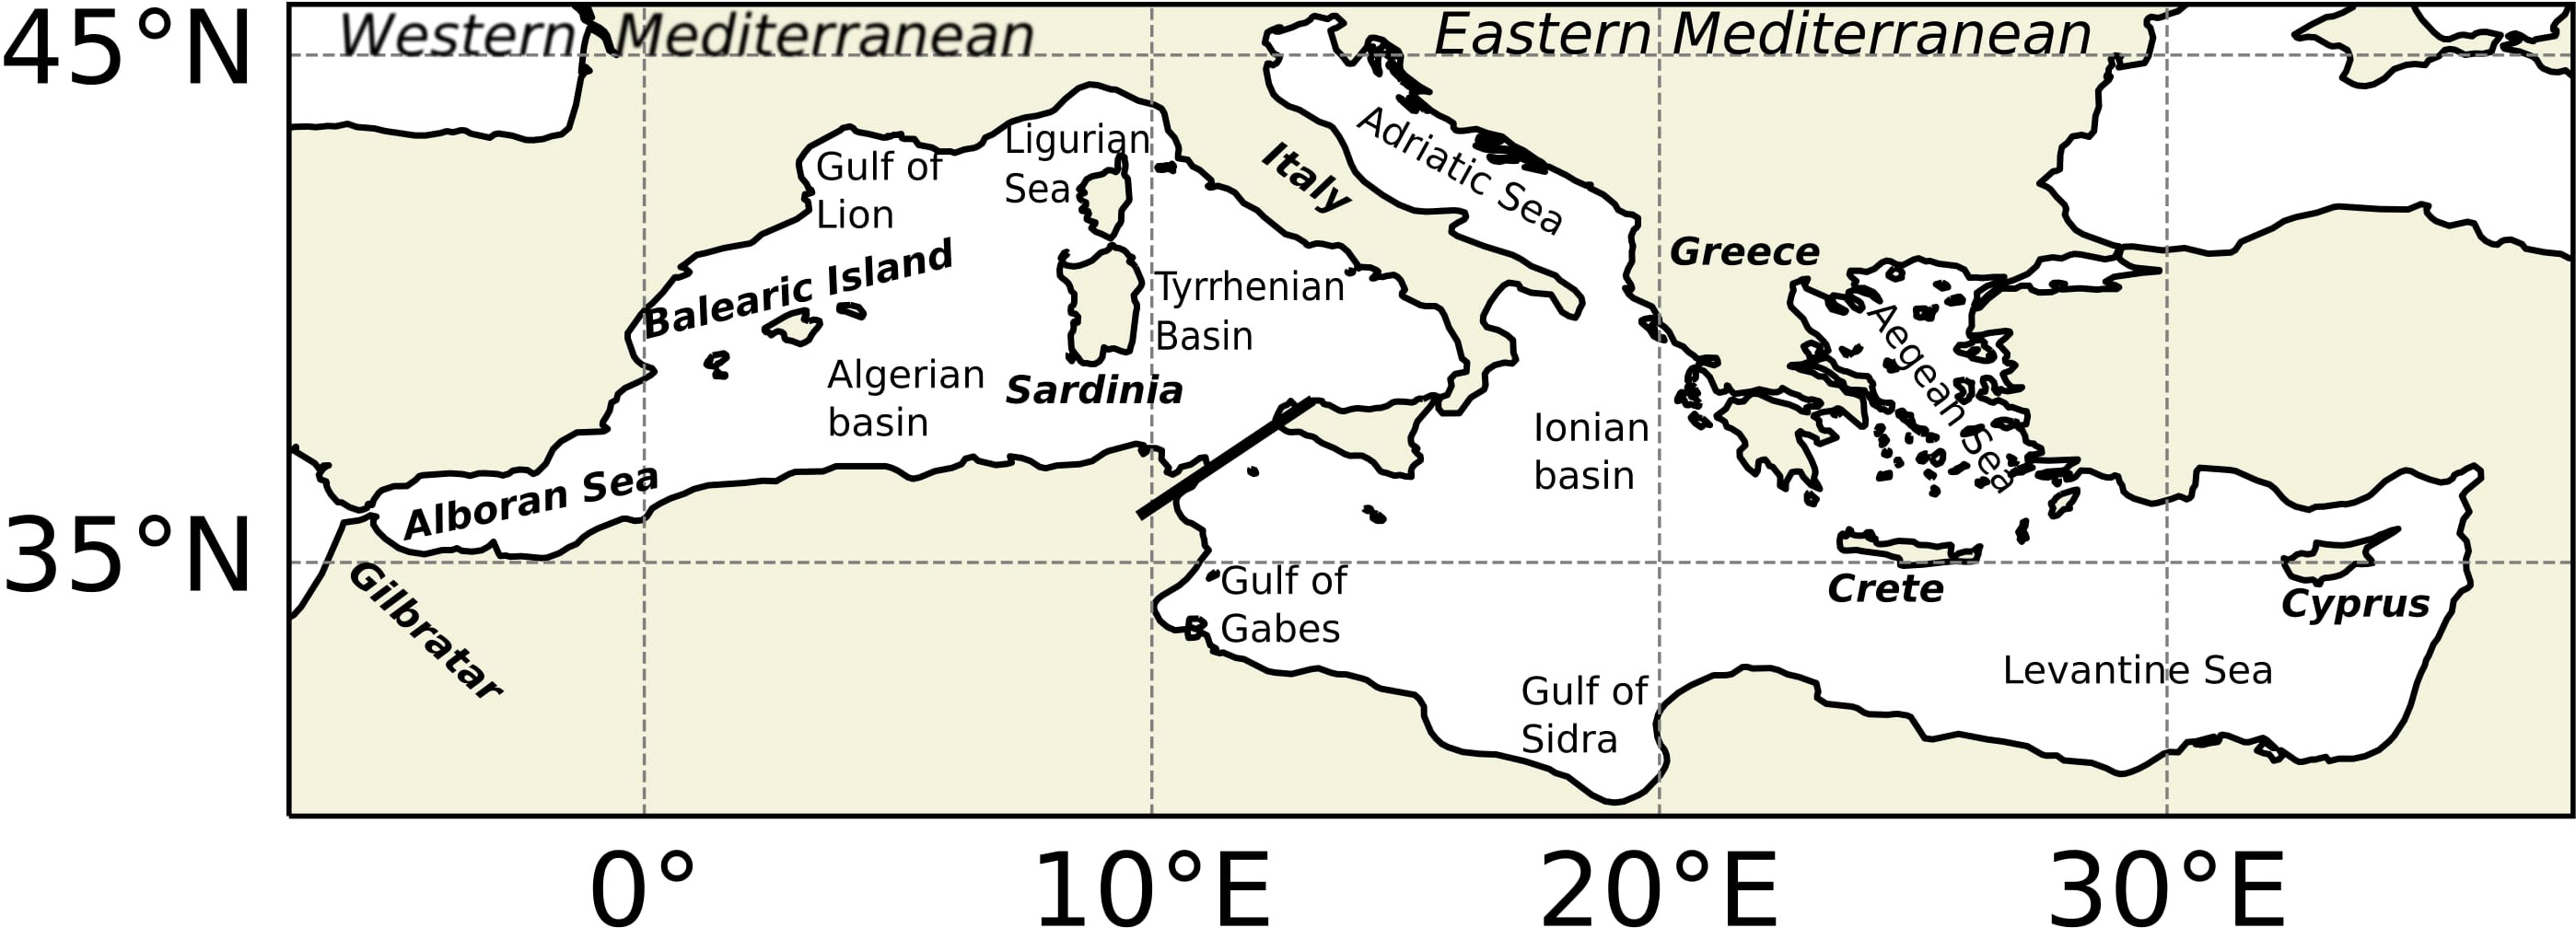
Figure 1 Map of the Mediterranean basin. The thick black line represents the separation between western and eastern Mediterranean basins.
Results
The properties of MHWs and MCSs between 1982 and 2021, such as the total number of events, average duration and average intensity (corresponding to the average of the mean intensity), over the Mediterranean Sea are shown in Figure 2. For both extreme hot and cold events, the number of events and intensity decreases southward. The Gulf of Lion and the Adriatic (northern Mediterranean) indeed present the highest number of events and the most intense ones. Regarding duration, the longest events occur in the Levantine Sea and between the Balearic Island and Sardinia. In general, events are shorter where they are more frequent, and longer where they are less frequent. Those results are in good accordance with Darmaraki et al. (2019a). These qualitative features are similar when looking at only summer (JJAS) MHWs and winter (DJFM) MCSs for the whole period, except that the intensity for the winter MCSs in the Gulf of Lion approaches zero (Figure S1). The annual MHWs last longer than the annual MCSs (about 3 days more) and the mean (absolute) intensity is higher for MHWs than for MCSs in the northwest Mediterranean (about 0.4°C).
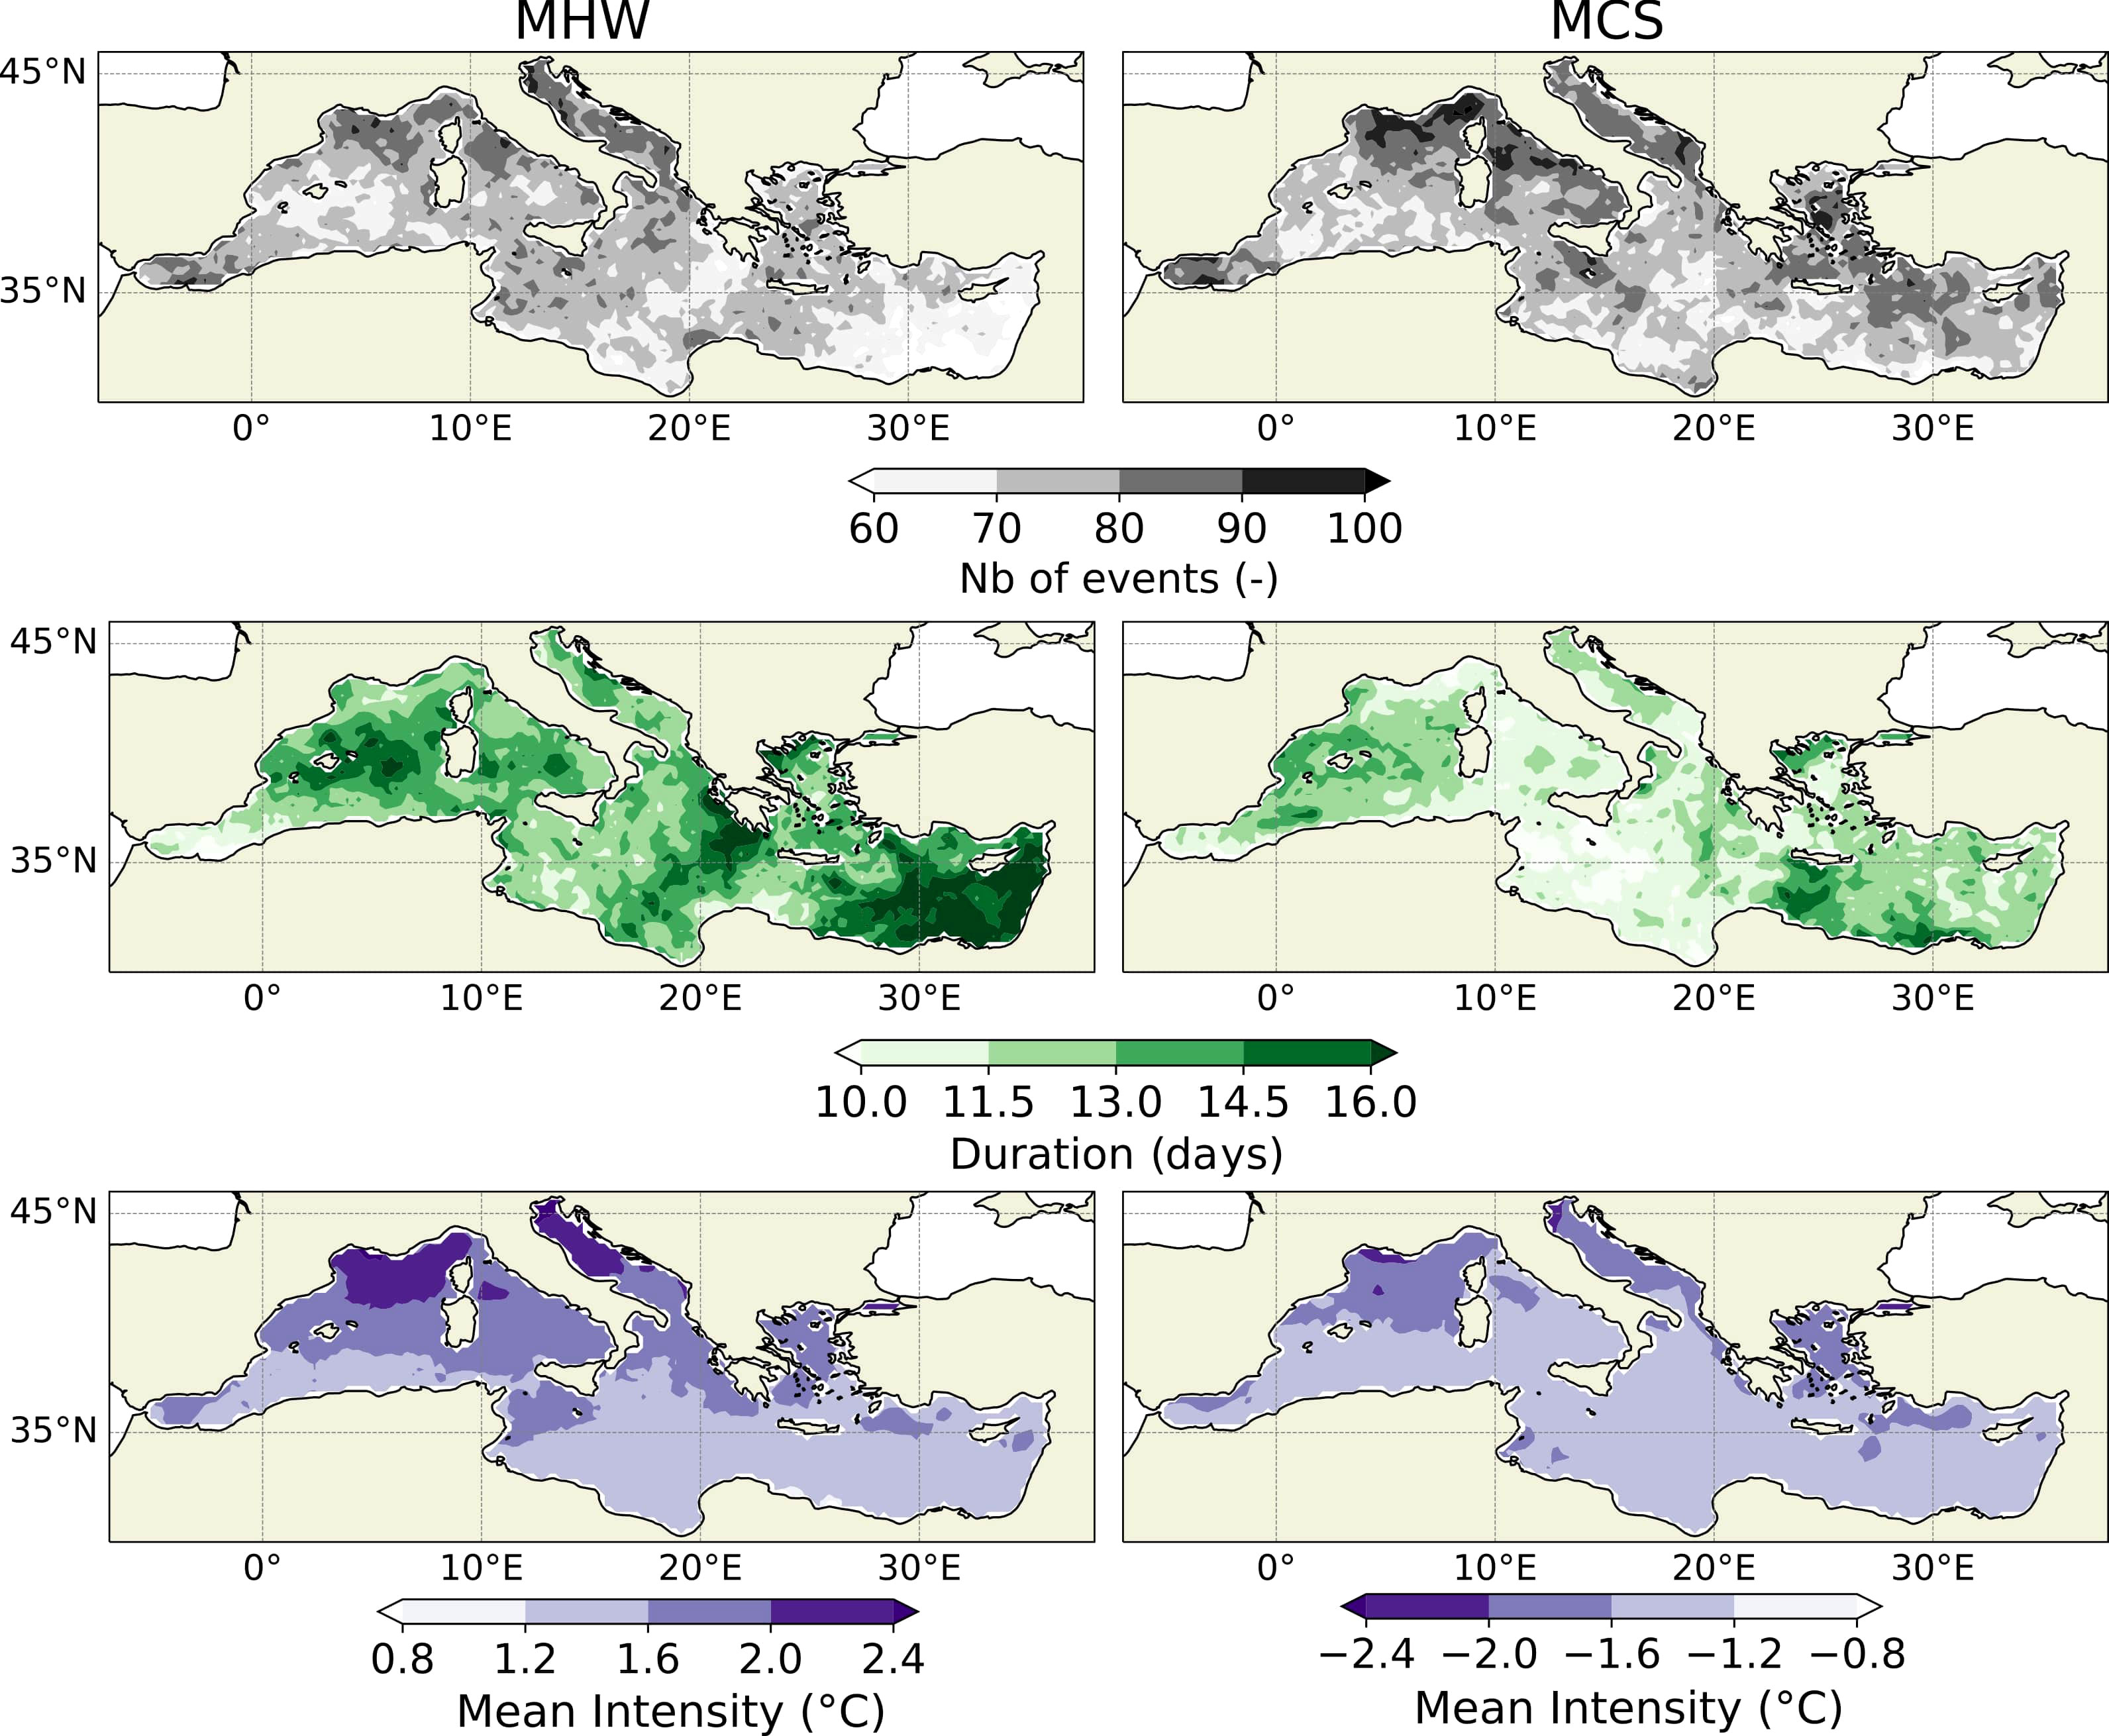
Figure 2 Number of events (top), average duration (middle; in days) and average intensity (bottom; °C) for all detected MHWs (left) and MCSs (right) within the period 1982-2021 in the Mediterranean.
The marine summer events were ranked according to the highest MHW total activity, as defined in this paper, for the Mediterranean basin (Table S5 for the top 30 list). The most active summer is 2018, followed by 2003 and 2015 and the spatial distribution of their activity is shown in Figure 3 (bottom panels). The following years that make it to the top 9 ranking, are the following summers 2017, 2019, 2012, 2020, 2021, 2006 (Figure S2), highlighting the fact that the last two decades have been very productive in MHWs. In particular, the last five years, i.e. 2017-2021 are all included in the top 8 ranks.
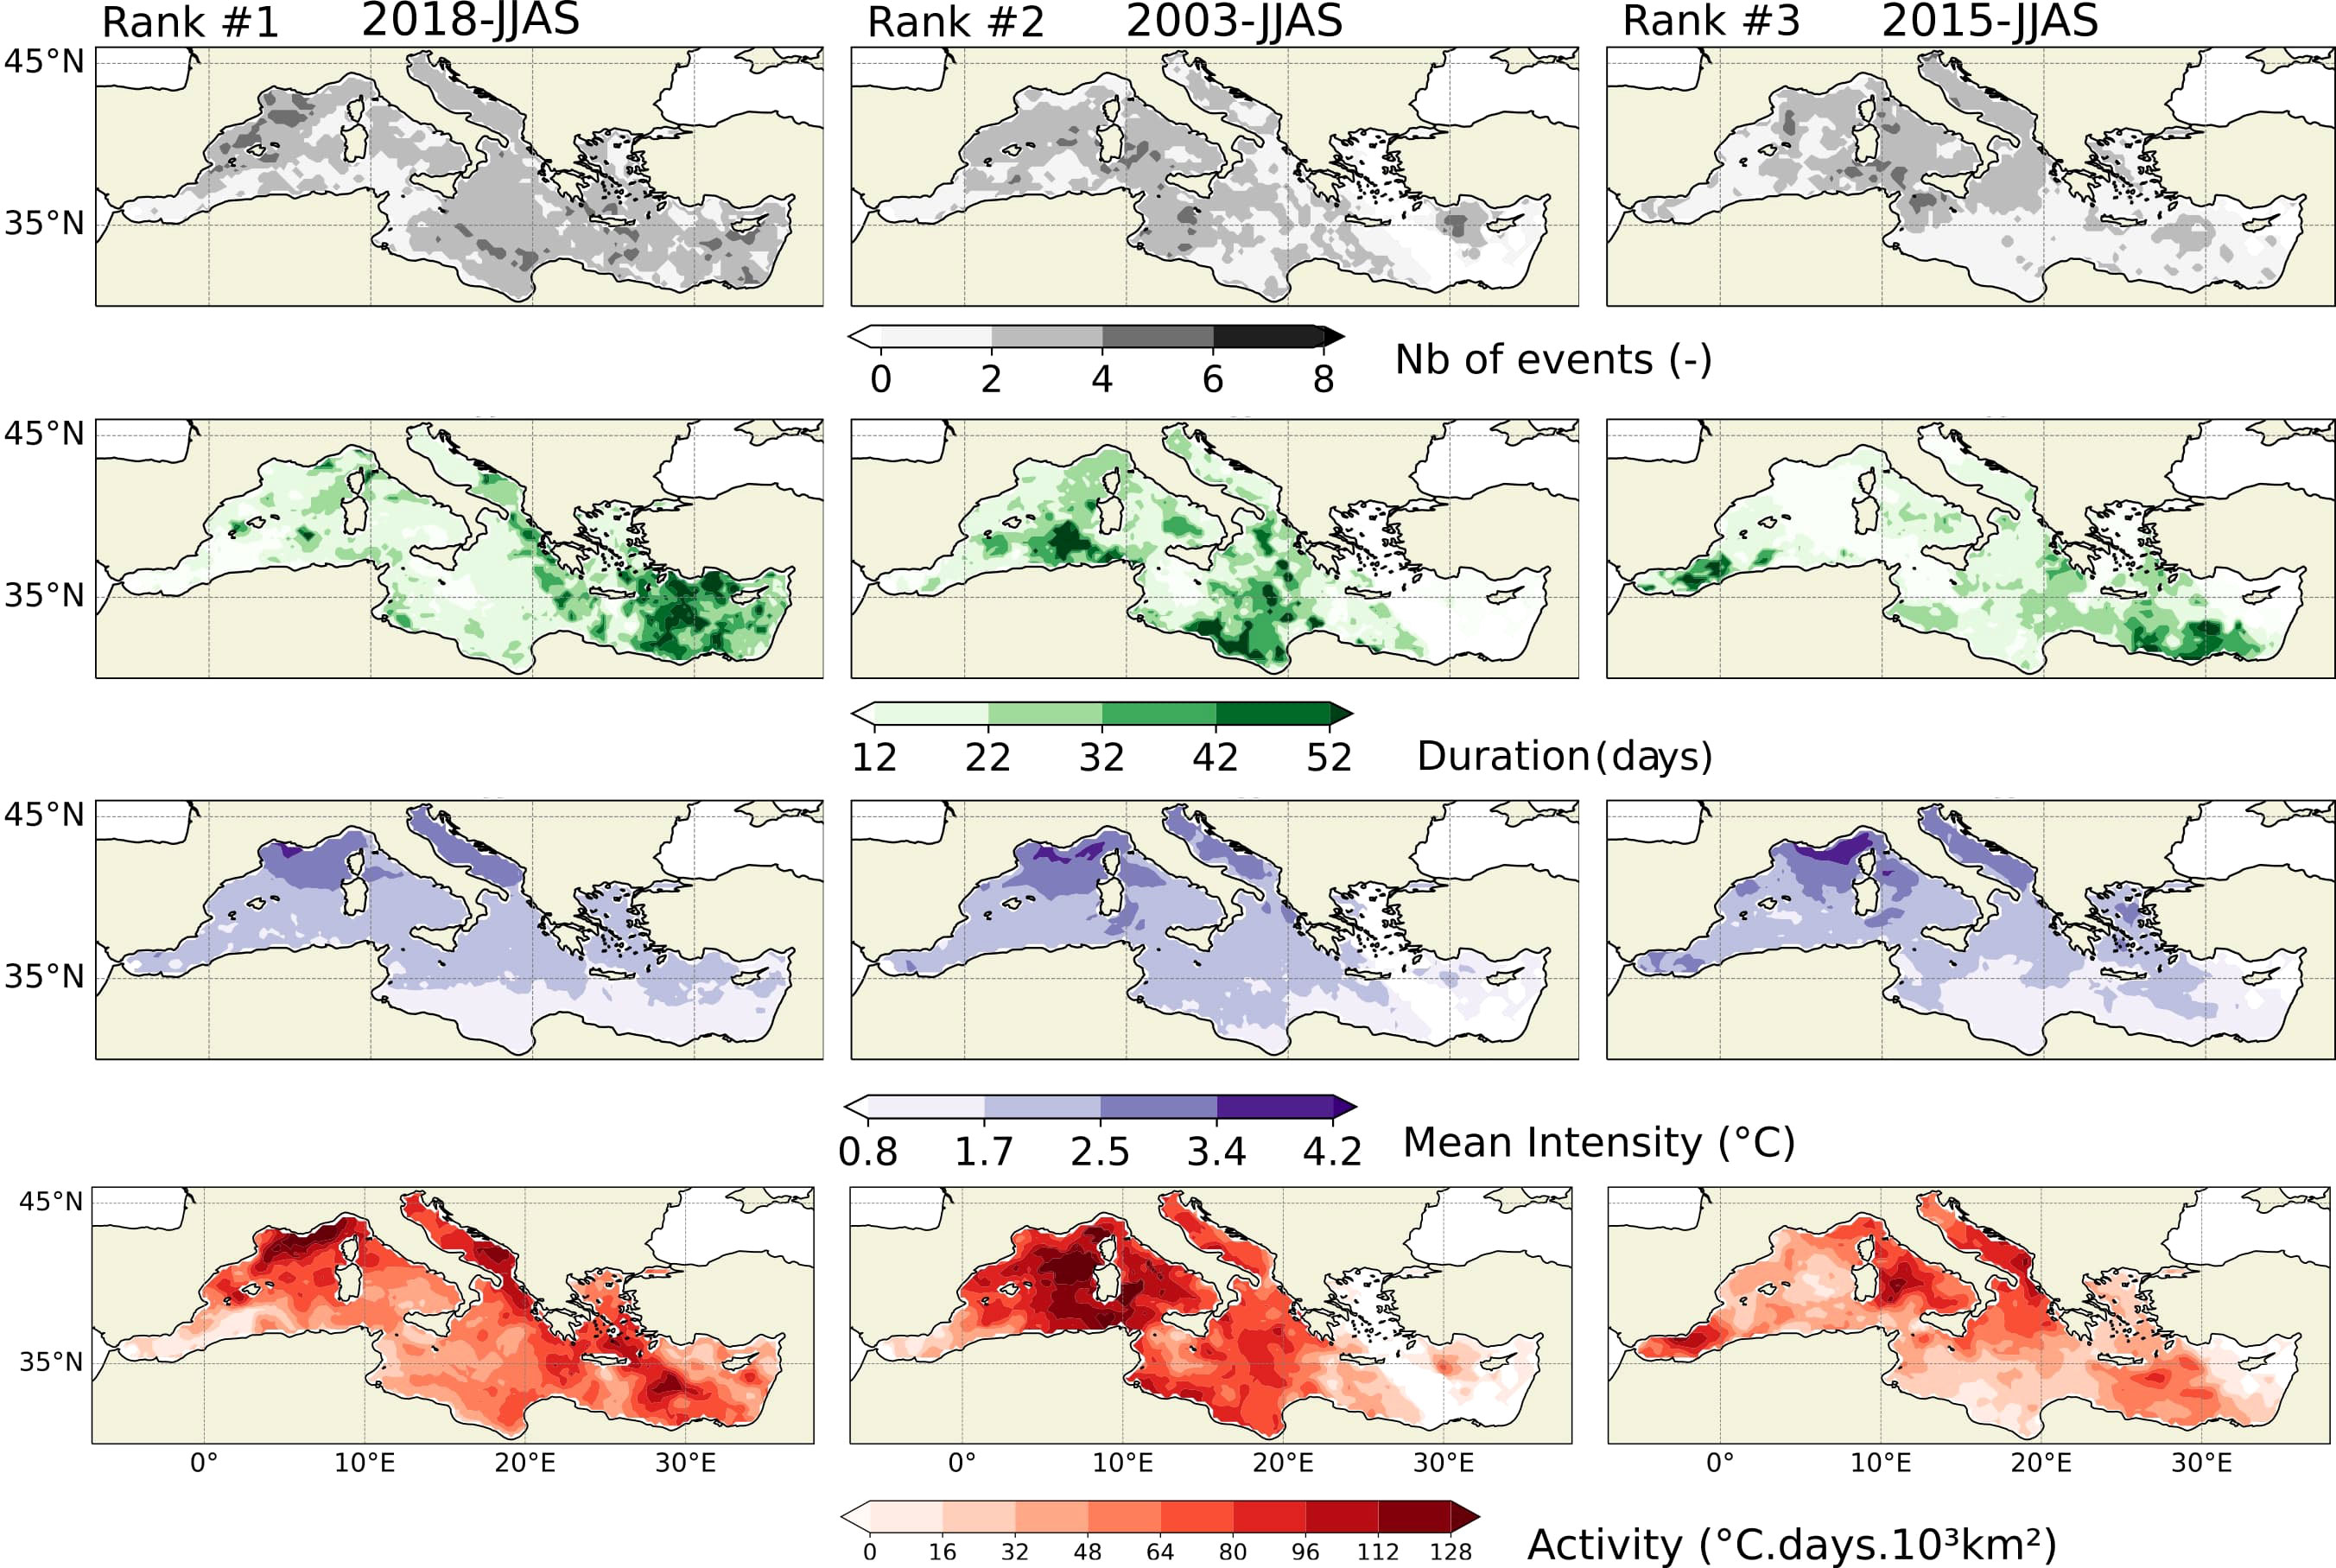
Figure 3 Number of events (first row), average duration (second row; in days), average intensity (third row; °C) and activity (fourth row; °C x days x 10³ km²) for the three summers (JJAS) having the highest MHW total activity in the Mediterranean (from left to right).
The full characterization of the MHWs for the top three summers (2018, 2003 and 2015) in terms of number of events, duration, mean intensity and activity is shown in Figure 3. For the three summers, MHW intensity was the strongest in the Gulf of Lion (about 4°C) and the weakest in the Levantine Sea (about 1°C). In the particular case of the summer 2018, the affected area and the reached intensity were remarkable. A prevalence of about 3 events is found for the entire basin, except along the southern Mediterranean coast west of the Gulf of Gabes where only one event was recorded. During summer 2018, broad warming events covering the whole Mediterranean were thus observed, with maximum activity located in the Gulf of Lion in the western basin, southern Adriatic sea and between Cyprus and Crete in the eastern basin. The longest events occurred in the Levantine basin, lasting ~50 days. Despite being often referenced in the literature, the year 2003 is only ranked 2nd when considering the whole Mediterranean because MHW events during summer 2003 mostly affected the western basin. Maximum activity concentrated between the Balearic Islands and Sardinia while no event was recorded at the tip of the eastern basin in the Levantine Sea. The longest events were notably recorded in the Gulf of Sidra and the southwestern Algerian basin. Both summers 2003 and 2015, show more events in the western than in the eastern Mediterranean. As in 2018, the MHW activity in summer 2015 was spread over most of the Mediterranean basin but with two maxima located in the Alboran Sea and northern Mediterranean, around Italy. The longest events were indeed recorded in the Levantine basin and compensated for a low number of events regarding MHW activity.
When performing the ranking for the western Mediterranean basin separately (Figure S3), the summers with the largest MHWs total activity are 2003, 2018 and 2015; thus while maintaining the same three summers, their order is swapped for the first two positions when compared to the ranking for the whole Mediterranean. Summer 2003 was highly active all over the western basin except in the Alboran Sea, while strong MHW activities were confined between the Gulf of Lion and Ligurian Sea during summer 2018. Contrasting with the summers of 2003 and 2018, the summer of 2015 noticeably experienced strong MHWs in the Alboran Sea. It also presented high MHW activities in the Tyrrhenian basin, west of Sardinia. The following summers in the ranking are then 2017, 2020, 2019, 2006, 2012, 2021 (Figure S3 and Table S5 for the top 30).
By considering only the eastern Mediterranean basin, the ranking is similar to the ranking established for the whole Mediterranean, dominated again by the summers 2018, 2003 and 2015 (Figure S4). Summers 2018 and 2015 experienced high MHWs activities from the Adriatic Sea to the Levantine Sea, unlike summer 2003 when MHWs occurred in the Ionian Basin. The following summers in the ranking are then: 2012, 2019, 2017, 2021, 2020, 2016 (Figure S4 and Table S5 for the top 30). The maximum MHW activity for the top three events over the western Mediterranean (Figure S3) doubles the maximum activity of the top three events over the eastern Mediterranean (Figure S4).
Marine cold spells were also identified and characterized for the Mediterranean basin (Figure 4) where the top three most active winters were 1992, followed by 1984 and 1983. The following winters in the ranking are 1987, 1993, 1989, 1996, 1999, 1995 (Figure S6). In contrast to what happened in the case of MHWs, the top MCSs were mostly prevalent in the 1980s and 1990s (first half of the study period). The winter 1992 shows a cooling pattern more pronounced over the eastern Mediterranean with a maximum north of the Ionian basin, while in the winter of 1984 it is more localized south of the Ionian basin. Conversely, the MCS activity in the winter of 1983 is mostly located in the Aegean-Levantine Seas. Overall, the MCS activity is about half of what was recorded for the MHWs.
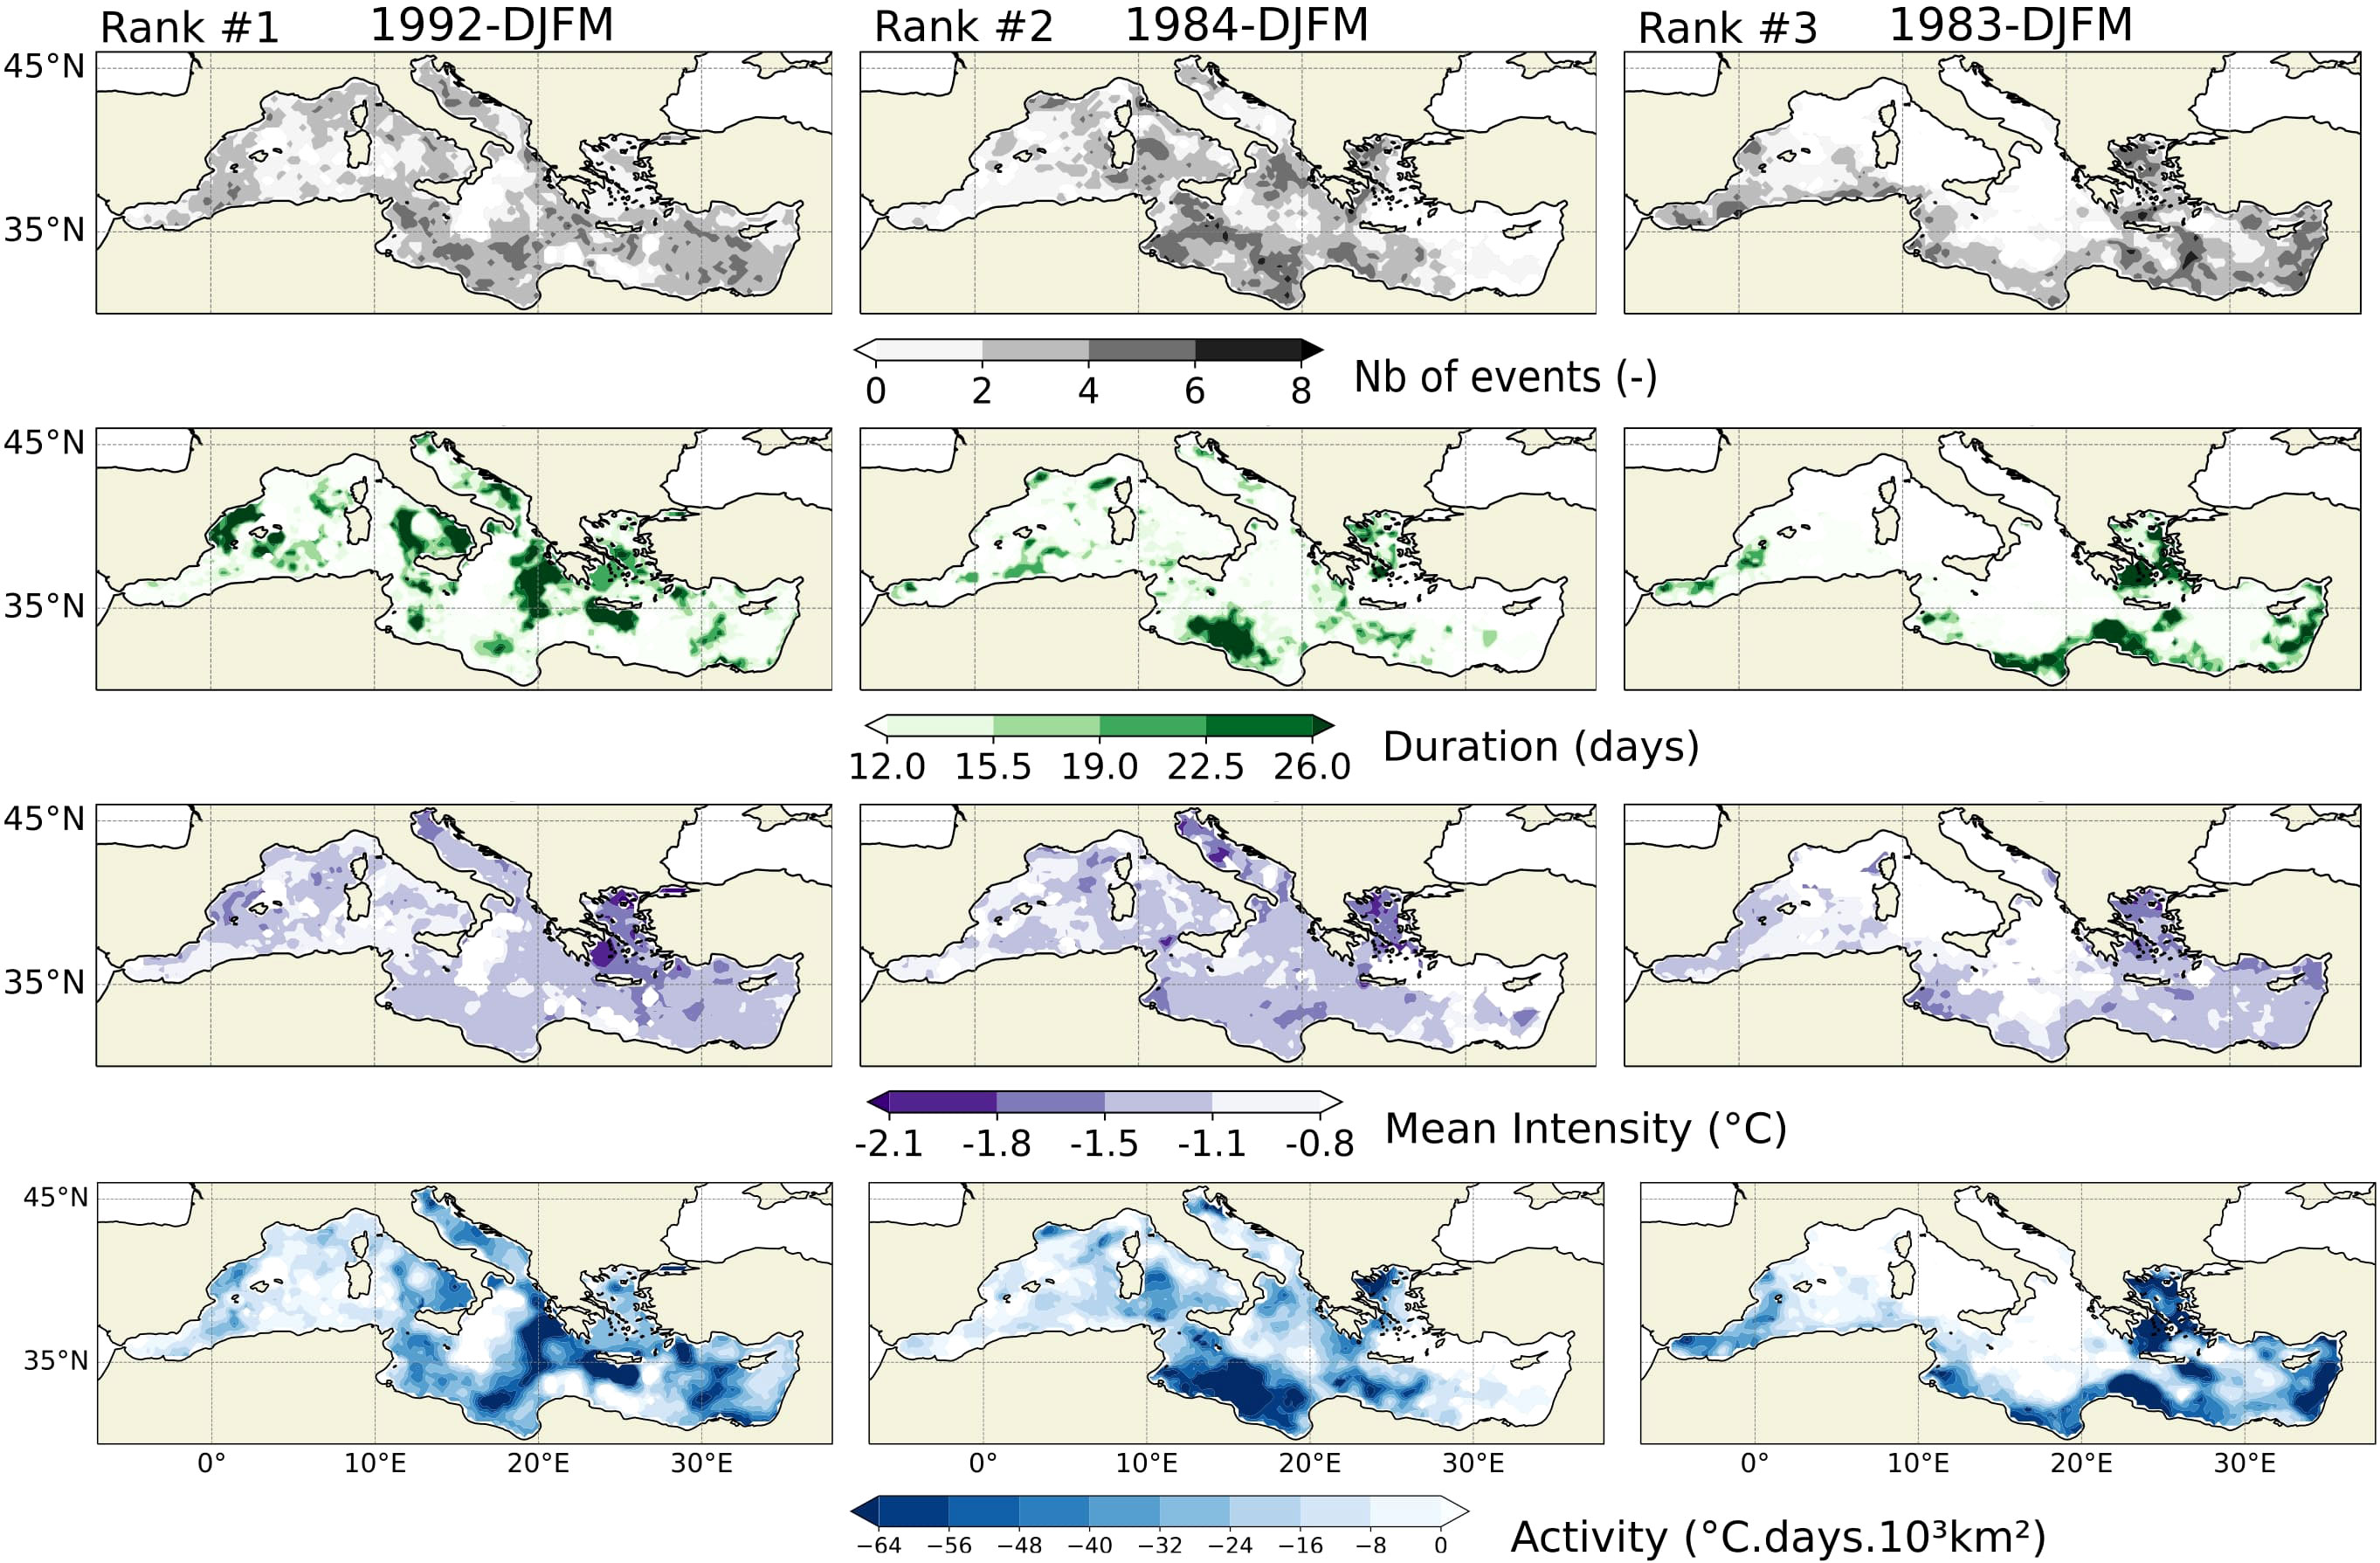
Figure 4 Same as Figure 3 but for MCSs in winter (DJFM). Negative values of activity traduce strong MCSs.
As done for the top three MHWs (Figure 3), the corresponding assessment for the MCSs for the top three winters (1992, 1984 and 1983) in the Mediterranean, is provided in terms of number of events, average duration and average intensity (Figure 4). The year 1992 shows about 3 events all over the basin except in the Algerian Basin and south of Italy, where there was no MCS. The longest events occurred in patchy localization, but mostly near the coasts of Spain, southern Italy and Greece. The winter of 1984 shows numerous events in the Central Mediterranean, lasting longer between the Gulf of Gabes and the Gulf of Sidra, whereas the winter 1983 is characterized by long and numerous MCSs along the southern and eastern coasts. All three listed winters have the strongest mean intensities in the Aegean basin (about -1.8 °C). The range of duration and mean intensity is twice smaller than for MHWs (in Figure 3).
Time series of MHW properties in summer and MCS properties in winter (Figure 5) with an associated quadratic fit are displayed for the Mediterranean, western Mediterranean and eastern Mediterranean. The number of MHWs in summer increased rapidly and non-linearly for the three regions (doubling during the last four decades) while it diminishes linearly for MCSs in winter. Over the considered 40 years period, MHWs tend to last longer (about +8 days) when compared to the beginning of the period, especially in the eastern Mediterranean. Likewise, MCSs have become shorter (about 4 days less). Interestingly, the spatially averaged intensity for MHWs in the whole Mediterranean only weakly increases (from 1.8 °C to 1.9 °C). However, this hides regional contrast: it increases in the western Mediterranean (from 1.8 °C to 2.2 °C) and weakly decreases in the eastern Mediterranean (from 1.8 °C to 1.7 °C). The mean intensity of MCSs in winter is about -1.3 °C during the whole period for the 3 regions, except for winter 2021. During this year, a very localized intense MCS occurred in the northwest Adriatic sea, with a mean intensity of about -2 °C (not shown).
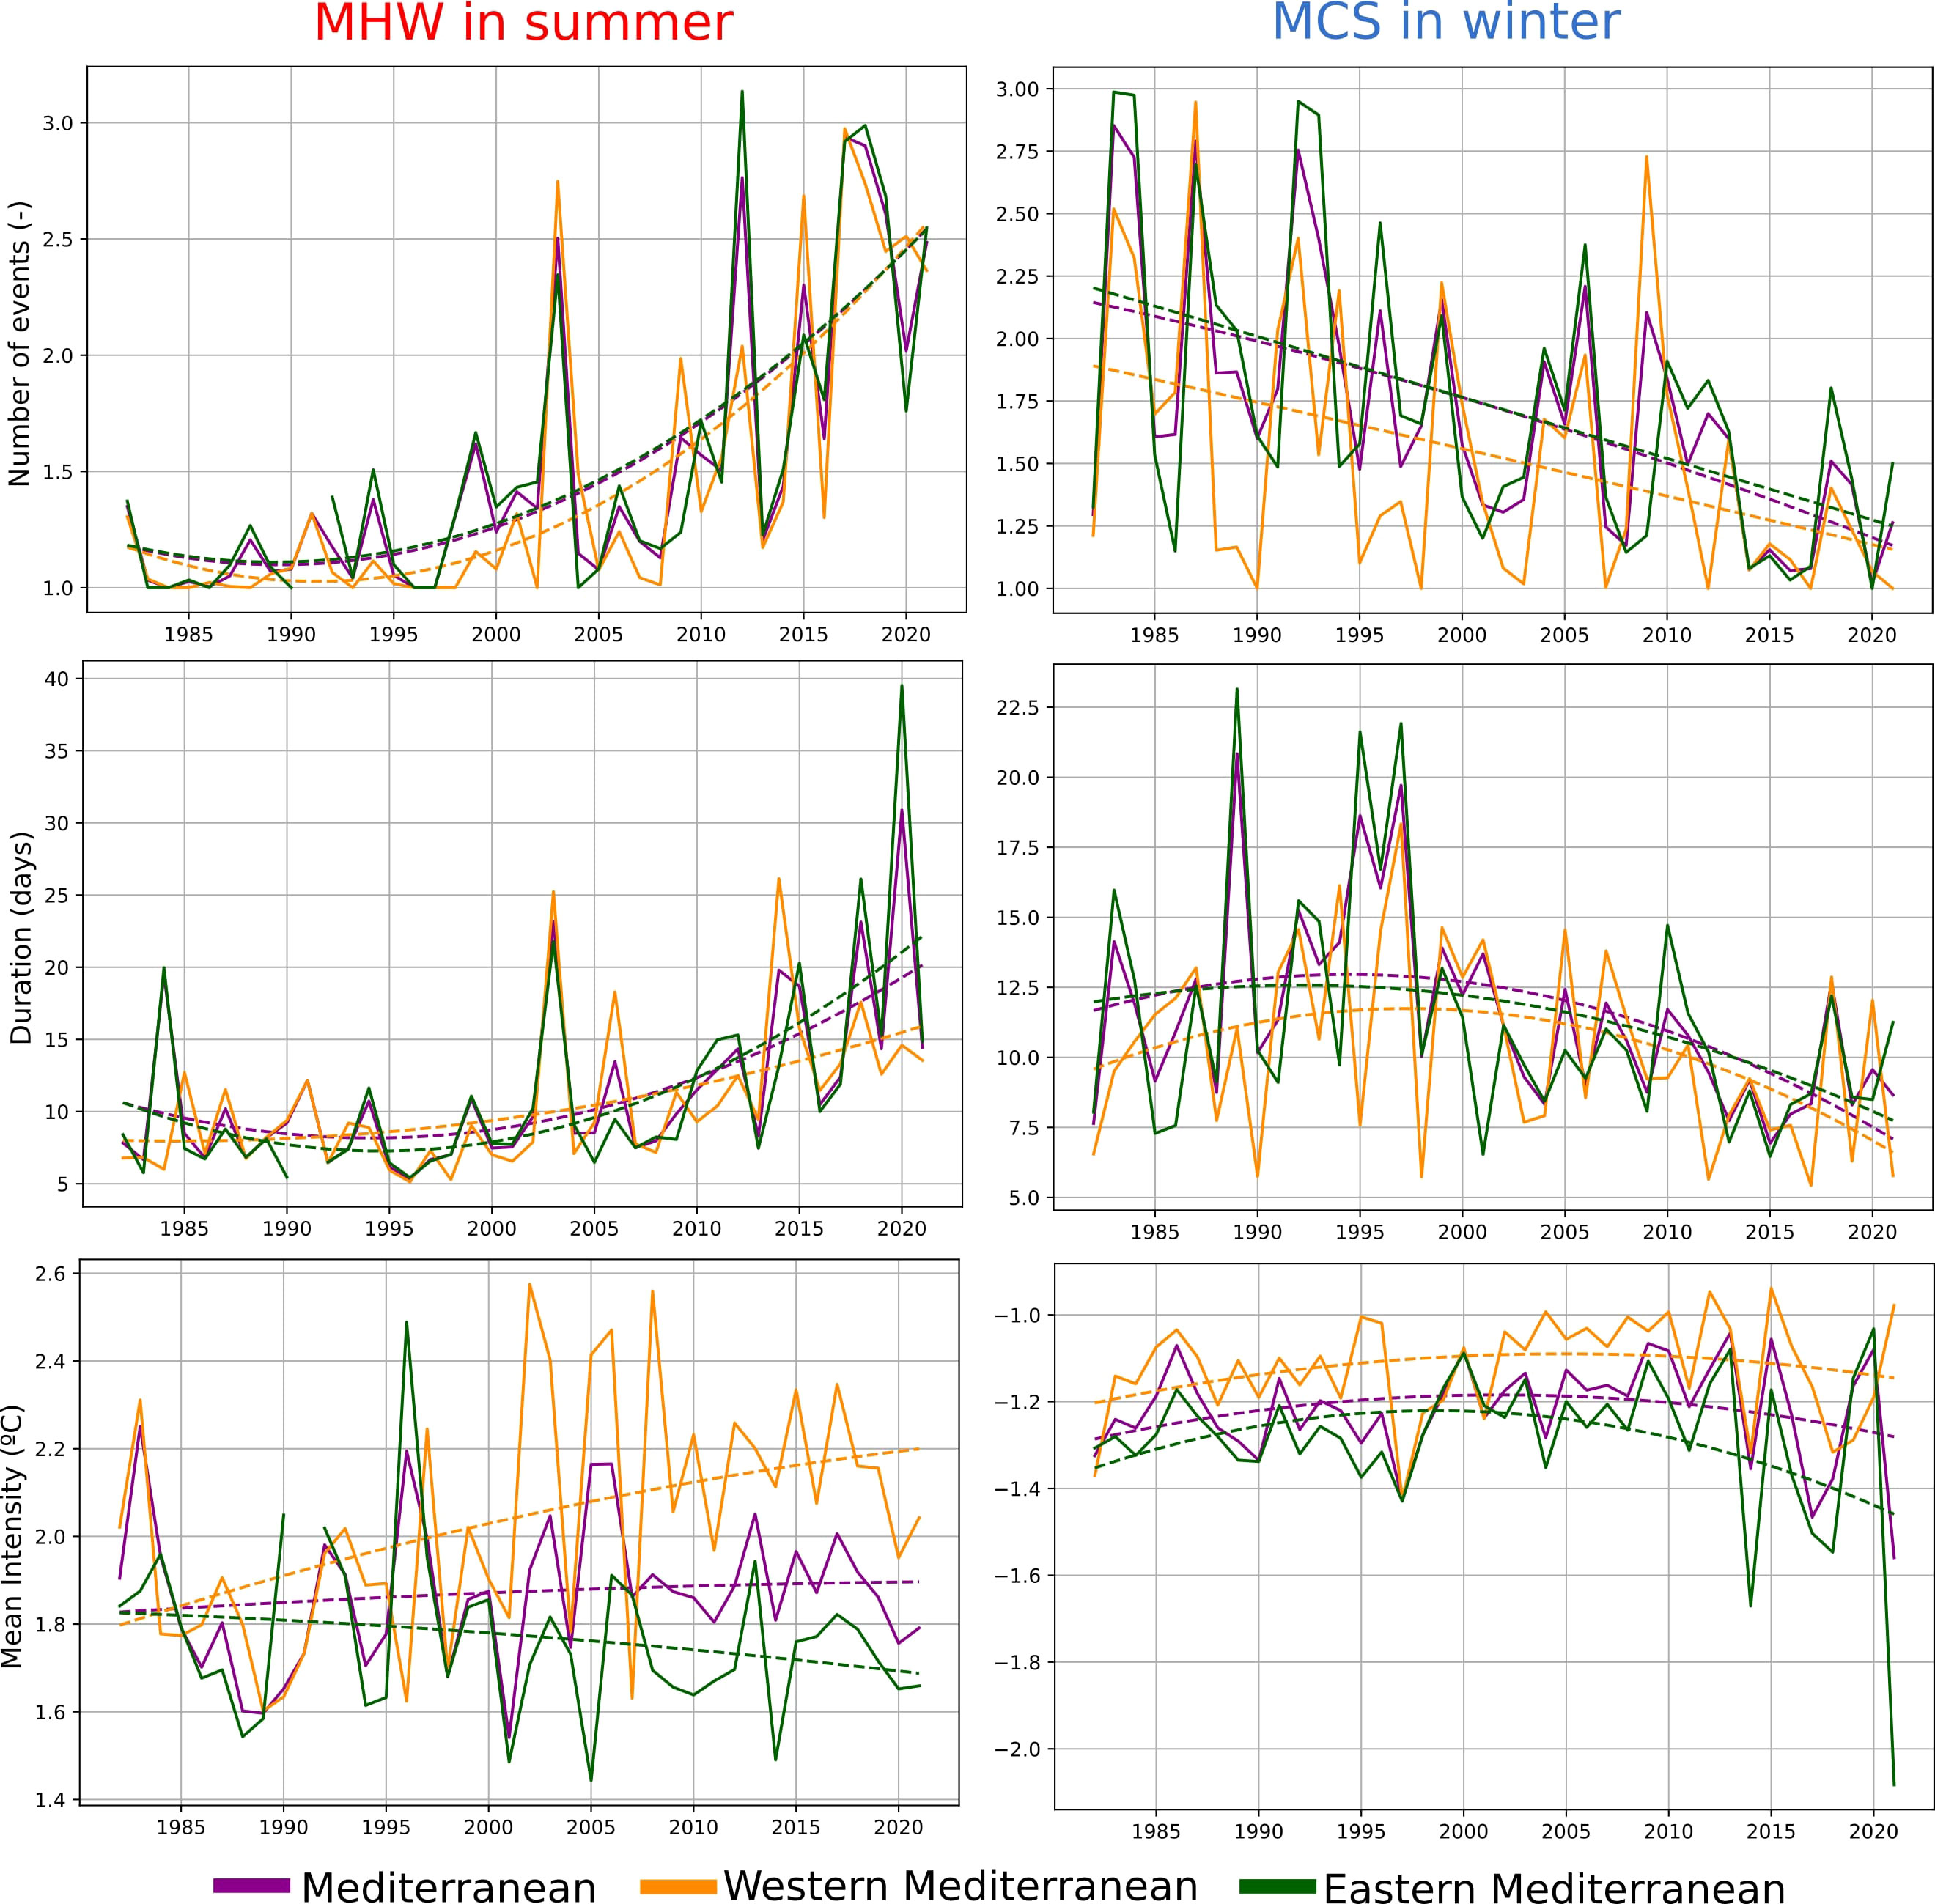
Figure 5 Times series of mean number (top), average duration (middle; in days), average intensity (bottom; in °C) of the MHWs in JJAS (left) and MCSs in DJFM (right) in the Mediterranean (magenta line), the western Mediterranean (orange line) and the eastrern Mediterranean (green line). Dash lines represent quadratic regression of the solid line with the same color.
The total activity increases abruptly for MHWs in summer and decreases linearly for MCSs in winter (Figure 6). The total activity is greater for the whole Mediterranean, followed by the eastern and lastly the western Mediterranean, primarily reflecting the spatial extent of the domain considered. The western Mediterranean occupies 34% of the whole Mediterranean basin, whereas the eastern Mediterranean occupies 66% of it. When scaling the total activity to the domain size, the activity tendency of MHWs in summer is quasi-similar for the three regions, except for higher peaks in the western Mediterranean in 2003, then 2018 and 2015.
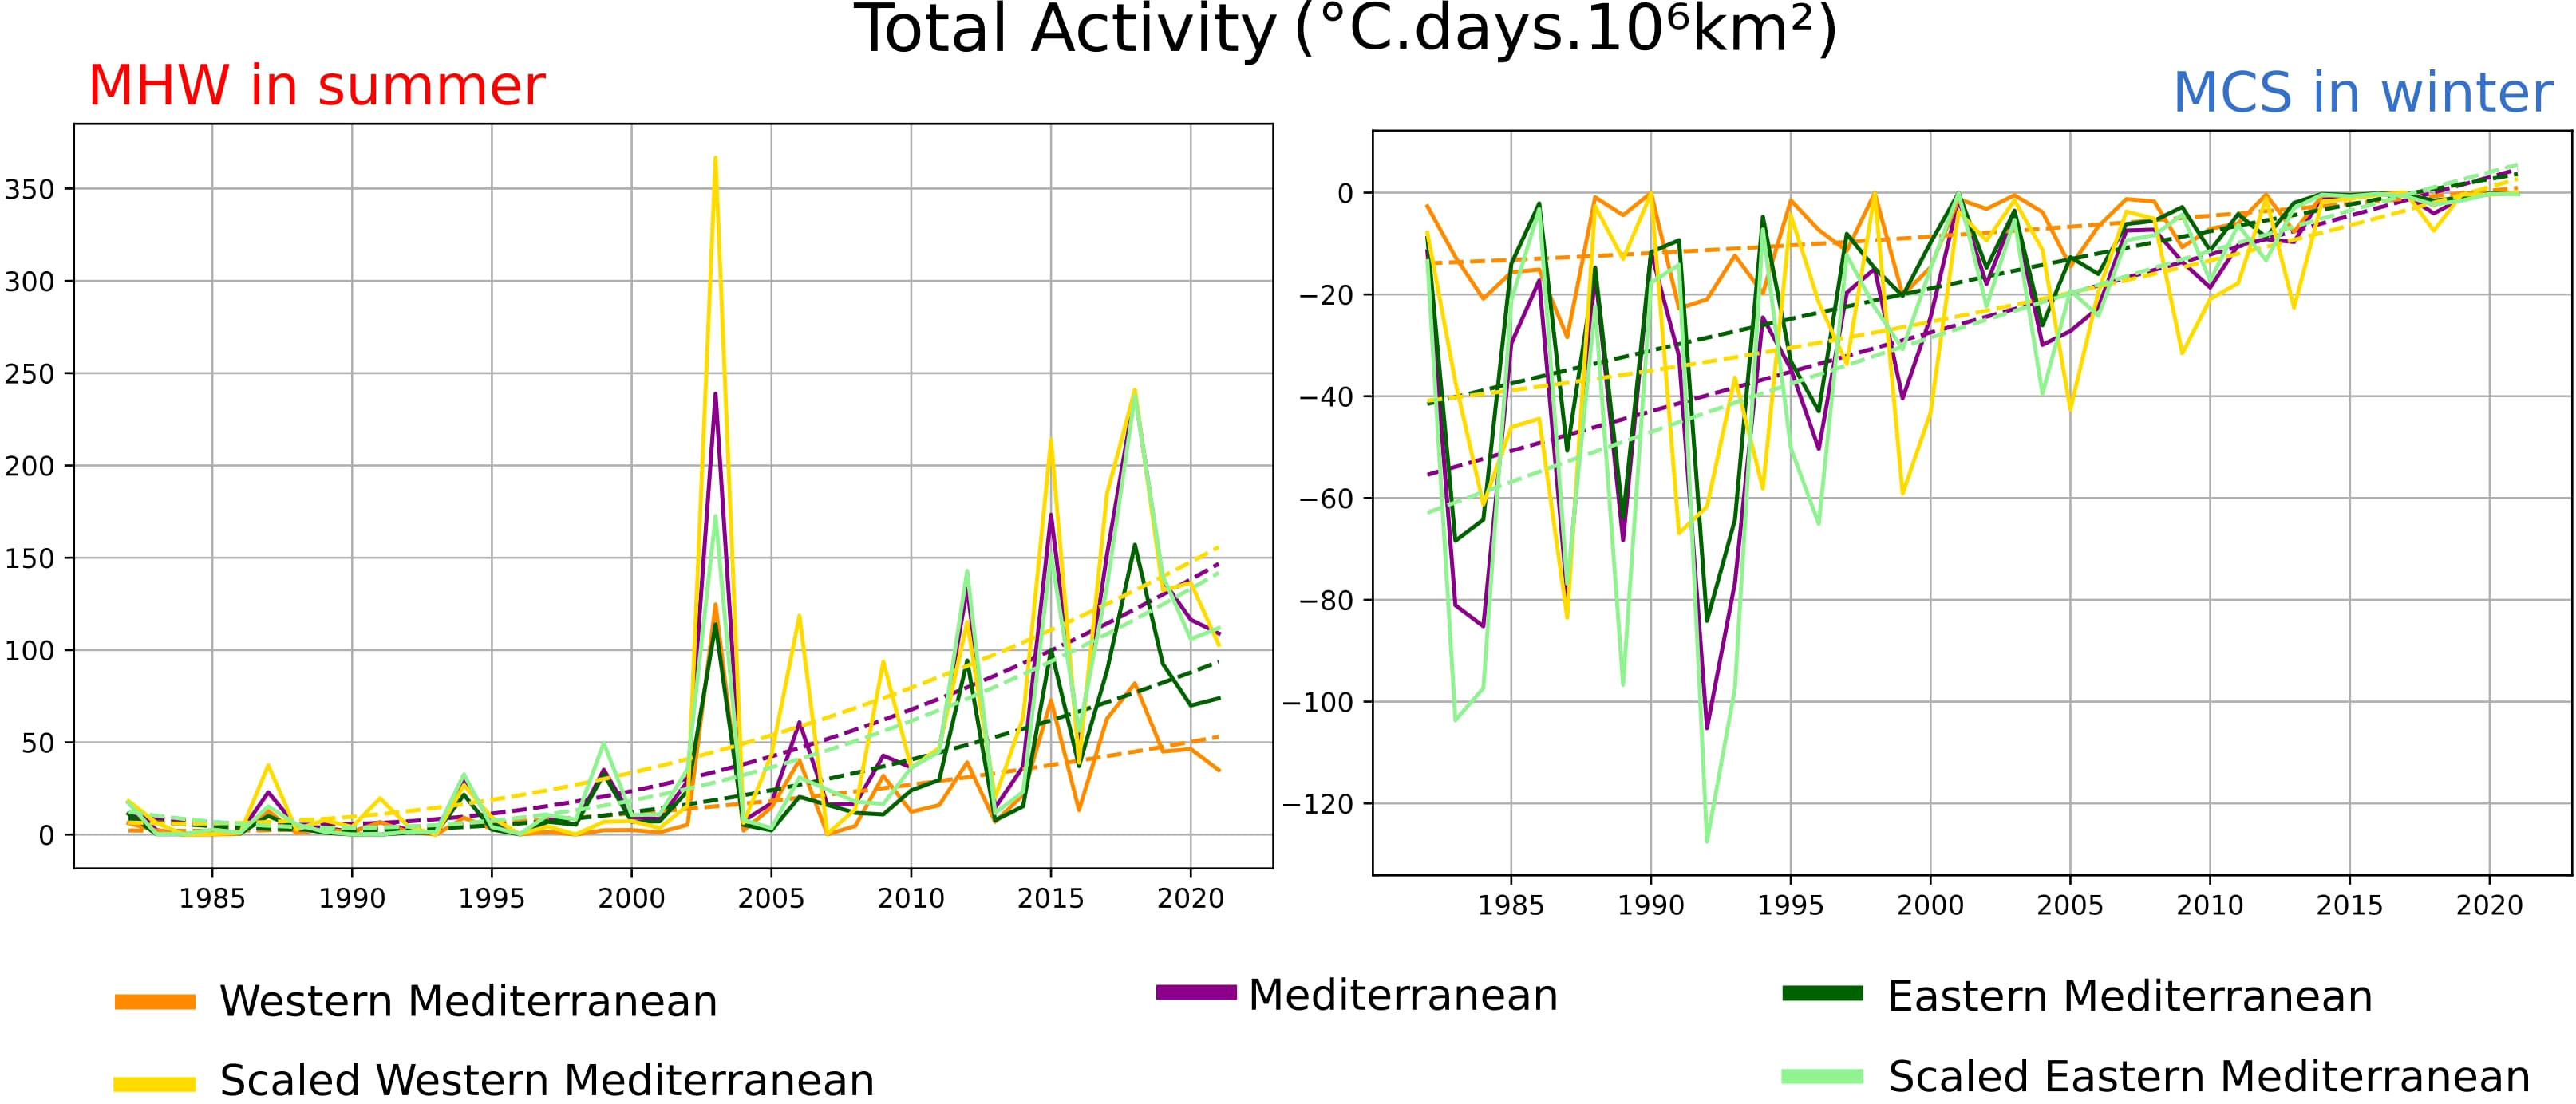
Figure 6 Times series of total activity and size-scaled total activity (°C x days x 10⁶km²) of the MHWs in JJAS (left) and MCSs in DJFM (right) in the Mediterranean (magenta line), the western Mediterranean (orange line) and the eastern Mediterranean (green line). Dash lines represent quadratic regression of the solid line with the same color.
Discussion and conclusions
In this study, we applied a methodology to rank periods of marine extreme activities. We first detected marine extreme events by using the common definition proposed by Hobday et al. (2016) and the widely used SST product OISST from 1982 to 2021. We then adapted and generalized to any domain the severity metric from Darmaraki et al. (2019b) to any domain and coined this new metric “activity” (to avoid confusion with the severity metric from Hobday et al, 2018). This novel metric combines the structural characteristics such as the number of events, duration, mean intensity and spatial extent of all marine extreme events within a predefined domain and for a particular period of the year. This methodology is applied for MHWs in summer and MCSs in winter, for the entire Mediterranean basin, as well as to the western Mediterranean and the eastern Mediterranean separately.
We found that the summers with the strongest MHW activity in the Mediterranean were 2018, followed by 2003 and 2015. In terms of spatial distribution, we observe that the highest MHW activities occurred preferably in the western Mediterranean. For the first time, a comprehensive ranking of winter MCSs has been performed over the Mediterranean Sea. The top 3 more active winters were 1992, 1984 and 1983. The strongest MCS activities took place preferably in the eastern Mediterranean and are about half of what was recorded for the strongest MHWs. The long-term tendency analysis of the extreme events activity in the Mediterranean show an accelerated increase for the summer MHW activity, while for the winter MCS it is observed a linear decrease.
With the manual method of identification of most extreme marine extremes of Gupta et al. (2020), two of the top 62 globally most extreme MHWs from 1982 to 2017 were identified in the Mediterranean. One in the summer 2003, extending from the Balearic Island to the Gulf of Sidra, and another in the summer 2015 covering the Ionian basin and the Levantine Sea. Near the Mediterranean region, in the Red Sea, Mohamed et al. (2021), found that for the 1982-2019 period, the highest annual MHW number of events, duration and cumulative intensity occurred during the year 2018. This is in perfect accordance with our study, validating our automatic methodology to identify periods of strong MHW activity. Darmaraki et al. (2019a) identified the summers of 2003 and 2015 as the most severe surface events of the period 1982-2017. Here, by extending the period until 2021, we found that the summer 2018 has a slightly higher MHW activity than the summer 2003 followed by the summer 2015, thus claiming the top spot in the MHWs rank to date. In the western Mediterranean Sea, the summers of 2003 and 2006 MHWs were detected as strong events, according to the severity classification of Hobday et al. (2018). These events are respectively ranked top 1 and 7, according to our classification within the western Mediterranean. In the atmospheric counterpart, the summers 2003, 2015 and 2018 were also hot extremes over Europe (see review in Twardosz and Kossowska-Cezak, 2021b). For all these notable marine events in the Mediterranean Sea, mass mortality and ecosystem changes have been reported (Darmaraki et al., 2019b), suggesting that recent summers with strong MHW activity, such as 2018, 2017, 2019 (ranked respectively 1, 4 and 5) might have pushed biological species under stress and could have impacted atmospheric circulation in this region.
For the whole Mediterranean, we found that the number of events and duration of MHWs has increased rapidly. Gupta et al. (2020) found that the duration of global MHWs also increases non-linearly. They mention that it is an intrinsic feature of the duration metric when background temperature increases. This is also in line with the results of Darmaraki et al. (2019a) which found that MHWs become longer, more severe, and spatially extended in the Mediterranean. Here, in addition to previous studies, a clear positive linear tendency of mean intensity is observed for the western Mediterranean, but not for the entire or eastern Mediterranean. The lack of tendency of the average intensity for the entire and eastern Mediterranean summer MHWs are due to a large number of weak events crossing the threshold and compensating intensity increases in the strongest events. For example there is a clear positive tendency for the maximum mean intensity (Figure S7). The total activity, which accounts for concatenated information of the three former properties and the spatial extent, shows a clear tendency for an accelerated increase. The summers of 2003 and 2018 accounted for a very similar total activity for the whole Mediterranean (about 240 °C x days x 10⁶km²). However, half of the activity of the year 2018 can be explained by the mean activity rising (seen with the quadratic fit) while the summer 2003 activity peak is mostly due to variability (anomaly from the quadratic fit).
Concerning winter MCSs, the occurrence in the Mediterranean undoubtedly decreases while the duration and mean intensity only weakly decline, in accordance with Schlegel et al. (2021) which investigated global annual MCSs. Furthermore, by combining these three properties and the spatial extent, we see a clear linear decline in the MCS activity. In the western Mediterranean basin, the MCS activity in winter has indeed remained relatively stable in the last forty years probably because surface temperature minima occurring in winter due to dry and cold winter winds are usual (Herrmann et al., 2017). Deep convection indeed occurs every winter in the north-western Mediterranean, albeit with strong interannual and decadal variability (Herrmann et al., 2017), and a predicted weakening in the future due to global warming (Somot et al., 2006). In the eastern basin, the decrease in MCSs may be associated with a weakening in the vertical mixing with implications for nutrient replenishment and primary productivity (Lazzari et al., 2012; Kotta and Kitsiou, 2019). Understanding the role of MCSs in the depth-integrated productivity of the eastern basin would require further studies using satellite and model data.
By focusing on the maximum intensity from 1982 to 2020 extreme hot and cold events over the globe, Schlegel et al. (2021) showed that MHWs were more intense than MCSs in the western Mediterranean while in the eastern Mediterranean MCSs are slightly more intense, consistent with our study. In this paper, we further quantify that the three strongest MHWs in terms of activity, occurring preferably in the western Mediterranean, almost double the mean intensity, duration and activity of the three strongest MCSs, occurring preferably in the eastern Mediterranean.
In the Mediterranean, the occurrence of summer MHWs increases while that of winter MCSs decreases, similarly to what was found globally and annually by Oliver et al. (2018) and Schlegel et al. (2017), respectively. In the present study, by using the combined (occurrence, duration, intensity and spatial extent) activity metric, we found that the long-term tendency of activity shows a non-linear accelerated increase for summer MHWs and a linear decrease for winter MCSs in the Mediterranean. This asymmetric behavior is in line with atmospheric heatwaves in southern Europe. The study of Twardosz et al., 2019 on atmospheric thermal anomalies using weather stations shows an increased frequency of anomalously warm months and a declining number of anomalously cold months, with warm months growing at a faster rate than the decline of cold months. By accounting only for large-area thermal anomalies (more than 10% of the European continent), Twardosz and Kossowska-Cezak, 2021b found that, under current climate warming, hot atmospheric anomalies are increasingly frequent, while cold atmospheric anomalies are on the wane. Besides, the increase in MHW and decrease in MCS activities are consistent with the long-term global air temperature and ocean heat content increase induced by anthropogenic forcing (Arias et al., 2021), but might also be partly modulated by trends in other local factors in Europe such as a change in atmospheric circulation induced by non-uniform warming (Beniston, 2004; Twardosz et al., 2021a) or more persistent circulation patterns (Kyselý and Huth, 2008).
We acknowledge that there are limitations to this study. One should stress that the methodology here does not account for individual discrete events, but rather the cumulative activity of seasonal marine extreme events within a considered domain. Nevertheless, it allows the generation of time series of aggregate characteristics of marine extreme events that could be used to further analyze their association with atmospheric patterns or ecological processes, for example. Our methodology requires to predefine a domain and time range, therefore if not well-chosen coherent extreme events could be cut-off, both spatially and/or temporally. The methodology partly accounts for this situation by using only the proportion of duration within the considered period of the year for the calculation of the activity metric. This method can be seen as complementary to the independent tracking of marine extreme events.
Here, we have only characterized the surface signature of these extreme temperature marine events. However, ecological species could be more affected in the subsurface. This should be assessed by model analysis, as done for the first time by Darmaraki et al. (2019a). In our study, we mapped three regions: the whole, western and eastern Mediterranean. However, if focusing on the link with marine habitat, a more detailed regionalisation of the Mediterranean could be undertaken (Reygondeau et al., 2017; Ayata et al., 2018). The methodology proposed here was indeed built to be easily reproduced for any domain or period of the year. Even if not addressed here, the methodology can be performed for other marine extreme events, such as extreme salinity events or the characterization of upwelling activity in Eastern Boundary Upwelling Systems.
With the ongoing warming of the global climate, the MHWs are expected to continue increasing and MCS to decrease in frequency, intensity and duration over the coming decades. Therefore, suitable measures to monitor and characterize such ocean temperature extremes are needed. In this study, an integrated and generalized activity metric is introduced, offering a useful tool to keep track of these changes in specific ocean regions or seas. Here we illustrate this generalized and aggregated activity metric for the Mediterranean and, among other conclusions, found that summer 2018 experienced slightly more MHW activity than the summer of 2003, often cited as the most exceptional marine extreme event with devastating ecosystem consequences and which has amplified the summer 2003 European heatwave. We suggest that the method can also be applied to other ocean regions, in particular for applications where there is a benefit to considering activity or impacts spatially aggregated. Thus we provide the code developed here, which could help to assess the evolution of these MHWs and MCSs metrics elsewhere in recent decades. Additionally, the code can be easily applied to the output of the most recent GCMs to further evaluate how more active and longer hot extreme events, and conversely less active and shorter cold extreme events, will affect different marine ecosystems or atmospheric circulation in the future.
Data availability statement
The code generated for this study is available for download at https://github.com/amelie-simon-pro/marine-extreme-event. It includes two python scripts. A script that loops over any domain the detection script of Hobday et al. (2016) (step (i) of the protocol of this study) and a second script that calculates the activity and ranks the years according to the total activity (step (ii) and step (iii) of the protocol of this study).
Author contributions
AS, SP, AR, AT-M, RT participated in the conceptual design of the study, the interpretation, the definition of the datasets to be used for the study, and the redaction of the manuscript. AS and SP calculated the indices, and AS calculated the remaining parameters and trends. Each of the co-authors performed a thorough revision of the manuscript, provided useful advice on the intellectual content and improved the English language. All authors contributed to the article and approved the submitted version.
Funding
This work was partially supported by national funds through FCT (Fundação para a Ciência e a Tecnologia, Portugal) through project ROADMAP (JPIOCEANS/0001/2019). AS, SP, AR, AT-M, RT are grateful for the FCT funding UIDB/50019/2020 - Instituto Dom Luiz. Supporting information that may be useful in reproducing the authors’ work is available from the authors upon request (ajsimon@fc.ul.pt). AT-M was funded by the Project SARDINHA2020 (MAR-01.04.02-FEAMP-0009), funded by the Operational Program Mar2020.
Acknowledgments
We thank the three reviewers for their feedback that helped to improve the quality of this manuscript.
Conflict of interest
The authors declare that the research was conducted in the absence of any commercial or financial relationships that could be construed as a potential conflict of interest.
Publisher’s note
All claims expressed in this article are solely those of the authors and do not necessarily represent those of their affiliated organizations, or those of the publisher, the editors and the reviewers. Any product that may be evaluated in this article, or claim that may be made by its manufacturer, is not guaranteed or endorsed by the publisher.
Supplementary material
The Supplementary Material for this article can be found online at: https://www.frontiersin.org/articles/10.3389/fmars.2022.892201/full#supplementary-material
Supplementary Figure 1 | Number of events (top), average duration (middle; in days) and average intensity (bottom; °C) for all detected summer (JJAS) MHWs (left) and winter (DJFM) MCSs (right) within the period 1982-2021 in the Mediterranean.
Supplementary Figure 2 | Ranking and summer (JJAS) activity (in °C x days x km²) of the top four to nine summers having the largest MHW total activity in the Mediterranean.
Supplementary Figure 3 | Same as Figure S2 but for the top 9 ranking over the western Mediterranean basin.
Supplementary Figure 4 | Same as Figure S2 but in the eastern Mediterranean.
Supplementary Figure 6 | Same as Figure S2 but for winter (DJFM) MCSs.
Supplementary Figure 7 | Times series of the discrete maximum mean intensity (in °C) in the Mediterranean (magenta line), the western Mediterranean (orange line) and the eastrern Mediterranean (green line) of MHWs in JJAS (left) and MCSs in DJFM (right). Dashed lines represent quadratic regression of the solid lines with the same color.
Supplementary Table 5 | Top 30 summer in terms of MHW total activity for the Mediterranean (left column), the western Mediterranean (middle column) and the eastern Mediterranean (right column).
References
Arias P., Bellouin N., Coppola E., Jones R., Krinner G., Marotzke J., et al. (2021). Climate change 2021: The physical science basis. contribution of working Group14 I to the sixth assessment report of the intergovernmental panel on climate change; technical summary. Cambridge, United Kingdom and New York, NY, USA: Cambridge University Press
Auger P. A., Ulses C., Estournel C., Stemmann L., Somot S., Diaz F. (2014). Interannual control of plankton communities by deep winter mixing and prey/predator interactions in the NW Mediterranean: Results from a 30-year 3D modeling study. Prog. Oceanogr. 124, 12–27.
Ayata S. D., Irisson J. O., Aubert A., Berline L., Dutay J. C., Mayot N., et al. (2018). Regionalisation of the Mediterranean basin, a MERMEX synthesis. Prog. Oceanogr. 163, 7–20.
Beniston M. (2004). The 2003 heat wave in Europe: A shape of things to come? an analysis based on Swiss climatological data and model simulations. Geophys. Res. Lett. 31 (2).
Bensoussan N., Romano J. C., Harmelin J. G., Garrabou J. (2010). High resolution characterization of northwest Mediterranean coastal waters thermal regimes: to better understand responses of benthic communities to climate change. Estuarine Coast. Shelf. Sci. 87 (3), 431–441.
Boyer T. P., Garcia H. E., Locarnini R. A., Zweng M. M., Mishonov A. V., Reagan J. R., et al. (2018) World ocean atlas 2018. [indicate subset used]. NOAA national centers for environmental information. dataset. Available at: https://accession.nodc.noaa.gov/NCEI-WOA18 (Accessed 27/09/2021).
Collins M., Sutherland M., Bouwer L., Cheong S.-M., Frölicher T., Jacot Des Combes H., et al. (2019). Extremes, abrupt changes and managing risk. in: IPCC special report on the ocean and cryosphere in a changing climate. Eds. Pörtner H.-O., Roberts D. C., Masson-Delmotte V., Zhai P., Tignor M., Poloczanska E., Mintenbeck K., Alegría A., Nicolai M., Okem A., Petzold J., Rama B., Weyer N. M. (press).
Darmaraki S., Somot S., Sevault F., Nabat P. (2019a). Past variability of Mediterranean Sea marine heatwaves. Geophys. Res. Lett. 46, 9813–9823. doi: 10.1029/2019GL082933
Darmaraki S., Somot S., Sevault F., Nabat P., Narvaez W. D. C., Cavicchia L., et al. (2019b). Future evolution of marine heatwaves in the Mediterranean Sea. Climate Dynamics 53 (3), 1371–1392.
Eakin C. M., Morgan J. A., Heron S. F., Smith T. B., Liu G., Alvarez-Filip L., et al. (2010). Caribbean Corals in crisis: record thermal stress, bleaching, and mortality in 2005. PloS One 5 (11), e13969.
Feudale L., Shukla J. (2007). Role of Mediterranean SST in enhancing the European heat wave of summer 2003. Geophys. Res. Lett. 34 (3).
Frölicher T. L., Fischer E. M., Gruber N. (2018). Marine heatwaves under global warming. Nature 560 (7718), 360–364.
Galli G., Solidoro C., Lovato T. (2017). Marine heat waves hazard 3D maps and the risk for low motility organisms in a warming Mediterranean Sea. Front. Mar. Sci. 4, 136.
García-Herrera R., Díaz J., Trigo R. M., Luterbacher J., Fischer E. M. (2010). A review of the European summer heat wave of 2003. Crit. Rev. Environ. Sci. Technol. 40 (4), 267–306.
Garrabou J., Coma R., Bensoussan N., Bally M., Chevaldonné P., Cigliano M., et al. (2009). Mass mortality in northwestern Mediterranean rocky benthic communities: effects of the 2003 heat wave. Global Change Biol. 15 (5), 1090–1103.
Grazzini F., Viterbo P. (2003). Record-breaking warm sea surface temperature of the Mediterranean Sea. ECMWF Newslett. 98, 30–31.
Gupta A. S., Thomsen M., Benthuysen J. A., Hobday A. J., Oliver E., Alexander L. V., et al. (2020). Drivers and impacts of the most extreme marine heatwave events. Sci. Rep. 10 (1), 1–15.
Herrmann M., Auger P. A., Ulses C., Estournel C. (2017). Long-term monitoring of ocean deep convection using multisensors altimetry and ocean color satellite data. J. Geophys. Research: Oceans 122 (2), 1457–1475.
Herrmann M., Estournel C., Déqué M., Marsaleix P., Sevault F., Somot S. (2008). Dense water formation in the gulf of lions shelf: Impact of atmospheric interannual variability and climate change. Continental Shelf. Res. 28 (15), 2092–2112.
Hobday A. J., Alexander L. V., Perkins S. E., Smale D. A., Straub S. C., Oliver E. C., et al. (2016). A hierarchical approach to defining marine heatwaves. Prog. Oceanogr. 141, 227–238.
Hobday A. J., Oliver E. C. J., Sen Gupta A., Benthuysen J. A., Burrows M. T., Donat M. G., et al. (2018). Categorizing and naming marine heatwaves. Oceanography 31 (2), 162–173. doi: 10.5670/oceanog.2018.205
Huang B., Liu C., Banzon V., Freeman E., Graham G., Hankins B., et al. (2020). Improvements of the daily optimum interpolation Sea surface temperature (DOISST) version 2.1. J. Climate 34, 2923–2939. doi:10.1175/JCLI-D-20-0166.
Huete-Stauffer C., Vielmini I., Palma M., Navone A., Panzalis P., Vezzulli L., et al. (2011). Paramuricea clavata (Anthozoa, octocorallia) loss in the marine protected area of tavolara (Sardinia, Italy) due to a mass mortality event. Mar. Ecol. 32, 107–116.
Ibrahim O., Mohamed B., and Nagy H. (2021). Spatial variability and trends of marine heat waves in the eastern mediterranean sea over 39 years. J. Mar. Sci. Eng. 9 (6), 643.
Kotta D., Kitsiou D. (2019). Chlorophyll in the eastern mediterranean sea: Correlations with environmental factors and trends. Environments 6 (8), 98.
Kyselý J., Huth R. (2008). Relationships of surface air temperature anomalies over Europe to persistence of atmospheric circulation patterns conducive to heat waves. Adv. geosciences 14, 243–249.
Lazzari P., Solidoro C., Ibello V., Salon S., Teruzzi A., Béranger K., et al. (2012). Seasonal and inter-annual variability of plankton chlorophyll and primary production in the Mediterranean Sea: a modelling approach. Biogeosciences 9 (1), 217–233.
Marbà N., Duarte C. M. (2010). Mediterranean Warming triggers seagrass (Posidonia oceanica) shoot mortality. Global Change Biol. 16 (8), 2366–2375.
Mohamed B., Nagy H., Ibrahim O. (2021). Spatiotemporal variability and trends of marine heat waves in the red sea over 38 years. J. Mar. Sci. Eng. 9 (8), 842.
Olita A., Sorgente R., Natale S., Gaberšek S., Ribotti A., Bonanno A., et al. (2007). Effects of the 2003 European heatwave on the central Mediterranean Sea: surface fluxes and the dynamical response. Ocean Sci. 3 (2), 273–289.
Oliver E. C., Benthuysen J. A., Darmaraki S., Donat M. G., Hobday A. J., Holbrook N. J., et al. (2021). Marine heatwaves. Annu. Rev. Mar. Sci. 13, 313–342.
Oliver E. C., Donat M. G., Burrows M. T., Moore P. J., Smale D. A., Alexander L. V., et al. (2018). Longer and more frequent marine heatwaves over the past century. Nat. Commun. 9 (1), 1–12.
Pietri A., Colas F., Mogollon R., Tam J., Gutierrez D. (2021). Marine heatwaves in the Humboldt current system: from 5-day localized warming to year-long El niños. Sci. Rep. 11 (1), 1–12.
Reygondeau G., Guieu C., Benedetti F., Irisson J. O., Ayata S. D., Gasparini S., et al. (2017). Biogeochemical regions of the Mediterranean Sea: An objective multidimensional and multivariate environmental approach. Prog. oceanogr 151, 138–148.
Reynolds R. W., Smith T. M., Liu C., Chelton D. B., Casey K. S., Schlax M. G. (2007). Daily high-resolution-blended analyses for sea surface temperature. J. Clim 20, 5473–5496.
Rohling E. J., Hayes A., De Rijk S., Kroon D., Zachariasse W. J., Eisma D. (1998). Abrupt cold spells in the northwest Mediterranean. Paleoceanography 13 (4), 316–322.
Schiaparelli S., Castellano M., Povero P., Sartoni G., Cattaneo-Vietti R. (2007). A benthic mucilage event in north-Western Mediterranean Sea and its possible relationships with the summer 2003 European heatwave: short term effects on littoral rocky assemblages. Mar. Ecol. 28 (3), 341–353.
Schlegel R. W., Darmaraki S., Benthuysen J. A., Filbee-Dexter K., Oliver E. C. (2021). Marine cold-spells. Prog. Oceanogr. 198, 102684.
Schlegel R. W., Oliver E. C., Perkins-Kirkpatrick S., Kruger A., Smit A. J. (2017). Predominant atmospheric and oceanic patterns during coastal marine heatwaves. Front. Mar. Sci. 4, 323.
Selig E. R., Casey K. S., Bruno J. F. (2010). New insights into global patterns of ocean temperature anomalies: implications for coral reef health and management. Global Ecol. Biogeogr. 19 (3), 397–411.
Smale D. A., Wernberg T., Oliver E. C., Thomsen M., Harvey B. P., Straub S. C., et al. (2019). Marine heatwaves threaten global biodiversity and the provision of ecosystem services. Nat. Climate Change 9 (4), 306–312.
Somot S., Sevault F., Déqué M. (2006). Transient climate change scenario simulation of the Mediterranean Sea for the twenty-first century using a high-resolution ocean circulation model. Climate Dynamics 27 (7), 851–879.
Sorte C. J., Fuller A., Bracken M. E. (2010). Impacts of a simulated heat wave on composition of a marine community. Oikos 119 (12), 1909–1918.
Sparnocchia S., Schiano M. E., Picco P., Bozzano R., Cappelletti A. (2006). “The anomalous warming of summer 2003 in the surface layer of the central ligurian Sea (Western Mediterranean,” in Annales geophysicae, vol. Vol. 24. , 443–452.
Twardosz R., Kossowska-Cezak U. (2021b). Large-Area thermal anomalies in Europe, (1951–2018). Temporal spatial patterns. Atmospheric Res. 251, 105434.
Twardosz R., Walanus A., Guzik I. (2021a). Warming in Europe: Recent trends in annual and seasonal temperatures. Pure Appl. Geophysics 178 (10), 4021–4032.
Keywords: marine heatwave (MHW), marine cold spell (MCS), mediterranean, spatial extent, activity, ranking, climate change
Citation: Simon A, Plecha SM, Russo A, Teles-Machado A, Donat MG, Auger P-A and Trigo RM (2022) Hot and cold marine extreme events in the Mediterranean over the period 1982-2021. Front. Mar. Sci. 9:892201. doi: 10.3389/fmars.2022.892201
Received: 08 March 2022; Accepted: 21 July 2022;
Published: 11 August 2022.
Edited by:
Bayden D. Russell, The University of Hong Kong, Hong Kong SAR, ChinaReviewed by:
Adolf Konrad Stips, European Commission, ItalyMagda Catarina Sousa, University of Aveiro, Portugal
Robert Twardosz, Jagiellonian University, Poland
Copyright © 2022 Simon, Plecha, Russo, Teles-Machado, Donat, Auger and Trigo. This is an open-access article distributed under the terms of the Creative Commons Attribution License (CC BY). The use, distribution or reproduction in other forums is permitted, provided the original author(s) and the copyright owner(s) are credited and that the original publication in this journal is cited, in accordance with accepted academic practice. No use, distribution or reproduction is permitted which does not comply with these terms.
*Correspondence: Ana Russo, acrusso@fc.ul.pt