Effect of diet on molecular relationships between Atlantic cod larval muscle growth dynamics, metabolism, and antioxidant defense system
 Tu A. Vo1*
  Trina F. Galloway2†
  Augustine Arukwe1
  Rolf B. Edvardsen3 Kristin Hamre3
  Ørjan Karlsen3
  Ivar Rønnestad4
  Elin Kjørsvik1
- 1Department of Biology, Norwegian University of Science and Technology, Trondheim, Norway
- 2Department of Marine Resources Technology, SINTEF Fisheries and Aquaculture, Trondheim, Norway
- 3Feed and Nutrition, Institute of Marine Research, Bergen, Norway
- 4Department of Biological Science, University of Bergen, Bergen, Norway
We studied molecular effects (RNAseq and qPCR) of first feeding prey types (copepods or rotifers/Artemia) on skeletal muscle myogenesis and growth dynamics (proliferation, differentiation), metabolism (glycolysis, gluconeogenesis, oxidative phosphorylation), and antioxidant defense system (production/regulation of reactive oxygen species (ROS) in cod (Gadus morhua) larval skeletal muscle. Larval somatic growth rates were significantly higher in copepod fed larvae, although shifts in gene expressions related to muscle growth dynamics between hypertrophy and hyperplasia and generation and regulation of ROS mostly occurred around 5-, 10-, and 15-mm standard length (SL) for both groups. Gene expression for cell membrane proteins (such as nox1 and igf1r) peaked at 7 mm SL in all larvae, corresponding with increased ROS expressions in cod muscle during the exponential stratified hyperplasia phase from 7 mm SL. Expression for muscle differentiation (mef2a) occurred continuously (strongest from 10 mm SL). Expressions for muscle proliferation (pcna) and hydrogen peroxide (H2O2) generation (sod1 and sod2) occurred in the 5 - 15 mm SL range, peaking at 10 mm SL in all larvae. A downregulation of sod1 and sod2 in skeletal muscle from 15 mm SL indicated the first response of the defense antioxidant system. Gene expressions related to glucose metabolism (slc2A11, pfk, fpb2, ldha) was 3 - 10 times higher in copepod-fed larvae than in rotifer/Artemia-fed larvae between 7 – 10 mm (live prey period). Copepods move faster than rotifers, and cod larvae will also gradually increase their active swimming periods, due to less viscous forces. Active swimming during the strongest muscle stratified hyperplasia phase (7 – 10 mm SL) could promote a better delivery and transport across the muscle membrane and intracellular flux through glycolysis and oxidative phosphorylation and would contribute to the observed earlier and more effective glucose metabolism in the larvae fed copepods. We suggest that active swimming is an important factor promoting cod larval muscle growth, especially during the strongest muscle hyperplasia phase between 7 and 10 mm SL. The rapid movements of copepods and better nutritional composition could play important roles in stabilizing ROS levels, promoting high swimming activities and enhancing long-term muscle growth in cod.
Introduction
Marine pelagic fish larvae such as the Atlantic cod (Gadus morhua) larvae hatch at a small size (a few mm standard length; SL) and with a rather immature developmental stage, and they need to develop the most important functions for survival before the small yolk-sac is exhausted (Blaxter, 1988). The larval feeding success is dependent on their functional anatomical and physiological development, and they need to grow fast to obtain a wider selection of prey and to avoid predation (Lasker, 1981).
Zooplankton such as copepods are generally superior to rotifers and Artemia as prey for pelagic marine fish larvae (Shields et al., 1999; Støttrup, 2000; Evjemo et al., 2003; Boglione et al., 2013; Hamre et al., 2013; Rønnestad et al., 2013). Rotifers and Artemia are the dominant live prey cultivated for feeding of fish larvae, and they are relatively easy to cultivate in large scale production, in contrast to copepods. Enriched rotifers and Artemia are not nutritionally optimal for cod larval development, and significantly better growth and development is obtained by using zooplankton/copepods during the whole live-feed period (Kvenseth and Øiestad, 1984; Kjørsvik et al., 1991; Imsland et al., 2006; Van der Meeren et al., 2008; Busch et al., 2010; Koedjik et al., 2010; Hamre et al., 2013; Mæhre et al., 2013; Karlsen et al., 2015). Copepods as live feed have also given positive long term effects on growth in cod (Imsland et al., 2006; Karlsen et al., 2015), and even copepod feeding for shorter periods during the earliest feeding stages has shown positive effects on the juvenile size (Øie et al., 2015). Copepods have a well-balanced composition of proteins, free amino acids and lipids, including significant amounts of n-3 fatty acids in the phospholipids (Shields et al., 1999; Evjemo et al., 2003; Drillet et al., 2006; Van der Meeren et al., 2008; Olsen et al., 2014; Karlsen et al., 2015). Changing the first-feeding diets from rotifers to copepods have shown promising results in several aquatic species (Conceição et al., 2010). However, the mechanisms leading to this prolonged growth advantage are yet unknown.
Skeletal muscle is the largest and most rapid growing tissue in fish larvae (Osse et al., 1997; Johnston et al., 2011). The two main mechanisms for growth of skeletal muscle in vertebrates are hypertrophy (increase in muscle size) and hyperplasia (increase in the number of muscle cells) (Weatherley et al., 1988). Generally, hypertrophy occurs all the time throughout most of a fish’ life, whereas stratified hyperplasia occurs in distinct phases (Rowlerson et al., 1995; Johnston et al., 1998). In mammals, hyperplasia also occurs in two major waves, but hyperplasia stops shortly after birth (Kelly and Zacks, 1969; Denetclaw et al., 1997; Gros et al., 2004; Rossi and Messina, 2014). The primary muscle fibers in fish are formed from embryonic myoblasts (called embryonic muscle fibers). In pelagic fish larvae, new muscle fibers are formed between the red and white muscle layers (stratified hyperplasia) from the start of exogenous feeding, and from metamorphosis new fibers are formed between the existing white muscle fibers in the whole myotome (mosaic hyperplasia) (Weatherley et al., 1988; Veggetti et al., 1990; Rowlerson et al., 1995).
In cod larvae, stratified hyperplasia occurs in the 5 – 15 mm SL larvae and is the predominant muscle growth mechanism in the 7 – 10 mm SL cod larvae (Vo et al., 2016) during the live prey feeding period. After hatching teleost muscle hyperplasia requires the proliferation of muscle precursor cells and a common feature of many proliferating cells is aerobic glycolysis, a phenomenon termed “the Warburg effect” (Vander Heiden et al., 2009). A major function of aerobic glycolysis is to support macromolecular synthesis of DNA, RNA, proteins, and lipids by providing precursors for these chemical constituents (Lunt and Vander Heiden, 2011). However, glycolysis is inefficient in generating adenosine triphosphate (ATP) and the yield is only 2 ATP/glucose, whereas oxidative phosphorylation can generate up to 36 ATP/glucose (Lehninger et al., 1993). Oxidative phosphorylation in mitochondria (aerobic energy) is therefore the main contributor of ATP in most cells, including in proliferating cells (Lunt and Vander Heiden, 2011). Therefore, investigating the molecular effects of live prey types on glycolysis, gluconeogenesis and oxidative phosphorylation processes in relation to muscle growth phases may shed new light on the underlying cellular mechanisms behind the variation in larval growth rates caused by live prey types.
The fundamental events in myogenesis (the specification, proliferation, differentiation and fusion of myogenic precursor cells (MPCs)) are regulated by myogenic regulatory factors (i.e., myod, Myf5, Myogenin, Mrf4) (Johnston, 2006; Rossi and Messina, 2014), but it also depends on external signaling factors, released by the surrounding tissues (Valente et al., 2013; Rossi and Messina, 2014). The insulin-like growth factor (IGF) system is one of the central signaling pathways of hypertrophic growth in fish larvae and regulates protein synthesis, breakdown and replacement (Johnston et al., 2011; Valente et al., 2013; García de la Serrana et al., 2014). However, the specific signaling factors and pathways that control the temporal muscle hyperplastic growth phases remain unclear in vertebrates (Valente et al., 2013; Rossi and Messina, 2014).
A rapid growth to a larger size is also beneficial for the larvae’s ability to swim faster, which in small pelagic larvae is dependent on the viscous forces of water relative to their body size. Skeletal muscle is the main organ for locomotion, which probably needs to develop continuously to adapt to these perceived changes in water viscosity relative to their increasing body size. Cod larvae hatch at around 3 – 4 mm SL, they start with an anguilliform swimming behavior, characterized by undulations throughout the body, and they gradually shift to a carangiform swimming mode, with movements mainly near the tail (Weihs, 1980; Webb and Weihs, 1986; Osse and van den Boogart et al., 2004; Müller et al., 2008; Voesenek et al., 2018). Their swimming activity/capability increase exponentially from around 10 mm SL (Clark et al., 2005; Peck et al., 2006; Leis et al., 2007), which is associated with a shift from muscle hyperplasia to muscle hypertrophy (Vo et al., 2016). The “adult type” mosaic hyperplasia occurs from around 20 mm SL (Vo et al., 2016).
The period of stratified hyperplasia (7 – 10 mm SL) is associated with a shift to a more oxidized redox state during cod larval development (Hamre et al., 2014). The cellular redox state is known as a key determinant of cell fate (cell survival, proliferation, differentiation, and apoptosis) in multicellular organism development (Kamata and Hirata, 1999; Matsuzawa and Ichijo, 2008). The change in redox state in a biological system occurs commonly in response to a change in the level of reactive oxidative species (ROS), including the superoxide anion (), hydrogen peroxide (H2O2), and hydroxyl radicals (OH·) (Urao and Ushio-Fukai, 2013; Holmström and Finkel, 2014; Schieber and Chandel, 2014; Chandel et al., 2016). ROS have long been considered to evoke damage or oxidative stress to tissues, but especially H2O2 is now also considered as a secondary messenger when induced in small amounts. ROS act as signaling molecules to initiate biological processes and to maintain physiological functions in cells; so-called ROS signaling – redox biology (Urao and Ushio-Fukai, 2013; Holmström and Finkel, 2014; Schieber and Chandel, 2014; Jones and Sies, 2015; Chandel et al., 2016). ROS are by-products of aerobic metabolism (Halliwell, 1991), which is the main metabolism of red muscle, while white muscle function changes from predominantly aerobic to anaerobic metabolism during climax-metamorphosis in fish larvae (El-Fiky et al., 1987). During intense contractile activity, muscle mitochondria generate a high ROS flow, which may trigger different signaling pathways leading to diverging responses, from adaptation to cell death (see reviews by Jackson, 2005; Barbieri and Sestili, 2012 ). Therefore, our hypothesis is that the viscous force of seawater and the ROS level in muscle tissues, represent external and internal drivers that generate the correlation between muscle growth dynamics and body size growth in cod larvae.
The cod larvae in this experiment were fed either harvested zooplankton (mainly copepods) or enriched rotifers and Artemia as described by Karlsen et al. (2015). Larvae fed copepods had a much higher growth rate (Karlsen et al., 2015), and Penglase et al. (2015) found that the rotifer fed cod larvae developed a more reduced redox potential than copepod fed larvae. Even at the late juvenile stage (28.5 to 31.5 cm SL range, 15 months), the body size was still significantly larger in the cod where the larvae were fed copepods compared to those fed rotifers/Artemia. The largest dietary growth effect was thus observed especially after weaning to a formulated diet, and our hypothesis is that the predominant stratified hyperplastic growth phase in larval cod muscle is a window for modulating the growth rate in larvae and that it may lead to a long-lasting improved growth potential.
Our aim in this study was to investigate the effect of larval live feed (copepods or rotifers and Artemia) on the molecular relationships between somatic growth and the skeletal muscle growth dynamics, metabolism, and antioxidant defense system in developing Atlantic cod larvae from the experiment of Karlsen et al. (2015). We focused on whole body analyses (RNAseq) for gene expressions of myogenic markers (proliferation, differentiation) and target genes and receptors of metabolism (glycolysis, gluconeogenesis, oxidative phosphorylation). For more specific data from skeletal muscle tissue samples, we used qPCR analyses for gene expressions of skeletal muscle myogenesis, and antioxidant defense system (production/regulation of reactive oxygen species (ROS)). The target genes that were used in the molecular analyses are listed in Table 1.
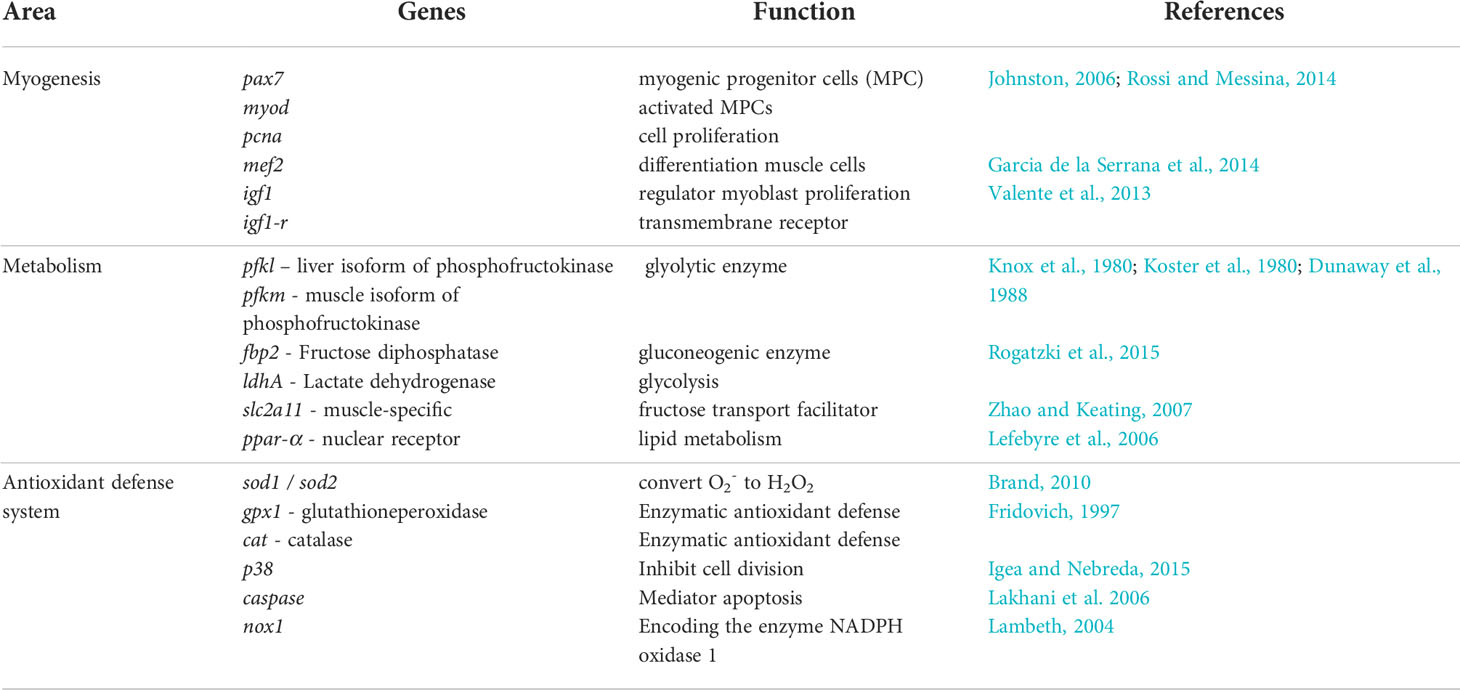
Table 1 Target genes and receptors selected for evaluation of possible effects from live prey type in relation to myogenesis, glycolysis, gluconeogenesis and oxidative phosphorylation in cod larvae.
Materials and methods
Experimental design and larval sampling
The cod larvae and juveniles were reared in accordance with the Norwegian Animal Welfare Act of 20th December 1974, No. 73, Sections 20– 22, amended 19th June 2009. Fertilized eggs were obtained from coastal Atlantic cod from western Norway, which were held at the Institute of Marine Research (IMR), Austevoll Research Station. Details for the main cod larval feeding experiment related to larval growth and survival, experimental conditions, prey types, prey quantities, prey and larval sampling, and biochemical composition are described in Van der Meeren et al. (2014) and in Karlsen et al. (2015).
In summary, the cod larvae were stocked in four 500-litre tanks from hatching to 4 days post-hatch (dph), then they were divided into six tanks at 50000 cod larvae/tank. Larvae in three tanks were fed harvested copepods from a marine pond system (Copepod-fed larvae), while larvae in the other three tanks were fed cultivated and enriched rotifers followed by enriched Artemia nauplii (Rotifer/Artemia-fed larvae). Weaning started with formulated diets from around 15 mm standard length (SL) and continued until around 50 mm SL (juvenile stage) (see Figure 1).
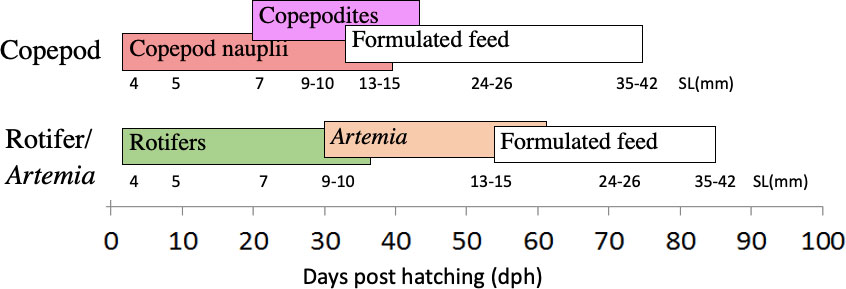
Figure 1 Experimental setup. Cod larvae were fed either copepods (nauplius and copepodite stages) or rotifers and Artemia, then weaned onto a commercial formulated diet from around 15 mm size. Cod larvae were sampled at corresponding larval body sizes at around 4, 5, 7, 9-10, 24-26, and 35-42 mm SL in the two treatments.
Whole larvae were sampled at 4 dph (the control point before the start of exogenous feeding), and 2 hours after morning feeding on other sampling days. Due to the expected increased differences in larval growth between treatments, the larvae and early juveniles were sampled according to specific developmental stages and mean standard lengths, as described in Karlsen et al. (2015) and in Table 2.
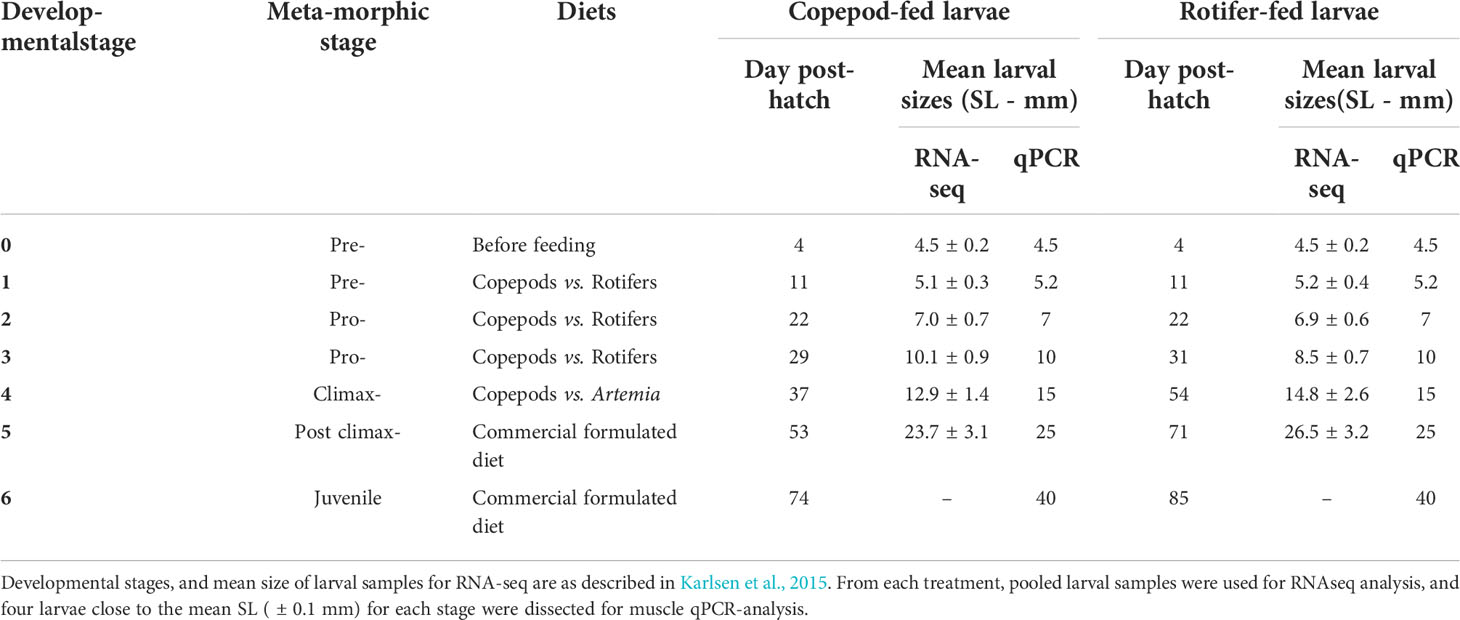
Table 2 Overview of larval developmental stages and mean sizes for RNA-seq and qRT-PCR at different sampling points.
All larvae were sampled randomly from the experimental tanks. The sampled larvae were euthanized in tricaine methane sulfonate (MS-222, Argent Chemical Laboratories Inc., Redmond, WA, USA), and rinsed in distilled water for a few seconds before further fixation and analytical treatments.
RNA sequencing
Samples of whole larvae were stored in RNA later (Ambion, Austin, Texas, USA). A pooled sample of larvae was used at stage 0 (control point, 4 dph), and total RNA from pooled samples of five whole larvae in each triplicate were used for sequencing in later stages.
The details of the RNA extraction, quantification, and sequencing analysis were described in Penglase et al. (2015), and the mean larval sizes at each sampling points are shown in Table 2. The gene expression data by RNA-seq were from 4 – 30 mm range, i.e., only larval stages. The raw data of the cod larvae from this experiment can be found at The Sequence Read Archive at NCBI (Accession ID: PRJNA277848). The reads were normalized by the total number of mapped sequences. Thereafter, they were expressed as fold change compared to day 4 post-hatch larval samples (4 mm/control samples) and were presented as a function of larval body size (SL) and of white muscle growth dynamics as described in Vo et al. (2016).
Quantitative real-time PCR (qRT_PCR)
For more specific analyses of development in the larval muscle tissue, messenger RNA (mRNA) expression of genes encoding for myogenic markers (pcna, pax7, myod1, myodh1) and antioxidant enzyme genes (sod1, sod 2, cat, gpx1, nox1, and p38) were analyzed by quantitative real-time (RT) PCR (see Table 3 for details). The larvae were snap frozen in liquid N2, freeze dried and stored at -80°C before further treatment. To quantify the gene expression levels in the larval muscle tissues, head and gut were dissected (mostly muscle and skeleton remaining) from sampled larvae that were of approximately similar size for each stage and treatment (stages 0 – 5, up to mean size of 40 mm SL).
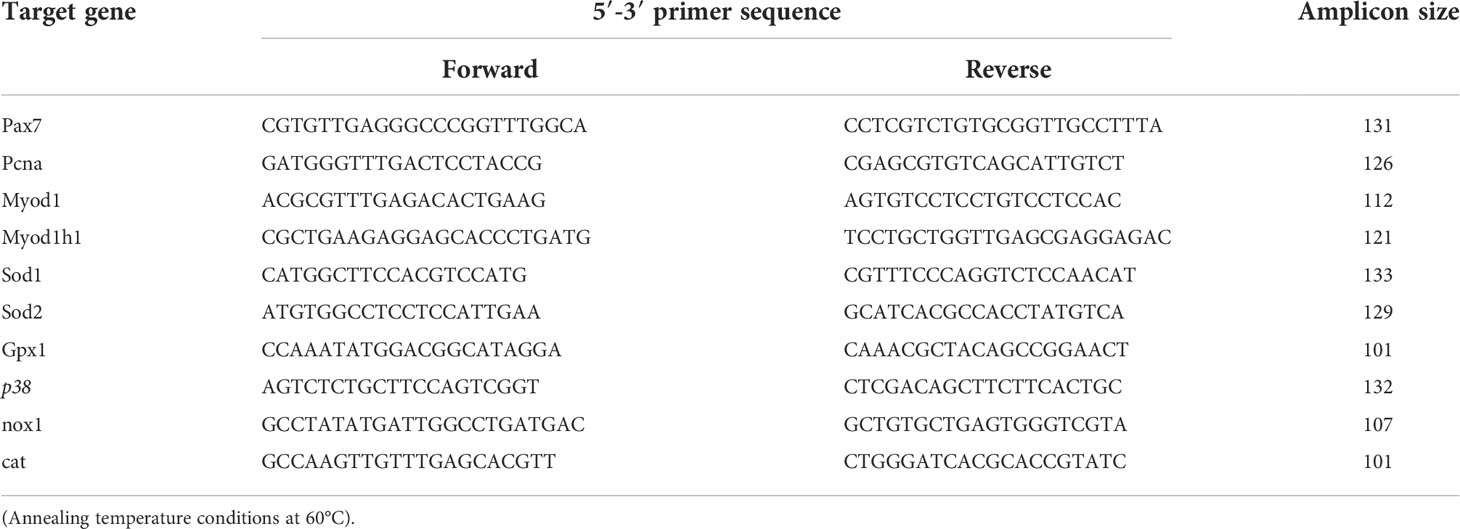
Table 3 Primer pair sequences, amplicon size for genes used for real time PCR.
At each stage, each treatment had three to four replicates of 1- 6 larvae. All samples were homogenized in Trizol reagent according to the manufacturer’s protocol. The purity and integrity of the RNA samples were verified by NanoDrop ND-1000 Spectrophotometer (Nano- Drop Technologies), OD260 nm/OD280 nm ratio for all samples ranged between 1.96 and 2.10 and formaldehyde agarose gel electrophoresis. Complementary DNA (cDNA) for the quantitative PCR (qPCR) reactions were generated from 1 μg total RNA using a combination of random hexamer and poly-T primers from iScript cDNA Synthesis Kit, as described by the manufacturer (Bio-Rad). The expressions of individual gene targets were analyzed using Mx3000 real-time PCR system (Stratagene, La Jolla, CA). Each 25-μL DNA amplification reaction contained 12.5 μL of iTAQTMSYBR Green Supermix with ROX (Bio-Rad), 5 μL of diluted cDNA (1:6), and 200 nM of both forward and reverse primer. The three-step real-time PCR program included an enzyme activation step at 95°C (3min) and 40 cycles at 95°C (15s), 55–60°C (30s), and 72°C (20s).
PCR reaction efficiency (E) for each gene assay was determined using serial dilutions of plasmid containing the amplicon of interest and showed a stable expression pattern between larval pools. To confirm amplification specificity, the PCR products from each primer pair were subjected to melting curve analysis during qPCR assays. Cycle threshold (Ct) values obtained were converted into mRNA copy number using standard plots of Ct versus log copy number. The standard plots were generated for each target sequence using known amounts of plasmid containing the amplicon of interest, as previously described, and validated (Arukwe, 2006; Kortner et al., 2011). Data obtained from cDNA amplification were log transformed, averaged, and thereafter expressed as fold change of day 4 post-hatch larvae (control sample).
Statistical analysis
Statistics were performed with SPSS 18.0 for Windows. Normality and homogeneity of variances were tested with the Shapiro–Wilk W-test and Levene’s test, respectively. Significant differences between different larval stages were determined using One-way ANOVA followed by Tukey’s Multiple Comparison Test. To find the combined differences between diets and larval stages of the two dietary treatments, a two-way ANOVA was used, using larval stages as repeated measurement. The level of statistical significance was set at p < 0.05.
Results
Growth and survival
The cod larvae from both groups had similar growth rates up to 22 dph (mean 7 mm SL, stage 2). In the size range 7 - 15 mm SL (stages 2 – 4), the specific growth rate of the Copepod-fed cod larvae increased to about two times higher (15.5% day−1) than for the Rotifer/Artemia-fed larvae (8.6% day−1). After weaning to the same commercial formulated diet from around 15 mm SL (stage 4/5), they had similar specific growth rates (about 12% day−1) until the end of the experiment at around 49 mm SL (stage 6, the juvenile stage). With regards to time, larvae in the copepod-fed group reached a mean SL of 10 mm at about 30 dph, while larvae in the rotifer/Artemia-fed group reached 10 mm SL at around 40 dph. Cod larvae reached a mean SL of 49 mm at 73- and 84 dph in the copepod-fed and in the rotifer/Artemia-fed group, respectively.
Gene expression patterns (RNAseq) of whole cod larvae
The cod larvae had significantly more upregulated pcna expression at 7 – 10 mm SL (stage 2 – 3), and from 15 - 25 mm SL (stage 5) expression levels were no longer different from those in unfed yolk sac larvae (stage 0) in both larval groups as shown in Figure 2A.
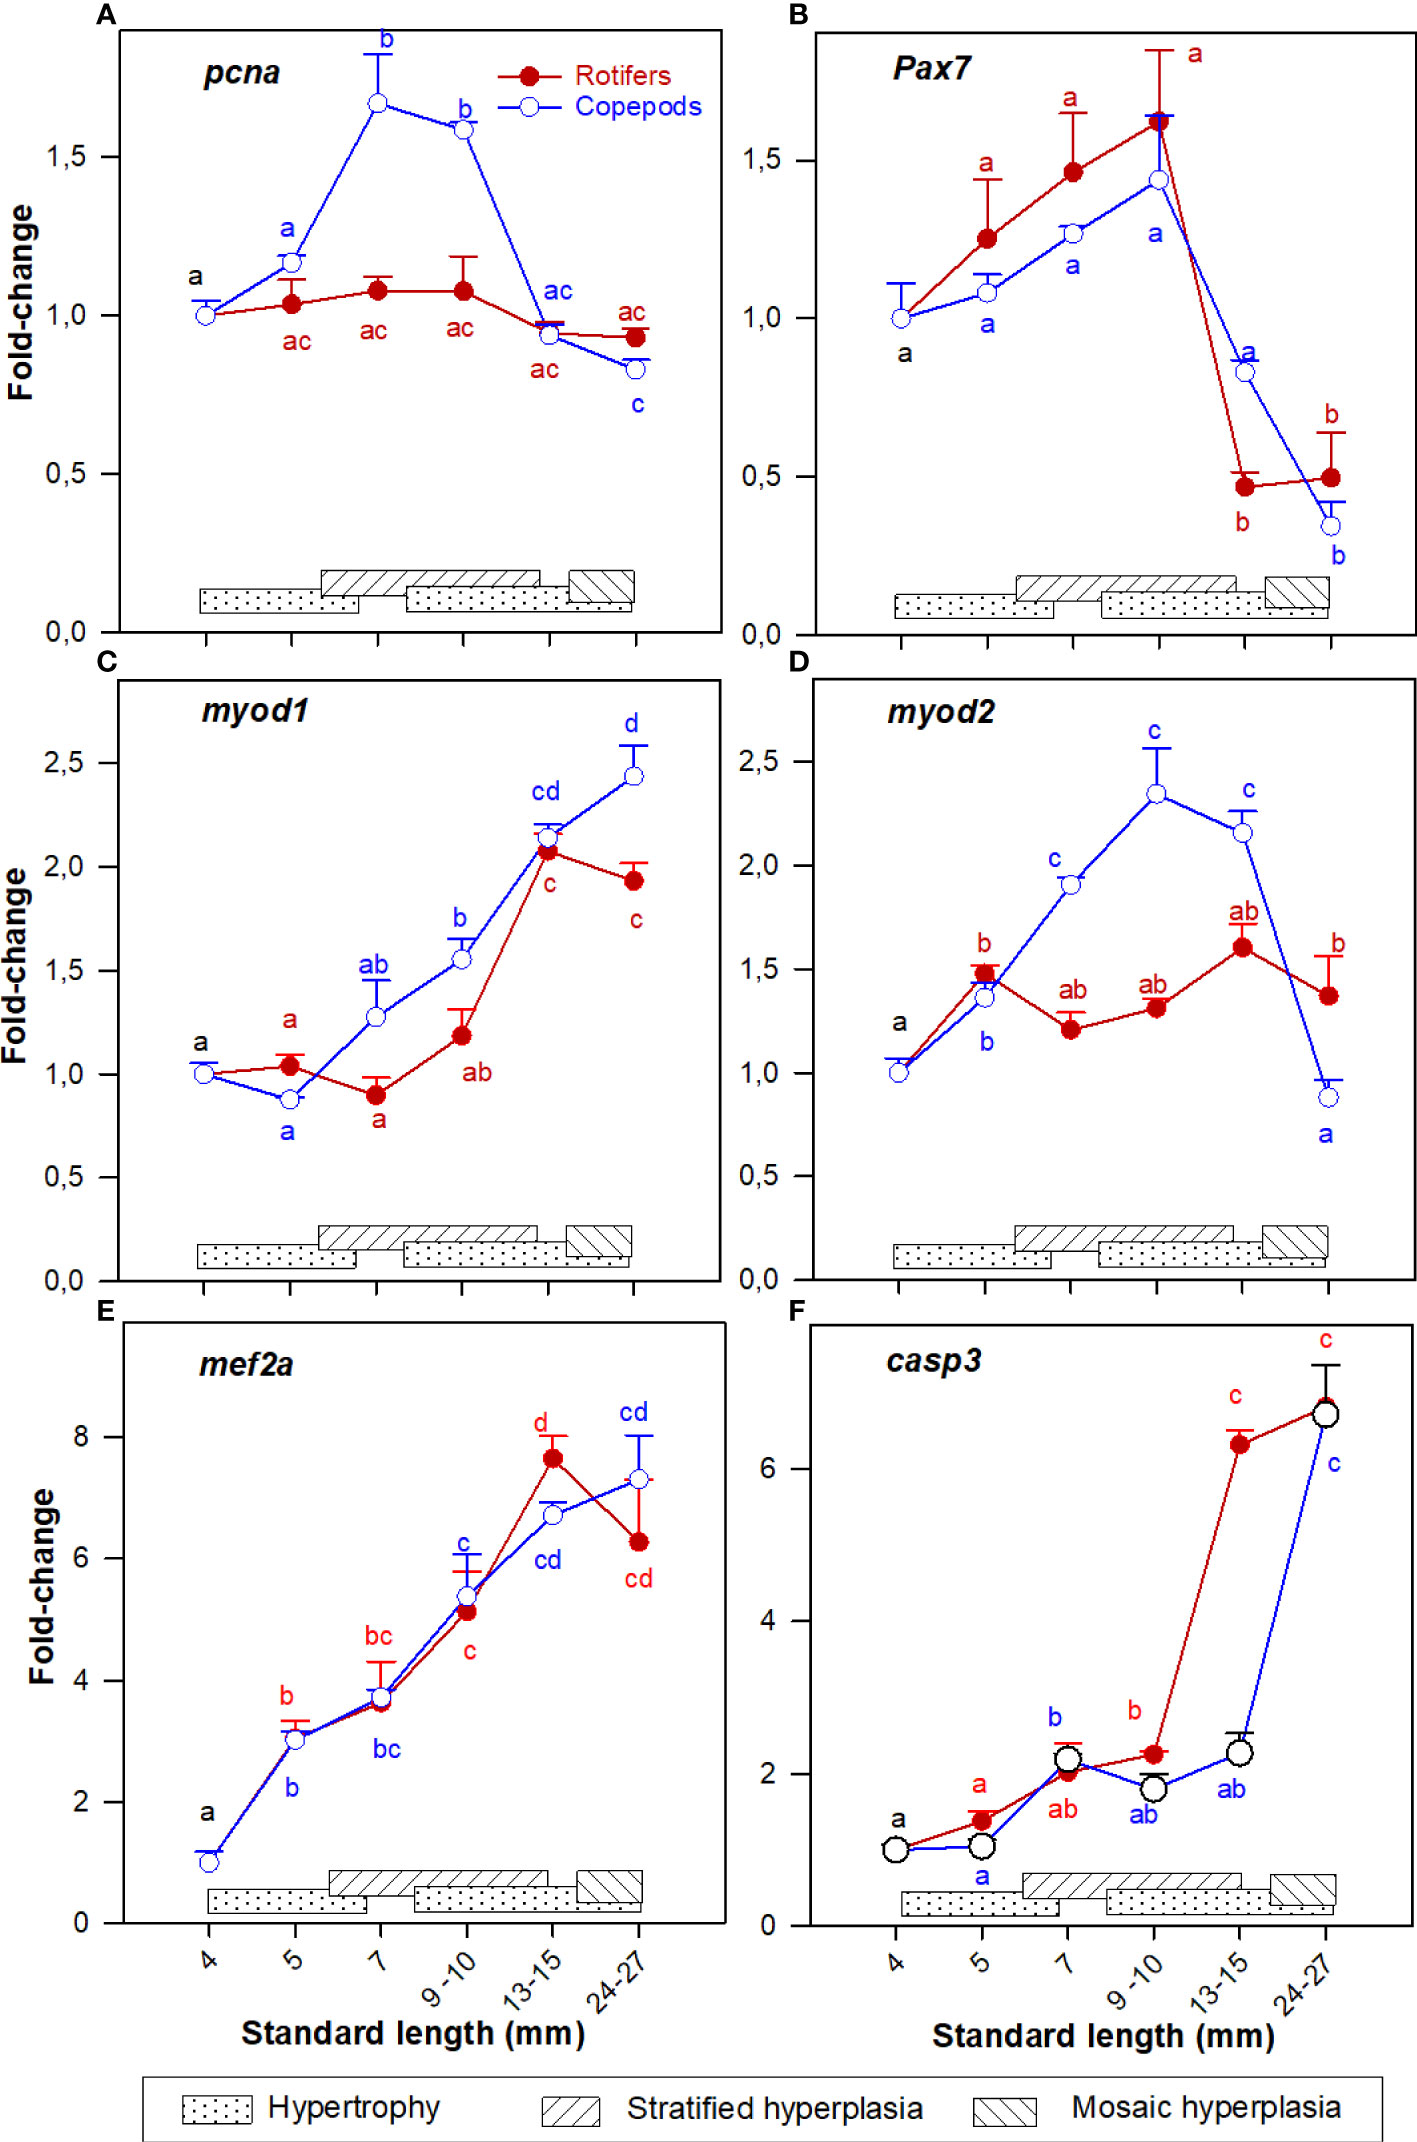
Figure 2 Gene expression (RNA-seq) of (A) pcna; (B) pax7; (C) myod1; (D) myod2; (E) mef2a; and (F) casp3 in whole-body Atlantic cod larvae fed rotifers/Artemia (red line) or Copepods (blue line) in relation to muscle growth dynamics. Muscle growth dynamics (hypertrophy and stratified and mosaic hyperplasia) in relation to body size is indicated by horizontal bars (data from Vo et al., 2016). Data are given as mean (n=3 [n= 4 at 4 dph] ± SEM) and values are expressed as fold change compared to day 4 post-hatch. Different letters indicate significant differences between the larval stages and treatments (P < 0.05).
The myogenic precursor cell (MPC) population (expression of pax7) was significantly upregulated in the 4 - 10 mm SL range (stages 0 – 3), then expression values decreased steadily in the 15 - 25 mm SL range, with no significant differences between the nutritional treatments (Figure 2B).
Further, the expression pattern of myod1 was more similar to mef2a expression (Figures 2C, E) while myod2 in Copepod-fed larvae showed a comparable expression pattern to pcna (Figures 2A, D),
Expression of pcna and myod2 were significantly more upregulated in the Copepod-fed larvae at 7 - 10 mm SL (Figures 2A, D). At 15 mm SL, the expressions of pcna, pax7, and myod2 (Figures 2A, B, D) were significantly higher in the Copepod-fed larvae than in the rotifer/Artemia-fed larvae.
Expression of casp3 approximately doubled between 4 and 10 mm SL in both groups. From then the casp3 gene in rotifer fed larvae was rapidly upregulated to six fold-change. This rapid upregulation of casp3 only occurred in Copepod-fed larvae from 15 mm SL onwards (Figure 2F).
Igf1 was continuously and significantly upregulated from 4 to 30 mm SL, while igf1r expression increased significantly at 5 mm SL and was stable thereafter. No significant differences in the expression of igf1 and igf1r were found between the two groups at any given body size (Figure 3).
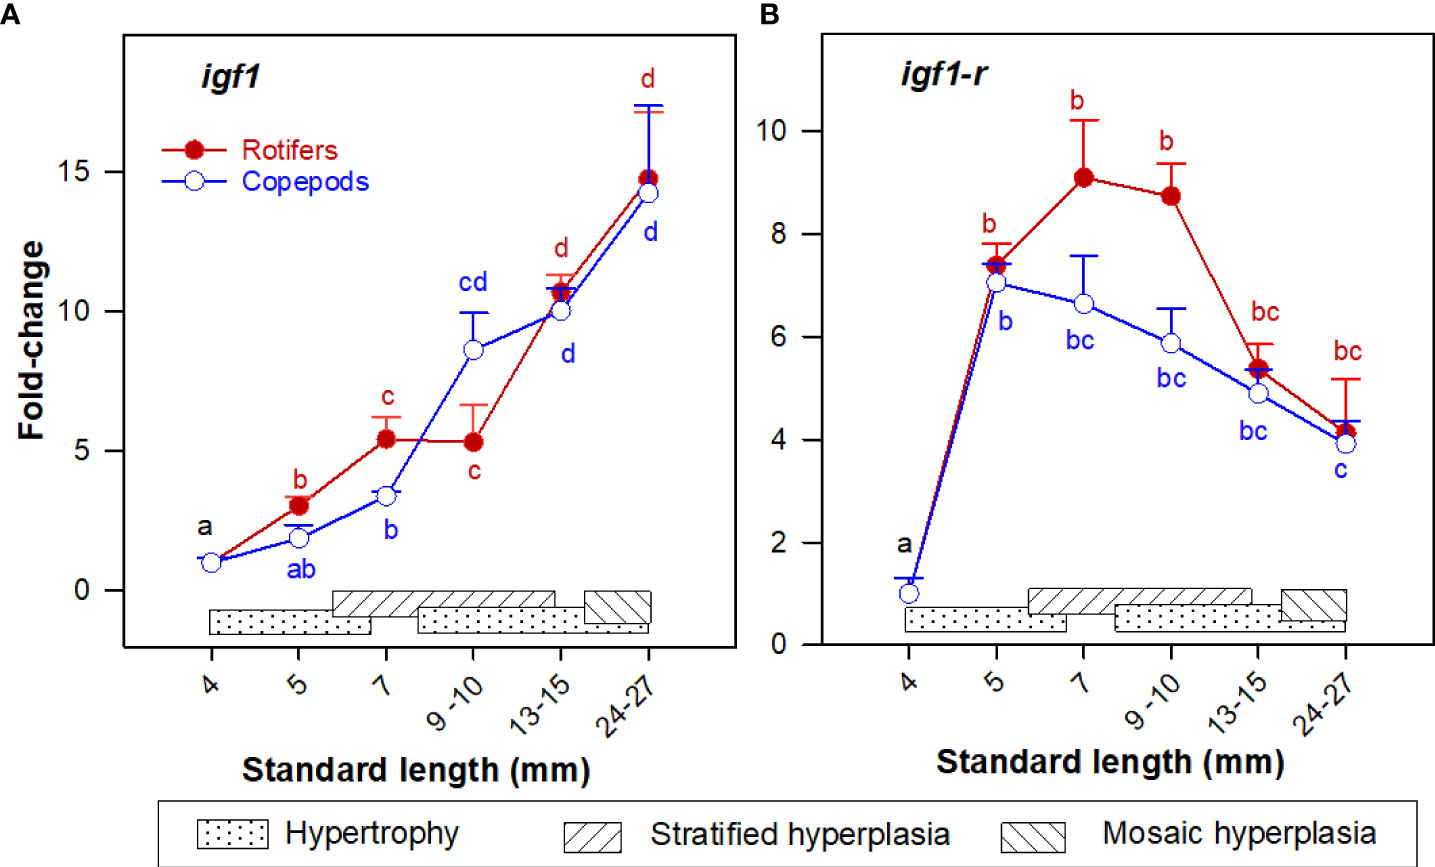
Figure 3 Gene expression (RNA-seq) of (A) igf1; and (B) igf1r in whole-body Atlantic cod larvae fed rotifers/Artemia (red line) or copepods (blue line) in relation to muscle growth dynamics. Muscle growth dynamics (hypertrophy and stratified and mosaic hyperplasia) in relation to body size are indicated by horizontal bars (data from Vo et al., 2016). Data are given as mean (n=3 [n= 4 at 4 dph] ± SEM) and values are expressed as fold change compared to day 4 post-hatch. Different letters indicate significant differences between the larval stages and treatments (P < 0.05).
The expression pattern of pfkl was relatively stable whereas pfkm continuously increased in both groups in the 7 - 30 mm SL size range (Figures 4A, B). The expression of fbp2 and ldhA were continuously upregulated from 7 to 30 mm SL (Figures 4C, D). The expression of slc2a11 was stable in the 4 – 15 mm SL range, and then increased significantly in the 15 - 30 mm SL range (Figure 4E), and expression values were significantly higher in Copepod-fed larvae in all stages after exogenous feeding started. The expression of ppar-α increased significantly in the 5-7 mm SL range, then decreased during development and the lowest levels in both groups were in the 15 – 30 mm SL range (Figure 4F).
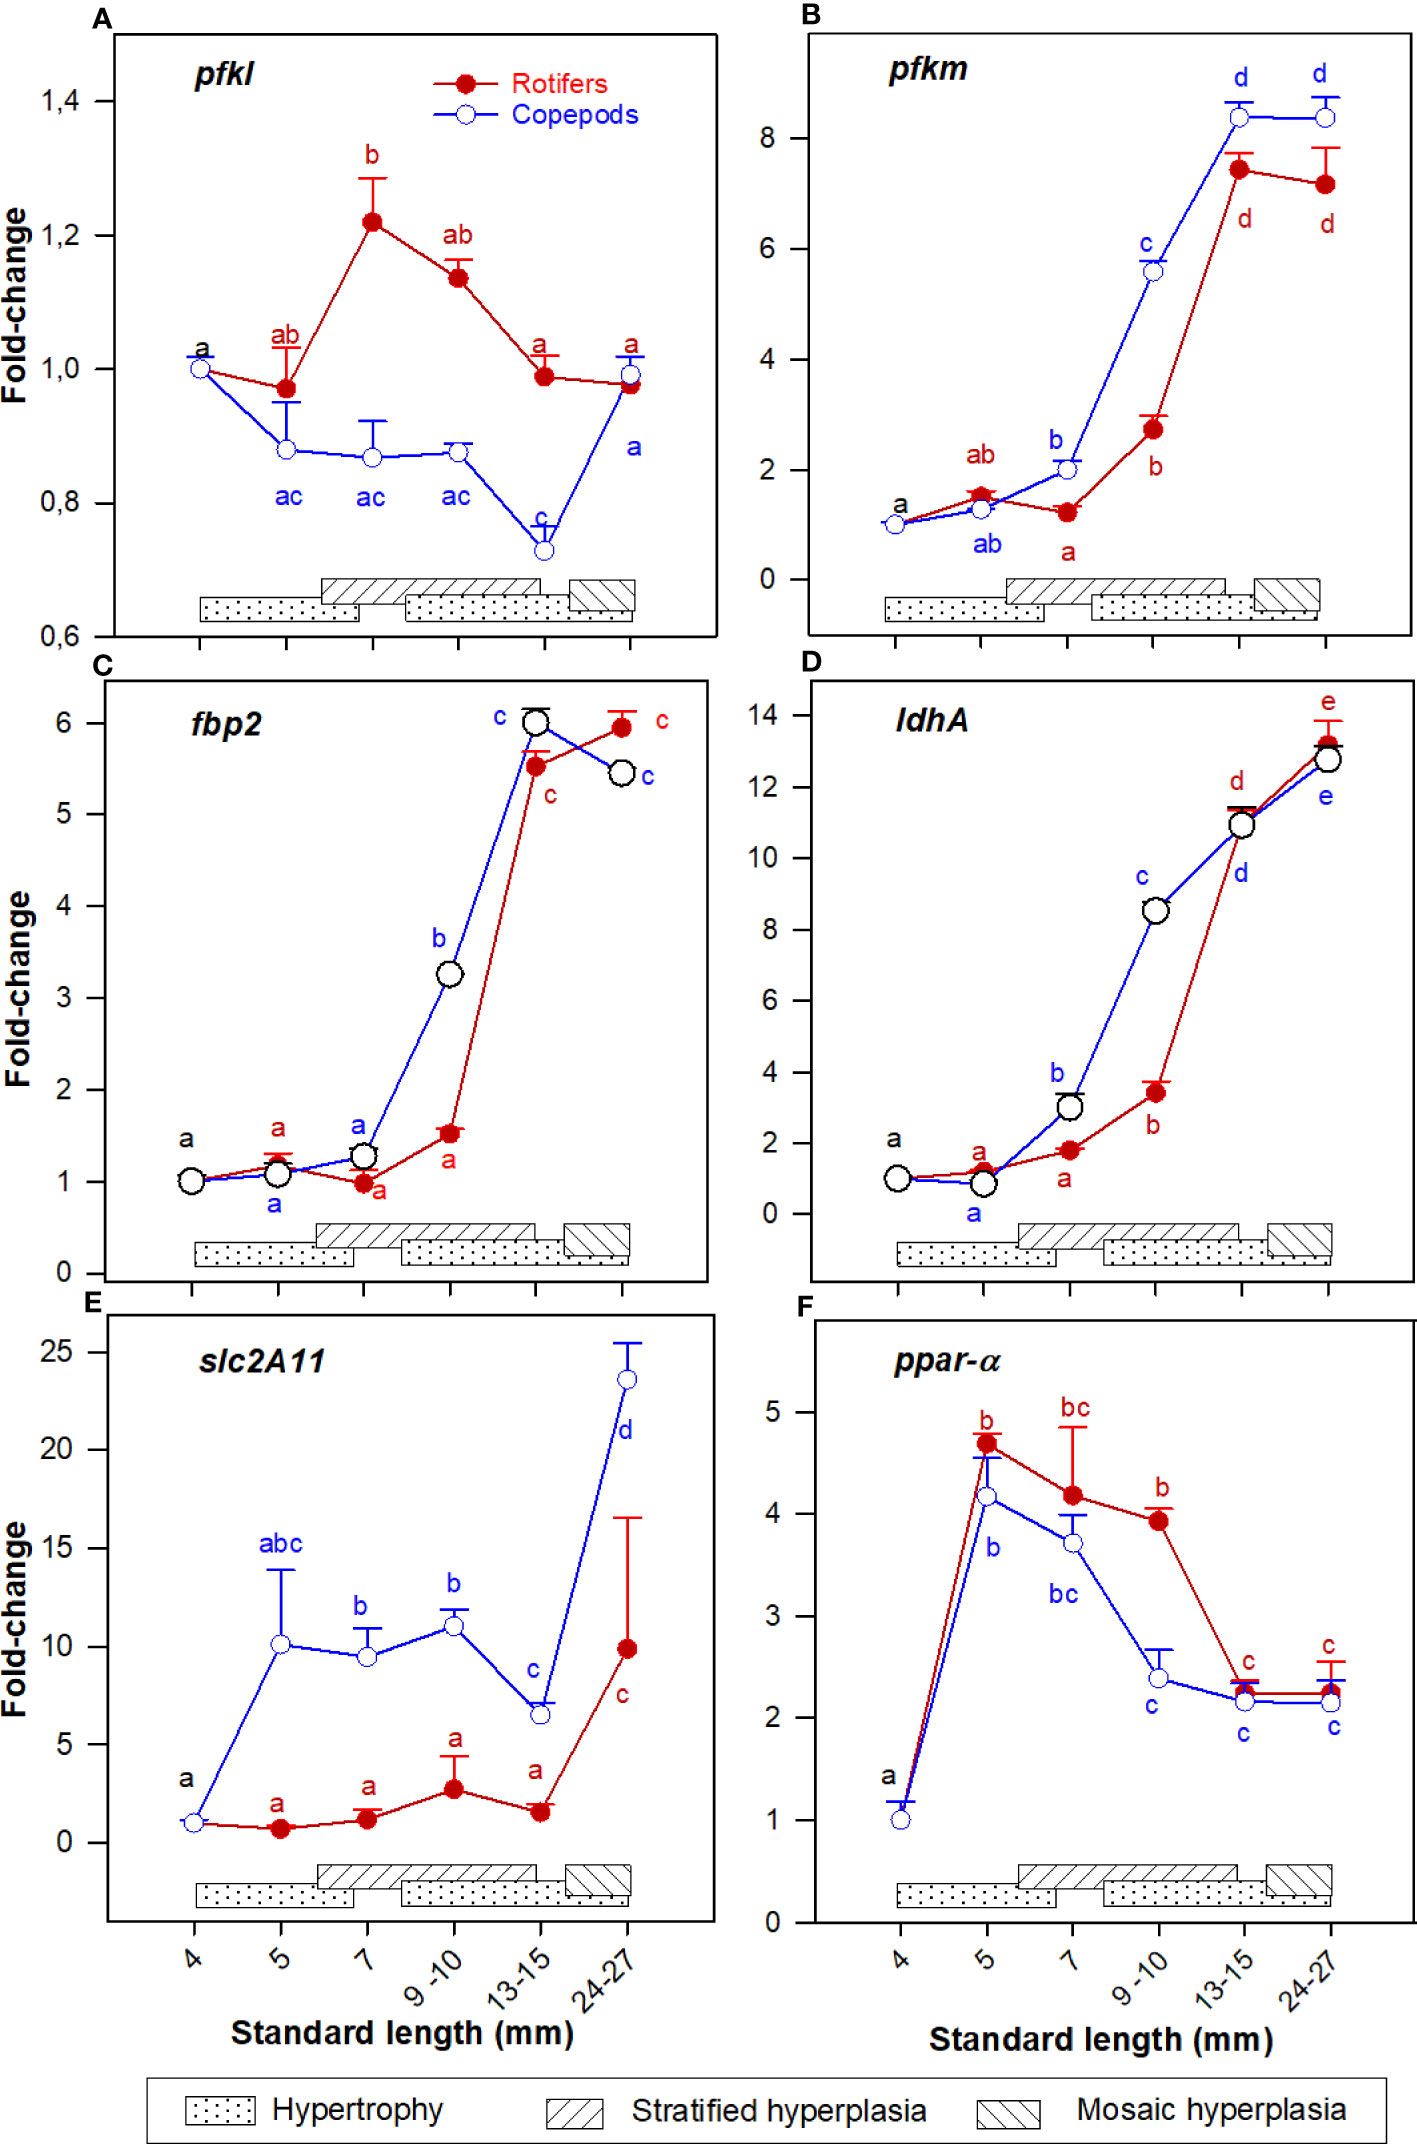
Figure 4 Gene expression (RNA-seq) of (A) pfkl; (B) pfkm; (C) fbp2; (D) ldhA; (E) slc2a11; and (F) ppar-a in whole-body Atlantic cod larvae fed rotifers/Artemia (red line) or Copepods (blue line) in relation to muscle growth dynamics: Muscle growth dynamics (hypertrophy and stratified and mosaic hyperplasia) in relation to body size are indicated by horizontal bars (data from Vo et al., 2016). Data are given as mean (n=3 [n= 4 at 4 dph] ± SEM) and values are expressed as fold change compared to day 4 post-hatch. Different letters indicate significant differences between the larval stages and treatments (P < 0.05).
At 7 and 10 mm SL the expressions of pfkm, fbp2 and ldhA (Figures 4B–D) were significantly higher in the Copepod-fed larvae. At 7, 10, and 15 mm SL the expression of slc2a11 (Figure 4E) was about 5 to 10 times higher in Copepod-fed larvae. At 10 mm SL, the expression of ppar-α (Figure 4F) was significantly higher in rotifer/Artemia-fed larvae than in the Copepod-fed larvae.
Gene expression patterns (qPCR) in skeletal muscle tissue
The cod larvae had upregulated pcna expression about 10 – 30 times at 7 – 10 mm SL (stage 2 – 3), and from 15 - 25 mm SL (stage 5) expression levels were no longer different from those in unfed yolk sac larvae (stage 0) in both larval groups, as shown in Figure 5A. The myogenic precursor cell (MPC) population (expression of pax7) continuously increased in the 4 - 10 mm SL range (stages 0 – 3), then values decreased steadily in the 10 - 40 mm SL range (Figure 5B). Myod1 and myodh1 expressions in both cod larval groups increased in the 4 – 15 mm SL range, then slightly decreased and remained stable in the 25 – 40 mm SL range (Figures 5C, D).
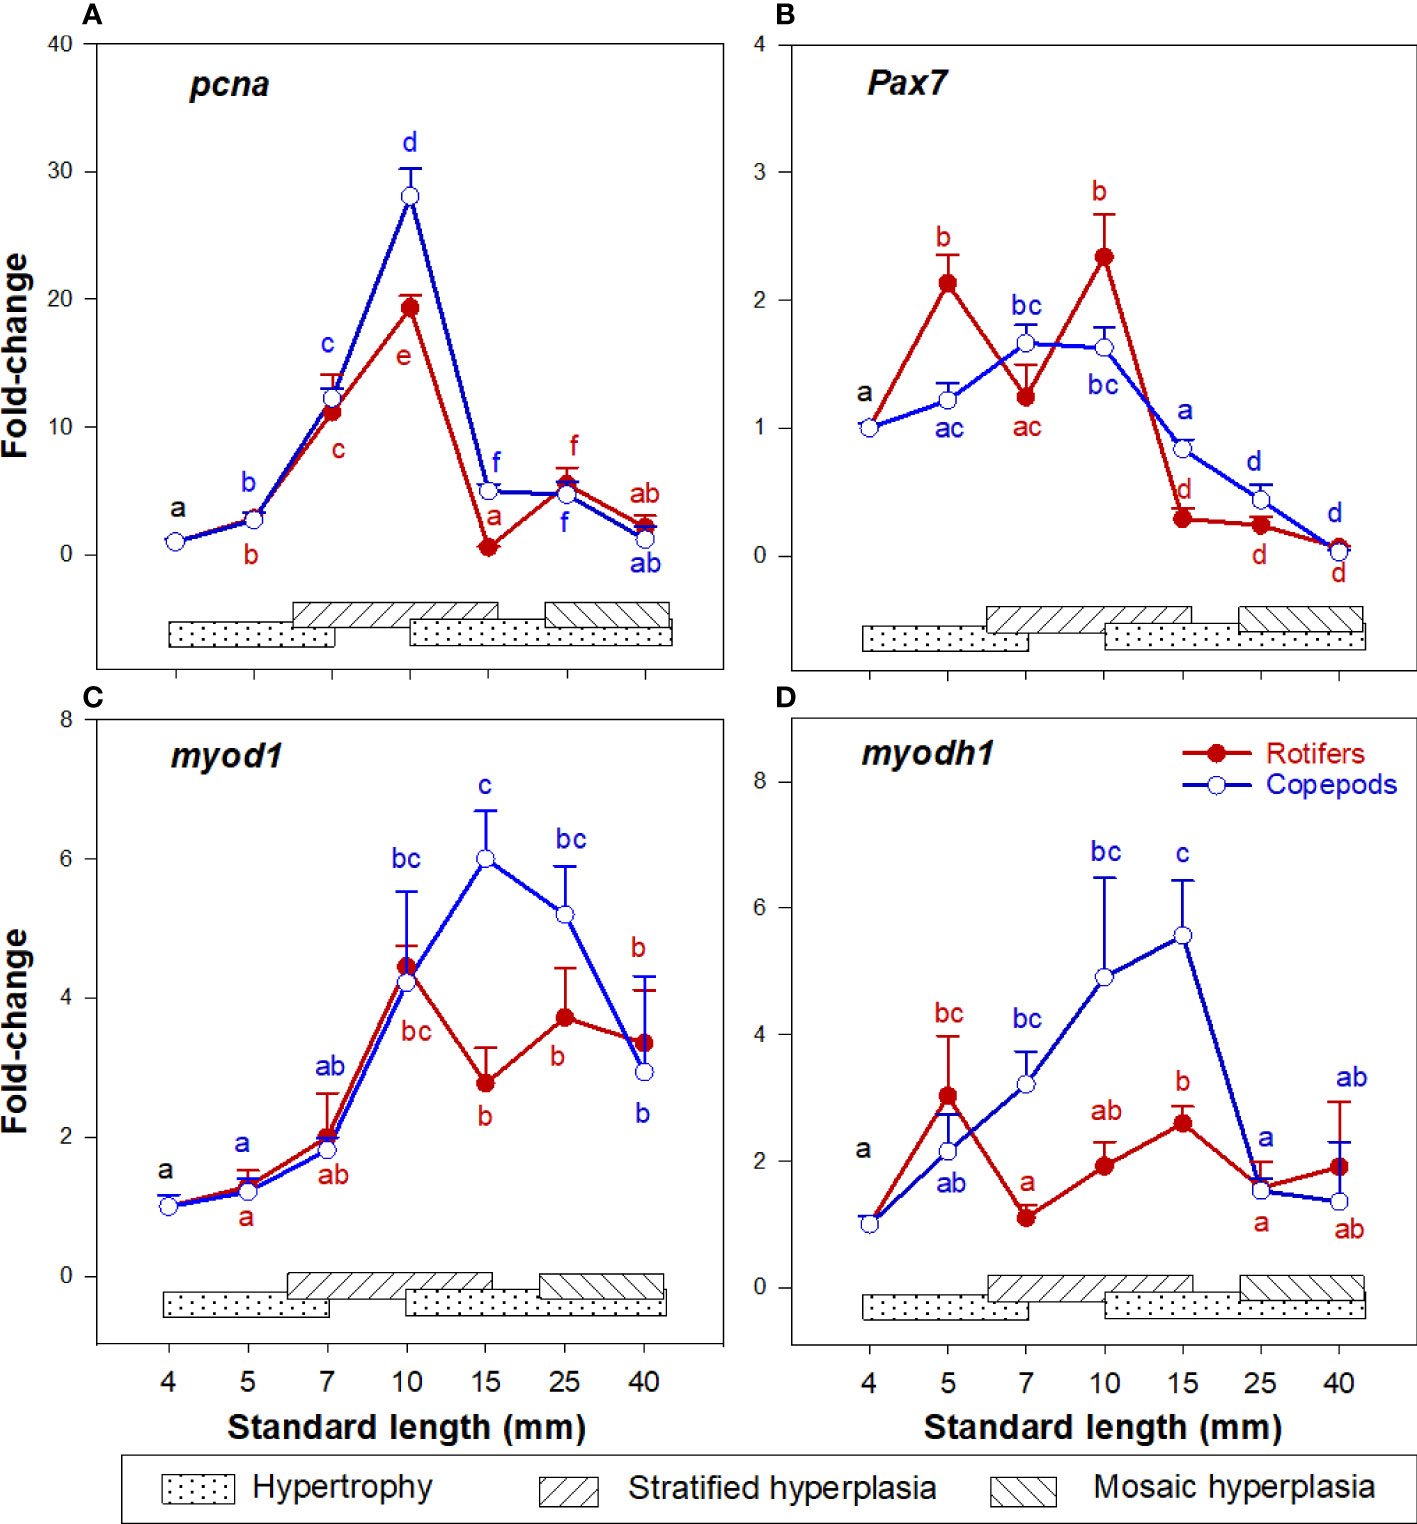
Figure 5 Gene expression (qPCR) of (A) pcna; (B) pax7; (C) myod1; and (D) myodh1 in skeletal muscle tissue of Atlantic cod larvae fed rotifers/Artemia (red line) or Copepods (blue line) (quantitative real-time PCR (qPCR) in relation to muscle growth dynamics: Muscle growth dynamics (hypertrophy and stratified and mosaic hyperplasia) in relation to body size is indicated by horizontal bars (data from Vo et al., 2016). Data are given as mean (n= 4 ± SEM) and values are expressed as fold change compared to day 4 post-hatch. Different letters indicate significant differences between the larval stages and treatments (P < 0.05).
At 10 mm SL, the expression of pcna was more upregulated in the Copepod-fed larvae, and at 15 mm SL the expressions of pcna, pax7, myod1 and myodh1 (Figures 5A–D) were significantly higher in the Copepod-fed larvae than in the rotifer/Artemia-fed larvae.
In both larval groups the expression patterns of sod1 and sod2 continuously increased in the 4 – 10 mm SL range, peaking at 10 mm SL (stage 3) and then decreased 15 - 40 mm SL (Stages 4- 6) (Figures 6A, B). The expression pattern of cat decreased in both groups in the 4 - 15 mm SL range and increased somewhat in the 25 - 40 mm SL range (Figure 6C). Further, gpx1 expression pattern was relatively low and stable in the 4 – 15 mm SL range, and then increased about 10 – 20 folds at 25- and 40-mm SL (Figure 6D), although no significant difference between the groups was observed at 40 mm SL. The expression pattern of nox1 was stable at 4 – 5 mm SL, peaking at 7 mm SL, and decreasing thereafter from 10 to 40 mm SL (Figure 6E). Expression pattern of p38 increased continuously from 4 to 10 mm SL, then decreased from 10 to 40 mm SL in larvae from both feeding groups (Figure 6F). Also, at 15 mm SL, the expression of p38 was significantly higher in Copepod-fed larvae (Figure 6F). In the largest larvae around 40 mm SL, no significant differences were found for any of the ROS-related genes between the larval groups.
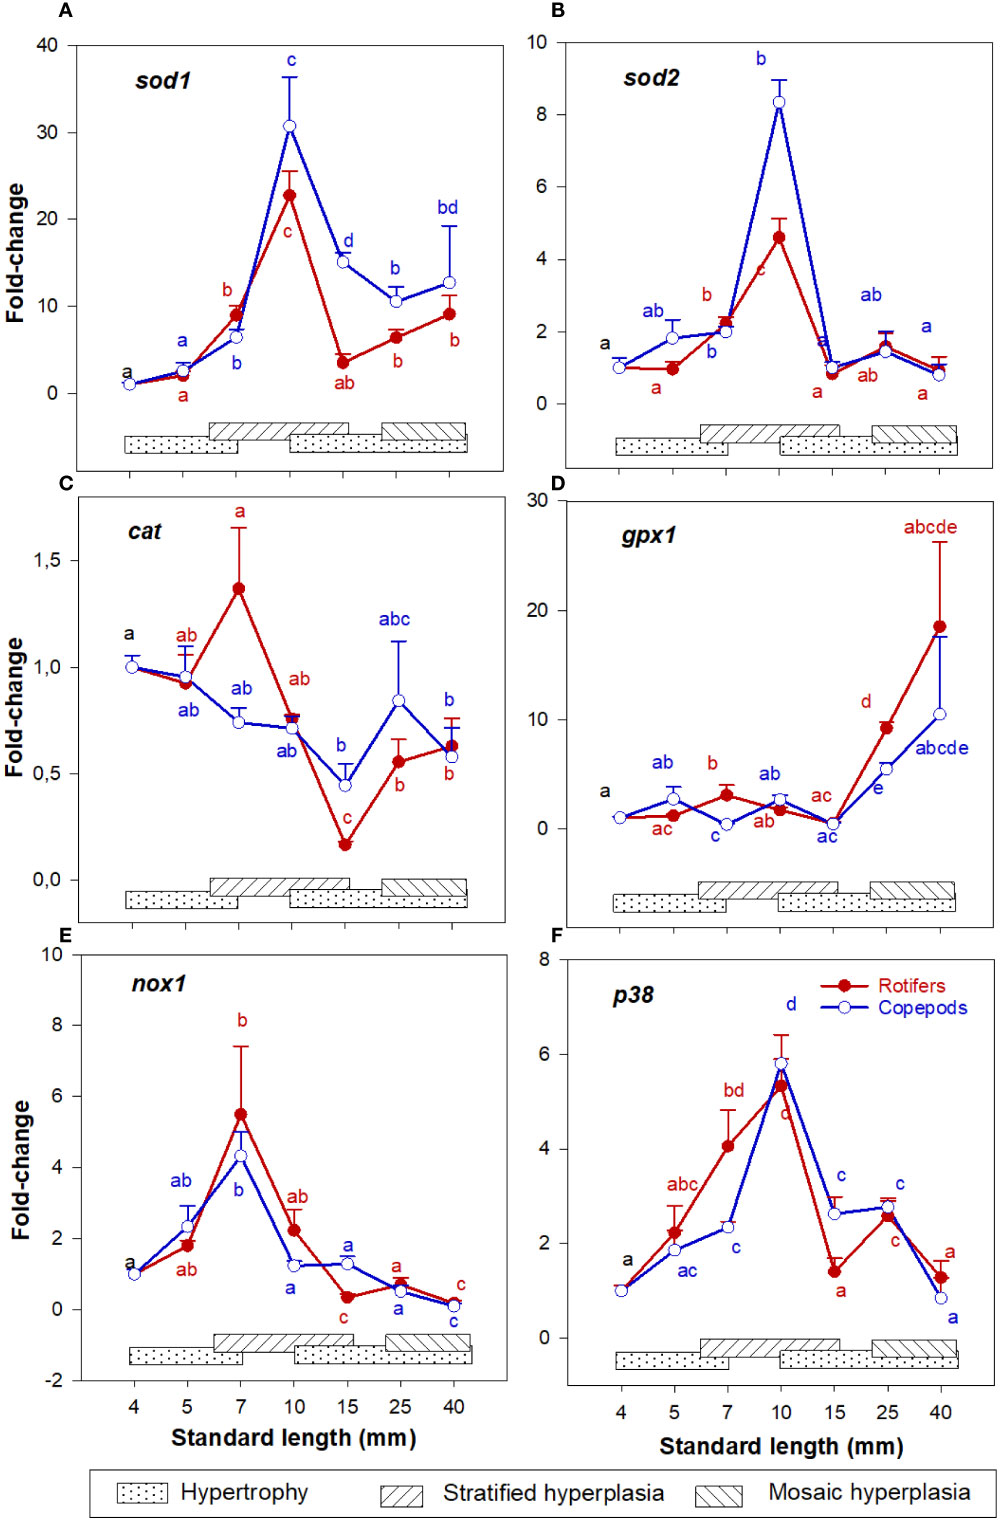
Figure 6 Gene expression (qPCR) of (A) sod1; (B) sod2; (C) cat; (D) gpx1; (E) nox1; and (F) p38 in skeletal muscle tissue of Atlantic cod larvae fed rotifers/Artemia (red line) or Copepods (blue line) in relation to muscle growth dynamics. Muscle growth dynamics (hypertrophy and stratified and mosaic hyperplasia) in relation to body size is indicated by horizontal bars (data from Vo et al., 2016). Data are given as mean (n= 4 ± SEM) and values are expressed as fold change compared to day 4 post-hatch. Different letters indicate significant differences between the larval stages and treatments (P < 0.05).
Discussion
Identifying key factors promoting growth in Atlantic cod larvae
Cod larvae fed copepods had a much higher growth rate than those fed rotifers/Artemia, and the dietary effects should be due to the prey’s composition of protein, lipids, as well as micronutrients. The level of protein is about two times higher in copepods than in rotifers and Artemia, and is one of the key factors generating the growth variations between the two larval groups (Karlsen et al., 2015). Finn et al. (2002) found that in cod larvae fed copepods the contribution of protein to energy fuel was at a high level in the 4 – 7 mm SL range and started declining beyond 7 mm SL.
Another major factor related to the larval growth difference in this experiment, is the dietary long-chained polyunsaturated fatty acids (PUFAs). Marine larvae have high requirements of PUFAs (Izquierdo et al., 2000), and lipid composition in the copepods is very different from that of enriched rotifers and Artemia. The essential dietary highly unsaturated n-3 fatty acids (HUFAs) docosahexaenoic acid (DHA) and eicosapentanoic acid (EPA) are incorporated in the phospholipids (PL) of the copepods, whereas they are included in the triacyl-glycerides (TAG) in enriched rotifers and Artemia (Evjemo et al., 2003; Van der Meeren et al., 2008). Marine fish larvae can utilize the dietary PUFAs more efficiently for growth and normal development if they are incorporated in the PL than in the TAG (Gisbert et al., 2005; Kjørsvik et al., 2009; Wold et al., 2009; Olsen et al., 2014). In marine larvae, these PL requirements seem to decline towards the juvenile stage (Tocher et al., 2008; Cahu et al., 2009).
Ppar-α is a key nuclear receptor for regulation of liver and skeletal muscle lipid metabolism and glucose homeostasis (Lefebyre et al., 2006). However, ppar-α is also one of the key transcriptional regulators of intermediary metabolism during fasting in mammals. It induces hepatic fatty acid oxidation, regulates hepatic glucose production, and affects amino acid metabolism (Kersten, 2014). In our experiment, larval expression of ppar-α had a similar developmental pattern in larvae from both treatments. It was rapidly upregulated between 4- and 5-mm SL (4 – 11 dph), which is the short period of first exogenous feeding, when some yolk reserves are still present (“mixed feeding period”) and larval digestion switches from endogenous to exogenous nutrients (Hoehne-Reitan and Kjørsvik, 2004). It was significantly more upregulated in 5-10 mm SL rotifer-fed larvae, and it was similar between the groups from 15 mm SL, when stratified hyperplasia was ending and all larvae were weaned to the same formulated diet.
Ppar-α in the cod larvae was rapidly upregulated when their yolk nutrients were diminishing, and they had to start exogenous feeding. The higher expression level of ppar-α in the rotifer fed larvae during the live feed period was thus most likely due to suboptimal nutrition, especially during the period with slowest growth. Both sea bass (Vagner et al., 2009) and Siberian sturgeon larvae (Luo et al., 2019) demonstrated lower growth and upregulated mRNA levels of ppar-α and other genes involved in fatty acid transport during feeding with low levels of n-3 HUFAs, and differences in ppar-α levels disappeared in older larvae and juveniles, just as we found in this experiment.
The largest growth variation between our two larval groups was found from 7 to 10 mm SL (stage 2-3), which is also the strongest phase of stratified muscle hyperplasia (Vo et al., 2016). Our present results demonstrate that the gene expression of glycolysis, gluconeogenesis, oxidative phosphorylation and lactate flux were significantly higher in Copepod-fed larvae than in rotifer/Artemia-fed larvae in this size range, and this could result in higher enzyme activities in the Copepod-fed larvae. The glycolytic enzyme activity of white muscle tissue increases with body size (Somero and Childress, 1980; Sullivan and Somero, 1983), with a high rate of lactate production in the white muscle during maximal burst-type activity (anaerobic power) (Goolish, 1989). Fish larvae rely almost entirely on aerobic power until climax metamorphosis (Wieser, 1995), which occurs from around 10 mm SL in cod larvae (Vo et al., 2016). A higher ratio of dietary carbohydrate in diets promotes the rates of glycolysis and gluconeogenesis in gilthead seabream (Sparus aurata) (Metón et al., 1999) and in zebrafish, (Danio rerio) (Rocha et al., 2015). Carbohydrate content ranges from 0.2 to 5.1% of dry weight in copepods (Corner and O’Hara, 1986) and from 10 to 27% in rotifers (Støttrup and McEvoy, 2003), and fish do not seem to utilize carbohydrates effectively (Wilson, 1994; Moon, 2001).
Proliferating cells rely on aerobic glycolysis with a high rate of lactate generation (about 90% of total glucose consumption) for macromolecular synthesis, but they need a high energy supply from oxidative phosphorylation (Warburg, 1956; Vander Heiden et al., 2009; Lunt and Vander Heiden, 2011) . In general, lactate is generated in muscle, then circulated to the liver, where lactate is converted back to glucose by gluconeogenesis, called the Cori cycle (Cori and Cori, 1929). Lactate is now known as the primary production for spatially linking glycolysis to oxidative phosphorylation (Rogatzki et al., 2015), as it is a major carbon source to generate ATP via oxidative phosphorylation in mitochondria in most tissues in mice and humans (Faubert et al., 2017; Hui et al., 2017). In the 7 – 10 mm SL range (stage 2-3) of cod larvae, a high density of mitochondria was observed not only in red muscle fibers but also in new white muscle fibers (Vo et al., 2016). The number of new white muscle fibers account for more than 90% of the total number of muscle fibers in the 7 – 10 mm SL range (Vo et al., 2016). At this stage, lactate generated by proliferating cells thus has a high potential to go through oxidative phosphorylation in red and new muscle fibers.
However, Chauton et al. (2015) found that the content of lactate was higher in the rotifer/Artemia-fed larvae than in the Copepod-fed larvae from around 9 - 25 mm SL. Cod larvae fed rotifers/Artemia also had a significantly higher glycogen store in the liver than larvae fed copepods at around 6 -7 mm SL (Kjørsvik, pers. comm.). These data suggest that lactate and glucose sources were highly available, but larvae were unable to convert it all to energy for growth when they were fed rotifers/Artemia. Our present results (ldhA, pfk, slc2a11) also showed that the glucose metabolism was triggered, and that it contributed to the energy needed from around 7 mm SL in cod larvae fed copepods, whereas this occurred only from 10 mm SL in larvae fed rotifers/Artemia.
We found no differences between the larval groups in the transcript levels of igf1 and igf1r in the present study, similar to Katan et al. (2016) who did not find differences in hormones and hormone receptors (igf1, igf2, growth hormone (gh), gh1r, gh2r and myostatin (mstn)) between cod larvae fed natural zooplankton or rotifers and Artemia. However, the expression of slc2a11 (muscle-specific fructose transport facilitators) was about 5 to 10 times higher in Copepod-fed larvae than in rotifer/Artemia-fed larvae in the 5 – 15 mm SL range (the live prey feeding period). Exercise is now known as an important factor for promoting glucose metabolism (by up to 50-fold) by increasing the delivery and transport across the muscle membrane and intracellular flux in humans (Sylow et al., 2017). Cod larvae need to use higher swimming speeds (intense burst) for capturing fast swimming prey (copepods) than for slow swimming prey (rotifer or protozoan), and there are less escape responses when cod larvae attack slow-swimming prey rather than the fast prey organisms (Hunt von Herbing and Gallager, 2000). Moreover, at around 10 mm SL, the expression of sod2 in skeletal muscle was significantly higher in the Copepod-fed larvae than in the rotifer/Artemia-fed larvae. Sod2 is responsible for rapidly converting superoxide, which is generated by mitochondria during muscle contraction to hydrogen peroxide (H2O2) (Fridovich, 1997). Cod larvae thus probably need to use a higher swimming speed and spend more time for hunting copepods than for rotifers and Artemia. In other words, the duration of active swimming of cod larvae would be higher in those fed copepods than in those fed rotifers/Artemia. This probably led to a better delivery and transport across the muscle membrane, and to intracellular flux through glycolysis and oxidative phosphorylation. We therefore propose that active swimming may be a key factor for enhancing muscle growth, in terms of utilizing the available energy sources for growth.
A high level of taurine in skeletal muscle is vital for excitation-contraction coupling, organelle structure and regulation of skeletal muscle energy metabolism during exercise (Ito et al., 2014). In the present experiment, taurine and zinc were at least ten times higher in copepods than in rotifers and Artemia (Karlsen et al., 2015), which could affect the swimming capacity of the cod larvae. Taurine deficiencies result in lipid accumulation, mitochondrial damage, and oxidative stress (Militante and Lombardini, 2004; Espe et al., 2012; Jong et al., 2012; Espe and Holen, 2013; Jong et al., 2021),. The low levels of zinc in rotifers and Artemia could have negative effects on the enzymatic activity of sod1. Enzymatic activity of sod1 depends on the presence of Cu and Zinc for proper protein folding and stability (Fukai and Ushio-Fukai, 2011; Marreiro et al., 2017). In larvae from our experiment, this would probably lead to accumulation of superoxide, more associated with oxidative stress than with redox signaling, from around 7 mm SL in rotifer/Artemia-fed larvae. Rise et al. (2015) also found that the redox system in cod larvae fed rotifers/Artemia was affected by a low level of selenium, which plays an important role in stabilizing the function of sod1 (Rükgauer et al., 2001). Copepods generally contain much higher levels of minerals than cultivated rotifers and Artemia sp. (Mæhre et al., 2013). Therefore, high concentrations of taurine and minerals in larval diets may be crucial for achieving high muscle contractions, with subsequent and stabilized ROS levels and improved growth in cod larvae; especially in the 4 – 10 mm SL range when the most intense stratified hyperplastic muscle growth is occurring.
External and internal drivers in cod larval muscle growth dynamics
We previously found that muscle growth dynamics (relationship between hypertrophy and hyperplasia) is strongly related to body size in Atlantic cod larvae (Vo et al., 2016). Although the molecular developmental patterns between larval groups were similar, the myogenic genes (pcna, pax7, myod) showed a stronger upregulation in Copepod-fed larvae.
Muscle differentiation (mef2a expression) always occurred, the mef2a expression was increasing throughout development, and no difference was observed between the treatments. Hypertrophy is the predominant early growth mechanism in cod larval muscle from 4 to 7 mm SL (Vo et al., 2016), which requires enhanced synthesis of muscle protein and muscle membranes (Valente et al., 2013). Muscle proliferation (stratified hyperplasia), as shown by pcna expression, occurred in the 5 - 15 mm SL range (stage 1-4), peaking at 10 mm SL, which is similar to our observations from histology of cod larvae from other experiments (Vo et al., 2016). Muscle proliferation would also increase the number of mitochondria in the muscle, which was indirectly confirmed as we found a peak in ROS-signaling and hydrogen peroxide (H2O2) generation (sod1 and sod2 expressions) in larvae around 10 mm SL. In aerobic organisms, superoxide is often produced by mitochondria and NADPH oxidases (NOXs family) (Fridovich, 1997; Brand, 2010). Whereas ROS production by mitochondria is more related to intracellular signaling, ROS from the NOXs family are cell membrane proteins that can be signaling intracellularly and extracellularly (Brown and Griendling, 2009; Finkel, 2011). The extracellular ROS from the NOXs family regulate gene expression, and proliferation, differentiation, and migration of cells in mammals (Lambeth, 2004; Bedard and Krause, 2007; Brown and Griendling, 2009). The gene expression of cell membrane proteins such as nox1 and igf1r peaked at 7 mm SL (stage 2) in both cod larval groups. Therefore, the NOXs family might be an important source of ROS, leading to the increasing ROS levels we observed in cod muscle at the onset of stratified hyperplasia growth around 7 mm SL (see also Penglase et al., 2015).
The highest expressions of sod1, sod2, and pcna in the skeletal muscle tissue (qPCR) were found around 10 mm SL (stage 3) and their expressions were dramatically decreased from 15 mm length (stage 4) in both cod larval groups. At around 10 mm length, cod larvae change from a viscous to a transitional swimming mode (Peck et al., 2006), and the larvae increase their swimming activity exponentially (Peck et al., 2006; Stanley et al., 2012). Hence, decreasing values thereafter of sod1 and sod2 in skeletal muscle in cod larvae in both larval groups, might be the first response of the defense antioxidant system for controlling the levels of hydrogen peroxide (H2O2). However, this could probably result in accumulation of superoxide (), which is more associated with oxidative stress than redox signaling (Fridovich, 1997). The expression patterns of cat and gpx1 were relatively stable in the 4 – 15 mm SL range, and gpx1 increased significantly at 25 mm SL (stage 5) in both larval groups. Penglase et al. (2015) also found that the redox potential (the 2GSH/GSSG concentrations) were significantly higher in the 5 - 10 mm SL range than in the 15 – 25 mm SL range in larvae from the present experiment. Significant changes in these ratios are usually a sign of oxidative stress, and causing toxicity rather than signaling (Murphy, 2011). Moreover, the expressions of p38 (muscle, qPCR) and casp3 (whole body, RNAseq) increased to the highest level at 10 and 15 – 25 mm SL, respectively. The cells will respond to a low oxidative stimulus of hydrogen peroxide (H2O2) by activating p38 to inhibit cell proliferation (Iwasa et al., 2003) and by expressing casp3 before or at the stage of lost cell viability (apoptosis) (Porter and Jänicke, 1999). Overall, from around 10 mm SL, ROS levels in skeletal muscle cells probably reached a lower stress level due to an expanded duration of active swimming of the cod larvae. In response, p38 and casp3 would inhibit the MPC proliferation or even commit to cell death programming in muscle at around 10 - 15 mm SL, leading to a decrease in and/or an ending of the stratified hyperplastic phase in skeletal muscle.
The expression of p38, cat, and gpx1 in skeletal muscle was higher in the rotifer/Artemia-fed larvae than in the Copepod-fed larvae at 7 mm SL. Penglase et al. (2015) also found that from 5 to 7 mm SL the redox potential decreased significantly in rotifer-fed cod larvae but was stable in Copepod-fed larvae. At low oxidative stress, p38 is often selectively activated for mitotic arrest without apoptosis induction (Kurata, 2000), and the prolonged mitotic arrest could trigger partial activation of apoptosis (Orth et al., 2012). To grow from 7 to 10 mm SL, rotifer-fed larvae needed 10 days more than Copepod-fed larvae in this experiment. Moreover, the expression of casp3 (regulating apoptosis and inhibiting proliferation) reached the highest level at a smaller size in rotifer-fed larvae (from around 15 to 25 mm SL) than in Copepod-fed larvae (from around 25 mm SL). At around 15 mm SL (at the end of stratified muscle hyperplasia), the number of MPCs (seen by the expression of pax7, pcna, myod1 and myodh2) was significantly higher in the Copepod-fed larvae than in the rotifer/Artemia-fed larvae. This corresponds well with our observation that at a given body size, mosaic hyperplasia in the early and late juvenile stages were stronger in Copepod-fed larvae (Vo et al., 2016). Therefore, the prolonged proliferation at a low stress level could reduce the generation of MPC numbers during the stratified hyperplasia phase, which would be the underlying mechanism of the observed long-term effects of live prey types on muscle growth potential in cod larvae.
Conclusion
The proposed correlation between muscle development and growth dynamics, external and internal drivers and energy metabolism in cod larvae fed different live prey types are summarized in Figure 7. Although the growth rates of cod larvae were significantly different between the two larval groups, shifts in gene expressions related to muscle growth dynamics between hypertrophy and hyperplasia and the generation and regulation of ROS mostly occurred around 5, 10, and 15 mm SL. These body sizes coincided with when cod larvae start the viscous, transitional, and inertial swimming modes, reflecting the relative changes between viscous and inertial forces of seawater on the swimming capabilities of the cod larvae. We suggest that the viscous forces of seawater and ROS levels in muscle tissue might be the external and internal drivers for shifts in muscle growth dynamics in cod larvae around 5, 10, 15 mm SL.
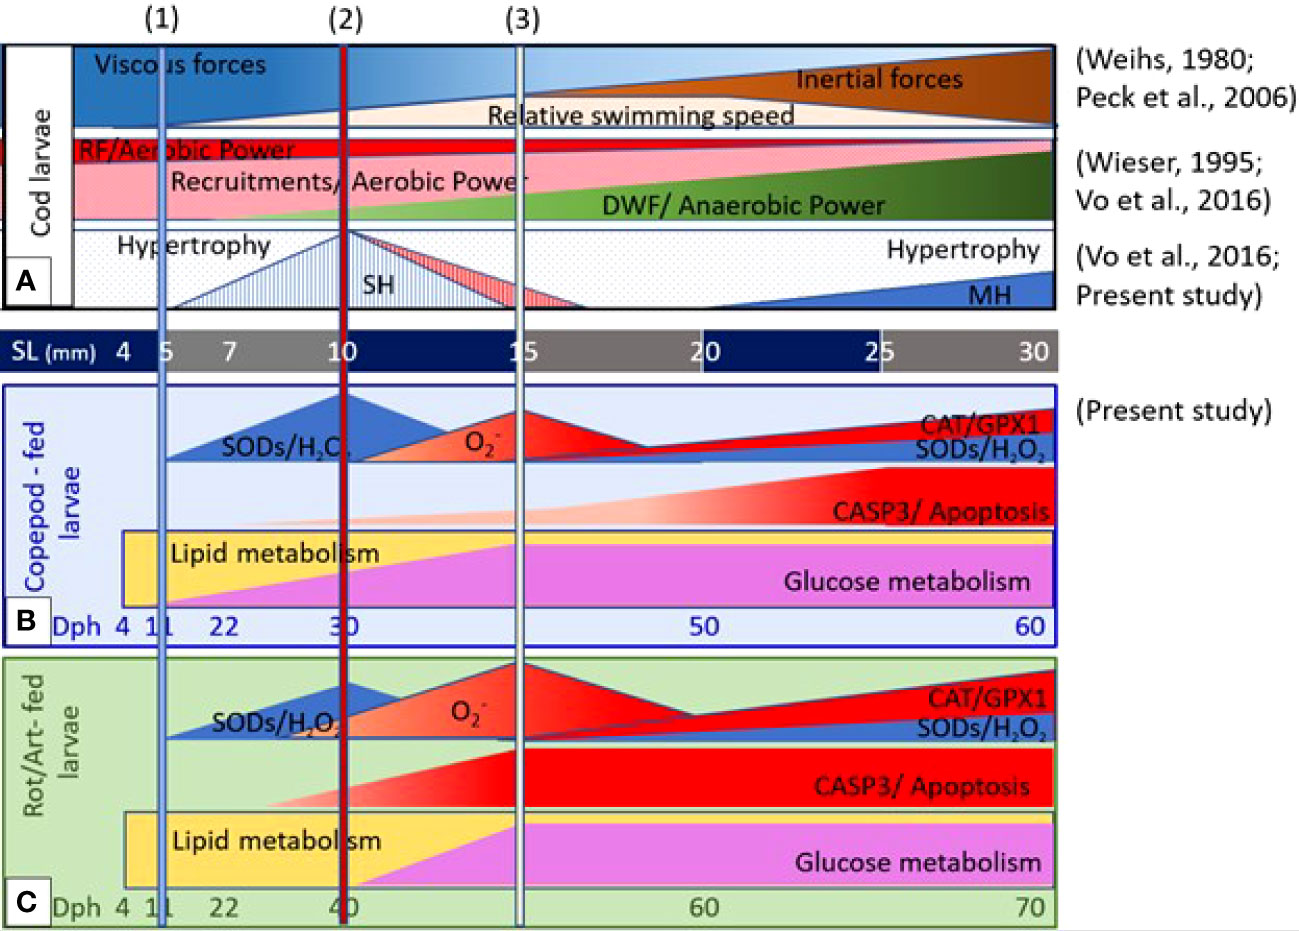
Figure 7 Proposed correlation between muscle development and growth dynamics, external and internal drivers, and energy metabolisms in relation to live prey types during ontogeny of cod larvae. (A) Changes in viscous and inertial forces and relative swimming speed (Weihs, 1980; Peck et al., 2006), and the relationship between aerobic and anaerobic power in different muscle fiber types (Wieser, 1995), and muscle growth dynamics between hypertrophy and hyperplasia (Vo et al., 2016; the present study) develop as a function of body size. Live prey types affected the levels of ROS generation and regulation and the shift in metabolisms from lipid and glucose in (B) cod larvae fed copepods and in (C) cod larvae fed rotifers and Artemia (the present study). The columns at 5-, 10-, and 15 mm standard length (SL) indicate when cod larvae start a viscous swimming mode, the transitional swimming mode, and the inertial swimming mode (1, 2 and 3) (Weihs, 1980; and Peck et al., 2006).
Promoted active swimming during the strongest muscle proliferation phase (stratified hyperplasia) could enhance the glycolysis and oxidative phosphorylation flux between muscle cells (proliferating red and white muscle fibers) for energy production. In turn, a high-energy flux can promote the proliferation in muscle. We therefore suggest that active swimming is probably an important factor for promoting cod larval muscle growth, especially during the strongest hyperplasia phase between 7 and 10 mm SL. However, increasing swimming activities may also lead to increasing ROS levels in muscle tissue, which represent a double-edged sword between redox signaling and oxidative stress. High concentrations of n-3 HUFAs, minerals and taurine and fast swimming prey would probably play important roles in stabilizing ROS levels and promoting high swimming activities, as well as good growth and development of the skeletal muscle in cod larvae.
We found that the stratified hyperplasia in fish larvae is a good model for investigating the details regarding the regulation of ROS signaling. Further studies on the specific ROS signaling pathway in the stratified hyperplasia phase, and the roles of ROS and swimming activity in driving the development of different muscle fiber types should also be investigated further to achieve a better understanding of fish larval muscle growth dynamics and the long-term effects on juvenile muscle development.
Data availability statement
The datasets presented in this study are presented in the supplementary file, and the overall data from the sequencing are deposited in the depository https://www.ncbi.nlm.nih.gov/, accession number PRJNA277848.
Ethics statement
Ethical review and approval was not required for the animal study because it was carried out within the Norwegian animal welfare act guidelines, in accordance with the Animal Welfare Act of 20th December 1974, amended 19th June 2009, at a facility with permission to conduct experiments on fish (code 93) provided by the Norwegian Animal Research Authority (FDU, www.fdu.no). The start-feeding trial was assumed to be a nutrition trial not expected to harm the animals, and no specific permit was required under the guidelines.
Author contributions
All authors developed the experimental concept, contributed to manuscript revisions and approved the submitted version. TV developed the muscle study concept, analyses and she prepared the manuscript. RE and AA were involved in the molecular analyses. TG and EK developed the concept and approach and contributed to the preparation and editing of the manuscript. ØK, KH, and IR performed the experiment.
Funding
The experiment and analyses were supported financially by the research project CODE (Cod Development), a knowledge platform funded by the Research Council of Norway (Norges forskningsråd) [project no. 19482/S40]. The Norwegian University of Science and Technology (Norges Teknisk-Naturvitenskapelige Universitet, NTNU) supported the activity through PhD-funding for TV and funding of staff and research facilities.
Acknowledgments
This material is contributing to TV’s PhD thesis to be submitted at the Norwegian University of Science and Technology (NTNU) in Trondheim. We are especially thankful to Terje van der Meeren and the staff at IMR Austevoll for cultivation of live feed organisms and for contributing to the cod larval experiment and sampling. At NTNU, we are very grateful to Tora Bardal and Randi Røsbak for technical analytical support, and to Rolf Erik Olsen for very constructive discussions related to larval metabolism and gene functions. We thank two reviewers for very constructive comments and suggestions for revising the manuscript.
Conflict of interest
Author TG is now employed by the company AquaGen AS.
The remaining authors declare that the research was conducted in the absence of any commercial or financial relationships that could be construed as a potential conflict of interest.
Publisher’s note
All claims expressed in this article are solely those of the authors and do not necessarily represent those of their affiliated organizations, or those of the publisher, the editors and the reviewers. Any product that may be evaluated in this article, or claim that may be made by its manufacturer, is not guaranteed or endorsed by the publisher.
Supplementary Material
The Supplementary Material for this article can be found online at: https://www.frontiersin.org/articles/10.3389/fmars.2022.814022/full#supplementary-material
Abbreviations
casp3, caspase 3; cat, catalase, Dph, days post-hatch; DWF, deep white muscle fibers; gpx1, glutathione peroxidase 1, H2O2, hydrogen peroxide, MH, mosaic hyperplasia; , superoxide, SH, stratified hyperplasia; SL, larval standard length; sods, superoxide dismutases.
References
Øie G., Galloway T., Sørøy M., Holmvaag Hansen M., Norheim I. A., Halseth C. K., et al (2015). Effect of cultivated copepods (Acartia tonsa) in first-feeding of Atlantic cod (Gadus morhua) and ballan wrasse (Labrus bergylta) larvae. Aquac. Nutr. 23, 3–17. doi: 10.1111/anu.12352
Arukwe A. (2006). Toxicological housekeeping genes: Do they really keep the house? Environ. Sci. Technol. 40, 7944–7949. doi: 10.1021/es0615223
Barbieri E., Sestili P. (2012). Reactive oxygen species in skeletal muscle signaling. J. Signal Transduct. 2012, 982794–982794. doi: 10.1155/2012/982794
Bedard K., Krause K. H. (2007). The NOX family of ROS-generating NADPH oxidases: physiology and pathophysiology. Physiol. Rev. 87, 245–313. doi: 10.1152/physrev.00044.2005
Blaxter J. H. S. (1988). Pattern and variety in development. Fish Physiology 11, 1–58. doi: 10.1016/S1546-5098(08)60198-3
Boglione C., Gisbert E., Gavaia P., Witten P. E., Moren M., Fontagné S., et al (2013). Skeletal anomalies in reared European fish larvae and juveniles. part 2: main typologies, occurrences and causative factors. Aquaculture 5, 121–167. doi: 10.1111/raq.12016
Brand M. D. (2010). The sites and topology of mitochondrial superoxide production. Exp. Gerontol. 45, 466–472. doi: 10.1016/j.exger.2010.01.003
Brown D. I., Griendling K. K. (2009). Nox proteins in signal transduction. Free Radic. Biol. Med. 47, 1239–1253. doi: 10.1016/j.freeradbiomed.2009.07.023
Busch K. E. T., Falk-Petersen I. B., Peruzzi S., Rist N. A., Hamre K. (2010). Natural zooplankton as larval feed in intensive rearing systems for juvenile production of Atlantic cod (Gadus morhua l.). Aquac. Res. 41, 1727–1740. doi: 10.1111/j.1365-2109.2009.02450.x
Cahu C. L., Gisbert E., Villeneuve L. A. N., Morais S., Hamza N., Wold P. A., et al (2009). Influence of dietary phospholipids on early ontogenesis of fish. Aquac. Res. 40, 989–999. doi: 10.1111/j.1365-2109.2009.02190.x
Chandel N. S., Jasper H., Ho T. T., Passegué E. (2016). Metabolic regulation of stem cell function in tissue homeostasis and organismal ageing. Nat. Cell Biol. 18, 823–832. doi: 10.1038/ncb3385
Chauton M. S., Galloway T. F., Kjørsvik E., Størseth T. R., Puvanendran V., van der Meeren T., et al (2015). (1)H NMR metabolic profiling of cod (Gadus morhua) larvae: potential effects of temperature and diet composition during early developmental stages. Biol. Open 4, 1671–1678. doi: 10.1242/bio.014431
Clark D. L., Leis J. M., Hay A. C., Trnski T. (2005). Swimming ontogeny of larvae of four temperate marine fishes. Mar. Ecol. Prog. Ser. 292, 287–300. doi: 10.3354/meps292287
Conceição L. E. C., Aragão C., Richard N., Engrola S., Gavaia P., Mira S., et al (2010). Novel methodologies in marine fish larval nutrition. Fish Physiol. Biochem. 36, 1–6. doi: 10.1007/s10695-009-9373-z
Cori C. F., Cori G. T. (1929). Glycogen formation in the liver from d-and l-lactic acid. J. Biol. Chem. 81, 389–403. doi: 10.1016/S0021-9258(18)83822-4
Corner E. D. S., O’Hara S. C. M. Eds (1986). The biological chemistry of marine copepods (Oxford and New York: Oxford University Press), 349.
Denetclaw W. F., Christ B., Ordahl C. P. (1997). Location and growth of epaxial myotome precursor cells. Development 124, 1601–1610. doi: 10.1242/dev.124.8.1601
Drillet G., Jørgensen N. O., Sørensen T. F., Ramløv H., Hansen B. W. (2006). Biochemical and technical observations supporting the use of copepods as live feed organisms in marine larviculture. Aquac. Res. 37, 756–772. doi: 10.1111/j.1365-2109.2006.01489.x
Dunaway G. A., Kasten T. P., Sebo T., Trapp R. J. B. J. (1988). Analysis of the phosphofructokinase subunits and isoenzymes in human tissues. Biochem. J. 251, 677–683. doi: 10.1042/bj2510677
El-Fiky N., Hinterleitner S., Wieser W. (1987). Differentiation of swimming muscles and gills, and development of anaerobic power in the larvae of cyprinid fish (Pisces, teleostei). Zoomorphology 107, 126–132. doi: 10.1007/BF00312122
Espe M., Holen E. (2013). Taurine attenuates apoptosis in primary liver cells isolated from Atlantic salmon (Salmo salar). Br. J. Nutr. 110, 20–28. doi: 10.1017/S0007114512004679
Espe M., Ruohonen K., El-Mowafi A. (2012). Effect of taurine supplementation on the metabolism and body lipid-to-protein ratio in juvenile Atlantic salmon (Salmo salar). Aquac. Res. 43, 349–360. doi: 10.1111/j.1365-2109.2011.02837.x
Evjemo J. O., Reitan K. I., Olsen Y. (2003). Copepods as live food organisms in the larval rearing of halibut larvae (Hippoglossus hippoglossus l.), with special emphasis on the nutritional value. Aquaculture 277, 191–210. doi: 10.1016/S0044-8486(03)00503-9
Faubert B., Li K. Y., Cai L., Hensley C. T., Kim J., Zacharias L. G., et al (2017). Lactate metabolism in human lung tumors. Cell 171, 358–371. doi: 10.1016/j.cell.2017.09.019
Finkel T. (2011). Signal transduction by reactive oxygen species. J. Cell Biol. 194, 7–15. doi: 10.1083/jcb.201102095
Finn R. N., Rønnestad I., van der Meeren T., Fyhn H. J. (2002). Fuel and metabolic scaling during the early life stages of Atlantic cod (Gadus morhua). Mar. Ecol. Prog. Ser. 243, 217–234. doi: 10.3354/meps243217
Fridovich I. (1997). Superoxide anion radical (O•̄2), superoxide dismutases, and related matters. J. Biol. Chem. 272, 18515–18517. doi: 10.1074/jbc.272.30.18515
Fukai T., Ushio-Fukai M. (2011). Superoxide dismutases: Role in redox signaling, vascular function, and diseases. Antioxid. Redox Signal. 15, 1583–1606. doi: 10.1089/ars.2011.3999
García de la Serrana D., Codina M., Capilla E., Jiménes-Amilburu V., Navarro I., Du S.-J., et al (2014). Characterisation and expression of myogenesis regulatory factors during in vitro myoblast development and in vivo fasting in the gilthead sea bream (Sparus aurata). comparative biochemistry and physiology part a. Mol. Integr. Physiol. 167, 90–99. doi: 10.1016/j.cbpa.2013.10.020
Gisbert E., Villeneuve L., Zambonino-Infante J. L., Quazuguel P., Cahu C. L. (2005). Dietary phospholipids are more efficient than neutral lipids for long-chain polyunsaturated fatty acid supply in European sea bass dicentrarchus labrax larval development. Lipids 40, 1–11. doi: 10.1007/s11745-005-1422-0
Goolish E. M. (1989). A comparison of oxygen debt in small and large rainbow trout, salmo gairdneri Richardson. J. Fish Biol. 35, 597–598. doi: 10.1111/j.1095-8649.1989.tb03010.x
Gros J., Scaal M., Marcelle C. (2004). A two-step mechanism for myotome formation in chick. Dev. Cell 6, 875–882. doi: 10.1016/j.devcel.2004.05.006
Halliwell B. (1991). Reactive oxygen species in living systems: Source, biochemistry, and role in human disease. Am. J. Med. 91, 14–22. doi: 10.1016/0002-9343(91)90279-7
Hamre K., Penglase S. J., Rasinger J. D., Skjærven K. H., Olsvik P. A. (2014). Ontogeny of redox regulation in Atlantic cod (Gadus morhua) larvae. Free Radic. Biol. Med. 73, 337–348. doi: 10.1016/j.freeradbiomed.2014.05.017
Hamre K., Yufera M., Rønnestad I., Boglione C., Conceicão L. E. C., Izquierdo M. (2013). Fish larval nutrition and feed formulation: knowledge gaps and bottlenecks for advances in larval rearing. Rev. Aquac. 5, 26–58. doi: 10.1111/j.1753-5131.2012.01086.x
Hoehne-Reitan K., Kjørsvik E. (2004). “Functional development of the exocrine pancreas and liver in teleost fish,” in The development of form and function in fishes, and the question of larval adaptation. Ed. Govoni J. J. (American Fisheries Society Symposium) 40, 9–36.
Holmström K. M., Finkel T. (2014). Cellular mechanisms and physiological consequences of redox-dependent signalling. Nat. Rev. Mol. Cell Biol. 15, 411–421. doi: 10.1038/nrm3801
Hui S., Ghergurovich J. M., Morscher R. J., Jang C., Teng X., Lu W., et al (2017). Glucose feeds the TCA cycle via circulating lactate. Nature 551, 115–118. doi: 10.1038/nature24057
Hunt von Herbing I., Gallager S. M. (2000). Foraging behavior in early Atlantic cod larvae (Gadus morhua) feeding on a protozoan (Balanionsp.) and a copepod nauplius (Pseudodiaptomussp.). Mar. Biol. 136, 591–602. doi: 10.1007/s002270050719
Igea A., Nebreda A. R. (2015). The stress kinase p38α as a target for cancer therapy. Cancer Res. 75, 3997–4002. doi: 10.1158/0008-5472.CAN-15-0173
Imsland A. K., Foss A., Koedjik R., Folkvord A., Stefansson S. O., Jonassen T. M. (2006). Short- and long-term differences in growth, feed conversion efficiency and deformities in juvenile Atlantic cod (Gadus morhua) startfed on rotifers or zooplankton. Aquac. Res. 37, 1015–1027. doi: 10.1111/j.1365-2109.2006.01523.x
Ito T., Yoshikawa N., Schaffer S. W., Azuma J. (2014). Tissue taurine depletion alters metabolic response to exercise and reduces running capacity in mice. J. Amino Acids 2014, 964680–964680. doi: 10.1155/2014/964680
Iwasa H., Han J., Ishikawa F. (2003). Mitogen-activated protein kinase p38 defines the common senescence-signalling pathway. Genes to Cells 8, 131–144. doi: 10.1046/j.1365-2443.2003.00620.x
Izquierdo M. S., Socorro J., Arantzamendi L., Hernandez-Cruz C. M. (2000). Recent advances in lipid nutrition in fish larvae. Fish Physiol. Biochem. 22, 97–107. doi: 10.1023/A:1007810506259
Jackson M. J. (2005). Reactive oxygen species and redox-regulation of skeletal muscle adaptations to exercise. philosophical transactions of the royal society b. Biol. Sci. 360, 2285–2291. doi: 10.1098/rstb.2005.1773
Johnston I. A. (2006). Environment and plasticity of myogenesis in teleost fish. J. Exp. Biol. 209, 2249–2264. doi: 10.1242/jeb.02153
Johnston I. A., Bower N. I., MacQueen D. J. (2011). Growth and the regulation of myotomal muscle mass in teleost fish. J. Exp. Biol. 214, 1617–1628. doi: 10.1242/jeb.038620
Johnston I. A., Cole N. J., Abercromby M., Vierira V. L. A. (1998). Embryonic temperature modulates muscle growth characteristics in larval and juvenile herring. J. Exp. Biol. 201, 623–646. doi: 10.1242/jeb.201.5.623
Jones D. P., Sies H. (2015). The redox code. Antioxid. Redox Signal. 23, 734–746. doi: 10.1089/ars.2015.6247
Jong C. J., Azuma J., Schaffer S. (2012). Mechanism underlying the antioxidant activity of taurine: prevention of mitochondrial oxidant production. Amino Acids 42, 2223–2232. doi: 10.1007/s00726-011-0962-7
Jong C. J., Sandal P., Schaffer S. W. (2021). The role of taurine in mitochondria health: More than just an antioxidant. Molecules 26 (16), 4913. doi: 10.3390/molecules26164913
Kamata H., Hirata H. (1999). Redox regulation of cellular signalling. Cell. Signal. 11, 1–14. doi: 10.1016/S0898-6568(98)00037-0
Karlsen Ø., van der Meeren T., Rønnestad I., Mangor-Jensen A., Galloway T. F., Kjørsvik E., et al (2015). Copepods enhance nutritional status, growth, and development in Atlantic cod (Gadus morhua l.) larvae - can we identify the underlying factors? PeerJ 3, e902. doi: 10.7717/peerj.902
Katan T., Nash G. W., Rise M. L., Hall J. R., Fernandes J. M. O., Boyce D., et al (2016). A little goes a long way: Improved growth in Atlantic cod (Gadus morhua) fed small amounts of wild zooplankton. Aquaculture 451, 271–282. doi: 10.1016/j.aquaculture.2015.09.014
Kelly A. M., Zacks S. I. (1969). The fine structure of motor endplate morphogenesis. J. Cell Biol. 42, 154–169. doi: 10.1083/jcb.42.1.154
Kersten S. (2014). Physiological regulation of lipoprotein lipase. Biochim. Biophys. Acta 1841, 919–933. doi: 10.1016/j.bbalip.2014.03.013
Kjørsvik E., Olsen C., Wold P. A., Hoehne-Reitan K., Cahu C. L., Rainuzzo J., et al (2009). Comparison of dietary phospholipids and neutral lipids on skeletal development and fatty acid composition in Atlantic cod (Gadus morhua). Aquaculture 294, 246–255. doi: 10.1016/j.aquaculture.2009.06.012
Kjørsvik E., van der Meeren T., Kryvi H., Arnfinnson J., Kvenseth P. G. (1991). Early development of the digestive tract of cod larvae (Gadus morhua l.) during start-feeding and starvation. J. Fish Biol. 38, 1–15. doi: 10.1111/j.1095-8649.1991.tb03086.x
Knox D., Walton M. J., Cowey C. B. (1980). Distribution of enzymes of glycolysis and gluconeogenesis in fish tissues. Mar. Biol. 56, 7–10. doi: 10.1007/BF00390588
Koedjik R. M., Folkvord A., Foss A., Pittman K., Stefansson S. O., Handeland S., et al (2010). The influence of first-feeding diet on the Atlantic cod gadus morhua phenotype: survival, development and long-term consequences for growth. J. Fish Biol. 77, 1–19. doi: 10.1111/j.1095-8649.2010.02652.x
Kortner T. M., Overrein I., Øie G., Kjørsvik E., Arukwe A. (2011). The influence of dietary constituents on the molecular ontogeny of digestive capability and effects on growth and appetite in Atlantic cod larvae (Gadus morhua). Aquaculture 315, 114–120. doi: 10.1016/j.aquaculture.2010.04.008
Koster J. F., Slee R. G., Van Berkel T. J. (1980). Isoenzymes of human phosphofructokinase. Clin. Chim. Acta 103, 169–173. doi: 10.1016/0009-8981(80)90210-7
Kurata S. I. (2000). Selective activation of p38 MAPK cascade and mitotic arrest caused by low level oxidative stress. J. Biol. Chem. 275, 23413–23416. doi: 10.1074/jbc.C000308200
Kvenseth P. G., Øiestad V. (1984). “Large-Scale rearing of cod fry on the natural food production in an enclosed pond,” in The propagation of cod gadus morhua l. Eds. Dahl E., Danielssen D. S., Moksness E., Solemdal P. (Flødevigen Rapportserie) 1, 645–55.
Lakhani S. A., Masud A., Kuida K., Porter G. A., Booth C. J., Mehal W. Z., et al (2006). Caspases 3 and 7: Key mediators of mitochondrial events of apoptosis. Science 311, 847–851. doi: 10.1126/science.1115035
Lambeth J. D. (2004). NOX enzymes and the biology of reactive oxygen. Nat. Rev. Immunol. 4, 181–189. doi: 10.1038/nri1312
Lasker R. (1981). “The role of a stable ocean in larval fish survival and subsequent recruitment”, in Marine fish larvae: morphology, ecology, and relation to fisheries, Ed.Lasker R. (Washington Sea Grant, 1981, 131 pages) vol. 1. , 80–89.
Lefebyre P., Chinetti G., Fruchart J. C., Staels B. (2006). Sorting out the roles of PPAR alpha in energy metabolism and vascular homeostasis. J. Clin. Invest. 116, 571–580. doi: 10.1172/JCI27989
Lehninger A. L., Nelson D. L., Cox M. M. Eds (1993). Principles of biochemistry. Second edition, (Worth, New York: New York Press), 1013.
Leis J. M., Hay A. C., Lockett M. M., Chen J. P., Fang L. S. (2007). Ontogeny of swimming speed in larvae of pelagic-spawning, tropical, marine fishes. Mar. Ecol. Prog. Ser. 349, 255–267. doi: 10.3354/meps07107
Lunt S. Y., Vander Heiden M. G. (2011). Aerobic glycolysis: Meeting the metabolic requirements of cell proliferation. Annu. Rev. Cell Dev. Biol. 27, 441–464. doi: 10.1146/annurev-cellbio-092910-154237
Luo L., Wei H., Ai L., Liang X., Wu X., Xing W., et al (2019). Effects of early long-chain n-3HUFA programming on growth, antioxidant response and lipid metabolism of Siberian sturgeon (Acipenser baerii Brandt). Aquaculture 509, 96–103. doi: 10.1016/j.aquaculture.2019.05.032
Mæhre H. K., Hamre K., Elvevoll E. O. (2013). Nutrient evaluation of rotifers and zooplankton: feed for marine fish larvae. Aquac. Nutr. 19, 301–311. doi: 10.1111/j.1365-2095.2012.00960.x
Marreiro D. D. N., Cruz K. J. C., Morais J. B. S., Beserra J. B., Severo J. S., De Oiveira A. R. S. (2017). Zinc and oxidative stress: Current mechanisms. Antioxidants 6 (2), 24. doi: 10.3390/antiox6020024
Matsuzawa A., Ichijo H. (2008). Redox control of cell fate by MAP kinase: physiological roles of ASK1-MAP kinase pathway in stress signaling. Biochim. Biophys. Acta (BBA) - Gen. Subj. 1780, 1325–1336. doi: 10.1016/j.bbagen.2007.12.011
Metón I., Mediavilla D., Caseras A., Cantó E., Fernández F., Baanante I. (1999). Effect of diet composition and ration size on key enzyme activities of glycolysis–gluconeogenesis, the pentose phosphate pathway and amino acid metabolism in liver of gilthead sea bream (Sparus aurata). Br. J. Nutr. 82, 223–232. doi: 10.1017/S0007114599001403
Militante J., Lombardini J. B. (2004). Age-related retinal degeneration in animal models of aging: possible involvement of taurine deficiency and oxidative stress. Neurochem. Res. 29, 151–160. doi: 10.1023/B:NERE.0000010444.97959.1b
Moon T. W. (2001). Glucose intolerance in teleost fish: fact or fiction? Comparative biochemistry and physiology part b. Biochem. Mol. Biol. 129, 243–249. doi: 10.1016/S1096-4959(01)00316-5
Müller U. K., van den Boogart J. G. M., van Leeuwen J. L. (2008). Flow patterns of larval fish: undulatory swimming in the intermediate flow regime. J. Exp. Biol. 211 (2), 196–205. doi: 10.1242/jeb.005629
Murphy M. P. (2011). Mitochondrial thiols in antioxidant protection and redox signaling: distinct roles for glutathionylation and other thiol modifications. Antioxid. Redox Signal. 16, 476–495. doi: 10.1089/ars.2011.4289
Olsen Y., Evjemo J. O., Kjorsvik E., Larssen H., Li K. S., Overrein I., et al (2014). DHA content in dietary phospholipids affects DHA content in phospholipids of cod larvae and larval performance. Aquaculture 428, 203–214. doi: 10.1016/j.aquaculture.2014.03.002
Orth J. D., Loewer A., Lahav G., Mitchison T. J. (2012). Prolonged mitotic arrest triggers partial activation of apoptosis, resulting in DNA damage and p53 induction. Mol. Biol. Cell 23, 567–576. doi: 10.1091/mbc.e11-09-0781
Osse J. W. M., van den Boogaart J. G. M., van Snik G. M. J., van der Sluys L. (1997). Priorities during early growth of fish larvae. Aquaculture 155, 249–258. doi: 10.1016/S0044-8486(97)00126-9
Osse J. W. M., van den Boogart J. G. M. (2004). “Allometric growth in fish larvae: Timing and function,” in Development of form and function in fishes and the question of larval adaptation. Ed. Govoni J. J. (Book Series American Fisheries Society Symposium) 40, 167–94.
Peck M. A., Buckley L. J., Bengtson D. A. (2006). Effects of temperature and body size on the swimming speed of larval and juvenile Atlantic cod (Gadus morhua): Implications for individual-based modelling. Environ. Biol. Fishes 75, 419–429. doi: 10.1007/s10641-006-0031-3
Penglase S., Edvardsen R. B., Furmanek T., Rønnestad I., Karlsen Ø., van der Meeren T., et al (2015). Diet affects the redox system in developing Atlantic cod (Gadus morhua) larvae. Redox Biol. 5, 308–318. doi: 10.1016/j.redox.2015.06.003
Porter A. G., Jänicke R. U. (1999). Emerging roles of caspase-3 in apoptosis. Cell Death Differ. 6, 99–104. doi: 10.1038/sj.cdd.4400476
Rønnestad I., Yufera M., Ueberschär B., Ribeiro L., Sæle Ø., Boglione C. (2013). Feeding behaviour and digestive physiology in larval fish: current knowledge, and gaps and bottlenecks in research. Rev. Aquac. 5, 59–98. doi: 10.1111/raq.12010
Rise M. L., Hall J. R., Nash G. W., Xue X., Booman M., Katan T., et al (2015). Transcriptome profiling reveals that feeding wild zooplankton to larval Atlantic cod (Gadus morhua) influences suites of genes involved in oxidation-reduction, mitosis, and selenium homeostasis. BMC Genomics 16, 1016–1038. doi: 10.1186/s12864-015-2120-1
Rocha F., Dias J., Engrola S., Gavaia P., Geurden I., Dinis M. T., et al (2015). Glucose metabolism and gene expression in juvenile zebrafish (Danio rerio) challenged with a high carbohydrate diet: effects of an acute glucose stimulus during late embryonic life. Br. J. Nutr. 113, 403–413. doi: 10.1017/S0007114514003869
Rogatzki M. J., Ferguson B. S., Goodwin M. L., Gladden L. B. (2015). Lactate is always the end product of glycolysis. Front. Neurosci. 9, 22. doi: 10.3389/fnins.2015.00022
Rossi G., Messina G. (2014). Comparative myogenesis in teleosts and mammals. Cell. Mol. Life Sci. 71, 3081–3099. doi: 10.1007/s00018-014-1604-5
Rowlerson A., Mascarello F., Radaelli G., Veggetti A. (1995). Differentiation and growth of muscle in the fish sparus aurata (L): II. hyperplastic and hypertrophic growth of lateral muscle from hatching to adult. J. Muscle Res. Cell Motil. 16, 223–236. doi: 10.1007/BF00121131
Rükgauer M., Neugebauer R. J., Plecko T. (2001). The relation between selenium, zinc and copper concentration and the trace element dependent antioxidative status. J. Trace Elem. Med. Biol. 15, 73–78. doi: 10.1016/S0946-672X(01)80046-8
Schieber M., Chandel N. S. (2014). ROS function in redox signaling and oxidative stress. Curr. Biol. 24, 453–462. doi: 10.1016/j.cub.2014.03.034
Shields R. J., Bell J. G., Luizi F. S., Gara B., Bromage N. R., Sargent J. R. (1999). Natural copepods are superior to enriched artemia nauplii as feed for halibut larvae (Hippoglossus hippoglossus) in terms of survival, pigmentation and retinal morphology: Relation to dietary essential fatty acids. J. Nutr. 129, 1186–1194. doi: 10.1093/jn/129.6.1186
Somero G. N., Childress J. J. (1980). A violation of the metabolism-size scaling paradigm: Activities of glycolytic enzymes in muscle increase in larger-size fish. Physiol. Zool. 53, 322–337. doi: 10.1086/physzool.53.3.30155794
Støttrup J. G. (2000). The elusive copepods: their production and suitability in marine aquaculture. Aquac. Res. 31, 703–711. doi: 10.1046/j.1365-2109.2000.318488.x
Støttrup J., McEvoy L. A. (2003). Live feeds in marine aquaculture (Oxford: Blackwell Publishing), 340.
Stanley R., Snelgrove P. V. R., DeYoung B., Gregory R. S. (2012). Dispersal patterns, active behaviour, and flow environment during early life history of coastal cold water fishes. PLoS One 7, e46266. doi: 10.1371/journal.pone.0046266
Sullivan K. M., Somero G. N. (1983). Size-and diet-related variations in enzymic activity and tissue composition in the sablefish, anoplopoma fimbria. Biol. Bull. 164, 315–326. doi: 10.2307/1541147
Sylow L., Kleinert M., Richter E. A., Jensen T. E. (2017). Exercise-stimulated glucose uptake - regulation and implications for glycaemic control. Nat. Rev. Endocrinol. 13, 133–148. doi: 10.1038/nrendo.2016.162
Tocher D. R., Bendiksen E. A., Campbell P. J., Bell J. G. (2008). The role of phospholipids in nutrition and metabolism of teleost fish. Aquaculture 280, 21–34. doi: 10.1016/j.aquaculture.2008.04.034
Urao N., Ushio-Fukai M. (2013). Redox regulation of stem/progenitor cells and bone marrow niche. Free Radic. Biol. Med. 54, 26–39. doi: 10.1016/j.freeradbiomed.2012.10.532
Vagner M., Robin J. H., Zambonino-Infante J. L., Tocher D. R., Person-Le Ruyet J. (2009). Ontogenic effects of early feeding of sea bass (Dicentrarchus labrax) larvae with a range of dietary n-3 highly unsaturated fatty acid levels on the functioning of polyunsaturated fatty acid desaturation pathways. Br. J. Nutr. 101, 1452–1462. doi: 10.1017/S0007114508088053
Valente L. M. P., Moutou K. A., Conceicão L. E. C., Engrola S., Fernandes J. M. O., Johnston I. A. (2013). What determines growth potential and juvenile quality of farmed fish species? Rev. Aquac. 5, 168–193. doi: 10.1111/raq.12020
Vander Heiden M. G., Cantley L. C., Thompson C. B. (2009). Understanding the warburg effect: The metabolic requirements of cell proliferation. Science 324, 1029–1033. doi: 10.1126/science.1160809
Van der Meeren T., Karlsen Ø., Liebig P. L., Mangor-Jensen A. (2014). Copepod production in a saltwater pond system: a reliable method for achievement of natural prey in start-feeding of marine fish larvae. Aquacult. Eng. 62, 17–27. doi: 10.1016/j.aquaeng.2014.07.003
Van der Meeren T., Olsen R. E., Hamre K., Fyhn H. J. (2008). Biochemical composition of copepods for evaluation of feed quality in production of juvenile marine fish. Aquaculture 274, 375–397. doi: 10.1016/j.aquaculture.2007.11.041
Veggetti A., Mascarello F., Scapolo P. A., Rowlerson A. (1990). Hyperplastic and hypertrophic growth of lateral muscle in dicentrarchus labrax (L.). Anat. Embryol. 182, 1–10. doi: 10.1007/BF00187522
Voesenek C. J., Muijeres F. T., van Leeuwen J. L. (2018). Biomechanics of swimming in developing larval fish. J. Exp. Biol. 221, jeb149583. doi: 10.1242/jeb.149583
Vo T. A., Galloway T. F., Bardal T., Halseth C. K., Øie G., Kjørsvik E. (2016). Skeletal muscle growth dynamics and the influence of first-feeding diet in Atlantic cod larvae (Gadus morhua l.). Biol. Open 5, 1575–1584. doi: 10.1242/bio.018556
Warburg O. (1956). On the origin of cancer cells. Science 123, 309–314. doi: 10.1126/science.123.3191.309
Weatherley A. H., Gill H. S., Lobo A. F. (1988). Recruitment and maximal diameter of axial muscle fibres in teleosts and their relationship to somatic growth and ultimate size. J. Fish Biol. 33, 851–859. doi: 10.1111/j.1095-8649.1988.tb05532.x
Webb P. W., Weihs D. (1986). Functional locomotor morphology of early life history stages of fishes. Trans. Am. Fish. Soc. 115, 115–127. doi: 10.1577/1548-8659(1986)115<115:FLMOEL>2.0.CO;2
Weihs D. (1980). Energetic significance of changes in swimming modes during growth of larval anchovy, engraulis mordax. Fish. Bull. 77, 597–604.
Wieser W. (1995). Energetics of fish larvae, the smallest vertebrates. Acta Physiol. Scand. 154, 279–290. doi: 10.1111/j.1748-1716.1995.tb09912.x
Wilson R. P. (1994). Utilization of dietary carbohydrate by fish. Aquaculture 124, 67–80. doi: 10.1016/0044-8486(94)90363-8
Wold P. A., Hoehne-Reitan K., Cahu C. L., Zambonino-Infante J., Rainuzzo J., Kjørsvik E. (2009). Comparison of dietary phospholipids and neutral lipids: effects on gut, liver, and pancreas histology in Atlantic cod (Gadus morha l.) larvae. Aquac. Nutr. 15, 73–84. doi: 10.1111/j.1365-2095.2008.00569.x
Keywords: Atlantic cod larvae, larval nutrition, muscle hypertrophy and hyperplasia, larval metabolism, antioxidant defense system, muscle growth and differentiation, Gadus morhua (L.), larval growth
Citation: Vo TA, Galloway TF, Arukwe A, Edvardsen RB, Hamre K, Karlsen Ø, Rønnestad I and Kjørsvik E (2022) Effect of diet on molecular relationships between Atlantic cod larval muscle growth dynamics, metabolism, and antioxidant defense system. Front. Mar. Sci. 9:814022. doi: 10.3389/fmars.2022.814022
Received: 12 November 2021; Accepted: 13 July 2022;
Published: 09 August 2022.
Edited by:
Yen-Ju Pan, National Taiwan Ocean University, TaiwanReviewed by:
Rafael Campos-Ramos, Centro de Investigación Biológica del Noroeste (CIBNOR), MexicoPaulo Gavaia, University of Algarve, Portugal
Copyright © 2022 Vo, Galloway, Arukwe, Edvardsen, Hamre, Karlsen, Rønnestad and Kjørsvik. This is an open-access article distributed under the terms of the Creative Commons Attribution License (CC BY). The use, distribution or reproduction in other forums is permitted, provided the original author(s) and the copyright owner(s) are credited and that the original publication in this journal is cited, in accordance with accepted academic practice. No use, distribution or reproduction is permitted which does not comply with these terms.
*Correspondence: Tu A. Vo, tu.a.vo@ntnu.no
†Present address: Trina F. Galloway, AquaGen AS, Trondheim, Norway