Vegetation changes in Yellow River Delta wetlands from 2018 to 2020 using PIE-Engine and short time series Sentinel-2 images
 Dong Chang
 Zhiyong Wang
 Xiaogang Ning
 Zhenjin Li
 Long Zhang1,2
 - 1College of Geodesy and Geomatics, Shandong University of Science and Technology, Qingdao, China
- 2Institute of Photogrammetry and Remote Sensing, Chinese Academy of Surveying and Mapping, Beijing, China
Vegetation is the functional subject in the wetland ecosystem and plays an irreplaceable role in biodiversity conservation. It is of great significance to monitor wetland vegetation for scientific assessment of the impact of vegetation on ecological environment and biodiversity. In this paper, a method for extracting wetland vegetation based on short time series Normalized Difference Vegetation Index (NDVI) data set was constructed. First, time series NDVI data were constructed using Sentinel-2 images. Then, the Support Vector Machine (SVM) classifier was used to classify the wetland vegetation types. The distributions of the main wetland vegetation in the study area in 2018 and 2020 were got. Finally, the land cover transfer matrix was calculated to analyze the spatial pattern and change of wetland vegetation emphatically from 2018 to 2020. Based on 46 Sentinel-2 images acquired in 2018 and 2020, the spatial pattern and change of vegetation in the Yellow River Delta wetlands were extracted and analyzed in this paper. The results show that: (1) The method for extracting wetland vegetation in estuary delta based on PIE-Engine platform and short time series NDVI data constructed in this paper can effectively extract the wetland vegetation information. The overall accuracy of the classification results reached 90.47% in 2018 and 80.30% in 2020. The Kappa coefficient of the classification results are 0.874 in 2018 and 0.739 in 2020 respectively. Compared with the results from the random forest classification method and the maximum likelihood classification method, the accuracy is improved by 6.40% and 13.04%, and the Kappa coefficient is improved by 0.055 and 0.069. (2) There were significant changes in vegetation coverage in the Yellow River Delta wetlands from 2018 to 2020. The Spartina alterniflora increased by 3.74km2. The Suaeda salsa degraded seriously, and the total area decreased by 20.38km2. In addition, the increase of Spartina alterniflora effectively guaranteed the stability of the coastline in the study area. This study can provide a theoretical basis for wetlands vegetation classificaton, and the classificaton results can provide scientific reference for protecting the ecological environment of wetlands and maintaining ecological stability.
Introduction
As one of the most dynamic and valuable ecosystems in the coastal zone, salt marsh wetland has a variety of ecological functions, such as intercepting sediment, coastal protection, water purification and food supply, while also being some of the most threatened areas (Costanza et al., 1997; Sun et al., 2016; Borges et al., 2021). The Yellow River Delta wetlands plays an irreplaceable role in providing humans with land, tourism and natural resources, so it is of great significance to protect the Yellow River Delta wetlands (Wang et al., 2022). However, due to the single vegetation type of the wetland ecosystem in the Yellow River Delta in early years, the ecological environment is very fragile and easily disturbed by natural or human factors (Liu et al., 2021). Since the 1990s, relevant departments in China have introduced Spartina alterniflora into the Yellow River Delta to improve the salt marsh wetland environment, and succeeded in trial planting (Zuo et al., 2012; Huang et al., 2022). Then, the Spartina alterniflora spreads rapidly to the intertidal zone of Yellow River Delta wetlands. In the 21st century, Spartina alterniflora has become one of the main vegetation communities in this region (Wan et al., 2009), showing strong invasiveness. The introduction of Spartina alterniflora has created great ecological benefits for the Yellow River Delta, but the explosive spread of Spartina alterniflora threatens the biodiversity and ecological stability. Therefore, it is of great significance to quantitatively monitor the species distribution of vegetation for protecting wetland biodiversity and maintaining the sustainable development of the ecosystem.
Medium and low resolution remote sensing images play an important role in wetland monitoring, including ecosystem evaluation (Wang et al., 2021), biomass inversion (Yu et al., 2022), and monitoring of seasonal and spatial variability (Daggers et al., 2020). In the early, medium and low resolution remote sensing images have been used to monitor Spartina alterniflora (Mao et al., 2019; Cavallo et al., 2021). But the spectral characteristics of Spartina alterniflora were similar to those of other green vegetation, such as Phragmites australis, they could not distinguish Spartina alterniflora accurately from other vegetation. With the further study, researchers found that Spartina alterniflora and other vegetation have significant differences in growth cycle. This is manifested in the differences of different spectral features (Zheng et al., 2017) and texture features (Guo et al., 2020) in optical images, and in the characteristics of backscattering coefficient (Hu et al., 2021) and coherence (Li Z. J. et al., 2022) in SAR images. At present, medium and low resolution remote sensing images are effective materials for monitoring Spartina alterniflora and vegetation classification in a large area. Mao et al. (2019) applied the multi-scale segmentation method to process Landsat 8 OLI images, used the object-oriented SVM classification algorithm to monitor the spread of Spartina alterniflora in coastal areas of Mainland China from 1995 to 2015, and analyzed the invasion of Spartina alterniflora in different coastal areas based on available image data. It was found that the rapid spread of Spartina alterniflora had potential harm to coastal wetland ecology in China. Cavallo et al. (2021) studied the evolution of land cover in Albufera wetland in Spain in winter by using Sentinel-2 and Landsat 8 OLI images, with an overall accuracy of over 95%. Chen et al. (2021) land-use researched the landscape patterns of Zhoushan Island using multi-temporal Landsat satellite data, the classification results from 1984 to 2020 is over 75%. The above scholars verified the feasibility of vegetation classification with medium and low resolution remote sensing images.
Early wetland vegetation monitoring was limited to single species monitoring (Wan et al., 2009; Chen et al., 2020; Ren et al., 2021). The remote sensing images with medium and low resolution, such as Landsat 8 and Sentinel-2, could complete the task of monitoring the wetlands in a large area (Wang et al., 2020; Ashok et al., 2021). However, in further exploring the influence mechanism between invasive species and native species in wetland environment, it is urgent to carry out fine and quantitative monitoring of salt marsh vegetation community. Due to the limitation of satellite image resolution, it cannot effectively monitor different vegetation communities using the classification results of medium and low resolution remote sensing images. It is an important challenge for monitoring the wetland vegetation. The high resolution remote sensing images can better monitor vegetation by using texture features, such as Worldview images, UAV aerial images and multispectral images (Jiao et al., 2019; Wang et al., 2019; Zhu et al., 2019). However, due to expensive data and long image acquisition cycle, it is difficult to obtain a large amount of high-quality data to form an effective long time series monitoring, which cannot be promoted in practical application. In addition, due to the complexity of wetland environment, the traditional use of multi-spectral features (Zheng et al., 2017; Jiao et al., 2019) and texture features (Wang et al., 2018) for monitoring wetlands cannot well meet the needs of research. Therefore, how to obtain more valuable information from the remote sensing images with medium and low resolution for classification has become an urgent problem to be solved.
Vegetation phenology information (Zeng et al., 2020) records vegetation growth characteristics from time scale, providing a new idea for wetland vegetation classification. Relevant scholars have carried out a lot of research in this aspect. Such as Sun et al. (2016) for the first time introduced temporal phenology information and temporal spectrum information of remote sensing image into monitoring the vegetation of salt marsh, and used HJ-1 temporal Normalized Difference Vegetation Index (NDVI) image to get the vegetation classification results of Salt marsh in Jiangcheng, and the classification accuracy reached 88.2%. Since the Sentinel-2 satellite launching in 2017, Sentinel-2 satellite images, as one of the representatives of medium and low resolution images, have become an important data source for time series analysis, wetland vegetation monitoring and other related studies (Mahdianpari et al., 2018; Sun et al., 2020). Cai et al. (2019) used the data fusion between MODIS and Sentinel-2 to obtain multi-temporal Sentinel-2 data and studied rice classification. The overall accuracy of classification based on object-oriented random forest algorithm was 95%. When targeting complex communities, Sentinel-2 can also effectively map the distribution of vegetation. For example, Rapinel et al. (2019) used Sentinel-2 temporal images to map the distribution of seven vegetation communities in the Bay of Mont Saint-Michel in France using unsupervised classification, with an overall accuracy of 78%. However, under the background that the classification accuracy was less than 80%, Vrieling et al. (2018) introduced Sentinel-2 time series NDVI information, and verified that the vegetation phenological information by using spectral features could be effectively obtained based on the time series Sentinel-2 images.
Time series data has great potential in monitoring vegetation and has received extensive attention from researchers (Chapple and Dronova, 2017). However, it requires complex computation and expensive storage equipment to construct and store time series data, which seriously hinders the application and popularization of time series data. The cloud computing method provides researchers with powerful computing capacity and cloud storage space. It can overcome the problems of low efficiency such as local download, storage and pre-processing, and is widely used in monitoring the land cover and change in a large scale (Liang et al., 2020; Akhoondzadeh, 2022; Li Z. J. et al., 2022; Ning et al., 2022). PIE-Engine (Cheng et al., 2022) is an online remote sensing cloud computing open platform integrating real-time distributed computing, interactive analysis and data visualization. It contains an elastic big data environment for automatic management and integrates technologies such as multi-source remote sensing data processing, distributed resource scheduling, real-time computing, batch computing and deep learning framework. PIE-Engine remote sensing computing cloud service platform combines massive remote sensing data and computing resources to quickly realize complex image calculation through simple codes, providing open data and elastic computing force support for research in the field of earth science.Compared with Google Earth Engine (GEE) (Li X. et al., 2022), PIE-Engine lowers the barrier for Chinese researchers to learn and use with its detailed Chinese help documents, communication community and friendly interactive interface. Therefore, based on PIE-Engine, this paper used Sentinel-2A to construct intensive short time series NDVI data (number of images > 12) to extract salt marsh vegetation in the Yellow River Delta wetlands, and then explored the wetland vegetation distribution pattern and change characteristics from 2018 to 2020. It can provide scientific reference for protecting and managing the Yellow River Delta wetlands and maintaining wetland biodiversity and ecological stability.
The structure of this paper is as follows: In Section 2, the situation of the study area and the experimental data are introduced. Section 3 is the study method of this paper. Based on PIE-Engine remote sensing cloud computing platform, a method for extracting the wetland vegetation based on short time series NDVI data set was constructed. Section 4 is the study results of this paper, including the thematic map of wetland vegetation classification in the Yellow River Delta wetlands in 2018 and 2020, as well as the accuracy verification. In section 5, the spatial and temporal change analysis of vegetation in the Yellow River Delta wetlands was carried out, and the spatial distribution and change characteristics of the invasive species – Spartina alterniflora were mainly analyzed. In the last section, some important conclusions were given.
Data and materials
Study area
The Yellow River Delta wetlands is selected as the experimental area in this paper. The Yellow River Delta is located in the south of Bohai Bay and the west of Laizhou Bay in China (Xie et al., 2022), and its latitude and longitude coordinates are 37°35’N ~ 37°52’N, and 118°56’E ~ 119°18’E. It mainly distributes in Dongying, Shandong Province, China. It is the estuary delta with the largest newly added land area in China. The Yellow River Delta located in the mid-latitude warm temperate zone, has a sub-humid continental monsoon climate with distinct four seasons, an average annual temperature of 12.1 °C, and annual precipitation of about 560-590mm, which varies greatly from year to year. The Yellow River Delta is the most well-preserved, broadest and youngest wetland ecosystem in China’s warm temperate zone (Zhang B. et al., 2019), which is rich in animal and plant resources.
The study area in this paper is the Yellow River Estuary, covering an area of about 487km2. This area is susceptible to the influence of the Yellow River sediment and ocean dynamic, resulting in a large change of shoreline sedimentation erosion. Therefore, this is a typical area for studying the change of wetland vegetation and ecological environment in the Yellow River Delta. The geographical location of the study area is shown in red box in Figure 1A. Figure 1B shows an enlarged view of the study area with Sentinel-2 image as the background.
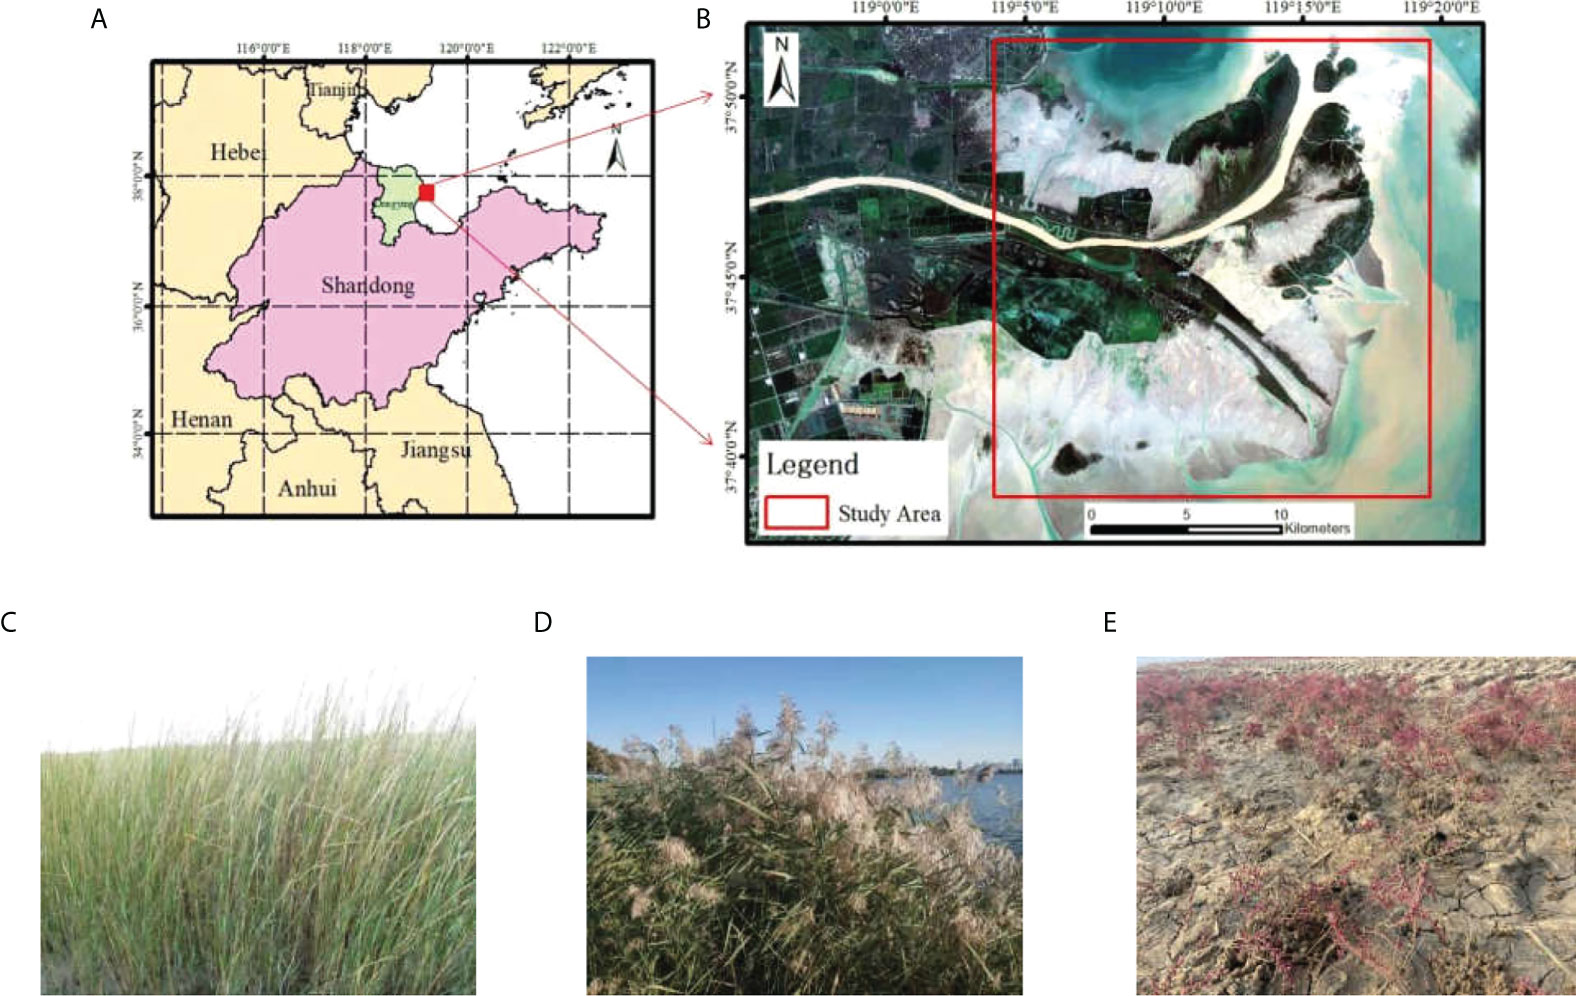
Figure 1 Study area map. (A) is the location of the study area; (B) is the specific delineation with Sentinel-2 optical remote sensing images as the background; (C) is Spartina alterniflora photographed in situ; (D) is Phragmites australis photographed in situ; and (E) is Suaeda salsa photographed in situ.
The native vegetation of the Yellow River Delta is mainly Phragmites australis, Suaeda salsa and Spartina alterniflora. Studies have shown that the restoration of Phragmites australis can significantly increase soil moisture content, reduce soil salinity, and provide habitat for migratory birds. Suaeda salsa is a salt polyethylene plant, which is prone to high humidity, saline-alkali resistance and barren resistance. Suaeda salsa growing in saline-alkali land can absorb and store water through succulent stems and leaves, and dilute the concentration of salt absorbed from the soil and transported to the plant, so as to improve soil salinity. In the low-tide zone, the tiller mutant of Spartina alterniflora is washed into the sea by seawater, which accelerates the outward expansion of Spartina alterniflora. Moreover, because of its high tolerance and adaptability to saline-alkali land, Spartina alterniflora seriously damages native species (Meng et al., 2020). In our field investigation, Spartina alterniflora, Phragmites australis and Suaeda salsa were photographed in situ, as shown in Figure 1C-E respectively. It can be seen that Phragmites australis and Spartina alterniflora are similar in appearance, mainly in green. Suaeda salsa is short and red in color, which is significantly different from Phragmites australis and Spartina alterniflora.
Data
In this paper, Sentinel-2 optical remote sensing satellite data were used to monitor the wetland vegetation in the Yellow River Delta. Sentinel-2 satellite (Spoto et al., 2012) consists of two satellites in synchronous orbit, which completed satellite network observation in 2017 (Sentinel-2A satellite was launched in June 2015, and Sentinel-2B satellite was launched in March 2017). After the network observation of these two satellites, the revisiting period in low latitude area is 5 days, and the revisiting period in high latitude area is only 3 days. Each of the Sentinel-2A/B satellites carries a MultiSpectral Imager (MSI) that captures images in 13 spectral bands with ground resolutions of 10m, 20m and 60m respectively. There are two product levels of Sentinel-2 data: Level-1C and Level-2A. The product of Level-1C is the original reflection data of the atmosphere at the top, and the product of Level-2A is the surface reflection data released by the European Space Agency (ESA) after atmospheric correction.
In this paper, Sentinel-2A Level-2A products were selected. The band B2 (Blue, 490nm), band B3 (Green, 560nm), band B4 (Red, 665nm), and band B8 (NIR, 842nm) with 10-meter resolution were used to calculate Normalized Difference Vegetation Index (NDVI), sample selection and accuracy verification. A total of 46 Sentinel-2A images were selected in this paper, including 25 images in 2018 and 21 images in 2020. The number of Sentinel-2A images acquired in different months in 2018 and 2020 is shown in Figure 2.
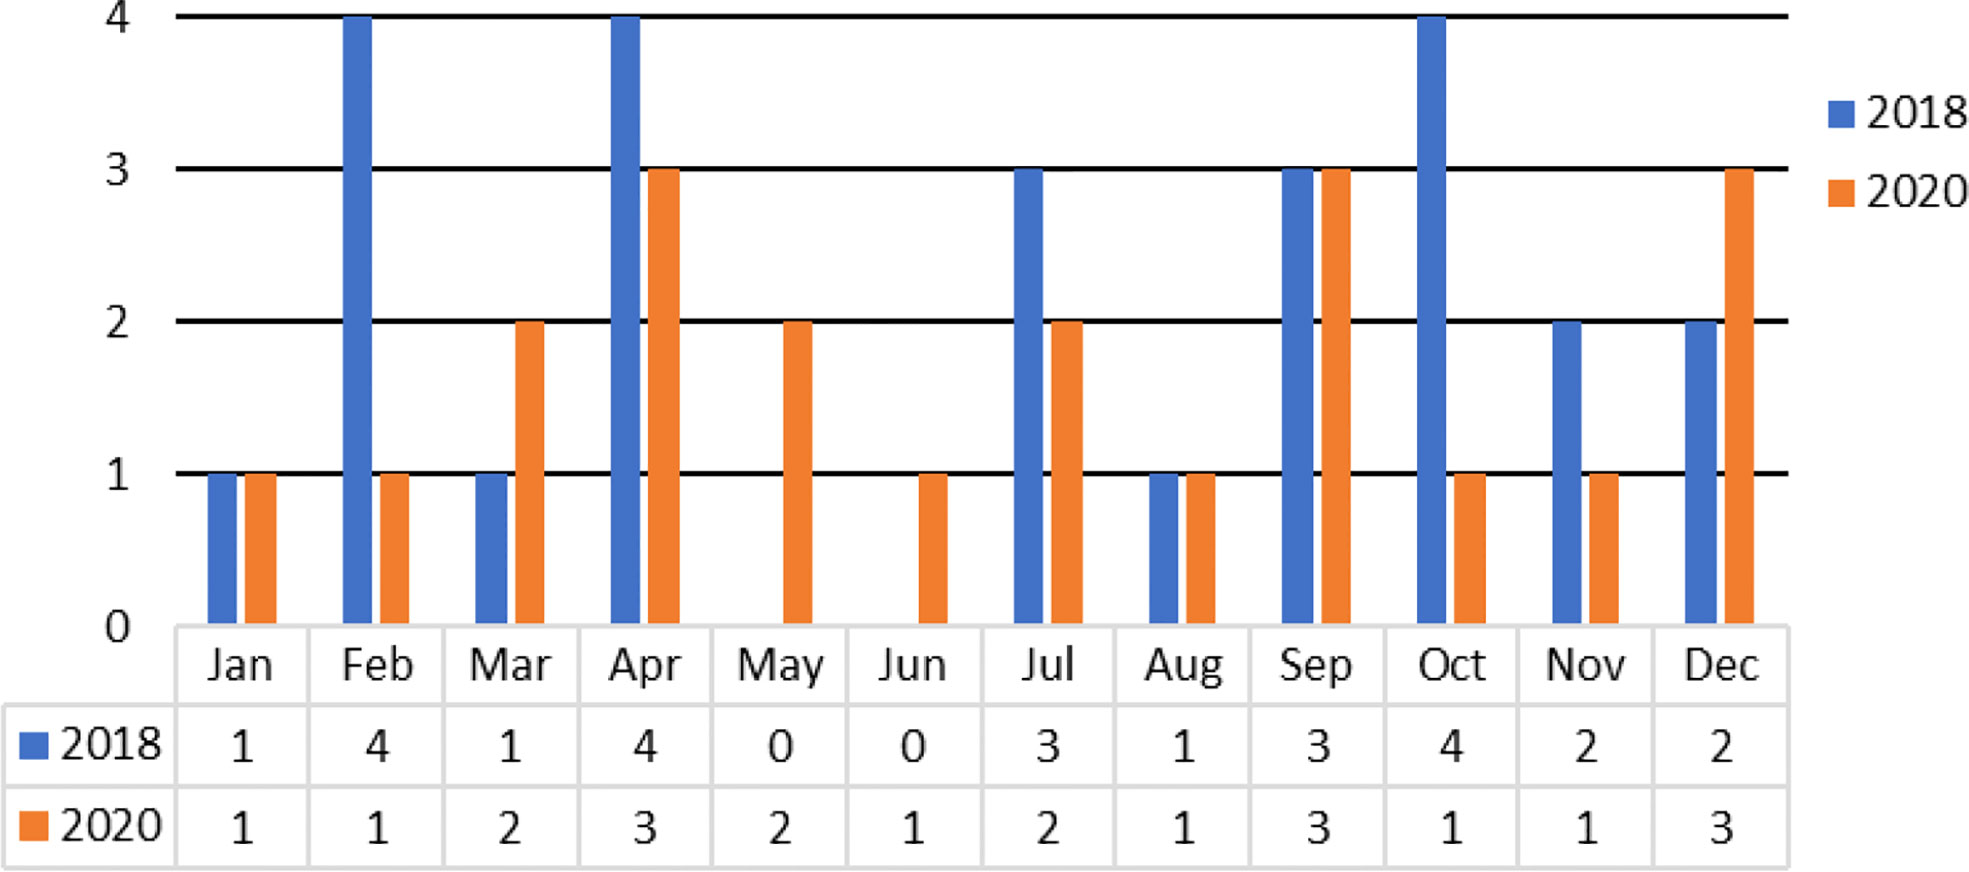
Figure 2 The number of Sentinel-2A images acquired in different months in 2018 and 2020.
Method
To improve the accurate of monitoring vegetation in the Yellow River Delta wetlands, a method for extracting the wetland vegetation and change analysis using short time series NDVI data set was constructed based on PIE-Engine remote sensing cloud computing platform. Firstly, PIE-Engine was used for cloud screening, cloud removal and calculating the NDVI. Then, the Sentinel-2 images with large cloud coverage were removed by visual screening, and the short time series NDVI data were constructed. Finally, SVM classifier was used to monitor and classify wetland vegetation, and thematic maps of wetland vegetation coverage in 2018 and 2020 were obtained. On this basis, the land cover transfer matrix was calculated to analyze the wetland vegetation pattern and spatio-temporal evolution from 2018 to 2020. The overall flow chart is shown in Figure 3.
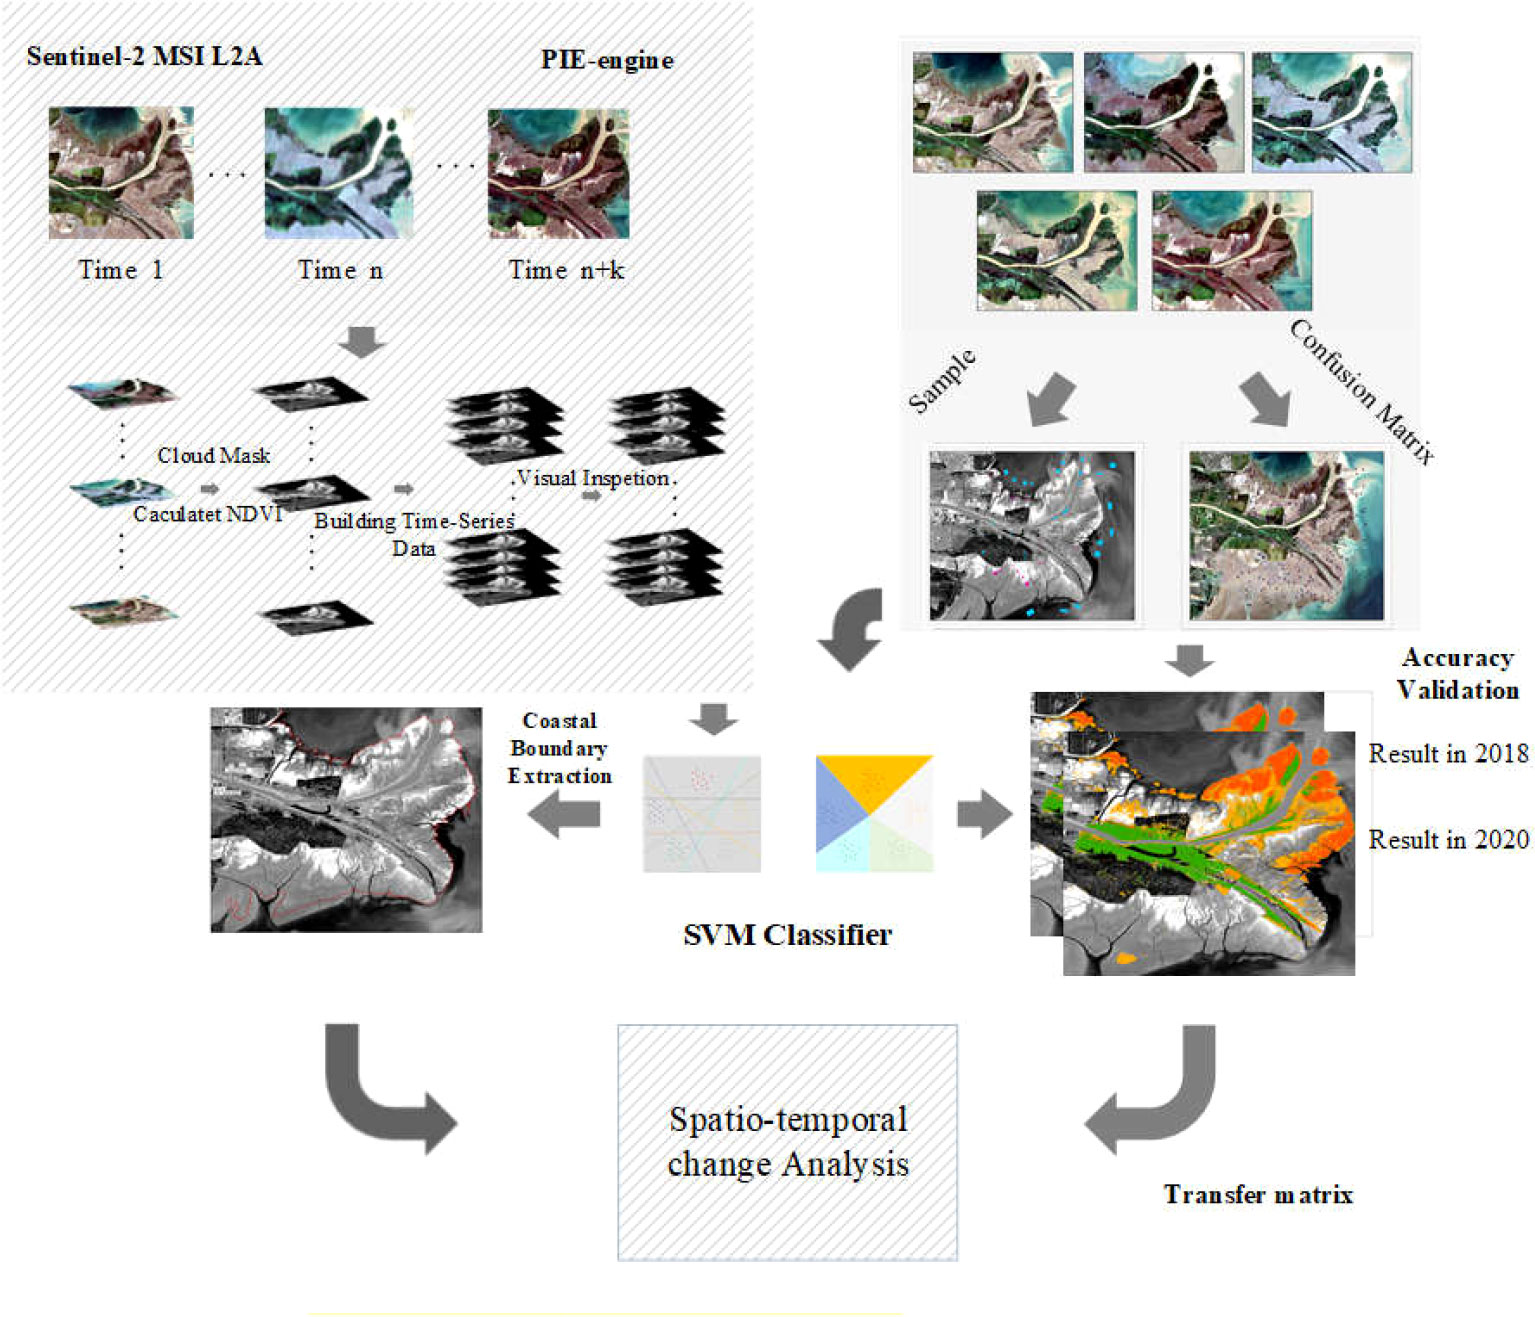
Figure 3 Overall flow chart for analyzing vegetation changes in the Yellow River Delta wetlands from 2018 to 2020.
Construction of time series NDVI data set
NDVI is an important vegetation index for vegetation classification and biomass reproduction, which is widely used in monitoring the wetland vegetation (Mahdianpari et al., 2018; Sun et al., 2020). In this paper, based on PIE-Engine remote sensing computing cloud platform, Sentinel-2A surface reflectance data with cloud cover less 40% were obtained. Cloud detection band (QA60) was used to remove cloud from the Sentinel-2A image. Then, the NDVI of each Sentinel-2A image was calculated according to different bands (Sun et al., 2021). The calculation formula of NDVI is as follows:
Where Nir and Red represent the band B8 and band B4 of Senienel-2 MSI respectively.
According to the time of Sentinel-2A image acquisition, the calculated NDVI are matched pixel by pixel according to pixel coordinates to construct short time series NDVI data set. The creation process is completed on the PIE-Engine platform.
The cloud cover is calculated from the whole image, but the area of the study area is less than 1% of the Sentine-2 image area, so the low volume screening value may abandon part of the effective data. In order to obtain more available images, the threshold range of cloud cover screening is set to be large (0~40%) in the process of data acquisition. The short-time sequence NDVI data of multiple bands were obtained through the cloud platform, and the band serial number of corresponding time was obtained. Through visual interpretation of true color images, the bands which completely blocked in the study area were removed, and the images which partially blocked by clouds and fog were retained. But the results in a large range of null value areas in calculating NDVI data after cloud removal of some images in the study area. To solve this problem, visual inspection method was adopted to remove the image with large missing areas, so as to avoid interference caused by cloud cover in the process of obtaining original data. For the empty values in NDVI data after cloud removal, the nearest neighbor interpolation method was applied to fill the empty values in each pixel from the time dimension. Based on the attributes of the nearest pixel, the nearest neighbor algorithm was used to fill the missing attributes of the object behind the mask.
Time series NDVI analysis
The main vegetation communities in the Yellow River Delta region are rich, mainly including Phragmites australis, Spartina alterniflora and other vegetation suaeda grass is the main surface vegetation in this region. And they can be identified by visual interpretation in remote sensing images. In the classification process of this paper, the land features are classified into five categories, namely Spartina alterniflora (SA), Suaeda salsa (SS), Phragmites australis (PA), Open water (OW) and Tidal flat (TF). Among them, the buildings, saline-alkali land and tidal flats in the region with very similar spectral characteristics are divided into tidal flats. The distribution of Phragmites australis and Spartina alterniflora was relatively concentrated, and there were many intersections. The Sentinel-2 true-color images acquired from June to October in 2018 are shown in Figure 4. It can be seen from the figures that the characteristics of Phragmites australis, Spartina alterniflora and Suaeda salsa in different months are significantly different, and there are obvious seasonal changes. In the Sentinel-2 images from June to August, Phragmites australis was green. In Sentinel-2 images from August to October, Spartina alterniflora was green and Phragmites australis was dark purple. Suaeda salsa matures from October to November, showing “red carpet” on the Sentinel-2 images.
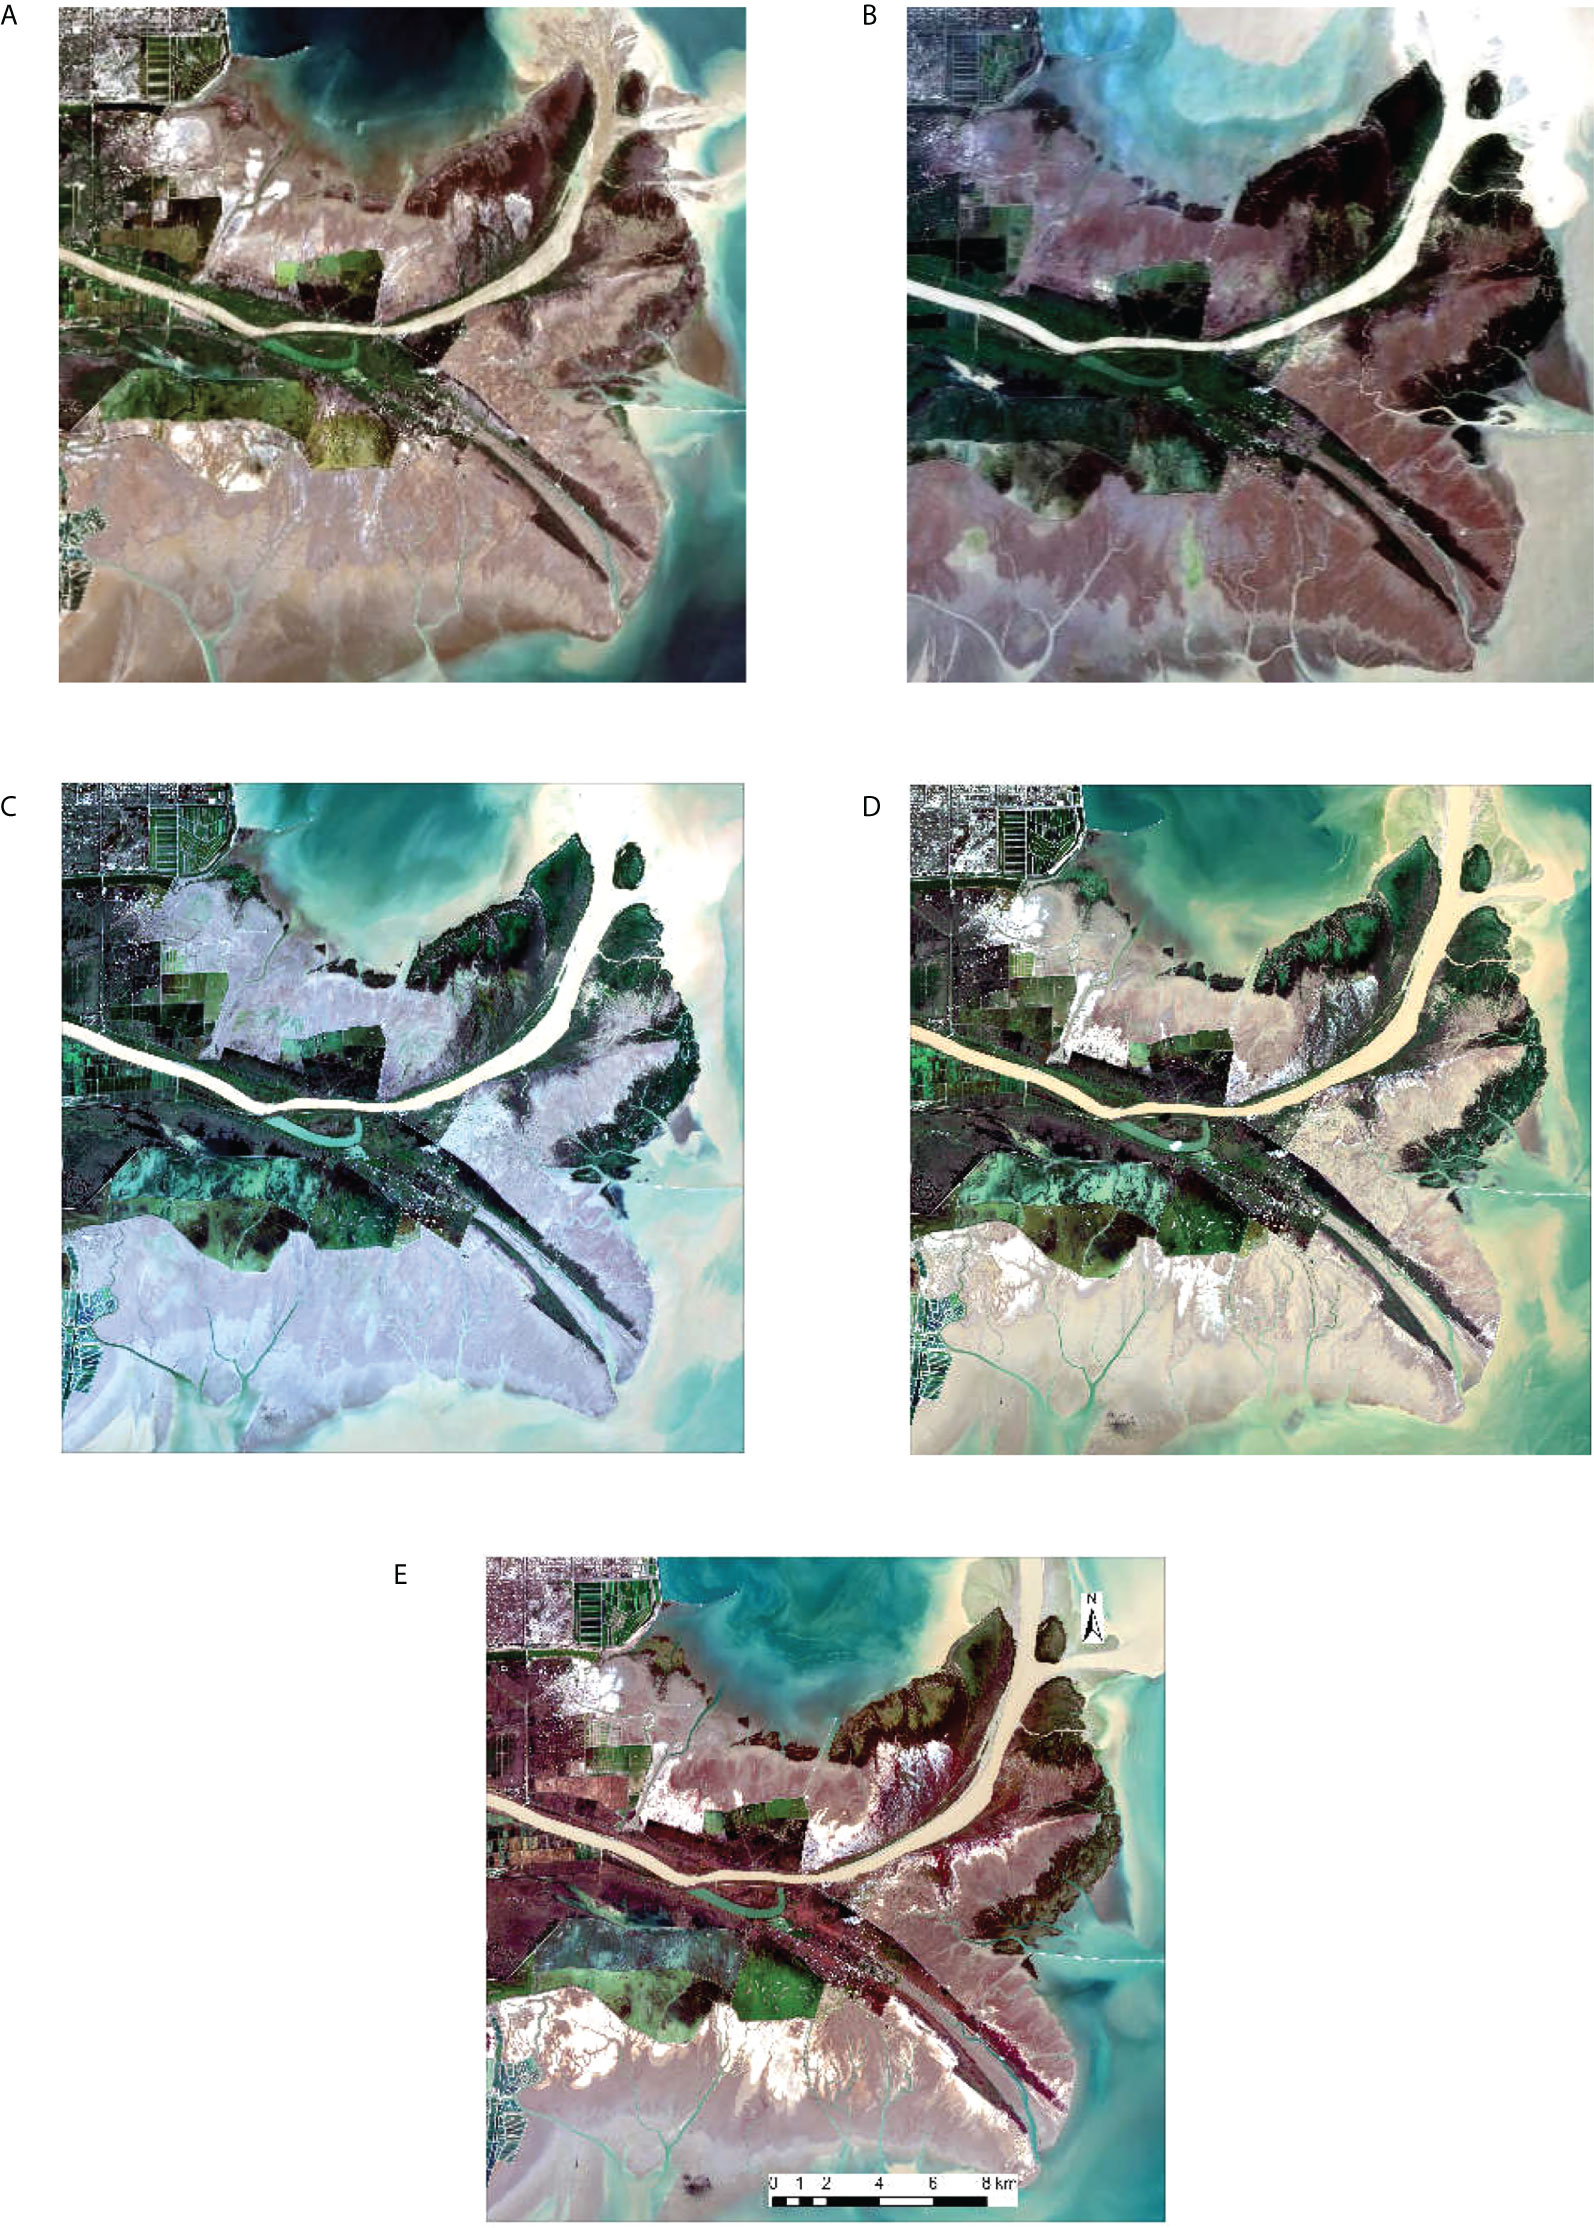
Figure 4 Sentinel-2 true-color images of the Yellow River Delta wetlands in 2018. (A) is the true-color image of Sentinel-2A acquired in June; (B) is the true-color image of Sentinel-2A acquired in July; (C) is the true-color image of Sentinel-2A acquired in August; (D) is the true-color image of Sentinel-2A acquired in September; (E) is the true-color image of Sentinel-2A acquired in October.
Based on true-color Sentinel-2 images, ground truth were selected and the distribution is shown in Figure 5A. According to the divided ground object types and time series data, the time series NDVI curves of different land objects in different months were counted, as shown in Figure 5B. It can be seen from the curves that there are significant differences in time series NDVI of different land types, which can provide a theoretical basis for subsequent classification.
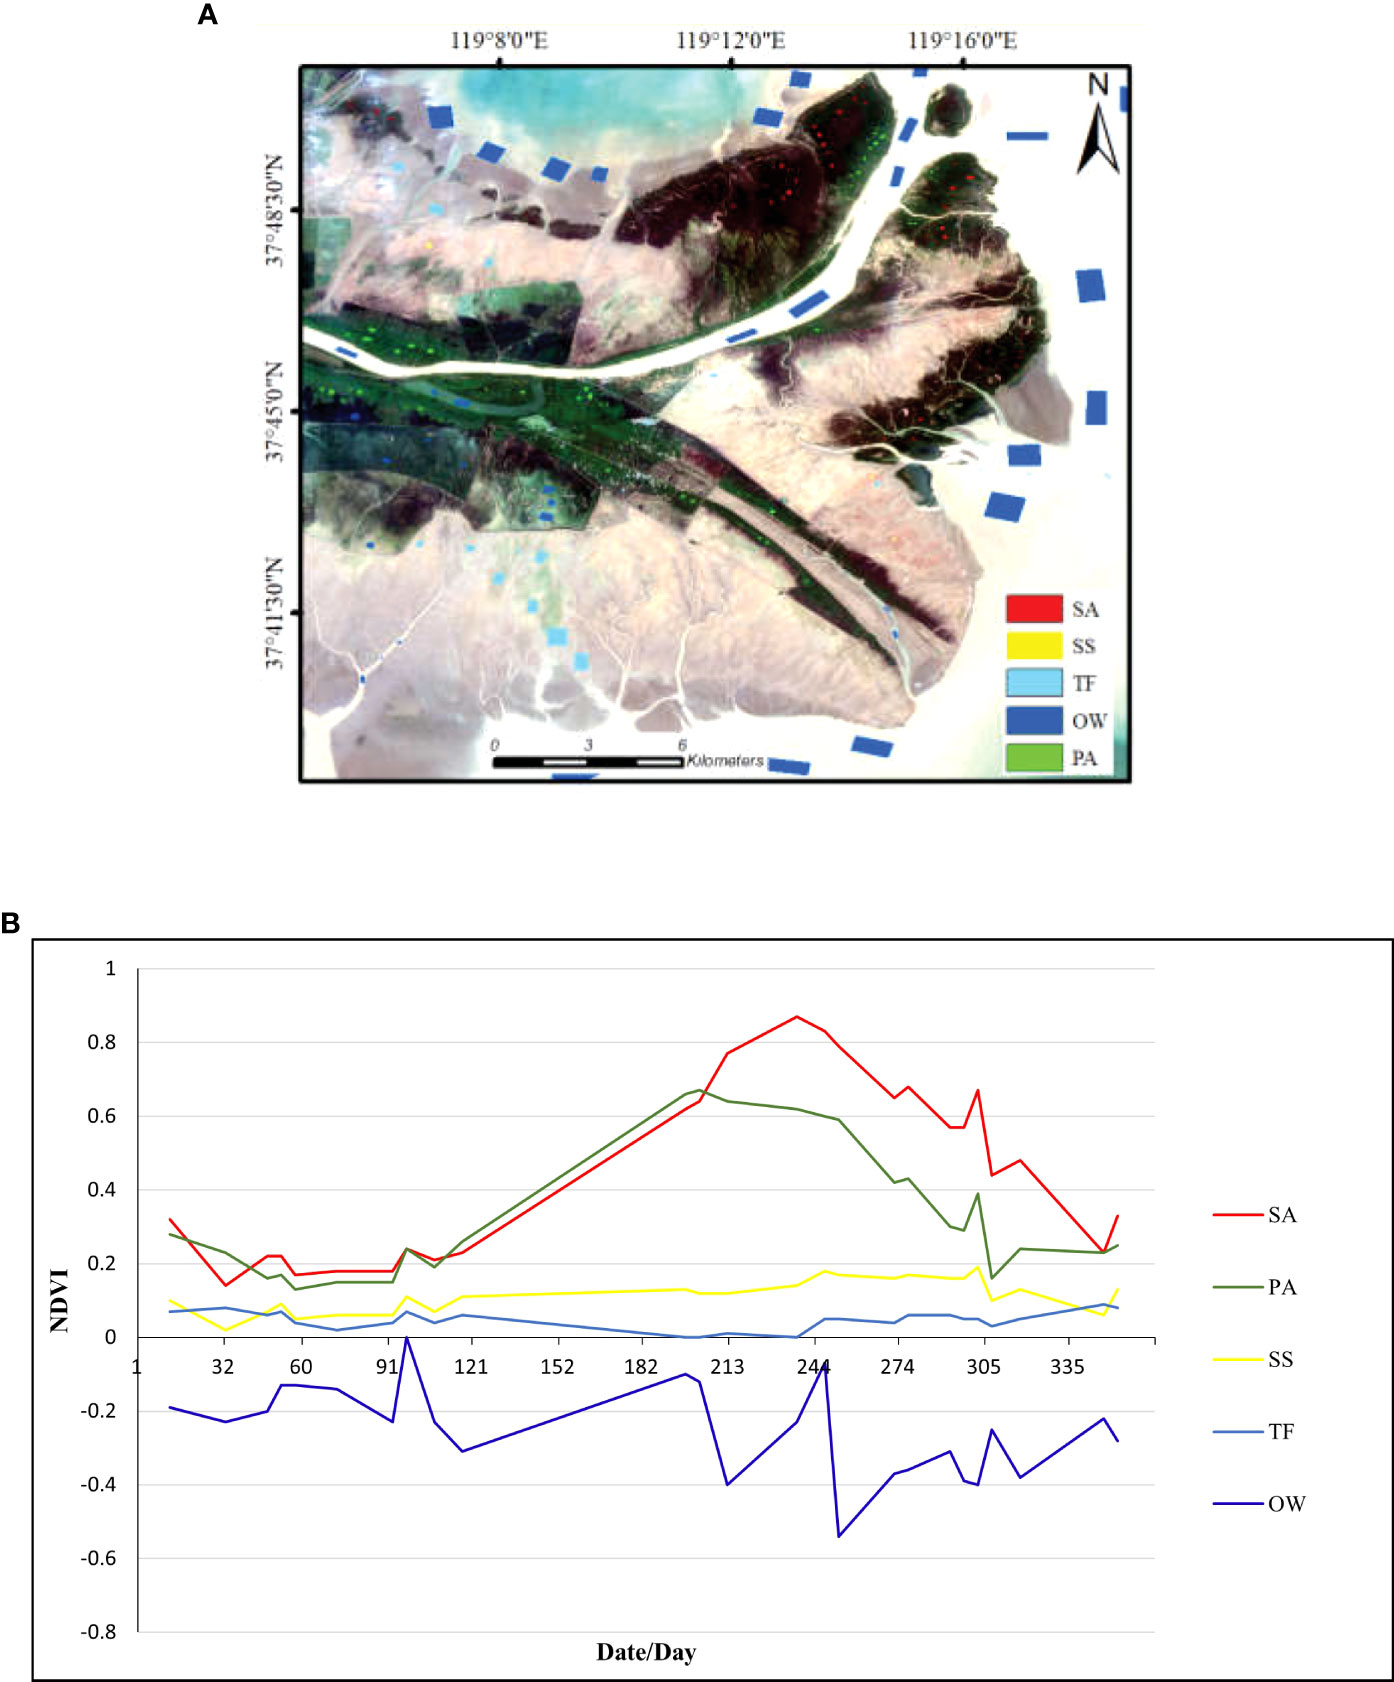
Figure 5 The training samples location and time series NDVI curves. (A) The distribution of training samples; (B) Time series NDVI curves based on training samples. SA, Spartina alterniflora; OW, Open water; TF, Tidal flat; SS, Suaeda salsa; PA, Phragmites australis.
SVM classification method
Support Vector Machine (SVM) classifier (Cortes and Vapnik, 1995) is widely used in monitoring the wetland vegetation because it can better deal with the imbalance of wetland vegetation samples (Ahmed et al., 2021; Zhang and Lin, 2022). The SVM classifier firstly normalizes the data, and then the data to be classified is mapped to the factor space of high dimension to find the optimal decision boundary and classify data into different categories. SVM was originally applied to binary classification problems. In two dimensions, two kinds of points that can be completely separated by a line are called linearly separable. The line that extends the two-dimensional space to the multi-dimensional space and divides each category: WTx+b=0 is called the hyperplane, which is the decision boundary of the furthest distance closest to the two types of samples sought by SVM. SVM obtains the optimal decision boundary by maximizing the solution to maximize margin. The binary classification problem is extended to the multi-classification problem, that is, for each class, it is treated as +1 class and all samples of the remaining M-1 classes are treated as -1 class, and a binary SVM is constructed. As shown in the Figure 6 below, for class 1 shown in the red dot, all other categories are regarded as -1 classes and binary SVM is constructed, whose decision boundary is gray dotted line. For the categories shown by the red dot, all other categories are regarded as -1 classes, and binary SVM is constructed, whose decision boundary is a red dotted line. We get others by the similar methods. SVM method classifies nonlinear data by identifying a decision boundary. In the case of non-linear data without linear classification, this decision boundary can increase the dimension of data artificially by using kernel function (Yu et al., 2021).
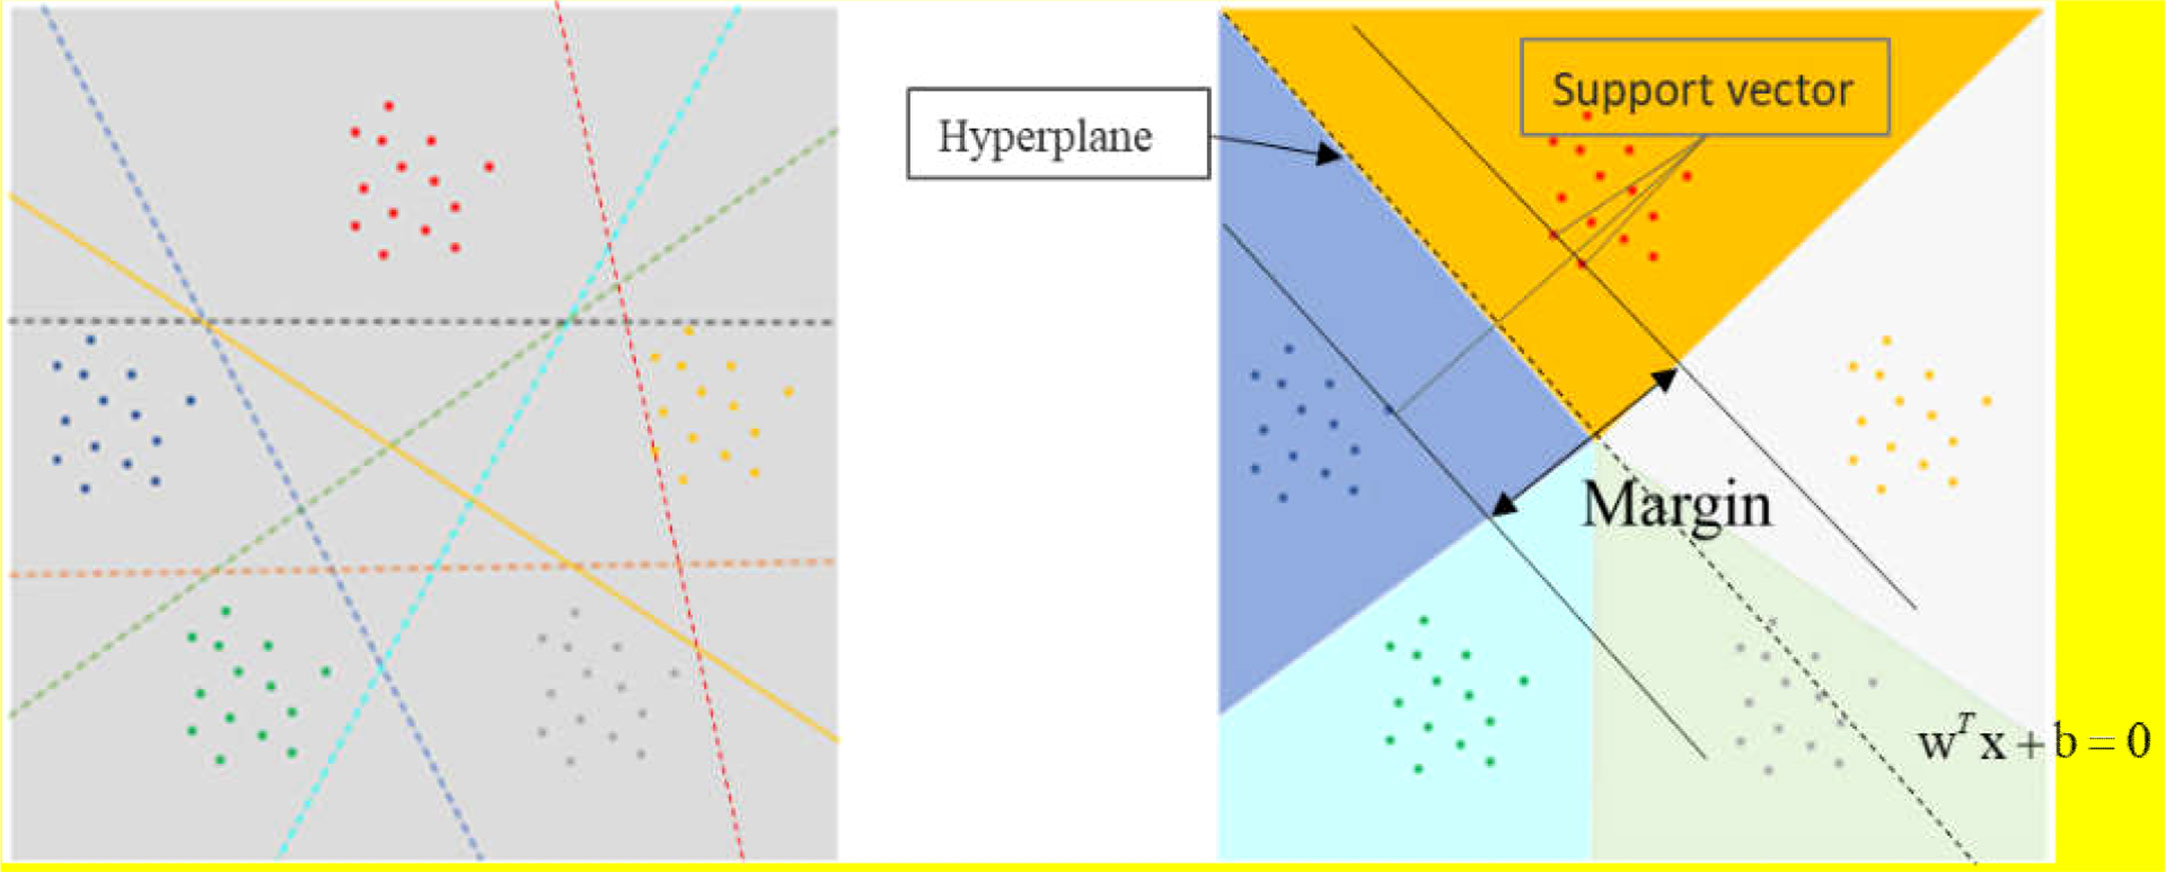
Figure 6 Classification principle of SVM.
In this paper, SVM classifier was used to classify wetland vegetation based on short time series NDVI data. The specific method was as follows: According to the different characteristics of five typical lands in different times in the Yellow River Delta wetlands, Sentinel-2 multi-temporal images were used as the judgment basis to select training samples; The constructed short time series NDVI data set and training samples were input into the SVM classifier. To ensure the objectivity of sample selection, the samples were randomly selected as training, and the maximum sampling value was set to 500.
Results
Classification results
According to 46 Sentinel-2 optical remote sensing images in 2018 and 2020, the wetland types in the Yellow River Delta are classified based on the method constructed in this paper, and the classification results are shown in Figure 7. The classification result in 2018 is shown in Figure 7A, and the classification result in 2020 is shown in Figure 7B. Legends are all represented in the lower right corner of the figures, where the red represents Spartina alterniflora, green represents Phragmites australis, yellow represents Suaeda salsa, sky blue represents Tidal flat, and dark blue represents Open water.
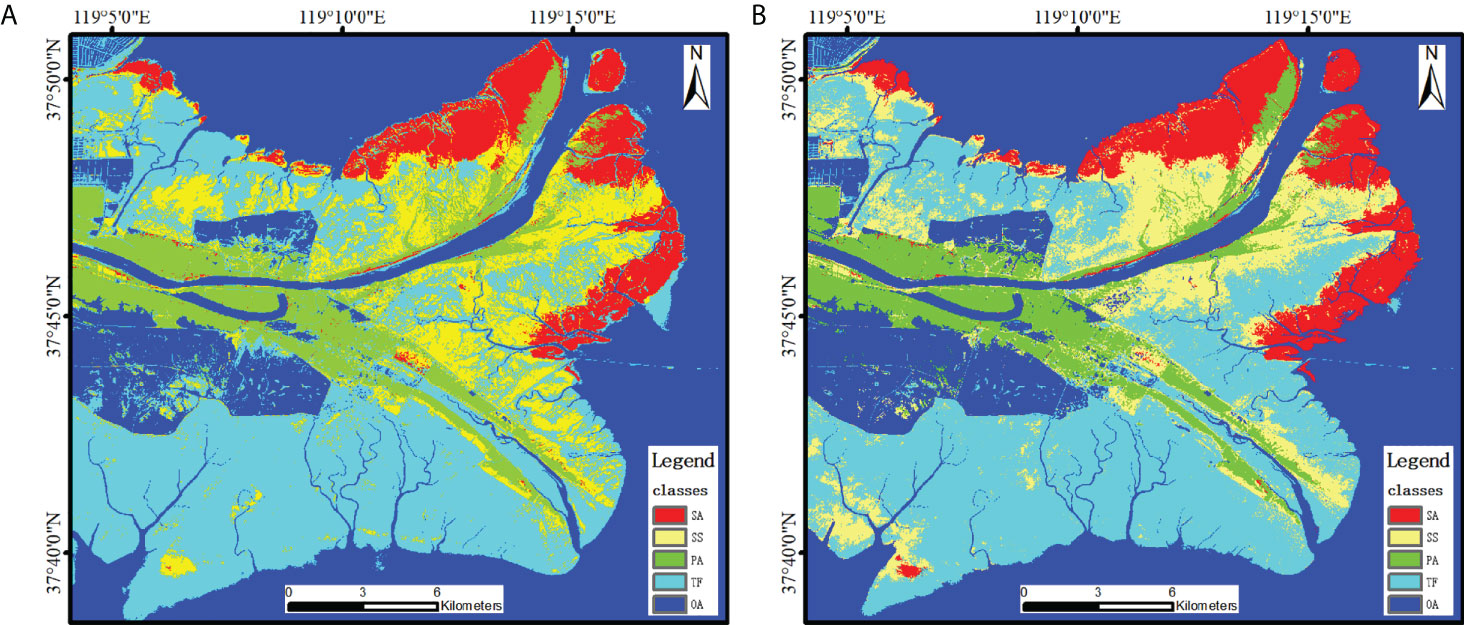
Figure 7 Classification results from the method constructed in this paper. (A) is the classification result in 2018. (B) is the classification result in 2020.
As can be seen from Figure 7, the distribution of ground objects in the Yellow River Delta wetlands was complex. In 2018 and 2020, and a large amount of Spartina alterniflora was distributed along the estuary. At the same time, there was a lot of trivial Suaeda salsa in the Tidal flat, especially in the west of the estuary, but it can be seen that the number of Suaeda salsa is significantly reduced. Phragmites australis were mainly distributed on both sides of the Yellow River channel. There is obvious interlacing between Spartina alterniflora and Phragmites australis near the estuary, and the situation is similar in 2018 and 2020. In general, the cover pattern of wetland vegetation in the Yellow River Delta is as follows: from the coastal edge to the Yellow River channel, the vegetation distribution presents a pattern of “Spartina alterniflora - Suaeda salsa - Phragmites australis”.
Accuracy verification
Confusion matrix verification (Townsend, 1971) has been proved to be effective in verifying classification accuracy. In this paper, combined with GF-2 remote sensing images with high resolution, Google Earth images and the classification results of other scholars (Wang et al., 2022; Li Z. J. et al., 2022; Zhang B. et al., 2019), 127 verification samples were used to evaluate the accuracy of classification results. The locations of verification samples are shown in Figure 8. The number of verification samples is as follows: 27 Spartina alterniflora, 24 Suaeda salsa, 24 Phragmites australis, 36 Tidal flats, and 16 Open water.
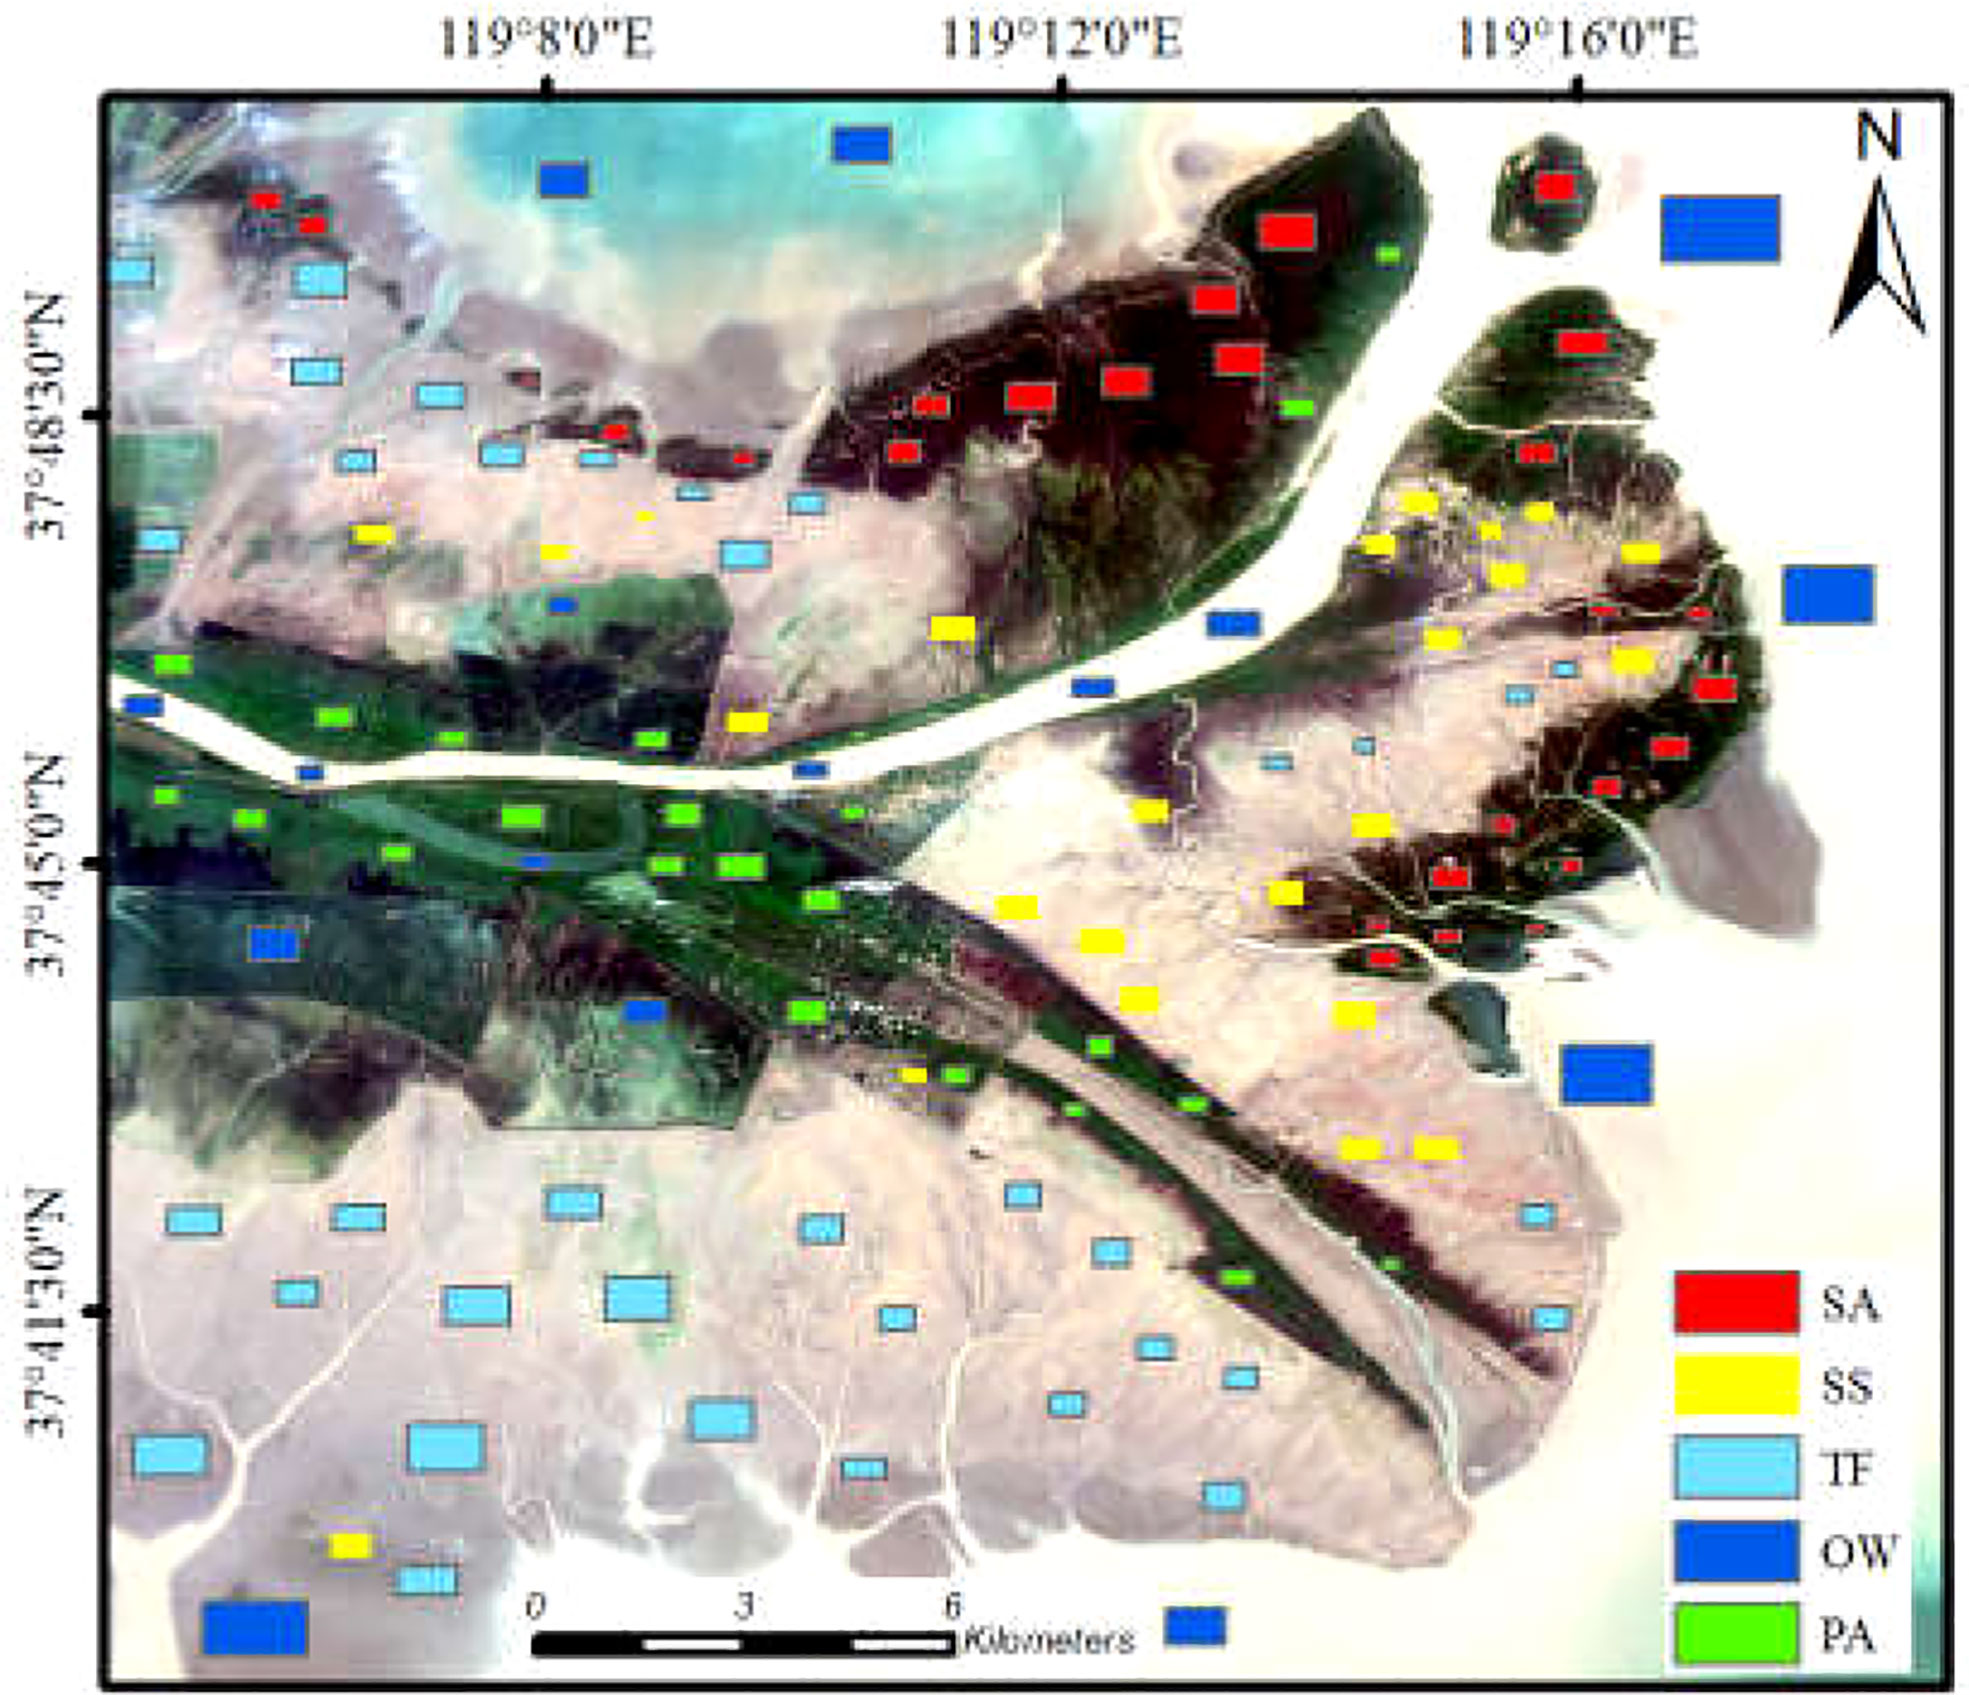
Figure 8 The distribution of Verification samples.
The accuracy verification results are shown in Table 1. The overall classification accuracies in 2018 and 2020 are 90.47% and 80.30% respectively, and the kappa coefficients in 2018 and 2020 are 0.874 and 0.739 respectively. It is worth noting that in 2018 and 2020, the classification accuracies of Spartina alterniflora are high, about 94.34% and 96.72% respectively. It can be concluded that the method proposed in this paper can achieve good classification accuracy, and it can meet the needs of spatial and temporal change analysis of wetland vegetation.
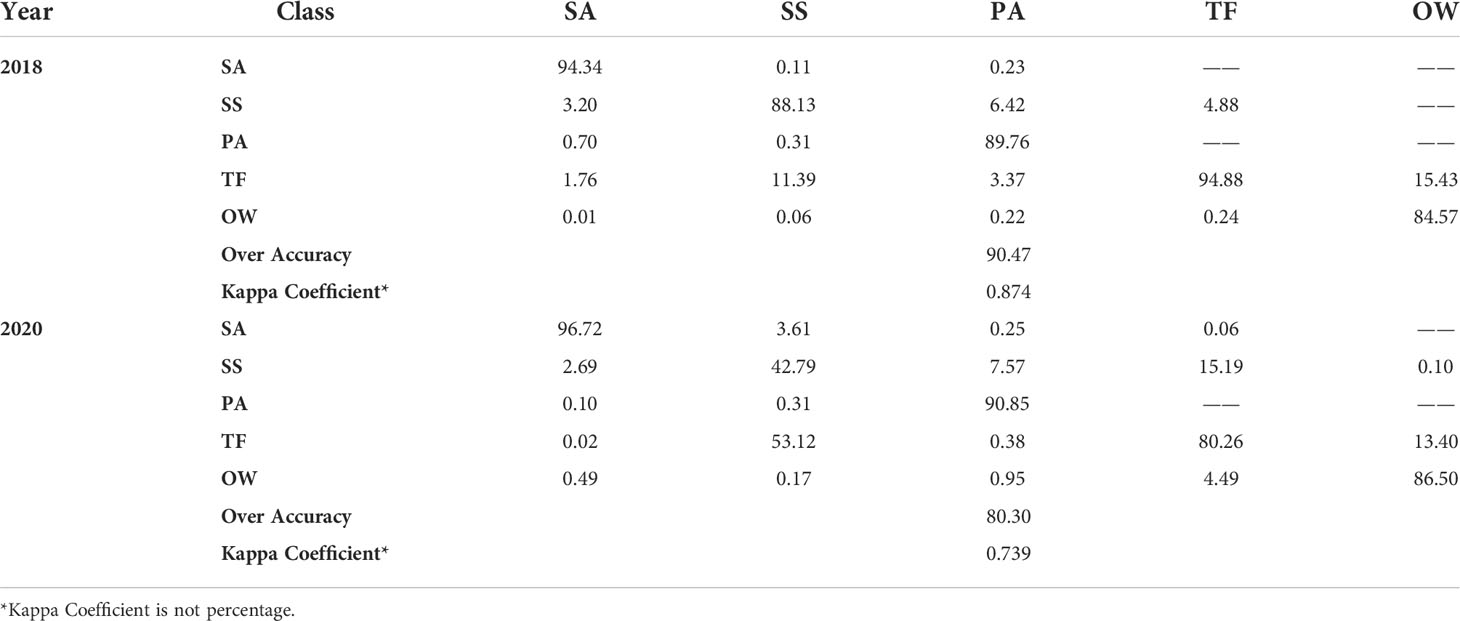
Table 1 Accuracy verification of the classification results in 2018 and 2020 from the method constructed in this paper.
In order to verify the advantages of the proposed method in monitoring the wetland vegetation types, the classification result in 2018 from the proposed method was compared with the classification results obtained by two traditional classification methods: the maximum likelihood classification method and the random forest classification method. Figure 9A is the result from the proposed method; Figure 9B is the result from the random forest classification method; Figure 9C is the result from the maximum likelihood classification method. As can be seen from Figure 9, the classification result from the proposed method in this paper is relatively smooth, especially the distribution of Spartina alterniflora is relatively consistent with the real situation. In addition, Tidal flat also shows a more realistic classification effect.
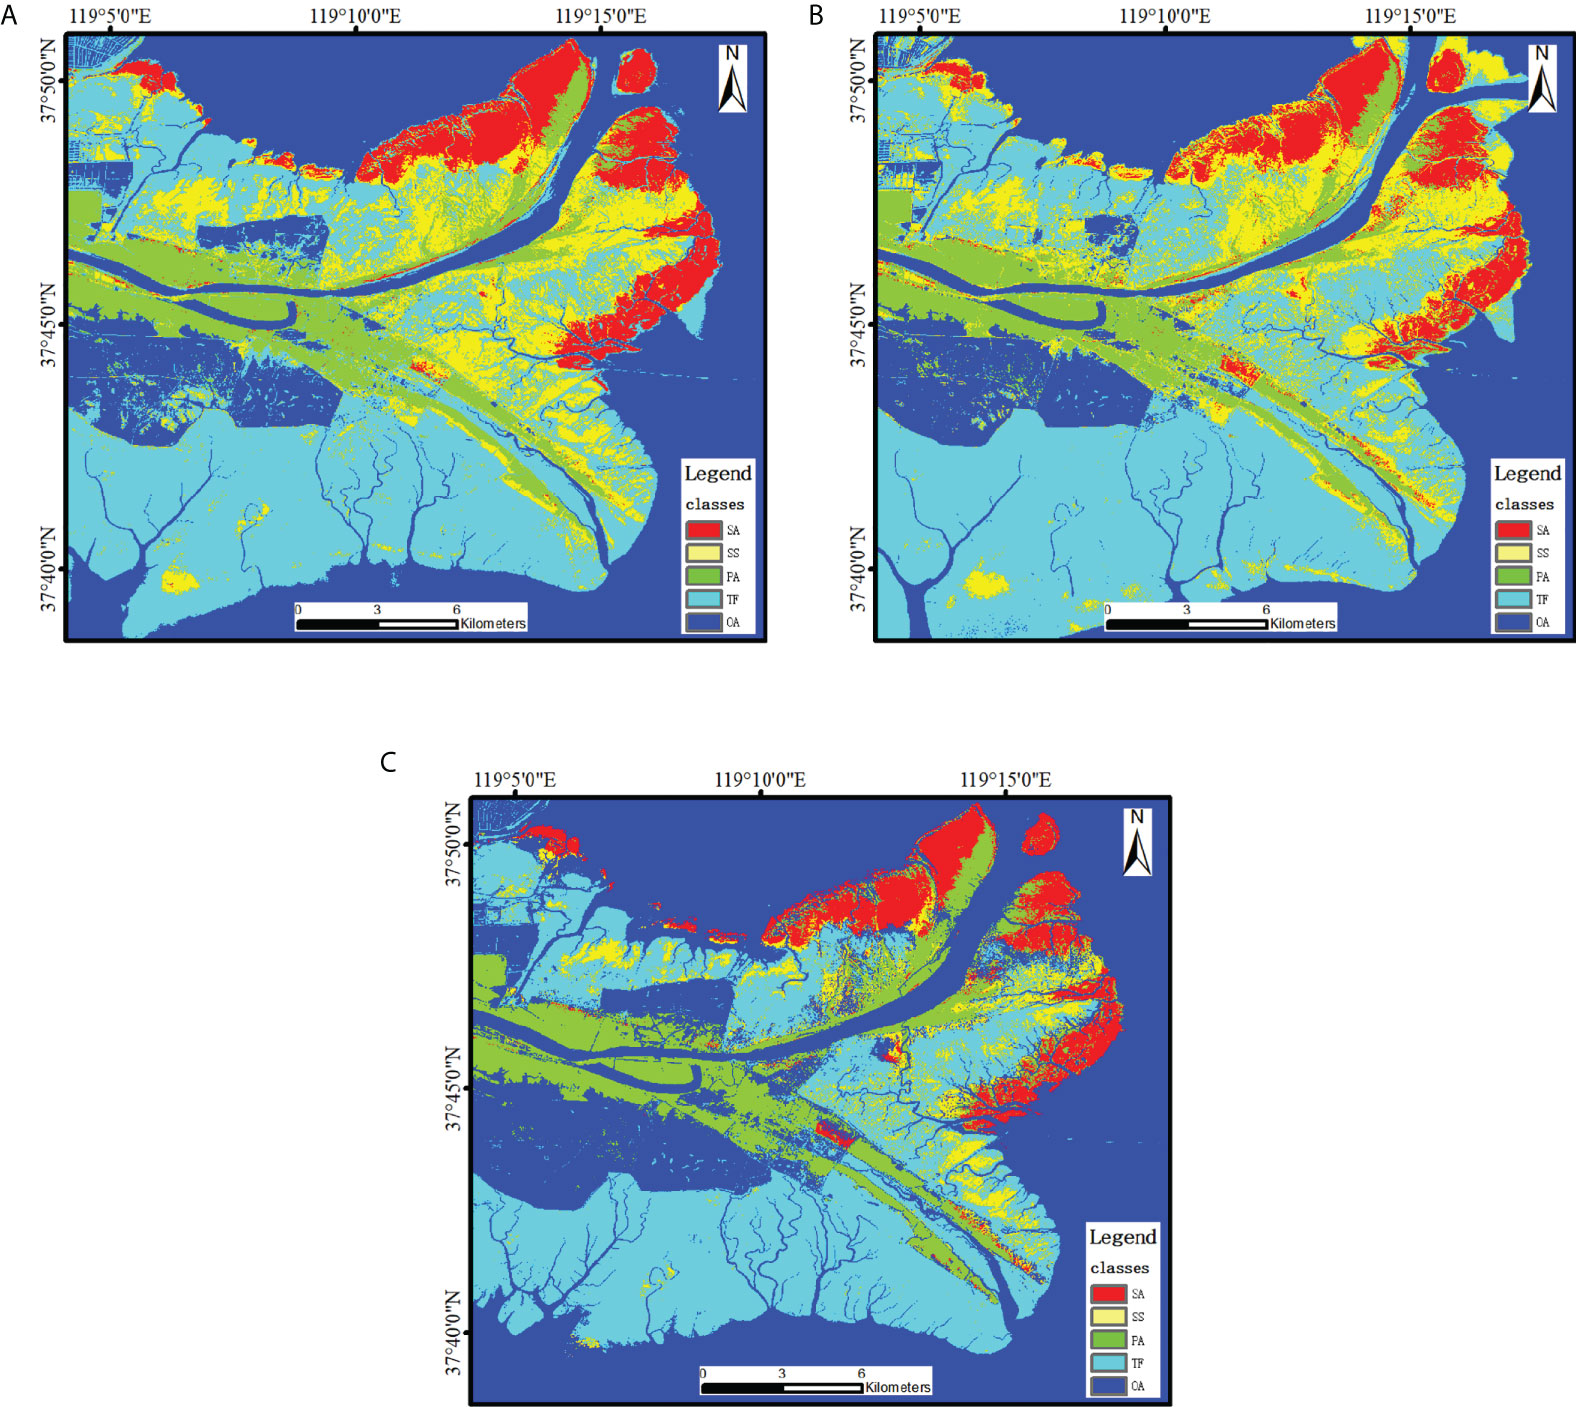
Figure 9 Comparison of different classification methods in 2018. (A) is the result from the proposed method; (B) is the result from the random forest classification method; (C) is the result from the maximum likelihood classification method.
The same verification samples of the confusion matrix verification method were used to verify the accuracy of the three classification results in 2018, and the obtained accuracy is shown in Table 2. As can be seen from the table, compared with the random forest classification, the overall accuracy and Kappa coefficient of the proposed method were improved by 6.40% and 0.088, and the classification accuracy of Spartina alterniflora was improved by 12.13%. Compared with the maximum likelihood classification, the overall accuracy and Kappa coefficient of the proposed method were improved by 13.04% and 0.174, and the classification accuracy of Spartina alterniflora was improved by 10.68%. Therefore, the proposed method has achieved better results in monitoring the vegetation types in the Yellow River Delta wetlands. Especially in the monitoring Spartina alterniflora, the accuracy has significantly improved.
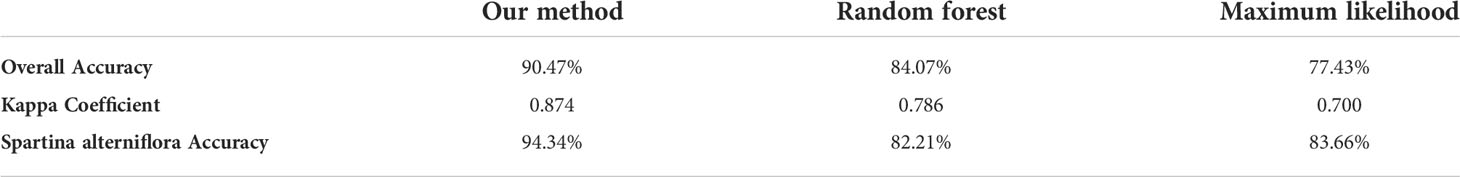
Table 2 Accuracy verification of different classification methods in 2018.
Discussion and analysis
Wetland vegetation change
To explore the process of wetland vegetation change, the transfer matrix of land use type was calculated based on the classification results in the Yellow River Delta wetlands in 2018 and 2020, as shown in Table 3, and the distribution and change of wetland vegetation were analyzed. According to Table 3, the coverage areas of Spartina alterniflora, Suaeda salsa and Phragmites australis in 2018 were 31.72 km2, 52.46 km2 and 38.46 km2, respectively. In 2020, the coverage areas of Spartina alterniflora, Suaeda salsa and Phragmites australis were 35.46 km2, 32.08 km2 and 39.52 km2, respectively. Compared with 2018, the coverage area of Spartina alterniflora increased by 3.74 km2, the coverage area of Phragmites australis increased by 1.06 km2, and the coverage area of Suaeda salsa decreased by 20.38 km2.
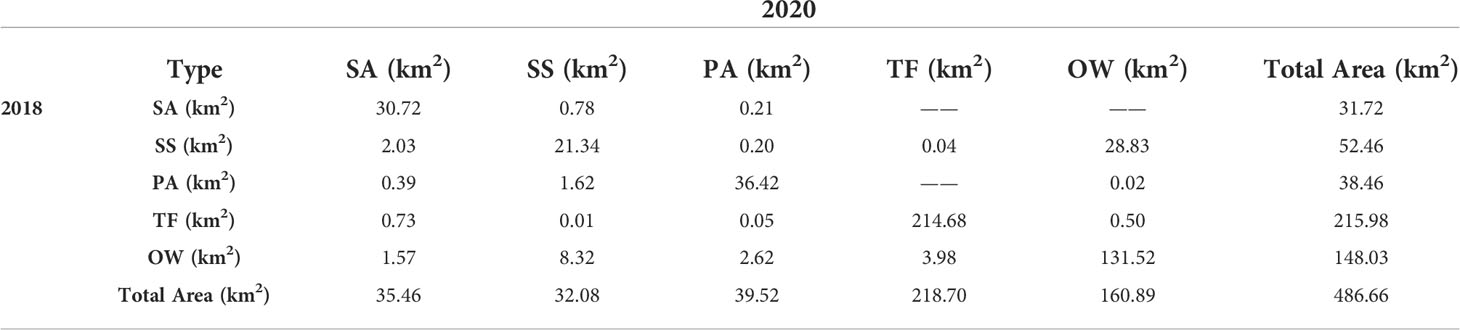
Table 3 Land cover transfer matrix from 2018 to 2020 in Yellow River Delta wetlands.
The growth of Phragmites australis vegetation community was relatively stable, mainly distributed in perennial or seasonal water flood beaches, depression and soil erosion zone at the Yellow River estuary. In the boundary between Spartina alterniflora and Phragmites australis on both sides of the estuary, the area of Phragmites australis decreased by 0.39 km2 due to the expansion of Spartina alterniflora. However, some Spartina alterniflora were also replaced by Phragmite australis in the Yellow River estuary. Figure 10 shows the change of wetland vegetation coverage. In Figure 10, a large area of Suaeda salsa disappeared, as shown in blue. This area was eroded by soil salinization, resulting in vegetation degradation, which requires more attention. Spartina alterniflora was mainly distributed in the south and north sides of the Yellow River estuary. From 2018 to 2020, Spartina alterniflora increased by 3.74 km2, and its expansion rate was 11.8%. The expansion area was concentrated in the boundary area of Spartina alterniflora and Suaeda salsa and the boundary area of Spartina alterniflora and Phragmites australis, and a total of 2.42 km2 of Phragmites australis and Suaeda salsa were invaded. The direction of expansion was from Spartina alterniflora to Phragmites australis and Suaeda salsa. In terms of species competition, Spartina alterniflora had good adaptability to saline-alkali wetland environment, and the continuous growth of Spartina alterniflora seriously invaded the living space of Suaeda salsa and Phragmites australis. On both sides of the Yellow River estuary, Spartina alterniflora increased significantly and replaced part of Phragmites australis from 2018 to 2020.
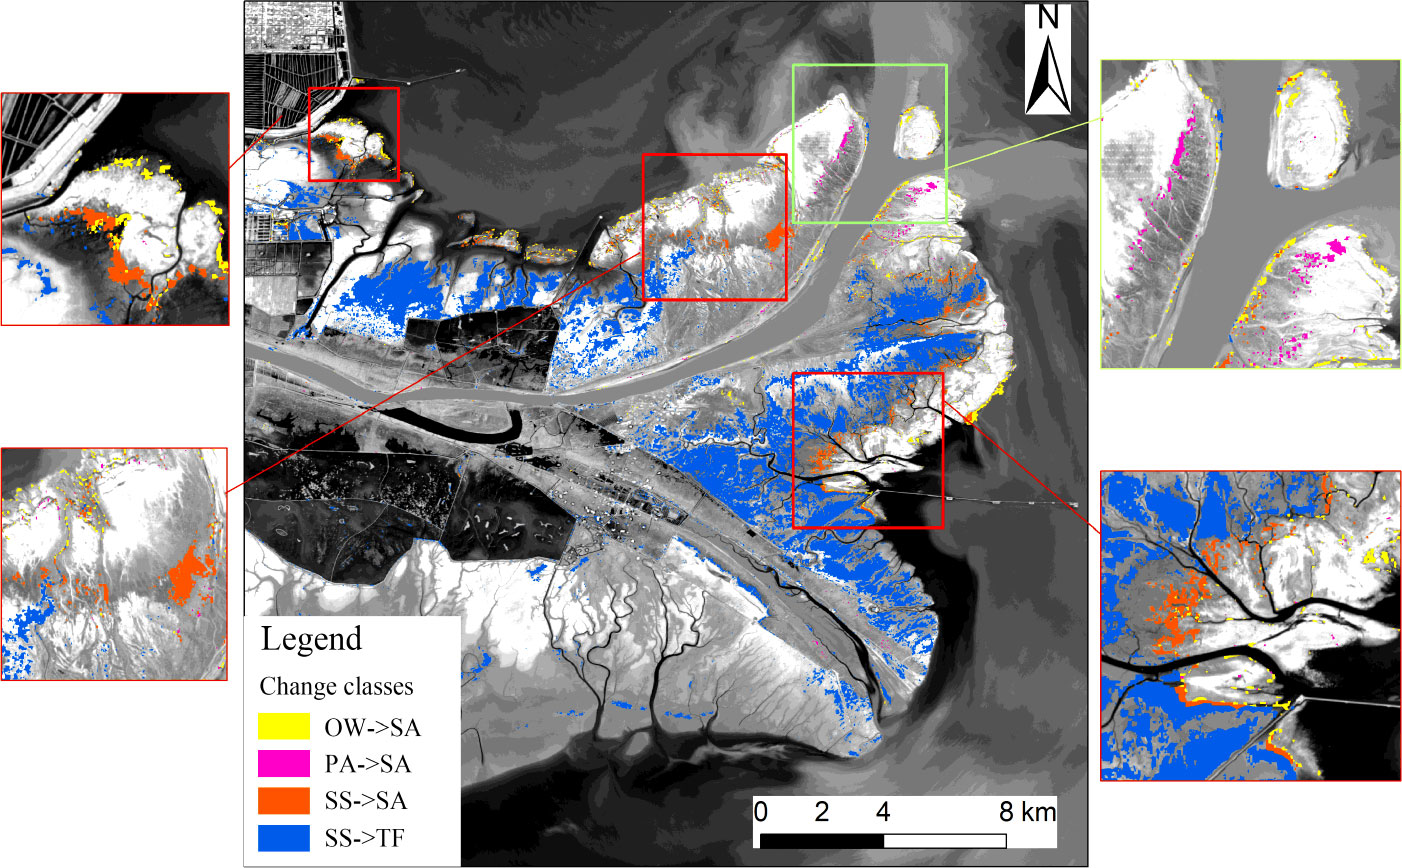
Figure 10 Typical vegetation cover changes map. The yellow represents the change from Open water to Spartina alterniflora. The violet represents the change from Phragmites australis to Spartina alterniflora. The red represents the change from Suaeda salsa to Spartina alterniflora. The blue represents the change from Suaeda salsa to Tidal flat.
Spartina alterniflora change and ecological benefit
Using remote sensing images to extract coastline data can usually accurately separate water and land areas (Chen et al., 2022). In this paper, to further analyze the expansion of invasive species Spartina alterniflora at the Yellow River estuary, the classification results were combined to obtain the binary image of land and sea, and the cavity filling was carried out. The filled binary image was vectorized as the land and sea boundary. Because the method adopted in this paper has high accuracy for Open water and other non-vegetation objects, it can obtain the water-land boundary with high precision. The distribution of Spartina alterniflora at the Yellow River estuary is shown in Figure 11. Figure 11A shows the distribution of Spartina alterniflora in 2018, and Figure 11B shows the distribution of Spartina alterniflora in 2020. Green vegetation communities can be observed in Tidal flats formed by sediment deposits outside the shoreline.
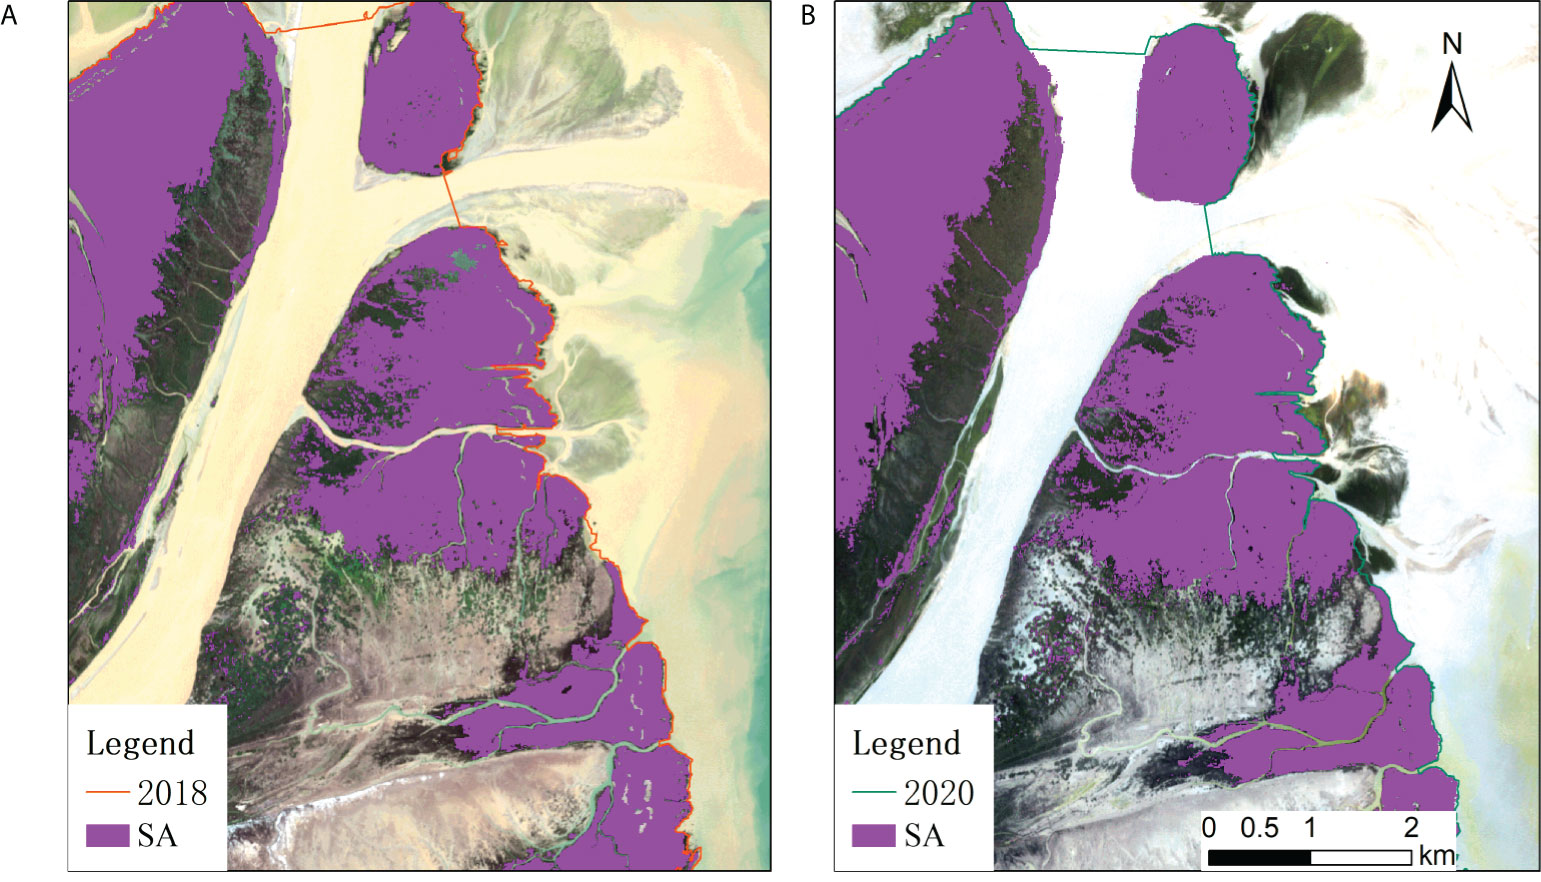
Figure 11 Water-land boundary map. (A) is the distribution of Spartina alterniflora in 2018; (B) is the distribution of Spartina alterniflora in 2020.
After the Yellow River carries a large amount of terrestrial sediment into the sea from the upper reaches, the land in the Yellow River Delta is deposited near the shore with the decrease in flow velocity. The coastline of the Yellow River Delta is vulnerable to sea erosion, so Spartina alterniflora is introduced to protect the coastline. Figure 12 shows the changes between land and water and the ever-present Spartina alterniflora area from 2018 to 2020. Combined with the extracted coastline, it can be found that in Figure 12, the water-land boundary of the area with Spartina alterniflora distribution in the red box at the bottom right presents a trend of outward expansion, as shown in the yellow area. There is no Spartina alterniflora distribution in the southwest and north coastal areas, and the water-land boundary is seriously eroded, as shown in the blue area. In the southwest of the Yellow River Delta wetlands (the bigger yellow box), Tidal flats are severely eroded by the sea. In Figure 12, Spartina alterniflora in the south showed a significant trend of outward expansion, as shown in the red area. In conclusion, Spartina alterniflora effectively attenuates seawater erosion and plays a positive ecological benefit in protecting the coastline.
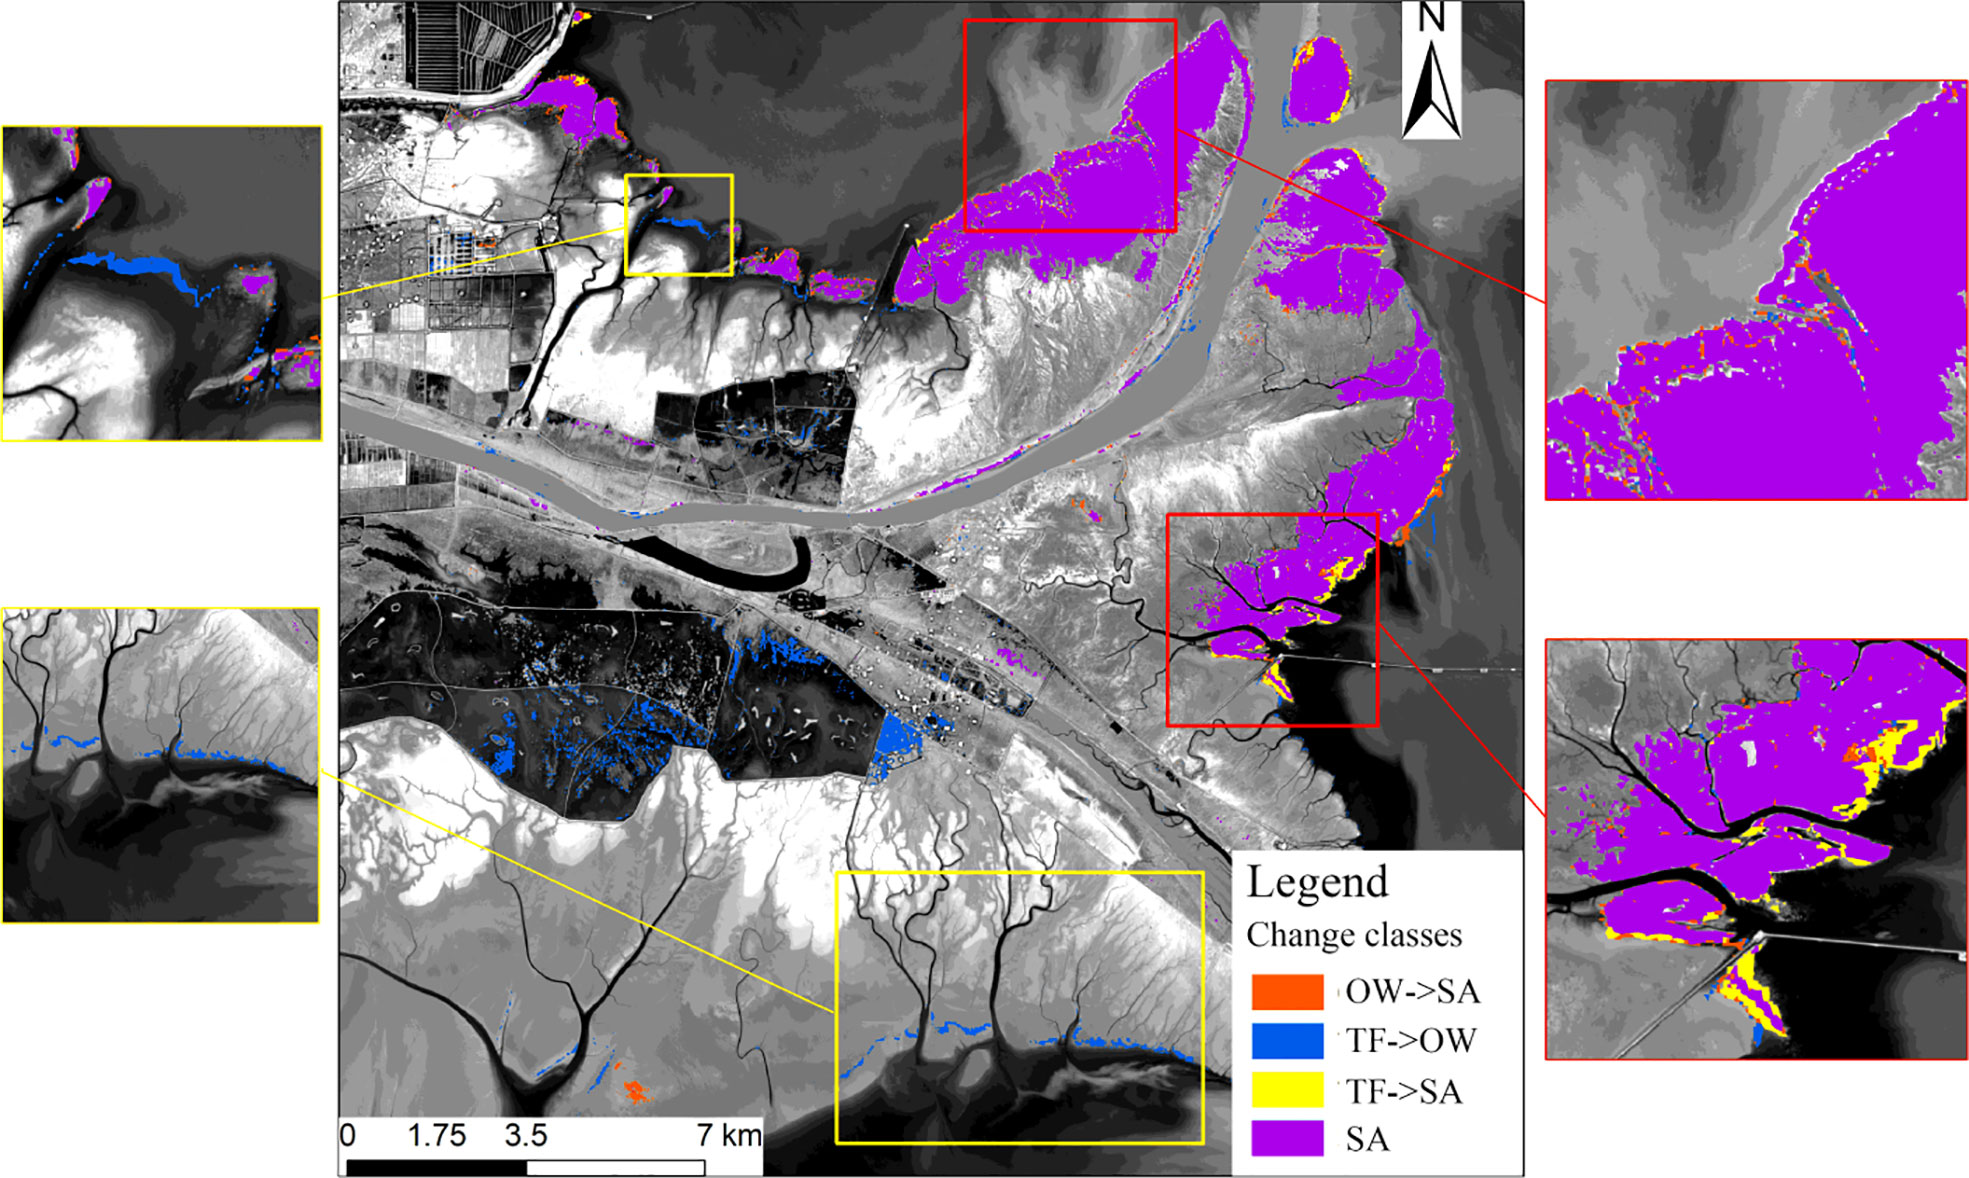
Figure 12 Land and water changes from 2018 to 2020.
Conclusions
In this paper, based on PIE-Engine remote sensing cloud computing platform and 46 Sentinel-2 optical remote sensing images, a method for extracting wetland vegetation based on short time series NDVI data set was constructed. SVM classifier was used to classify the main vegetation in the Yellow River Delta wetlands in 2018 and 2020, and the change of wetland vegetation from 2018 to 2020 was analyzed. Some important conclusions can be drawn:
1. The overall accuracy of vegetation classification in 2018 and 2020 obtained by using the method proposed in this paper are 90.47% and 80.30% respectively, and the Kappa coefficients are 0.874 and 0.739 respectively. Compared with the results from the random forest classification method and the maximum likelihood classification method, the overall accuracy is improved by 6.40% and 13.04%, the Kappa coefficient is improved by 0.088 and 0.174, and the classification accuracy of Spartina alterniflora is improved 12.13% and 10.68%. The proposed method provides a basis for monitoring the salt marsh vegetation using remote sensing cloud computing platform in large scale, and it provides a scientific reference for classification the vegetation community and ecological evolution in the Yellow River Delta.
2. The cover pattern of wetland vegetation classification in the Yellow River Delta wetlands is as follows: From the coastal edge to the Yellow River channel, the vegetation distribution presents a pattern of “Spartina alterniflora - Suaeda salsa - Phragmites australis”. From 2018 to 2020, the area of Suaeda salsa in the Tidal flat was degraded in a large area, and the vegetation coverage decreased by 20.38 km2. Spartina alterniflora continued to expand in the south and north of the Yellow River estuary, and the area increased by 3.74 km2. Meanwhile, it expanded from the coastline to the Yellow River channel, occupying 2.42 km2 of local vegetation area. However, Spartina alterniflora still showed positive effects in some aspects. On the southwest coast of the Yellow River Delta wetlands, where there was no distribution of Spartina alterniflora, the Tidal flats were severely eroded by seawater. However, in the coastal areas where Spartina alterniflora existed, the community of Spartina alterniflora showed an obvious trend of outward expansion, which effectively weakened the erosion of seawater.
It provides an effective technical method for clssification and analyzing the vegetation in Yellow River Delta wetlands in this paper, and the results can also provide a reference for local ecological protection. However, the study still has the following shortcomings, which need further research for improvement: Although Spartina alterniflora can be observed in the image outside the water-land boundary of the south of the Yellow River Delta estuary, SVM classifier cannot detect the vegetation in these areas from the NDVI data because the area has been invaded by sea for a long time. In addition, due to the limitations of the algorithm, cloud shadow and fog cannot be removed, so there are probably some errors in the final results.
Data availability statement
The original contributions presented in the study are included in the article/supplementary material, further inquiries can be directed to the corresponding author.
Author contributions
DC collected and analyzed the data, and wrote the manuscript. ZW proposed the method, designed its structure and revised the manuscript. XN and ZL helped in collecting and analyzing the data. LZ and XL critically revised the manuscript. All authors contributed to the article and approved the submitted version.
Funding
This research is funded by the Major Science and Technology Innovation Projects of Shandong Province (No. 2019JZZY020103). This research is supported by funding from the National Natural Science Foundation of China (No. 41876202).
Acknowledgments
We thank the European Space Agency (ESA) for providing the Sentinel-2 remote sensing data. We thank PIESAT International Information Technology Limited for providing PIE-Engine remote sensing cloud computing platform for this study.
Conflict of interest
The authors declare that the research was conducted in the absence of any commercial or financial relationships that could be construed as a potential conflict of interest.
Publisher’s note
All claims expressed in this article are solely those of the authors and do not necessarily represent those of their affiliated organizations, or those of the publisher, the editors and the reviewers. Any product that may be evaluated in this article, or claim that may be made by its manufacturer, is not guaranteed or endorsed by the publisher.
References
Ahmed K. R., Akter S., Marandi A., Schüthd C. (2021). A simple and robust wetland classification approach by using optical indices, unsupervised and supervised machine learning algorithms. Remote Sens. Appl. 23, 100569. doi: 10.1016/j.rsase.2021.100569
Akhoondzadeh M. (2022). Advances in seismo-LAI anomalies detection within Google earth engine (GEE) cloud platform. Adv. Spa. Res. 69, 4351–4357. doi: 10.1016/j.asr.2022.03.033
Ashok A., Rani H. P., Jayakumar K. V. (2021). Monitoring of dynamic wetland changes using NDVI and NDWI based landsat imagery. Remote Sens. Appl. 23, 100547. doi: 10.1016/j.rsase.2021.100547
Borges F. O., Santos C. P., Paula J. R., Mateos-Naranjo E., Redondo-Gomez S., Adams J. B., et al. (2021). Invasion and extirpation potential of native and invasive spartina species under climate change. Front. Mar. Sci. 8. doi: 10.3389/fmars.2021.696333
Cai Y. T., Lin H., Zhang M. (2019). Mapping paddy rice by the object-based random forest method using time series sentinel-1/Sentinel-2 data. Adv. Spa. Res. 64, 2233–2244. doi: 10.1016/j.asr.2019.08.042
Cavallo C., Papa M. N., Gargiulo M., Palau-Salvador G., Vezza P., Ruello G. (2021). Continuous monitoring of the flooding dynamics in the albufera wetland (Spain) by landsat-8 and sentinel-2 datasets. Remote Sens. 13, 3525. doi: 10.3390/rs13173525
Chapple D., Dronova I. (2017). Vegetation development in a tidal marsh restoration project during a historic drought: A remote sensing approach. Front. Mar. Sci. 4. doi: 10.3389/fmars.2017.00243
Chen H. X., Chen C., Zhang Z. L., Lu C., Wang L. Y., He X. Y., et al. (2021). Changes of the spatial and temporal characteristics of land-use landscape patterns using multi-temporal landsat satellite data: a case study of zhoushan island, China. Ocean Coast. Manage. 213, 105842. doi: 10.1016/j.ocecoaman.2021.105842
Cheng W., Qian X. M., Li S. W., Ma H. B., Liu D. S., Liu F. Q., et al. (2022). Research and application of PIE-engine studio for spatiotemporal remote sensing cloud computing platform. Natl. Remote Sens. Bull. 26, 335–347. doi: 10.11834/jrs.20211248
Chen M. M., Ke Y. H., Bai J. H., Li P., Lyu M. Y., Gong Z. N., et al. (2020). Monitoring early stage invasion of exotic Spartina alterniflora using deep-learning super-resolution techniques based on multisource high-resolution satellite imagery: A case study in the yellow river delta, China. Int. J. Appl. Earth Obs. 92, 102180. doi: 10.1016/j.jag.2020.102180
Chen C., Liang J. T., Xie F., Hu Z. J., Sun W. W., Yang G., et al. (2022). Temporal and spatial variation of coastline using remote sensing images for zhoushan archipelago, China. Int. J. Appl. Earth Obs. 107, 102711. doi: 10.1016/j.jag.2022.102711
Cortes C., Vapnik V. (1995). Support-vector networks. Mach. Learn. 20, 273–297. doi: 10.1023/A:1022627411411
Costanza R., D’Arge R., Groot R. D., Farber S., Grasso M., Hannon B., et al. (1997). The value of the world’s ecosystem services and natural capital. Ecol. Econ. 387, 253–260. doi: 10.1038/387253a0
Daggers T. D., Herman P. M. J., van der Wal D. (2020). Seasonal and spatial variability in patchiness of microphytobenthos on intertidal flats from sentinel-2 satellite imagery. Front. Mar. Sci. 7. doi: 10.3389/fmars.2020.00392
Guo X. J., Zhang C. C., Luo W. R., Yang J., Yang M. (2020). Urban impervious surface extraction based on multi-features and random forest. IEEE Access 8, 226609–226623. doi: 10.1109/ACCESS.2020.3046261
Huang X., Duan Y. T., Tao Y. H., Wang X. P., Long H. L., Luo C. S., et al. (2022). Effects of Spartina alterniflora invasion on soil organic carbon storage in the beihai coastal wetlands of China. Front. Mar. Sci. 9. doi: 10.3389/fmars.2022.890811
Hu Y. K., Tian B., Yuan L., Li X. Z., Huang Y., Shi R. H., et al. (2021). Mapping coastal salt marshes in China using time series of sentinel-1 SAR. ISPRS J. Photogram. 173, 122–134. doi: 10.1016/j.isprsjprs.2021.01.003
Jiao L. L., Sun W. W., Yang G., Ren G. B., Liu Y. N. (2019). A hierarchical classification framework of satellite Multispectral/Hyperspectral images for mapping coastal wetlands. Remote Sens. 11, 2238. doi: 10.3390/rs11192238
Liang J. Y., Xie Y. C., Sha Z. Y., Zhou A. (2020). Modeling urban growth sustainability in the cloud by augmenting Google earth engine (GEE). Comput. Environ. Urban 84, 101542. doi: 10.1016/j.compenvurbsys.2020.101542
Liu Y. Y., Jin R., Zhu W. H. (2021). Conversion of natural wetland to farmland in the tumen river basin: Human and environmental factors. Remote Sens. 13, 3498. doi: 10.3390/rs13173498
Li Z. J., Wang Z. Y., Liu X. T., Zhu Y. D., Wang K., Zhang T. G. (2022). Classification and evolutionary analysis of yellow river delta wetlands using decision tree based on time series SAR backscattering coefficient and coherence. Front. Mar. Sci. 9. doi: 10.3389/fmars.2022.940342
Li X., Wang N. L., Wu Y. W. (2022). Automated glacier snow line altitude calculation method using landsat series images in the Google earth engine platform. Remote Sens. 14, 2377. doi: 10.3390/rs14102377
Li J. T., Yan D. D., Yao X. Y., Liu Y., Xie S. Y., Sheng Y. F., et al. (2022). Dynamics of carbon storage in saltmarshes across china’s Eastern coastal wetlands from 1987 to 2020. Front. Mar. Sci. 9. doi: 10.3389/fmars.2022.915727
Mahdianpari M., Salehi B., Mohammadimanesh F., Homayouni S., Gill E. (2018). The first wetland inventory map of Newfoundland at a spatial resolution of 10 m using sentinel-1 and sentinel-2 data on the Google earth engine cloud computing platform. Remote Sens. 11, 43. doi: 10.3390/rs11010043
Mao D. H., Liu M. Y., Wang Z. M., Li L., Man W. D., Jia M. M., et al. (2019). Rapid invasion of Spartina alterniflora in the coastal zone of mainland China: Spatiotemporal patterns and human prevention. Sensors 19, 2308. doi: 10.3390/s19102308
Meng W. Q., Feagin R. A., Innocenti R. A., Hu B. B., He M. X., Li H. Y. (2020). Invasion and ecological effects of exotic smooth cordgrass Spartina alterniflora in China. Ecol. Eng. 143, 105670. doi: 10.1016/j.ecoleng.2019.105670
Ning X. G., Chang W. T., Wang H., Zhang H. C., Zhu Q. D. (2022). Extraction of marsh wetland in heilongjiang basin based on GEE and multi-source remote sensing data. Natl. Remote Sens. Bull. 26, 386–396. doi: 10.11834/jrs.20200033
Rapinel S., Mony C., Lecoq L., Clément B., Thomas A., Hubert-Moy L. (2019). Evaluation of sentinel-2 time-series for mapping floodplain grassland plant communities. Remote Sens. Environ. 223, 115–129. doi: 10.1016/j.rse.2019.01.018
Ren G. B., Zhao Y. J., Wang J. B., Wu P. Q., Ma Y. (2021). Ecological effects analysis of Spartina alterniflora invasion within yellow river delta using long time series remote sensing imagery. Estuar. Coast. Shelf. S. 249, 107111. doi: 10.1016/j.ecss.2020.107111
Spoto F., Sy O., Laberinti P., Martimort P., Fernandez V., Colin O., et al. (2012). “Overview of sentinel-2,” in 2012 IEEE International Geoscience and Remote Sensing Symposium, Munich, Germany, 13134007. doi: 10.1109/IGARSS.2012.6351195
Sun C., Li J. L., Cao L. D., Liu Y. C., Jin S., Zhao B. X. (2020). Evaluation of vegetation index-based curve fitting models for accurate classification of salt marsh vegetation using sentinel-2 time-series. Sensors 20, 5551. doi: 10.3390/s20195551
Sun C., Li J. L., Liu Y. X., Liu Y. C., Liu R. Q. (2021). Plant species classification in salt marshes using phenological parameters derived from sentinel-2 pixel-differential time-series. Remote Sens. Environ. 256, 112320. doi: 10.1016/j.rse.2021.112320
Sun C., Liu Y. X., Zhao S. S., Zhou M. X., Yang Y. H., Li F. X. (2016). Classification mapping and species identification of salt marshes based on a short-time interval NDVI time-series from HJ-1 optical imagery. Int. J. Appl. Earth Obs. 45, 27–41. doi: 10.1016/j.jag.2015.10.008
Townsend J. T. (1971). Theoretical analysis of an alphabetic confusion matrix. Atten. Percept. Psycho. 9, 40–50. doi: 10.3758/BF03212817
Vrieling A., Meroni M., Darvishzadeh R., Skidmore A. K., Wang T. J., Zurita-Milla R., et al. (2018). Vegetation phenology from sentinel-2 and field cameras for a Dutch barrier island. Remote Sens. Environ. 215, 517–529. doi: 10.1016/j.rse.2018.03.014
Wang L. Y., Chen C., Xie F., Hu Z. J., Zhang Z. L., Chen H. X., et al. (2021). Estimation of the value of regional ecosystem services of an archipelago using satellite remote sensing technology: A case study of zhoushan archipelago, China. Int. J. Appl. Earth. Obs. 105, 102616. doi: 10.1016/j.jag.2021.102616
Wang M. Y., Fei X. Y., Zhang Y. Z., Chen Z., Wang X. X., Tsou J. Y., et al. (2018). Assessing texture features to classify coastal wetland vegetation from high spatial resolution imagery using completed local binary patterns (CLBP). Remote Sens. 10, 778. doi: 10.3390/rs10050778
Wang X. X., Gao X. W., Zhang Y. Z., Fei X. Y., Chen Z., Wang J., et al. (2019). Land-cover classification of coastal wetlands using the RF algorithm for worldview-2 and landsat 8 images. Remote Sens. 11, 1927. doi: 10.3390/rs11161927
Wang X. X., Xiao X. M., Zou Z. H., Hou L. Y., Qin Y. W., Dong J. W., et al. (2020). Mapping coastal wetlands of China using time series landsat images in 2018 and Google earth engine. ISPRS J. Photogram. 163, 312–326. doi: 10.1016/j.isprsjprs.2020.03.014
Wang Z. Y., Ye K. L., Zhang M. Y., Li H., Li Z. J., Zhu Y. D., et al. (2022). Monitoring the wetland of the yellow river delta by combining GF-3 polarimetric synthetic aperture radar and sentinel-2A multispectral data. Front. Ecol. Evol. 10. doi: 10.3389/fevo.2022.806978
Wan S. W., Pei Q., Liu J. N., Zhou H. X. (2009). The positive and negative effects of exotic Spartina alterniflora in China. Ecol. Eng. 35, 444–452. doi: 10.1016/j.ecoleng.2008.05.020
Xie C. J., Cui B. S., Ning Z. H., Yu S. L., Xie T. (2022). Longitudinal dynamics of hydrological connectivity in the yellow river delta, China. Front. Mar. Sci. 9. doi: 10.3389/fmars.2022.899671
Yu Y., Pan Y., Yang X. G., Fan W. Y. (2022). Spatial scale effect and correction of forest aboveground biomass estimation using remote sensing. Remote Sens. 14, 2828. doi: 10.3390/rs14122828
Yu J. W., Yoon Y. W., Baek W. K., Jung H. S. (2021). Forest vertical structure mapping using two-seasonal optic images and LiDAR DSM acquired from UAV platform through random forest, XGBoost, and support vector machine approaches. Remote Sens. 13, 4282. doi: 10.3390/rs13214282
Zeng L. L., Wardlow B. D., Xiang D. X., Hu S., Li D. R. (2020). A review of vegetation phenological metrics extraction using time-series, multispectral satellite data. Remote Sens. Environ. 237, 111511. doi: 10.1016/j.rse.2019.111511
Zhang L., Gong Z. N., Wang Q. W., Jin D. D., Wang X. (2019). Wetland mapping of yellow river delta wetlands based on multi-feature optimization of sentinel-2 images. J. Remote Sens. 23, 313–326. doi: 10.11834/jrs.20198083
Zhang M., Lin H. (2022). Wetland classification using parcel-level ensemble algorithm based on gaofen-6 multispectral imagery and sentinel-1 dataset. J. Hydrol. 606, 127462. doi: 10.1016/j.jhydrol.2022.127462
Zhang B., Wang R., Deng Y., Ma P., Lin H., Wang J. (2019). Mapping the yellow river delta land subsidence with multitemporal SAR interferometry by exploiting both persistent and distributed scatterers. ISPRS J. Photogram. 148, 157–173. doi: 10.1016/j.isprsjprs.2018.12.008
Zheng H. R., Du P. J., Chen J. K., Xia J. S., Li E. Z., Xu Z. G., et al. (2017). Performance evaluation of downscaling sentinel-2 imagery for land use and land cover classification by spectral-spatial features. Remote Sens. 9, 1274. doi: 10.3390/rs9121274
Zhu X. D., Meng L. X., Zhang Y. H., Weng Q. H., Morris J. (2019). Tidal and meteorological influences on the growth of invasive Spartina alterniflora: Evidence from UAV remote sensing. Remote Sens. 11, 1208. doi: 10.3390/rs11101208
Keywords: Yellow River Delta wetlands, Normalized Difference Vegetation Index, PIE-Engine, Support Vector Machine, Sentinel-2, Spartina alterniflora
Citation: Chang D, Wang Z, Ning X, Li Z, Zhang L and Liu X (2022) Vegetation changes in Yellow River Delta wetlands from 2018 to 2020 using PIE-Engine and short time series Sentinel-2 images. Front. Mar. Sci. 9:977050. doi: 10.3389/fmars.2022.977050
Received: 24 June 2022; Accepted: 21 July 2022;
Published: 10 August 2022.
Edited by:
Chao Chen, Zhejiang Ocean University, ChinaReviewed by:
Yulong Guo, Henan Agricultural University, ChinaChangan Liu, State Geospatial Information Center, China
Paula Pratolongo, Consejo Nacional de Investigaciones Científicas y Técnicas (CONICET), Argentina
Copyright © 2022 Chang, Wang, Ning, Li, Zhang and Liu. This is an open-access article distributed under the terms of the Creative Commons Attribution License (CC BY). The use, distribution or reproduction in other forums is permitted, provided the original author(s) and the copyright owner(s) are credited and that the original publication in this journal is cited, in accordance with accepted academic practice. No use, distribution or reproduction is permitted which does not comply with these terms.
*Correspondence: Zhiyong Wang, skd994177@sdust.edu.cn