Changes of Oceanic Conditions Drive Chagos Whale Migration Patterns in the Central Indian Ocean
 Junlin Lyra Huang
 Emmanuelle C. Leroy3
  Gary Truong
- 1Centre for Marine Science and Innovation, School of Biological, Earth and Environmental Sciences, University of New South Wales, Sydney, NSW, Australia
- 2Evolution and Ecology Research Centre, School of Biological, Earth and Environmental Sciences, University of New South Wales, Sydney, NSW, Australia
- 3Globice Réunion, Saint Pierre, France
Marine ecosystems are experiencing rapid shifts under climate change scenarios and baleen whales are vulnerable to environmental change, although not all impacts are yet clear. We identify how the migration behaviour of the Chagos whale, likely a pygmy blue whale (Balaenoptera musculus brevicauda), has changed in association with shifts in environmental factors. We used up to 18 years of continuous underwater acoustic recordings to analyse the relationships between whale acoustic presence and sea surface temperature (SST), chlorophyll-a concentration, El-Niño Southern Oscillation (ENSO) and the Indian Ocean Dipole (IOD). We compared these relationships between two independent sites Diego Garcia southeast (DGS) and Diego Garcia northwest (DGN) where Chagos whales are detected and are suspected to move interannually across the Chagos-Laccadive ridge. We showed that the number of whale songs detected increased on average by 7.7% and 12.6% annually at DGS and DGN respectively. At the DGS site, Chagos whales shifted their arrival time earlier by 4.2 ± 2.0 days/year ± SE and were detected for a longer period by 7.3 ± 1.2 days/year ± SE across 18 years. A larger number of songs were detected during periods of higher chlorophyll-a concentration, and with positive IOD phases. At the DGN site, we did not see an earlier shift in arrival and songs were not detected for a longer period across the 13 years. Whale presence at DGN had a weaker but opposite relationship with chlorophyll-a and IOD. The oceanic conditions in the Indian Ocean are predicted to change under future climate scenarios and this will likely influence Chagos whale migratory behaviour. Understanding how environmental factors influence whale movement patterns can help predict how whales may respond to future environmental change. We demonstrate the value of long-term acoustic monitoring of marine fauna to determine how they may be affected by changing environmental conditions.
1 Introduction
Marine ecosystems are experiencing rapid shifts in structure and function globally (Belkin, 2009; Bryndum-Buchholz et al., 2019), which challenges the ability of marine wildlife to adapt (Poloczanska et al., 2013; Miller et al., 2018). Ocean warming and acidification, resulting from anthropogenic climate change, pose a threat to the marine environment and biodiversity (Miller et al., 2018). For example, increasing sea temperature has been associated with changes in biodiversity of the deep-sea fish community (Yasuhara and Danovaro, 2016). Global environmental changes such as heat shocks and ocean acidification also have negative impacts on the temperate seagrass ecosystem (Perry et al., 2019). Current predictions indicate that global warming will continue, with or without mitigation (IPCC, 2021). Furthermore, greater variability such as more frequent and more extreme events (i.e., such as heatwaves, tropical cyclones, and flooding) as well as changes to the phases of natural climate phenomena (i.e., ENSO, the El Niño Southern Oscillation and IOD, the Indian Ocean Dipole) are predicted with increased global warming (Cai et al., 2014; Cai et al., 2015). The large-scale climate phenomena ENSO and IOD affect weather globally, and the frequency of extreme ENSO and IOD conditions is likely to increase under increased greenhouse warming (Cai et al., 2014; Cai et al., 2015). Marine ecosystems are experiencing fluctuations due to this large-scale environmental variability, such as an increase in sea surface temperature (SST), changes to currents and upwelling systems, and changes to primary productivity. The potential effects of these changes may require marine species to adapt their behaviour (Gibson et al., 2007). Therefore, we need to better understand how marine wildlife responds to large-scale environmental changes.
Measuring the changes in the timing of migration is an excellent way to study the response of fauna to environmental variability particularly where important life history events are tied to specific timing (i.e., breeding or foraging is tied to times of high-resource availability). The responses of marine animals to environmental change vary across individuals, populations, and communities (Miller et al., 2018). For example, phenological changes, such as the variation in the timing of migration, will affect essential components of a species’ life history (Forrest and Miller-Rushing, 2010). Understanding potential drivers of mammal migration will help us predict how they will respond to future warming scenarios (Gnanadesikan et al., 2017). The drivers of migration vary across species and ecosystems. Round-trip migration patterns are driven by the need for refuge (to avoid unfavourable conditions), to breed (to reproduce) and to forage (to increase access to food) (Shaw, 2016). Many marine species migrate to breed (Shaw, 2016). For example, the cuttlefish Sepia officinalis, the squid Loligo gahi, and the bivalve Macoma balthica are proposed to have latitudinal or longitudinal migration for spawning seasons in different ocean basins (Hiddink, 2003; Arkhipkin et al., 2004; Keller et al., 2014; Shaw, 2016). On the other hand, mammals display diverse migration types (Gnanadesikan et al., 2017). Large baleen whales tend to be long-distance migrants, moving poleward in summer to the feeding areas and migrating towards lower latitudes in winter to breed and calve (Horton et al., 2011). Migration timing between feeding and breeding grounds may be influenced by species-specific environmental shifts and complex internal and external mechanisms (Dingle and Drake, 2007). Global climate change is considered greater driver of change in the distribution and phenology of marine compared to terrestrial animals (Poloczanska et al., 2013). Studying the shifts of migration timing could be an ideal approach to gain insight into how marine wildlife responds to environmental variability.
Large baleen whales are potentially vulnerable to environmental changes. Many baleen whale species and populations are endangered, following the 20th century industrial whaling. For instance, as the largest animals in the world, blue whales (Balaenoptera musculus) were targeted by whalers, with only 0.15% of the Southern Hemisphere population surviving commercial whaling (Branch et al., 2007; Thomas et al., 2016). Large baleen whales such as blue whales have few natural predators and feed on prey at low trophic levels, occupying a rare niche with few other species. Thus, if global change that leads to their loss occurs, it is unlikely that they could be easily replaced within the food web. Furthermore, their long-distance migration behaviour requires considerable energy (Branch et al., 2007). Thus, large baleen whales require predictable and high-energy food sources for the few months they feed. This makes them vulnerable and less able to adapt when climate change and other anthropogenic-related conditions reduce food availability and predictability. Using a decade of acoustic data, a previous study showed that the distributions and movement patterns of six baleen whale species were shifting in the western Atlantic (Davis et al., 2020). Moreover, previous studies have shown the relationships between baleen whales phenology and environmental factors. For example, Derville et al. (2019) assessed humpback whales’ habitat shifting under the impact of ocean warming in Oceania breeding grounds using 19 years of survey data. Charif et al. (2020) used a 6-year dataset to analyse the phenological changes of North Atlantic right whales as environmental conditions change. An eight-year humpback whale acoustic dataset was used to study the whale presence and climate oscillations (Schall et al., 2021).
The Indian Ocean is an ideal location to identify how environmental changes affect whale behaviour because of its high biodiversity. It is a complex marine system with nutrient-poor water, but diverse marine fauna species (Anderson et al., 2012). It is the warmest of the ocean basins, with the southern parts of the Indian Ocean experiencing higher rates of warming compared to the northern areas (Han et al., 2014). Variant blue whale species are recorded acoustically within this region including Antarctic blue whale (B.m. intermedia); and four acoustic populations of the pygmy blue whale: Sri Lankan; Madagascan; Australian and Oman whales (Stafford et al., 2004; Stafford et al., 2011; Samaran et al., 2013; Double et al., 2014; Leroy et al., 2016; Leroy et al., 2018; Cerchio et al., 2020). Blue whales produce stereotypical calls, repeated over days, months, and years. Each blue whale population has a distinct vocal characteristic, which is used to identify their ‘acoustic populations’ (McDonald et al., 2006). The Chagos whales are possibly a new acoustic population of blue whales (B.m. brevicauda spp.) (Leroy et al., 2021). Chagos songs were initially considered as a variant of the Madagascan pygmy blue whale song (McDonald et al., 2006). Preliminary reports have shown that Chagos whales have acoustically presented all year at the southern end of the Seychelle-Chagos thermocline ridge (Sousa and Harris, 2015; Leroy et al., 2021). The area of the Seychelle-Chagos thermocline ridge is a region of low sea surface temperature and high nutrients (Jayakumar et al., 2011). Yet we know little about the ecology and migration patterns of the Chagos whales, especially how their movement are linked with the environmental shifting in the nutrient-rich tropical region.
This study aims to give an insight into how marine species respond to environmental shifts. The detections of the Chagos whale songs in almost two decades of continuous acoustic data recorded in either side of the Chagos-Laccadive ridge are used first to quantify inter- and intra-annual variations in the acoustic presence and then, to identify if acoustic presence changes with shifts in environmental conditions such as sea surface temperature (SST), primary production (chlorophyll-a concentration), Southern Oscillation Index (SOI) and Indian Ocean Dipole (IOD). The hypothesis for the environmental factors impacting Chagos whale presence is as follows: if the sea surface temperature (SST) is low and if primary production is high then more Chagos whales will be present. We aim to give an insight on how climate change may affect the migration phenology of the Chagos whale in the tropical central Indian Ocean.
2 Materials and Methods
2.1 Study Area
Underwater acoustic data was obtained from the international data system of the Comprehensive Nuclear Test-Ban Treaty Organisation (CTBTO). Two hydrophone arrays were located 220 km apart on either side of Diego Garcia Island: one on the northwest side (Diego Garcia North - DGN), and the other on the southeast side (Diego Garcia South – DGS) (Figure 1). Within each array, a set of three hydrophones was moored in the sound fixing and ranging (SOFAR) channel, where sound achieves the maximum speed (Hanson, 2001).
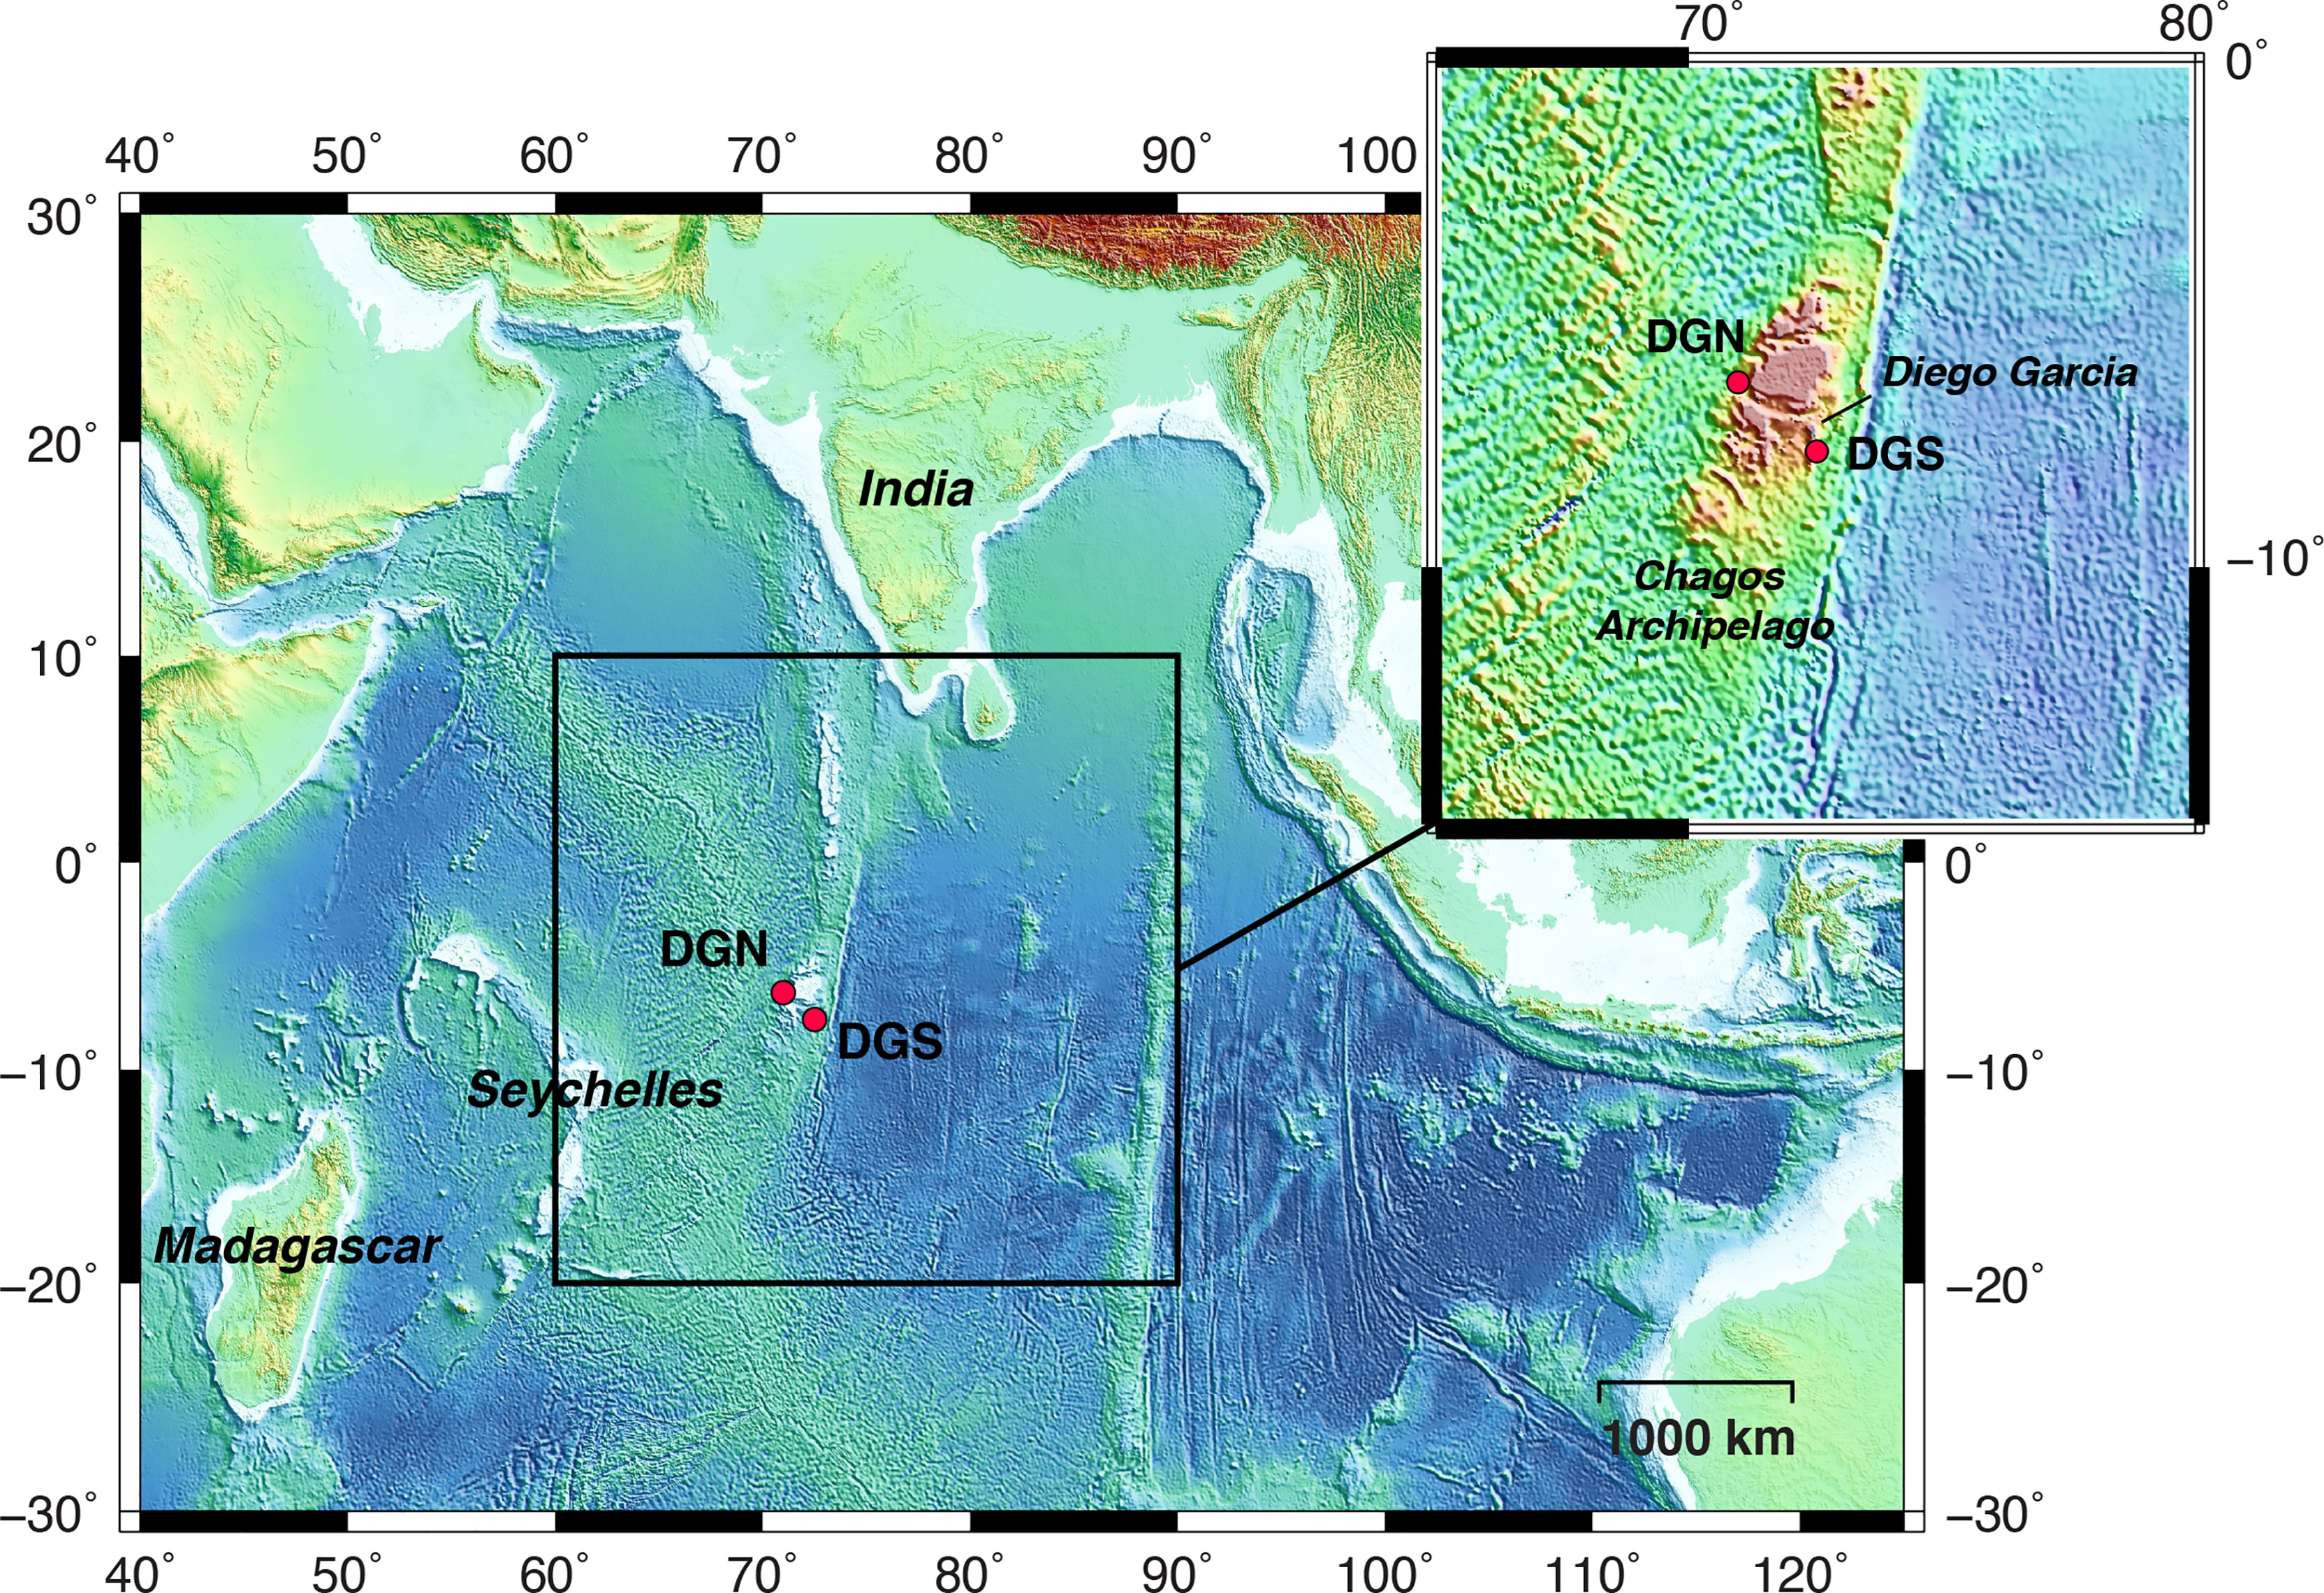
Figure 1 Map of the study area in the central Indian Ocean. Red dots indicate the locations of the hydrophone stations: north-western site off Diego Garcia (referred to as DGN), and south-eastern site off Diego Garcia (referred to as DGS). The dotted rectangle shows the location of the Chagos-Laccadive Ridge. B This figure is modified from Leroy et al., 2021.
The CTBTO hydroacoustic stations continuously monitor underwater sound waves with a sampling frequency of 250 Hz. For the DGN site, the data recorded between January 2002 and February 2014 by the hydrophone number H08N1 (6.34°S, 71.01°E) were used, and for DGS the data recorded between January 2001 and December 2019 by the instrument number H08S1 (7.65°S, 72.47°E) were used. The instrument depths were respectively 1248 and 1413 m (see Leroy et al., 2021 for more details). The recording sites are separated by the Chagos bank (Pulli and Upton, 2001). Thus, we used the DGN and DGS sites to represent the soundscapes northwest and southeast of Diego Garcia respectively.
2.2 Whale Acoustic Presence Data
Hourly presence or absence of Chagos whale songs was inferred from automated detections of the signal as described in Leroy et al. (2021). All data from the DGN site and data prior to February 2018 from the DGS site were from Leroy et al., 2021, however, data after February 2018 to the end of 2019 from the DGS site were obtained and tested for this study using the same approach as described in Leroy et al. (2021).
The individual detections were logged into Matlab matrices along with the information related to each individual song, such as the exact date-time of the detected event. The data from each site were divided into eight-day blocks (192 hours), consistent with the local environmental data (see 2.3 Environmental Data, below). Whale acoustic presence is defined as the proportion of hours in the eight-day block in which whale songs were detected. In cases where acoustic recording had been interrupted, and if the recorded hours were less than 50% of the time block, these blocks were considered to have insufficient data and were excluded from the analysis. In 13 years of acoustic data, 82.3% (498 eight-day blocks) of DGN recordings and in 18 years 91.7% (760 eight-day blocks) of DGS data had sufficiently complete data to be included in the analysis. Acoustic presence at both sites was pooled to analyse seasonal variability (Similar method to aggregate presence data for right whale see (Similar method to aggregate presence data for right whale see Charif et al., 2020). Pooled data was divided into months for comparison to oceanic data (see Environmental Data, below).
We used the eight-day grouped whale acoustic presence data to analyse the peak and extended peak seasons. To identify the peak and the extended peak seasons, the following algorithms were applied: firstly, we found the eight-day time blocks when whale acoustic presence was greater than 90% in the 192-hour block throughout the entire time series, then we chose the peak to be eight-day period with the highest whale acoustic presence among consecutive periods containing data. When there was more than one period satisfying the criteria, for example, multiple consecutive 100% whale acoustic presence periods, all 100% eight-day periods were defined as peaks. Next, the growth rate of the whale acoustic presence was calculated as the difference between the two adjacent periods divided by the whale acoustic presence of the preceding period. The maximum rate (defined as the start date of the extended peak) and minimum rate (defined as the end date of extended the peak) are the ones with the most rapid change at the local range. Lastly, the time between the start date and the end date containing the peak whale acoustic presence was defined as the extended peak season. Similar methods to define extended peak seasons were applied in Charif et al. (2020), where they used the smoothed eight-period differences.
2.3 Environmental Data
Two local drivers and two oceanic drivers were considered in this study. Data for the two local drivers, sea surface temperature (SST) and chlorophyll-a (as an indicator of phytoplankton abundance), were downloaded from the NOAA ocean watch website (https://oceanwatch.pifsc.noaa.gov/doc.html#currents). The seasonal oceanic data including Dipole Mode Index (DMI) representing the event of Indian Ocean Dipole (IOD) and Southern Oscillation Index (SOI) representing El-Nino Southern Oscillation (ENSO) were extracted from the Australian Bureau of Meteorology (BOM) (http://www.bom.gov.au/climate/enso/soi/) and the NOAA Physical Science Laboratory of Global Climate Observing System (https://psl.noaa.gov/gcos_wgsp/Timeseries/DMI/).
SST was downloaded through the CoralTemp dataset of the NOAA website. The analysed data were continuously recorded (24 hours per day) throughout the study period. The mean SST was computed (In total four data spots with two units at each side, spatial resolution for one unit is approximately 5 km) in the approximately 100 km2 encompassing the hydrophone stations. Then the mean SST was calculated for the corresponding eight-day period. Mean SST and minimum SST were calculated for each year and for two seasons: December to May and June to November.
Chlorophyll-a was used as a proxy of phytoplankton biomass. Blue whales almost feed exclusively on krill (Euphausiid spp.). Krill information in the Indian Ocean is limited. We will therefore use the concentration of chlorophyll-a (as an indication of phytoplankton biomass) as blue whale food approximation (Allen, 1971). Chlorophyll-a data were acquired from the MODIS-Aqua 8-daily dataset. Like SST, we computed the mean chlorophyll-a (In total six data spots with two units at one side, three units at the other side, spatial resolution is approximately 4 km per unit) containing the hydrophone stations of 96 km2. Mean chlorophyll-a was calculated for each year and both seasons (December to May; June to November). One potential caveat is that the measurement of the chlorophyll-a was from the water surface, hence the data may not reflect krill density in deep water (Branch et al., 2007).
SOI was downloaded from the BOM website where it was calculated using the pressure difference between Tahiti and Darwin. DMI was extracted from the NOAA Physical Sciences website, which was based on the HadISST1.1 SST dataset. Both oceanic variables were recorded on a monthly scale.
2.4 Statistical Analysis
2.4.1 Overall Trends and Interannual Difference in the Number of Chagos Whale Songs
To identify if there were trends in the number of Chagos whale songs detected we computed the correlation of annual average whale songs per day (continuous variable) versus year (ordinal variable) for both sites. Spearman rank coefficients were used to represent the correlation and the corresponding p-values were calculated.
Linear models were used to analyse the trend of average songs per day of the Chagos whales versus year for both sites. To compute the percentage of increasing rate, we used the linear model of the logarithm of the average songs per day versus year. To quantify the shift of the start date of the extended peak seasons, linear models were used.
To test whether whale acoustic presence at the DGS and DGN was significantly different, we used the Wilcoxon rank sum test.
2.4.2 Correlation Between Whale Acoustic Presence and Environmental Factors
To assess the correlation of whale acoustic presence and environmental factors at each site we used SST and chlorophyll-a (continuous variables) versus year (ordinal variable) using spearman rank coefficients and calculated the corresponding p-values.
Generalised linear models were used to interpret the relationship between whale acoustic presence (proportion of hours where whale songs were detected) and environmental factors. Whale acoustic presence was paired with SST, chlorophyll-a, DMI and SOI at each site with a binomial family (weight = number of recording hours in the corresponding eight-day period). The effect of year was considered by using ‘glm.er’ function (Bates et al., 2021) in RStudio.
Generalised linear models (binomial) were chosen because 1) They fit the analysis we made with the acoustic whale song data. Since we aggregated the binary whale songs into 8 days (192 hours), and generalized linear models probabilities, the model can indicate the correlations between the independent and dependent variables. 2) They provide a multiple-period view. Both whale acoustic data and the environmental data for DGN and DGS were continuous and spanning for years, thus binomial models were suitable.
2.4.3 Extended Peak Seasons of the Chagos Whale Songs
For all extended peak seasons detected at both sites, the correlations between the start date (Julian day) with environmental variables (yearly mean SST, mean chlorophyll-a concentration, the corresponding mean and minimum SST and chlorophyll-a concentration) were calculated using Spearman rank coefficients. The correlations between the length of extended peak seasons with environmental variables were calculated using Pearson coefficients.
We identified the first extended peak seasons of each year across 18-year at the DGS site and 13-ear at the DGN site. The spearman rank correlations between the start date (Julian day) with year and the environmental variables were calculated. The years with unclear start dates due to missing data were considered insufficient for analysis. For those years with clear start dates of extended seasons, we calculated the total length of extended peak seasons and calculated the Pearson correlations with the environmental variables. We also calculated the spearman rank coefficient between the total length and year.
3 Results
3.1 Overall Trends and Interannual Difference in the Number of Chagos Whale Songs
We assessed the number of Chagos whale songs detected within a total of 92,180.8 hours of underwater hydroacoustic data from the DGN site and 143,406.7 hours from the DGS site, over 598 and 828 eight-day periods, spanning across 13 and 18 years, respectively. In total, 486,320 Chagos songs were detected at the DGN site over 13 years and 837,640 Chagos songs were detected at the DGS site during the 18-year period. The average number of songs per hour was higher at the DGS site (5.84 per hour) than at the DGN site (5.27 per hour). Chagos song occurrence increased over time for both the DGN and DGS sites (Figure 2), although the rate was higher at the DGN compared to the DGS site. The lowest number of Chagos songs recorded was in 2008 at both sites, whereas the greatest number of songs was recorded in 2012 at the DGN site. The greatest number of songs recorded at the DGS site was in 2017, although hydroacoustic data was not available for the DGN site this year.
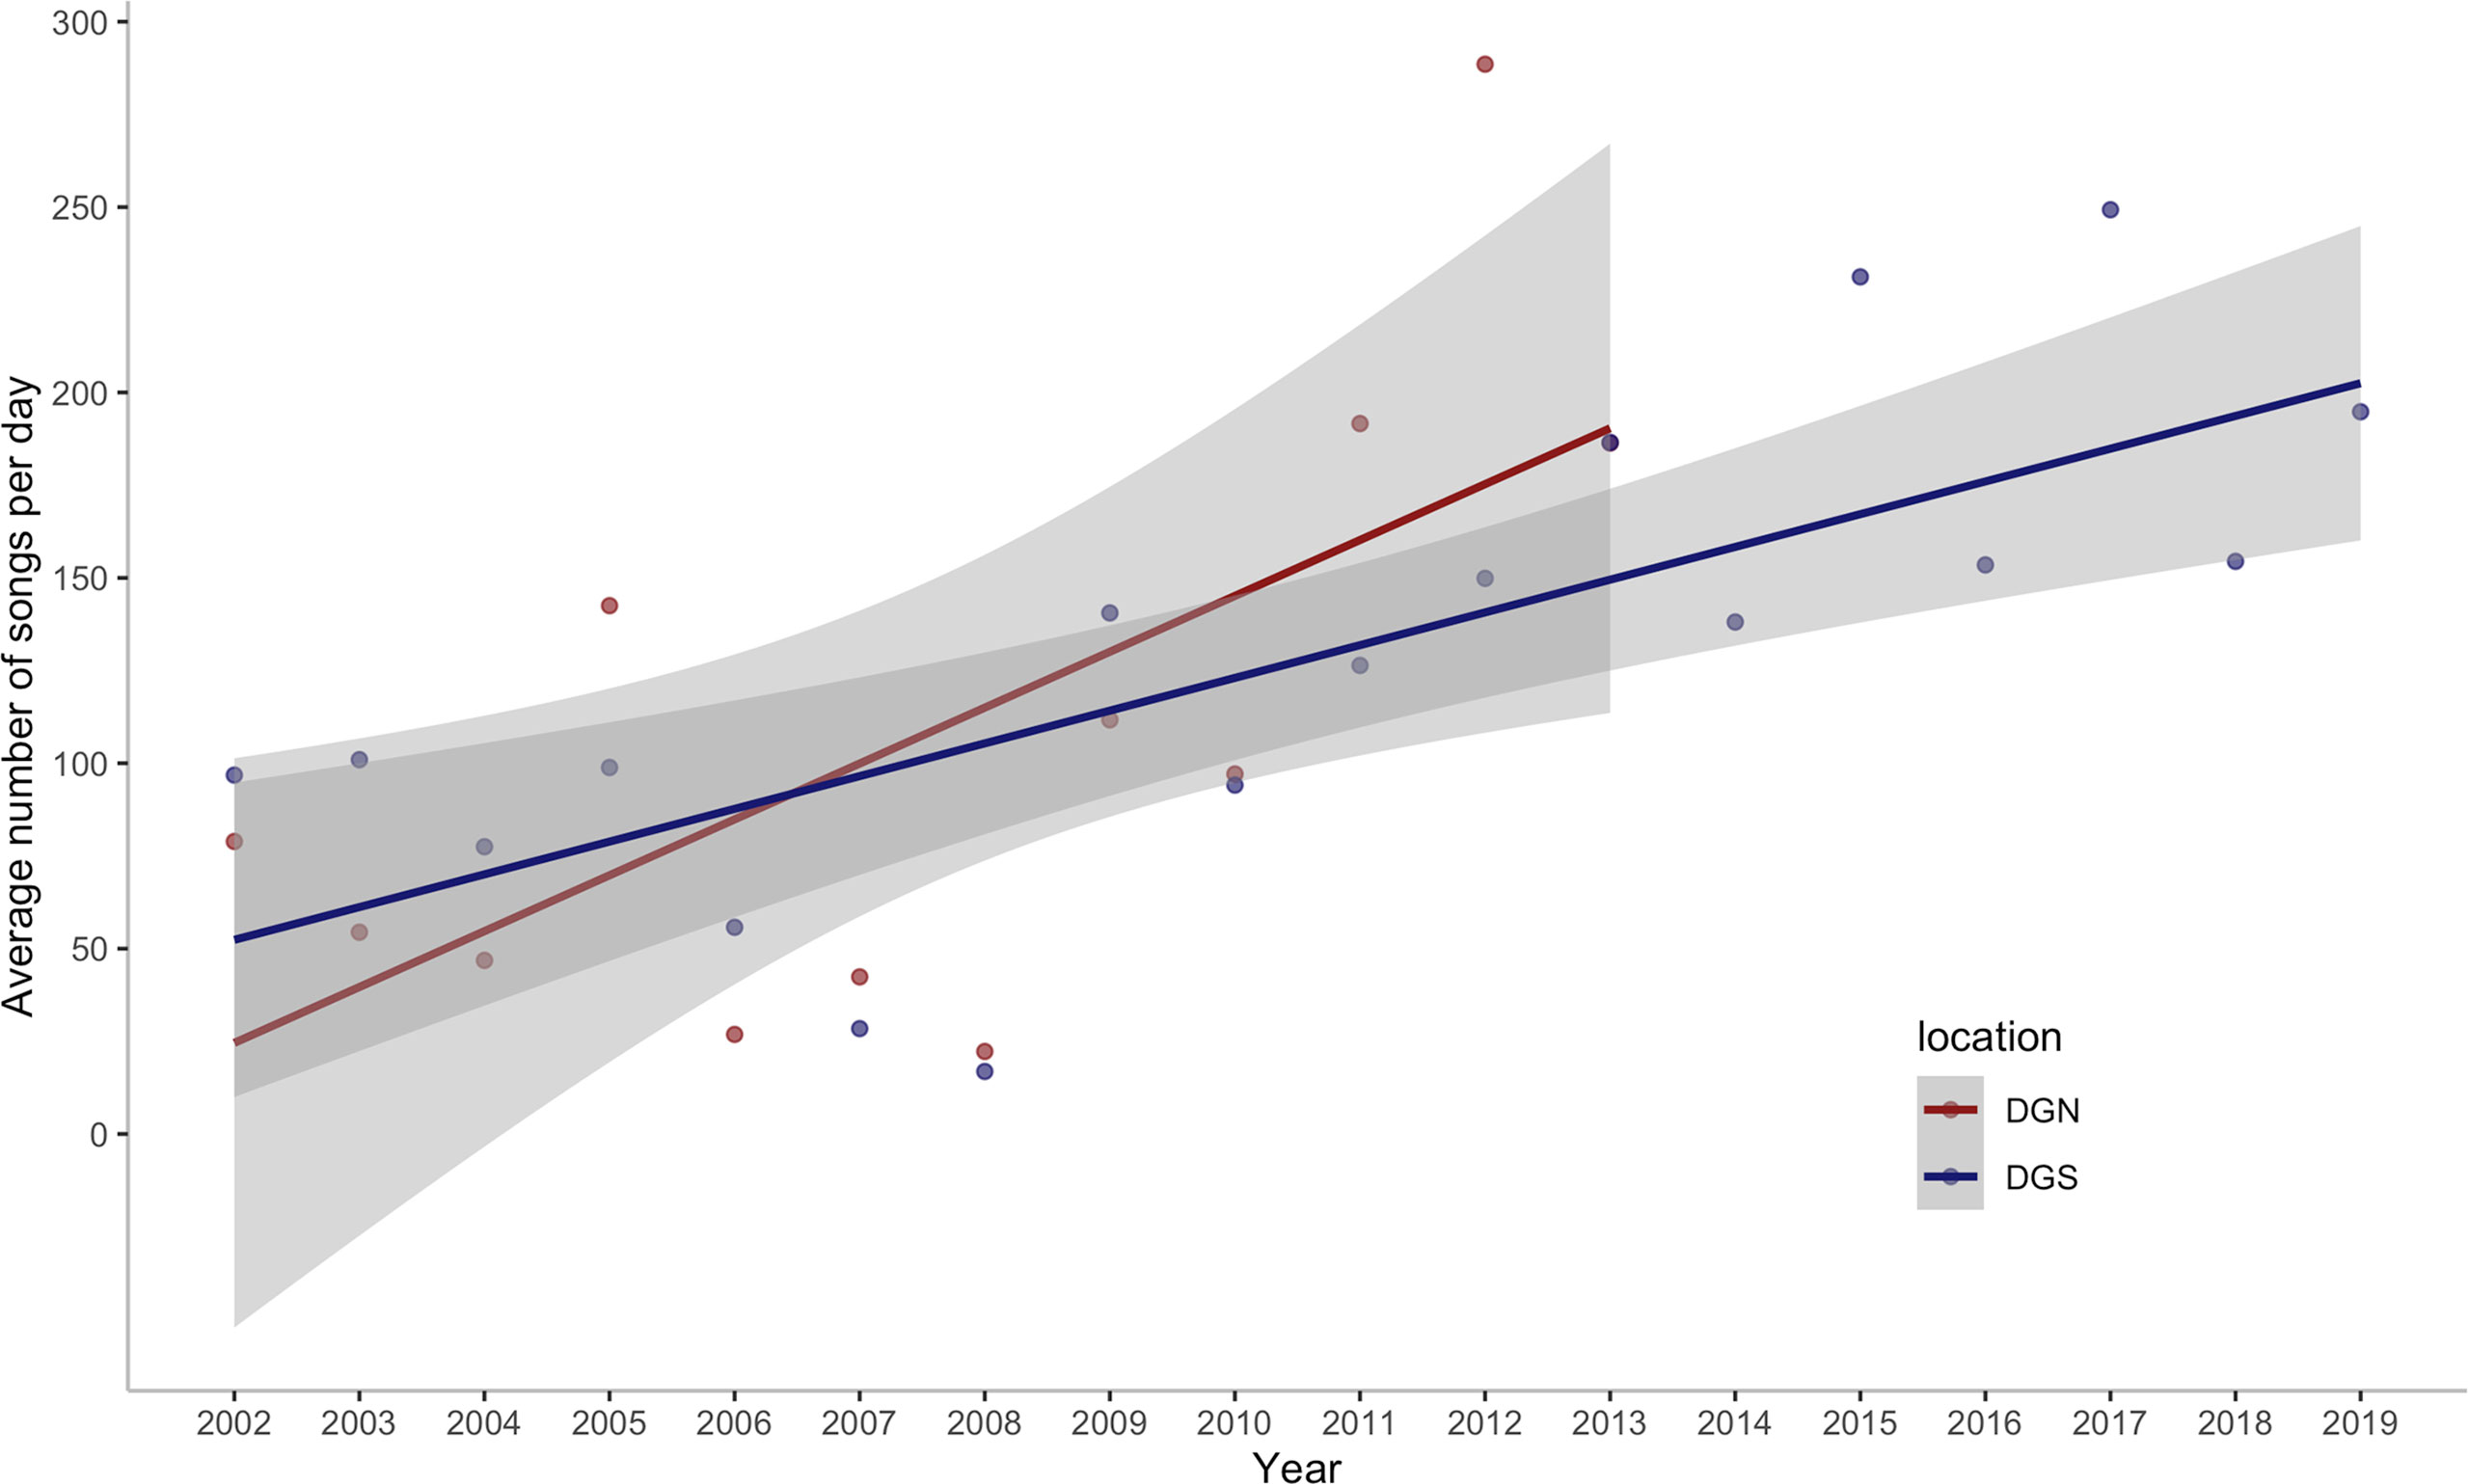
Figure 2 Annual change in the average number of Chagos whale songs detected per day off Diego Garcia/Chagos Archipelago at the north-western (DGN) site where the linear trend has a slope of 15.1 songs/day/year (12.6%/year) with corresponding ρ = 0.56 and p-value of 0.06, and the south-eastern (DGS) site where the linear trend has a slope of 8.8 songs/day/year (7.7%/year) with corresponding ρ of 0.79 and p-value < 0.001. ρ is the Spearman rank coefficient of the average number of songs per day with year.
Seasonal variabilities were found at both sites in the 46 eight-day periods across the study (18 years at the DGS and 13 years at the DGN) (Figure 3). The whale acoustic presence was different on the DGS and DGN sites throughout the mutual study period that whale songs were recorded at both sites between 2002 and 2014 (Wilcoxon rank sum test, test statistics = 122688, p-value = 0.033). There was a seasonal influence in the number of whale song detections, as more whales were found at the DGN site in the warmer months (May to October), whereas in the cooler months, November to April, there were more whales at the DGS site.
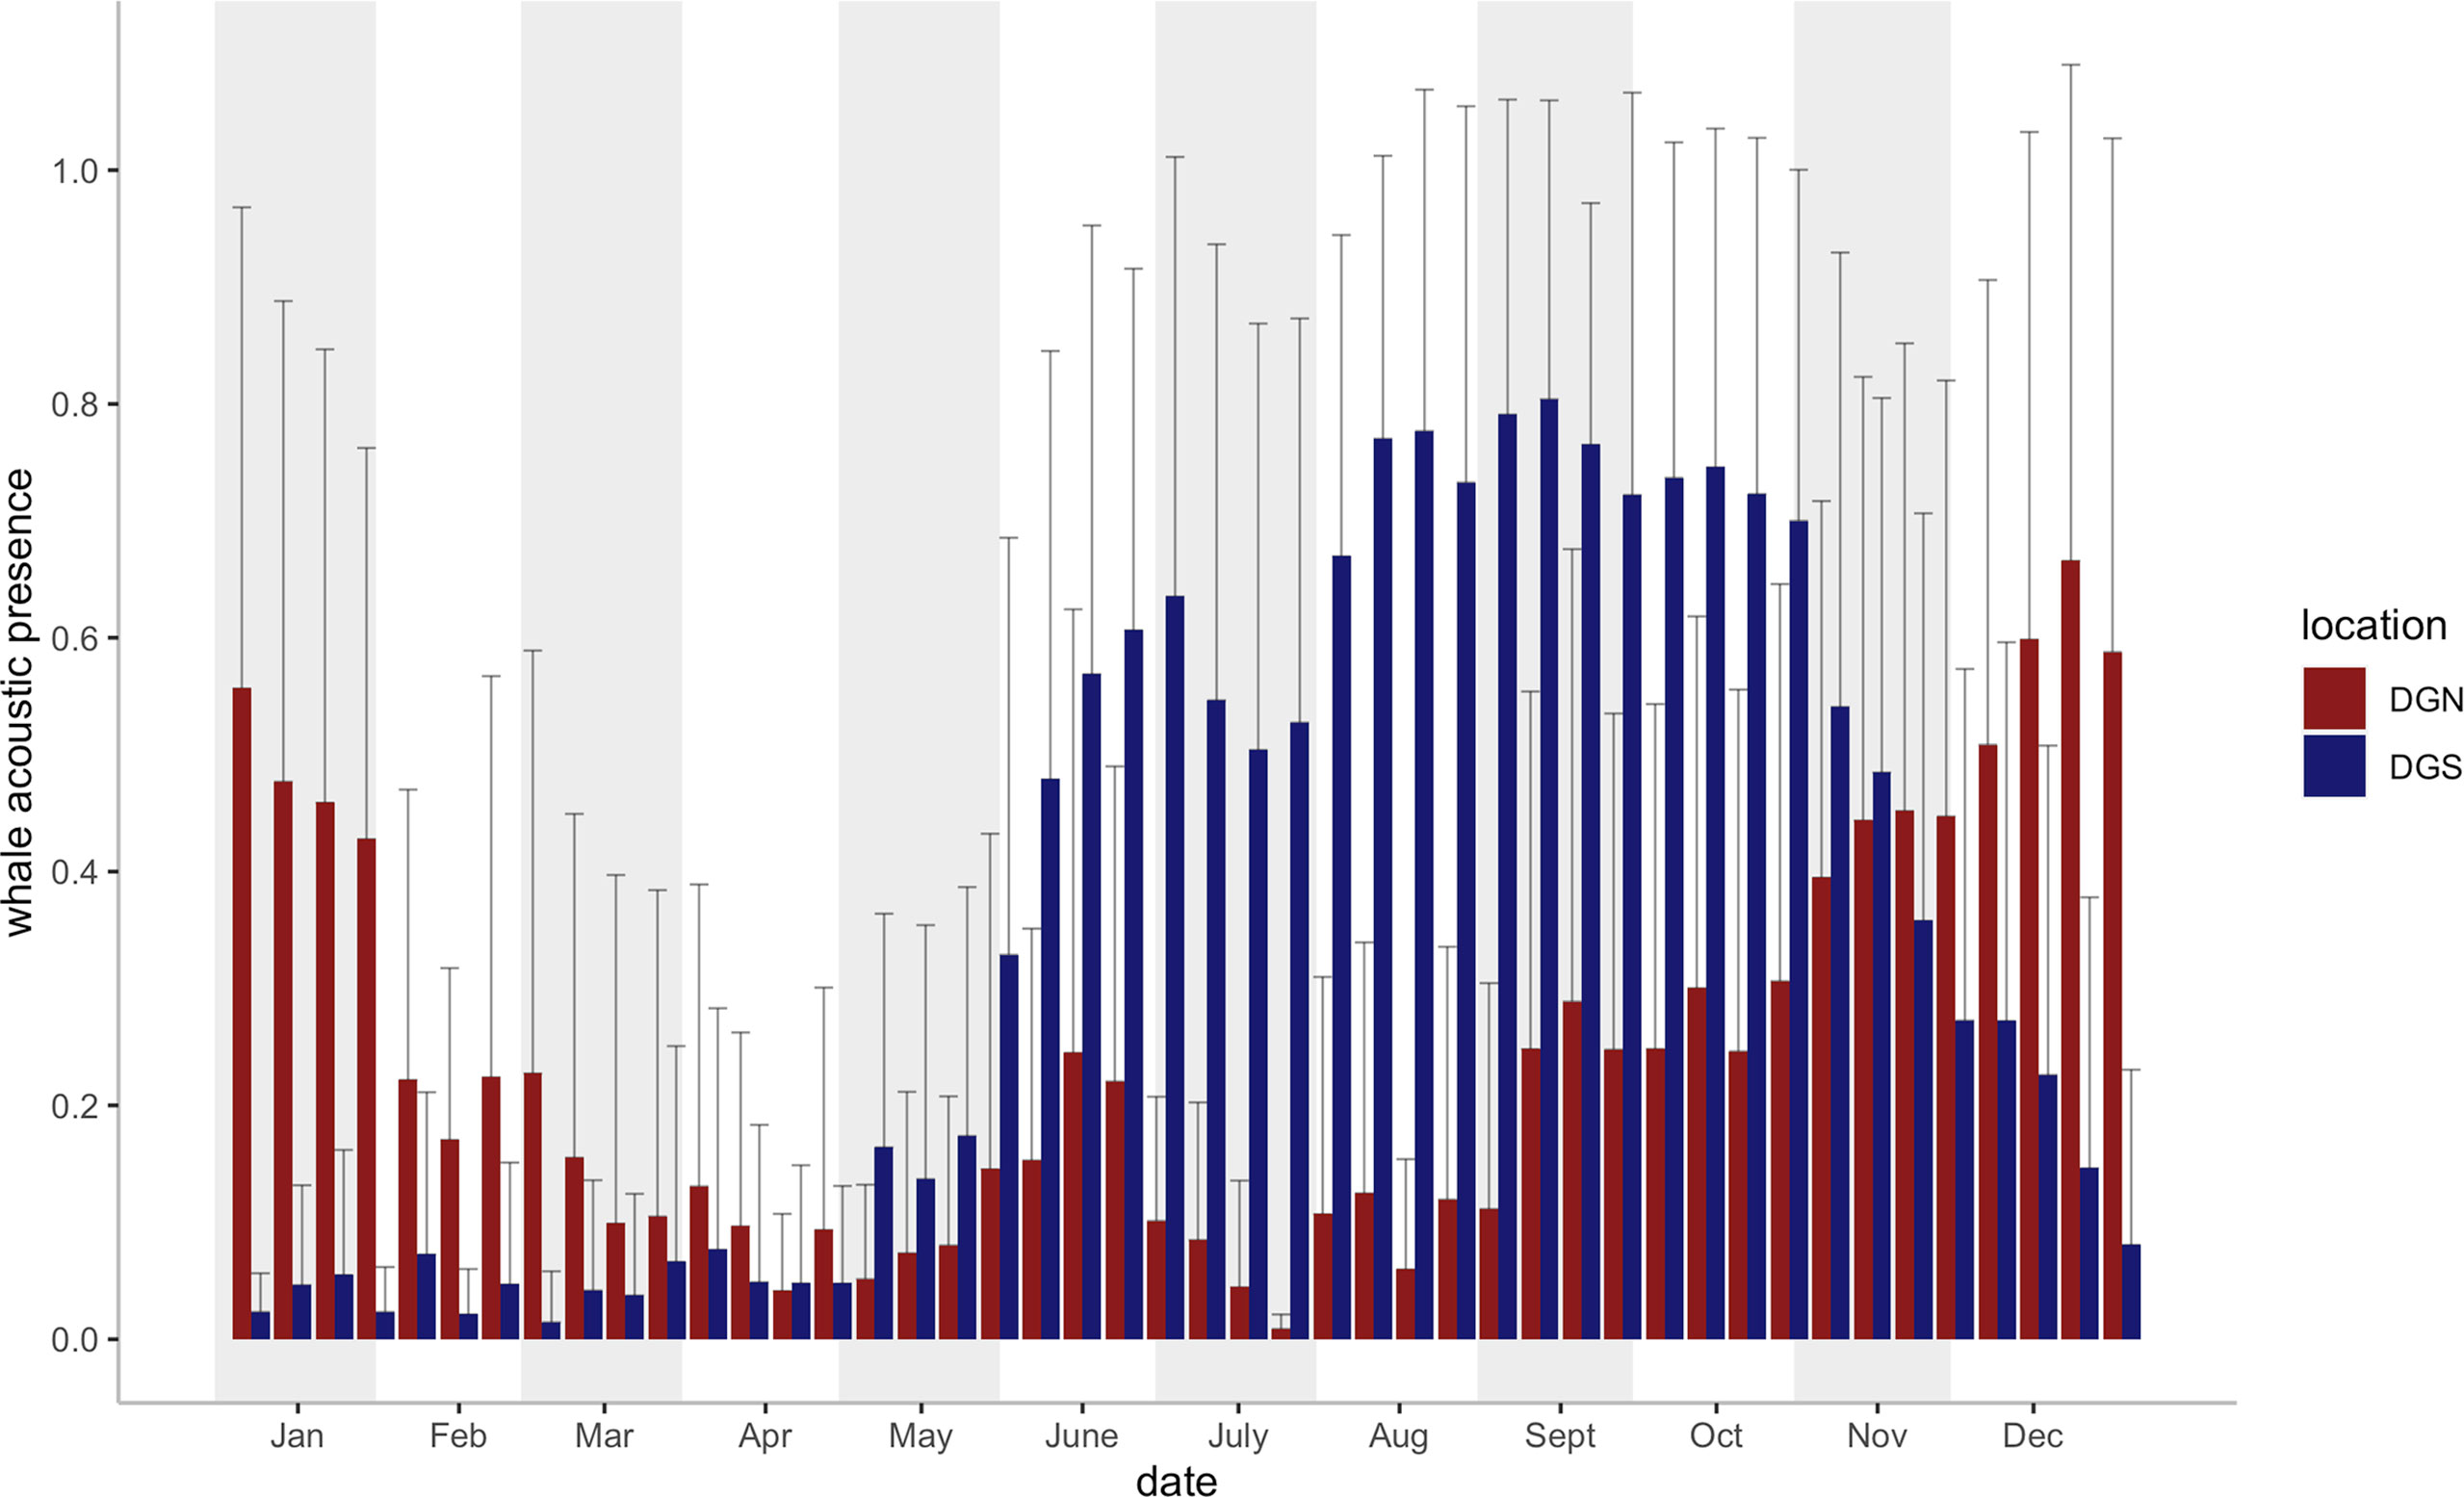
Figure 3 Mean Chagos whale acoustic presence (%) + Standard error (defined as the percentage of hours when whale songs were detected, see Material and Methods) on the DGS and DGN site for each eight-day period (46 bins for each site) during the study period (2002- 2014 on the DGN site: N = 9 years for 2 of the 46 bins, N = 10 for 17 bins, N = 11 for 20 bins, N = 12 for 7 bins; 2002- 2019 on the DGS site: N = 16 for 22 bins, N = 17 for 24 bins). Vertical bars (blue bars for SE site, red bars for DGN site) represent the average whale acoustic presence (%).
3.2 Correlation Between the Whale Acoustic Presence and Environmental Factors
The mean concentration of chlorophyll-a was relatively stable with only a slightly decreasing trend at both Diego Garcia sites over 13 and 18 years respectively (Table 1). However, the average SST and minimum SST increased overall at both sites (Table 1). The increasing rates of both mean SST and minimum SST at the DGS site were higher than those at the DGN site.
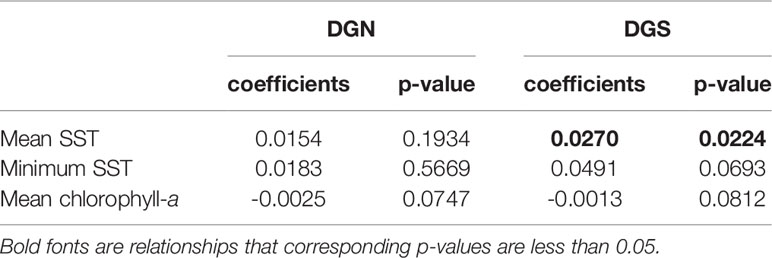
Table 1 Linear model coefficients of mean sea surface temperature (SST); minimum SST; mean chlorophyll-a concentration versus year at the two oceanic sites off Diego Garcia, DGN refers to the north-western site (n = 13 years) and DGS to south-eastern site (n = 18 years).
There was a seasonal effect observed on the number of whale songs detected at both sites (Figure 4; Table 2). At the DGS site, SST was negatively correlated with the whale acoustic presence, whereas at the DGN site, SST and whale acoustic presence had a positive relationship.
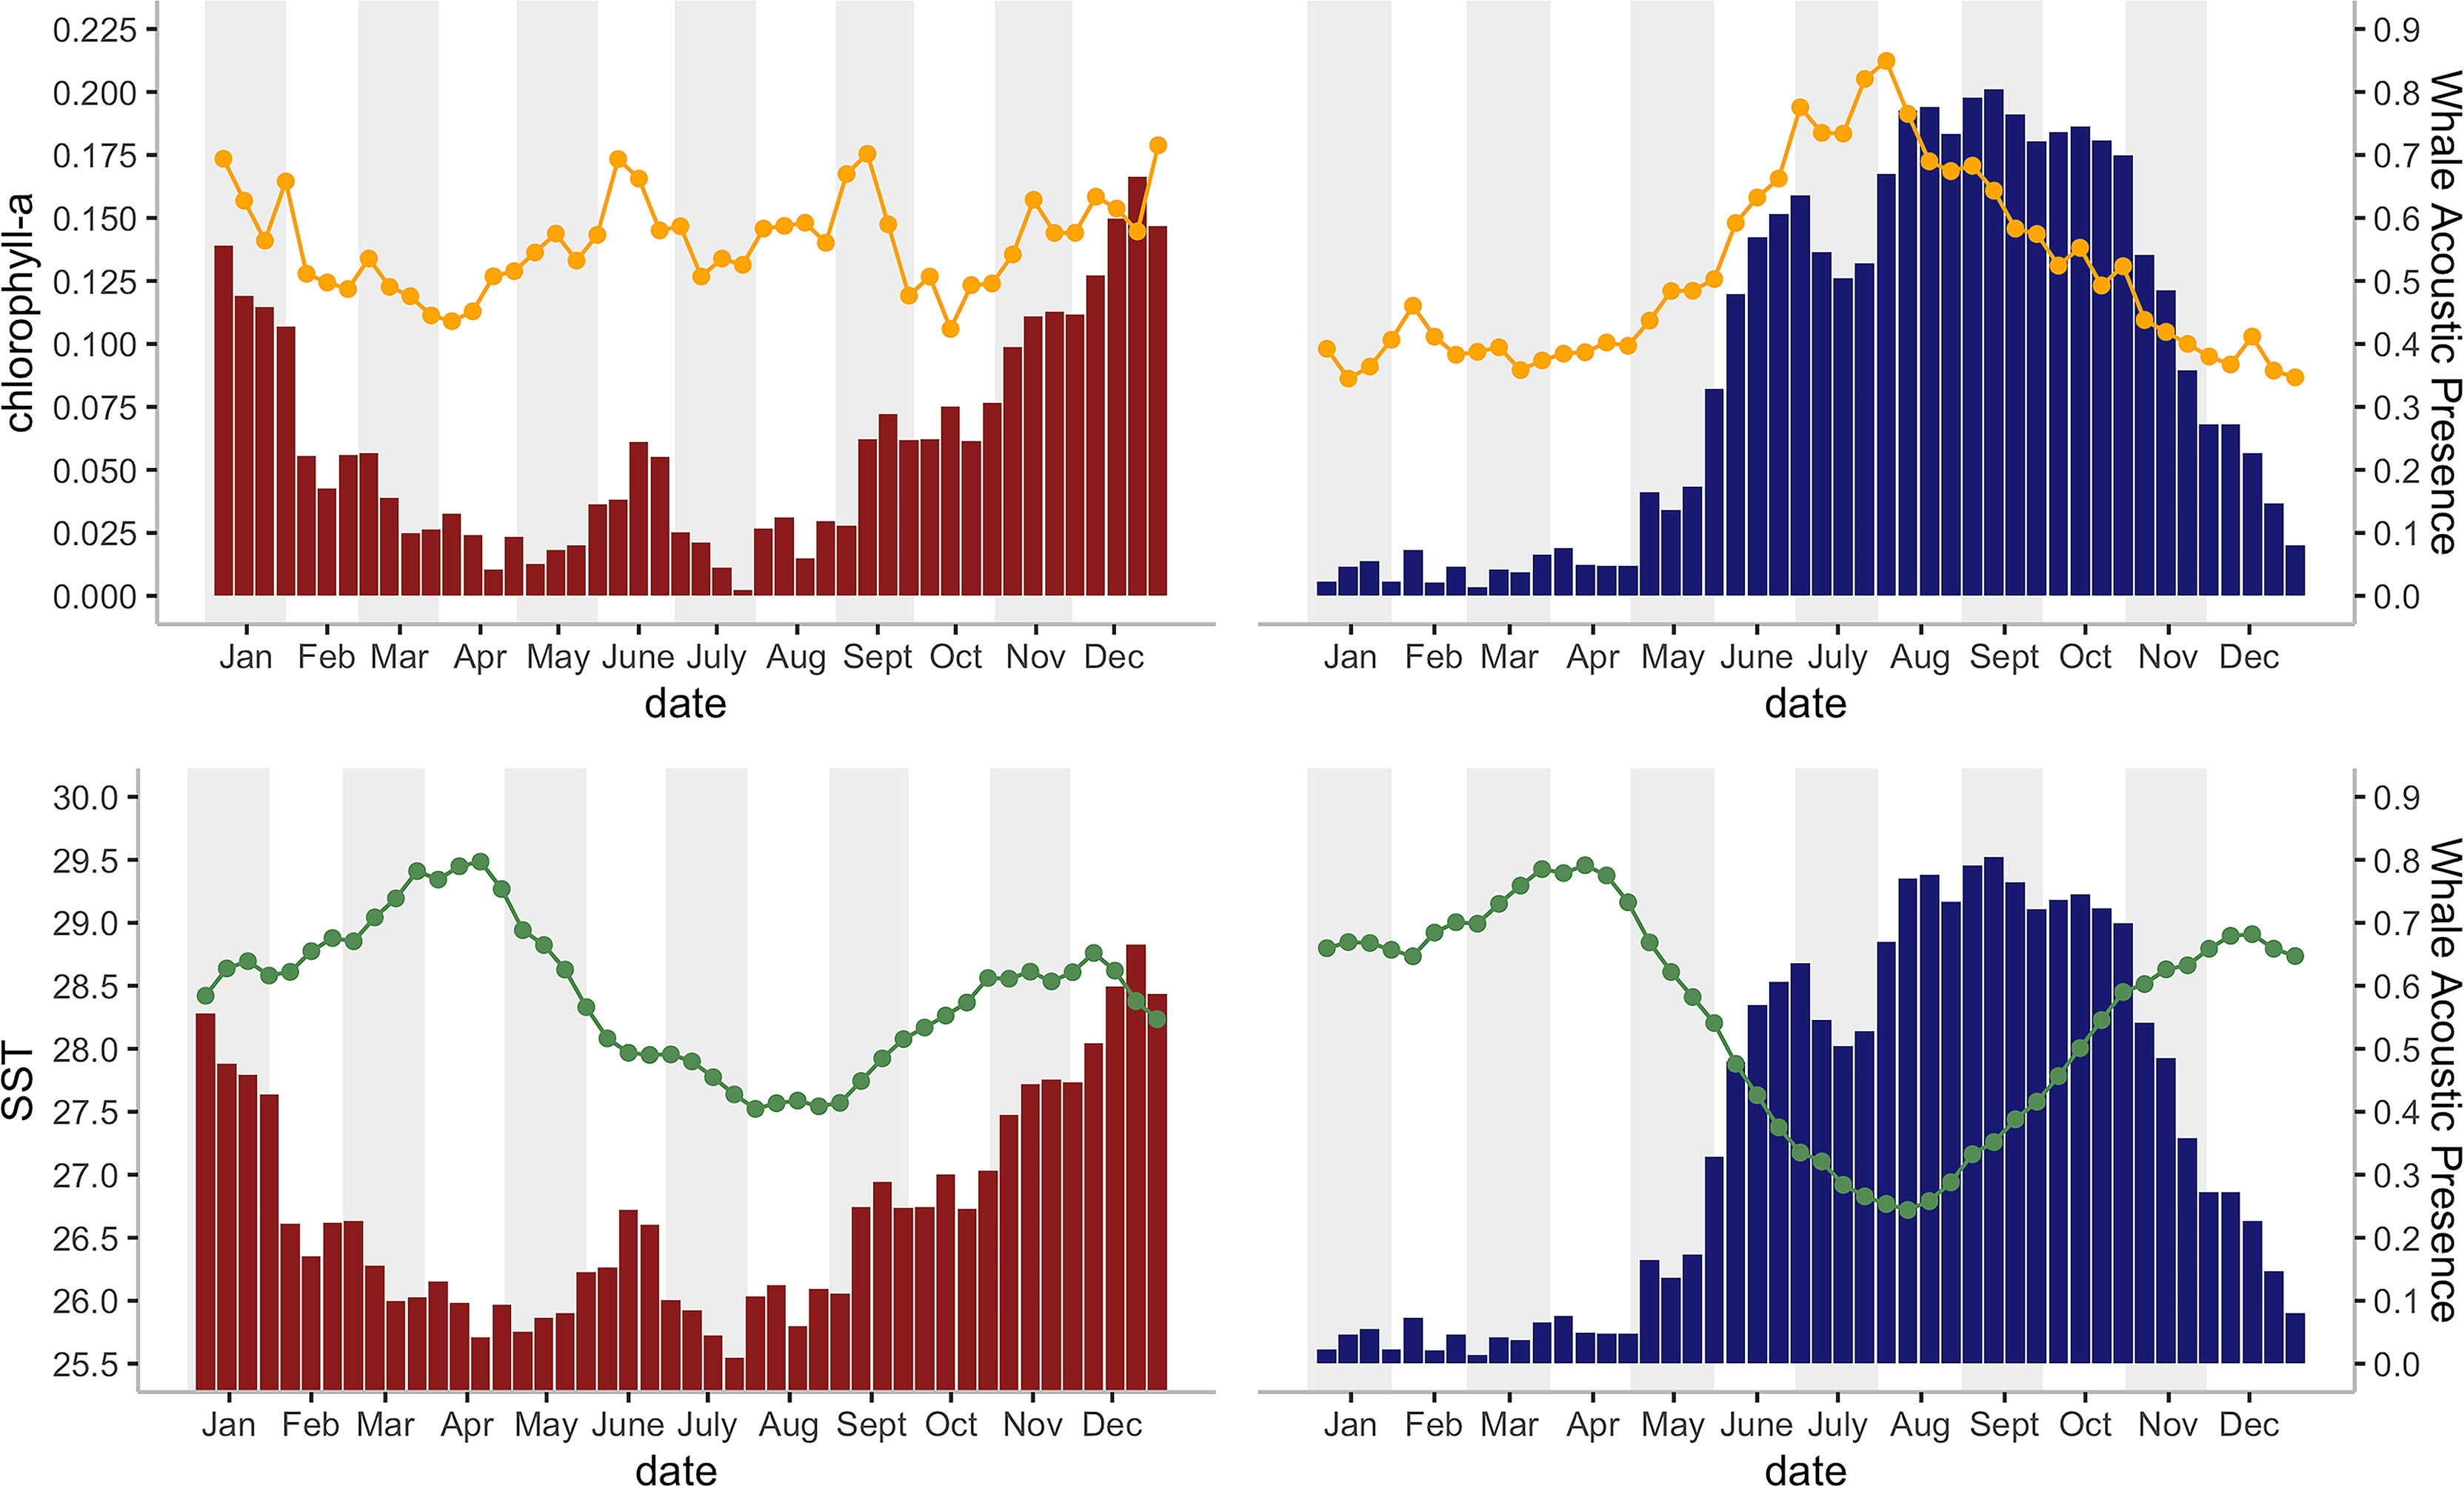
Figure 4 Histograms of the mean Chagos whale acoustic presence (%) (defined as the percentage of hours when whale calls were detected, see Material and Methods) during each eight-day period and their corresponding a) mean SST (°C), indicated by orange line chart; and 2) chlorophyll-a concentration (mg/m3) indicated by green line chart; for 2002 – 2014 on the DGN site (red bars; N = 16 for 22 bins, N = 17 for 24 bins) and for 2002 -1 2019 on the DGS site (blue bars; N = 9 years for 2 bins, N = 10 for 17 bins, N = 11 for 20 bins, N = 12 for 7 bins).
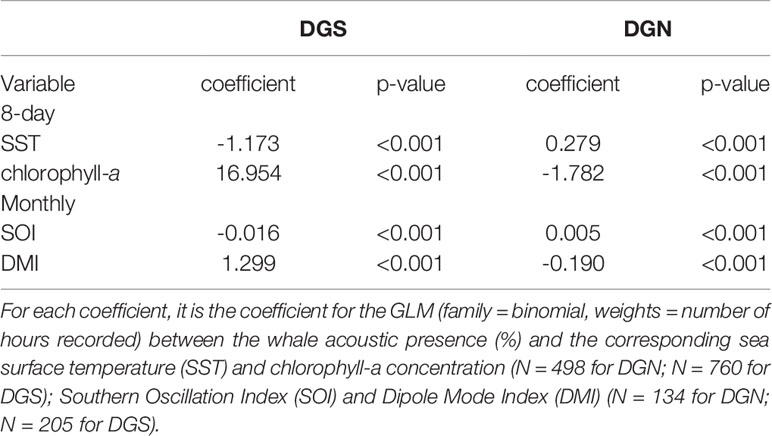
Table 2 GLM model coefficients for the south-eastern (DGS) site and north-western (DGN) site.
The relationship between chlorophyll-a concentration and whale acoustic presence was negatively correlated at the DGN site and positively correlated at the DGS site. When the chlorophyll-a concentration is higher, we observed more whale songs at the DGN site and less whale songs at the DGS site. At the DGN, the negative correlation between chlorophyll-a and whale acoustic presence was weaker, whereas at the DGS site the positive correlation between chlorophyll-a and whale acoustic presence was stronger (Table 2).
El Niño Southern Oscillation (measured by Southern Oscillation Index, SOI) and Indian Ocean Dipole (measured by Dipole Mode Index, DMI) both had critical relationships with the whale acoustic presence (Table 2). DMI had a stronger correlation with whale acoustic presence compared to SOI. In the DGS, DMI and whale acoustic presence were positively correlated, while SOI and whale acoustic presence were negatively correlated. When DMI is higher or ENSO index is lower, we observed more whale presence. In the DGN, DMI was negatively correlated with whale acoustic presence and SOI was positively correlated with whale acoustic presence. We observed less whale songs when DMI is lower or when ENSO index is higher. The correlation between both SOI and DMI and whale presence was stronger in the DGS compared to in the DGN.
3.3 Extended Peak Seasons of the Chagos Whale Songs
At the DGS site, 30 extended peak seasons were identified over 18 years (Figures 5A, 6). The mean duration of the extended peak seasons was 54 days. Unlike the DGN site, most extended peak seasons in the DGS were in cooler periods between May and December. Most extended peaks started between May and August. The starting time of the extended peak seasons shifted earlier throughout the study period (Spearman rank correlation = -0.53; p-value = 0.05; Supplementary Table 1). The average shift of arrival time is 4.2 ± 2.0 days/year ± SE. The probability of having two peaks instead of one was higher after 2011. Also, consecutive peaks (more than 90% of whale acoustic presence) were more frequent in later years. The total length of extended period increased by 7.3 ± 1.2 days/year ± SE across 18 years. At the DGN site (Figures 5B, 6), we detected 15 extended peak seasons over 13 years and the average period length was 50 days. Most extended peaks started between October and December and finished in January or February. Extra extended peaks were found in 2005, 2006, 2009, and 2013. Extended peak seasons were similar in pattern between 2002 and 2004. There were more and longer extended peak seasons in 2005. However, information was limited in 2006 and 2007 due to missing data. There was no peak found in 2008. In 2009 and 2010, extended peaks were similar to the previous pattern between 2002 and 2004. Longer and stronger extended peak seasons were observed from 2011 and 2013. The extended peak season analysis was not complete in 2014 due to missing data and therefore the end date of the last extended peak could not be determined. There was no strong correlation between the start time of the extended peak season and the year (Spearman rank correlation = -0.45; p-value = 0.31; Supplementary Table 1).
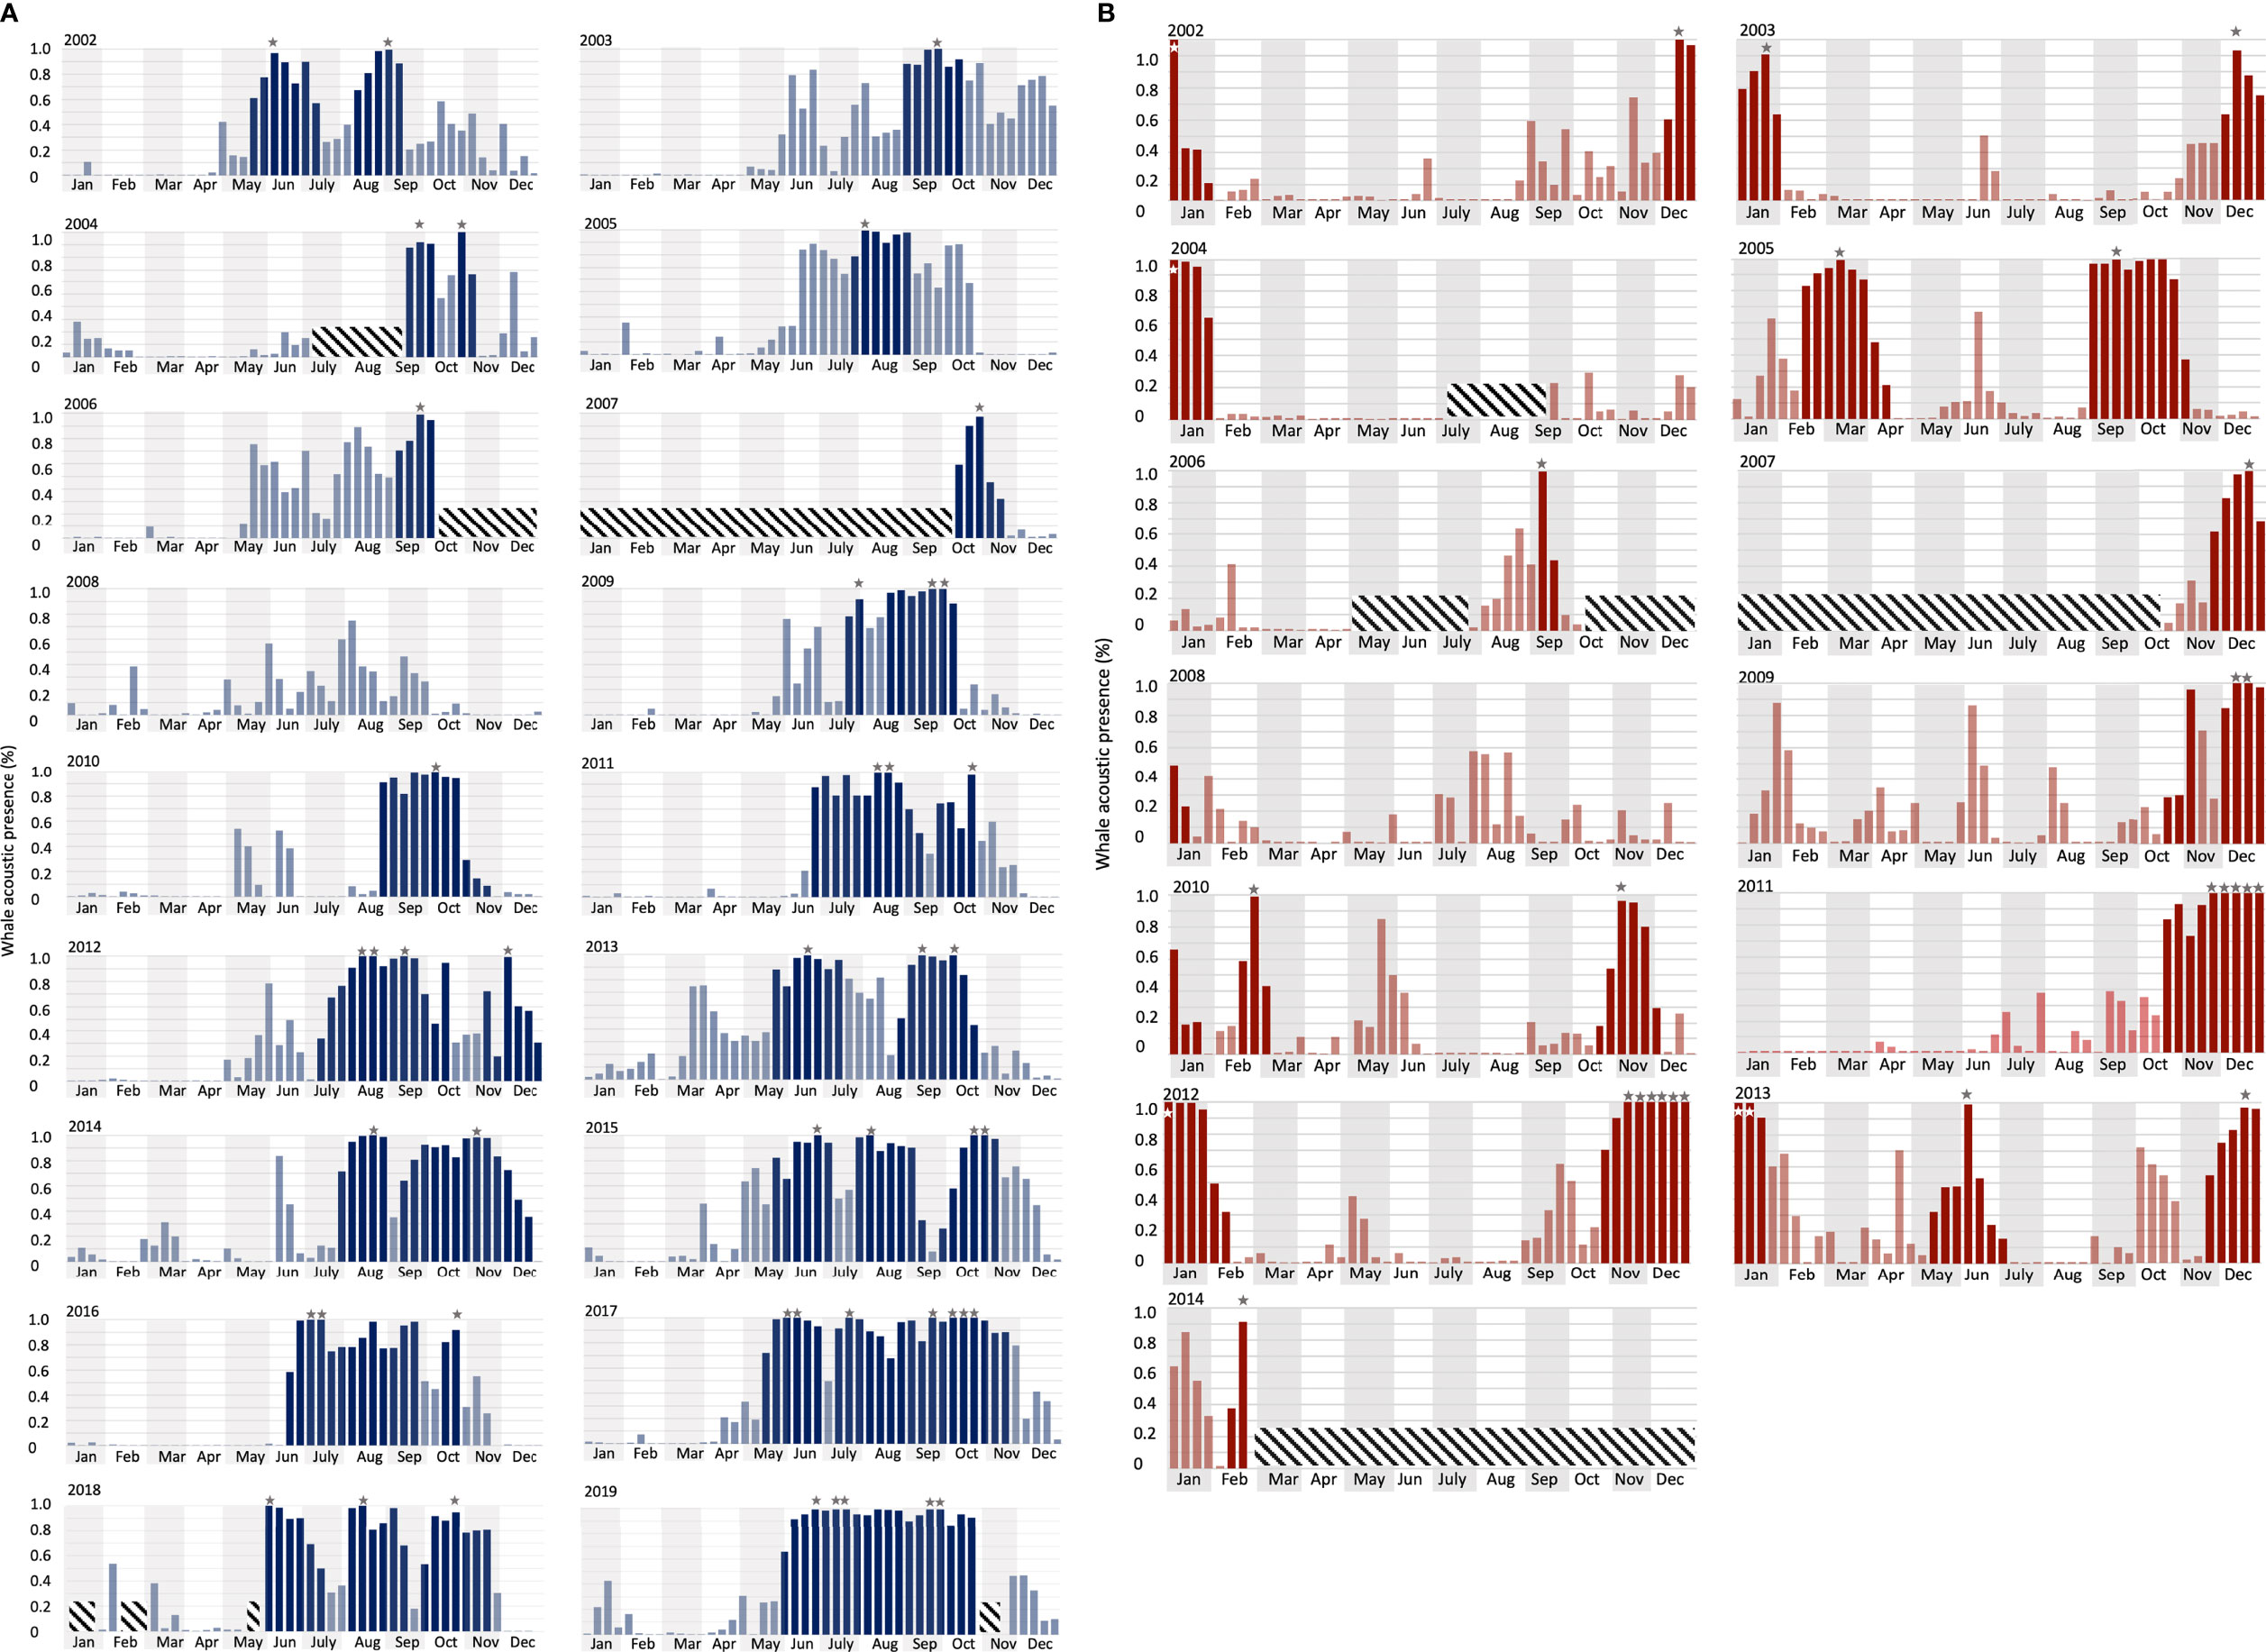
Figure 5 Long-term whale acoustic presence (defined as the percentage of hours when whale songs were detected, see Material and Methods) at (A) DGS (from 2002 to 2019) and (B) DGN (from 2002 to 2014). Vertical bars indicate the proportion of hours that one or more Chagos whale songs were detected in each eight-day period. Grey/white stars indicate peak time when there were more than 90% of the hours with Chagos song detections. Darker bars are the extended peak seasons that contain (as defined in the Methods section). Diagonal crosshatch-filled shades were unavailable data (See Material and Methods for the definition of the extended peak season).
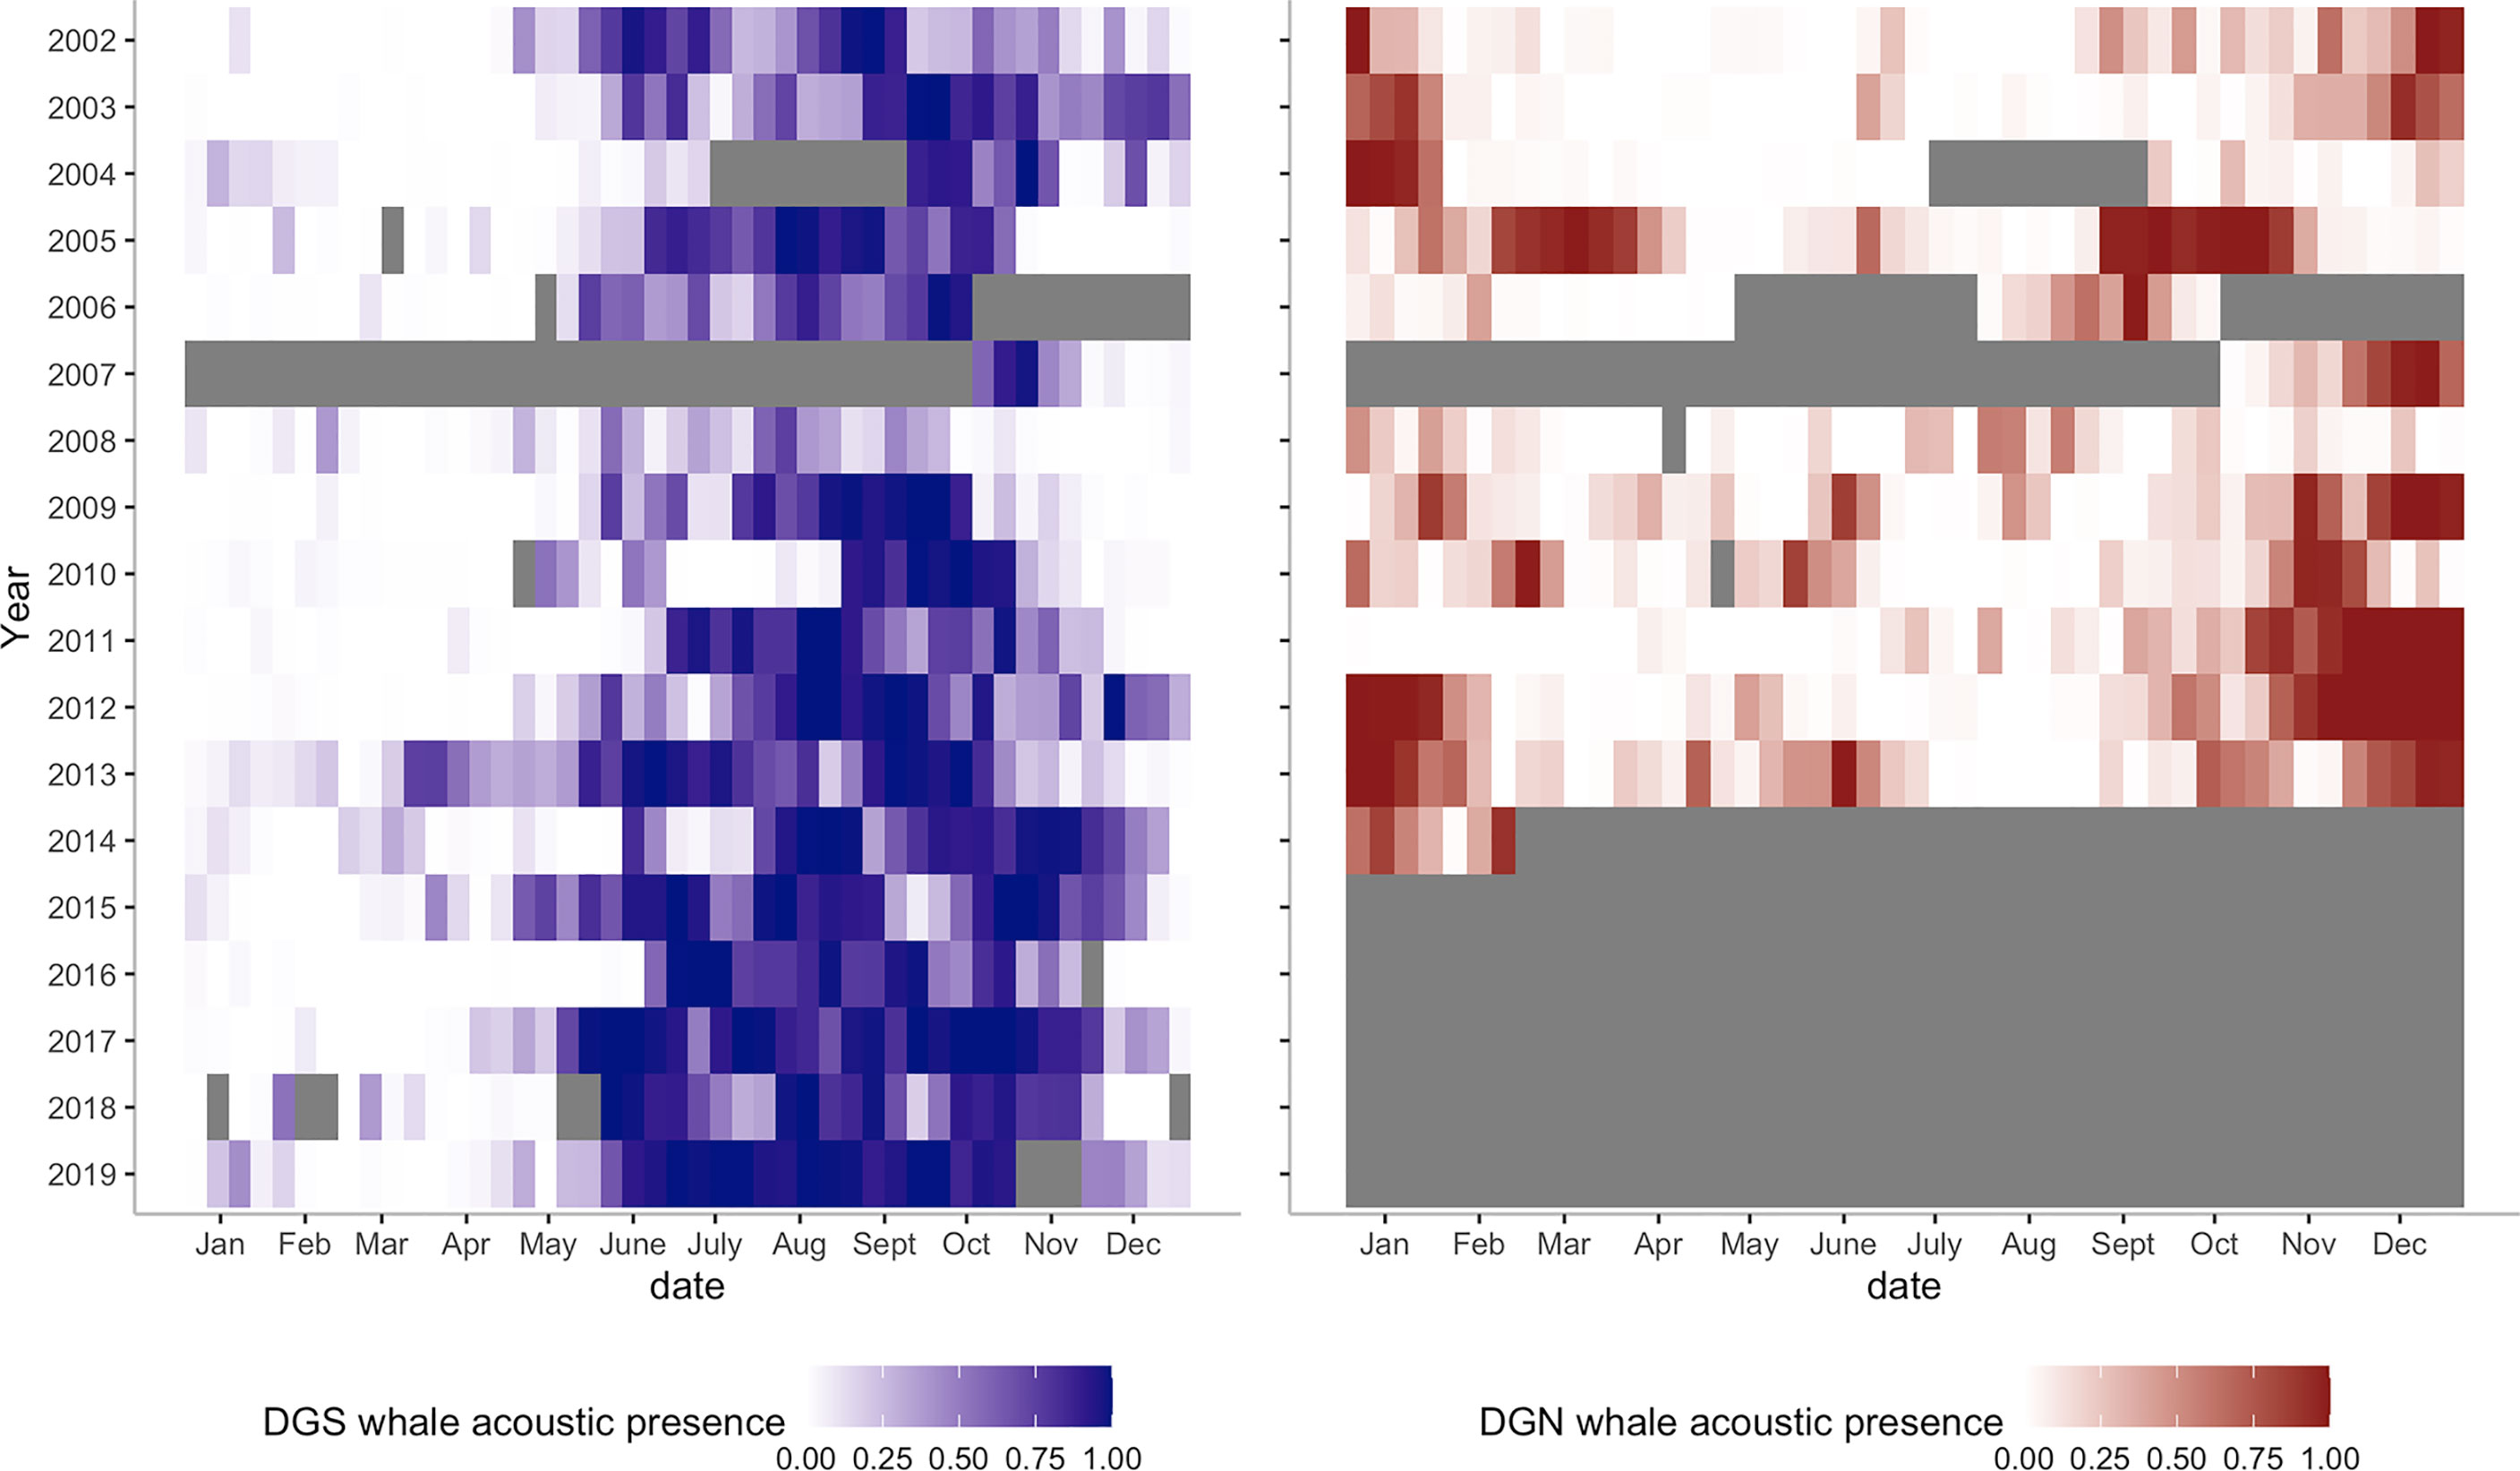
Figure 6 Heatmaps of Chagos whale acoustic presence at DGS (left, blue colour, from 2002 to 2019) and at DGN (right, red colour, from 2002 to 2014). Grey bars are missing data.
While the mean annual chlorophyll-a concentration was similar between DGN (0.14 mg/m3) and DGS (0.13 mg/m3), there was a difference between sites in the interannual change in chlorophyll-a concentration (Figure 7). At the DGS site, there were higher average chlorophyll-a concentrations in peak seasons than non-peak seasons however there was little seasonal difference at the DGN site.
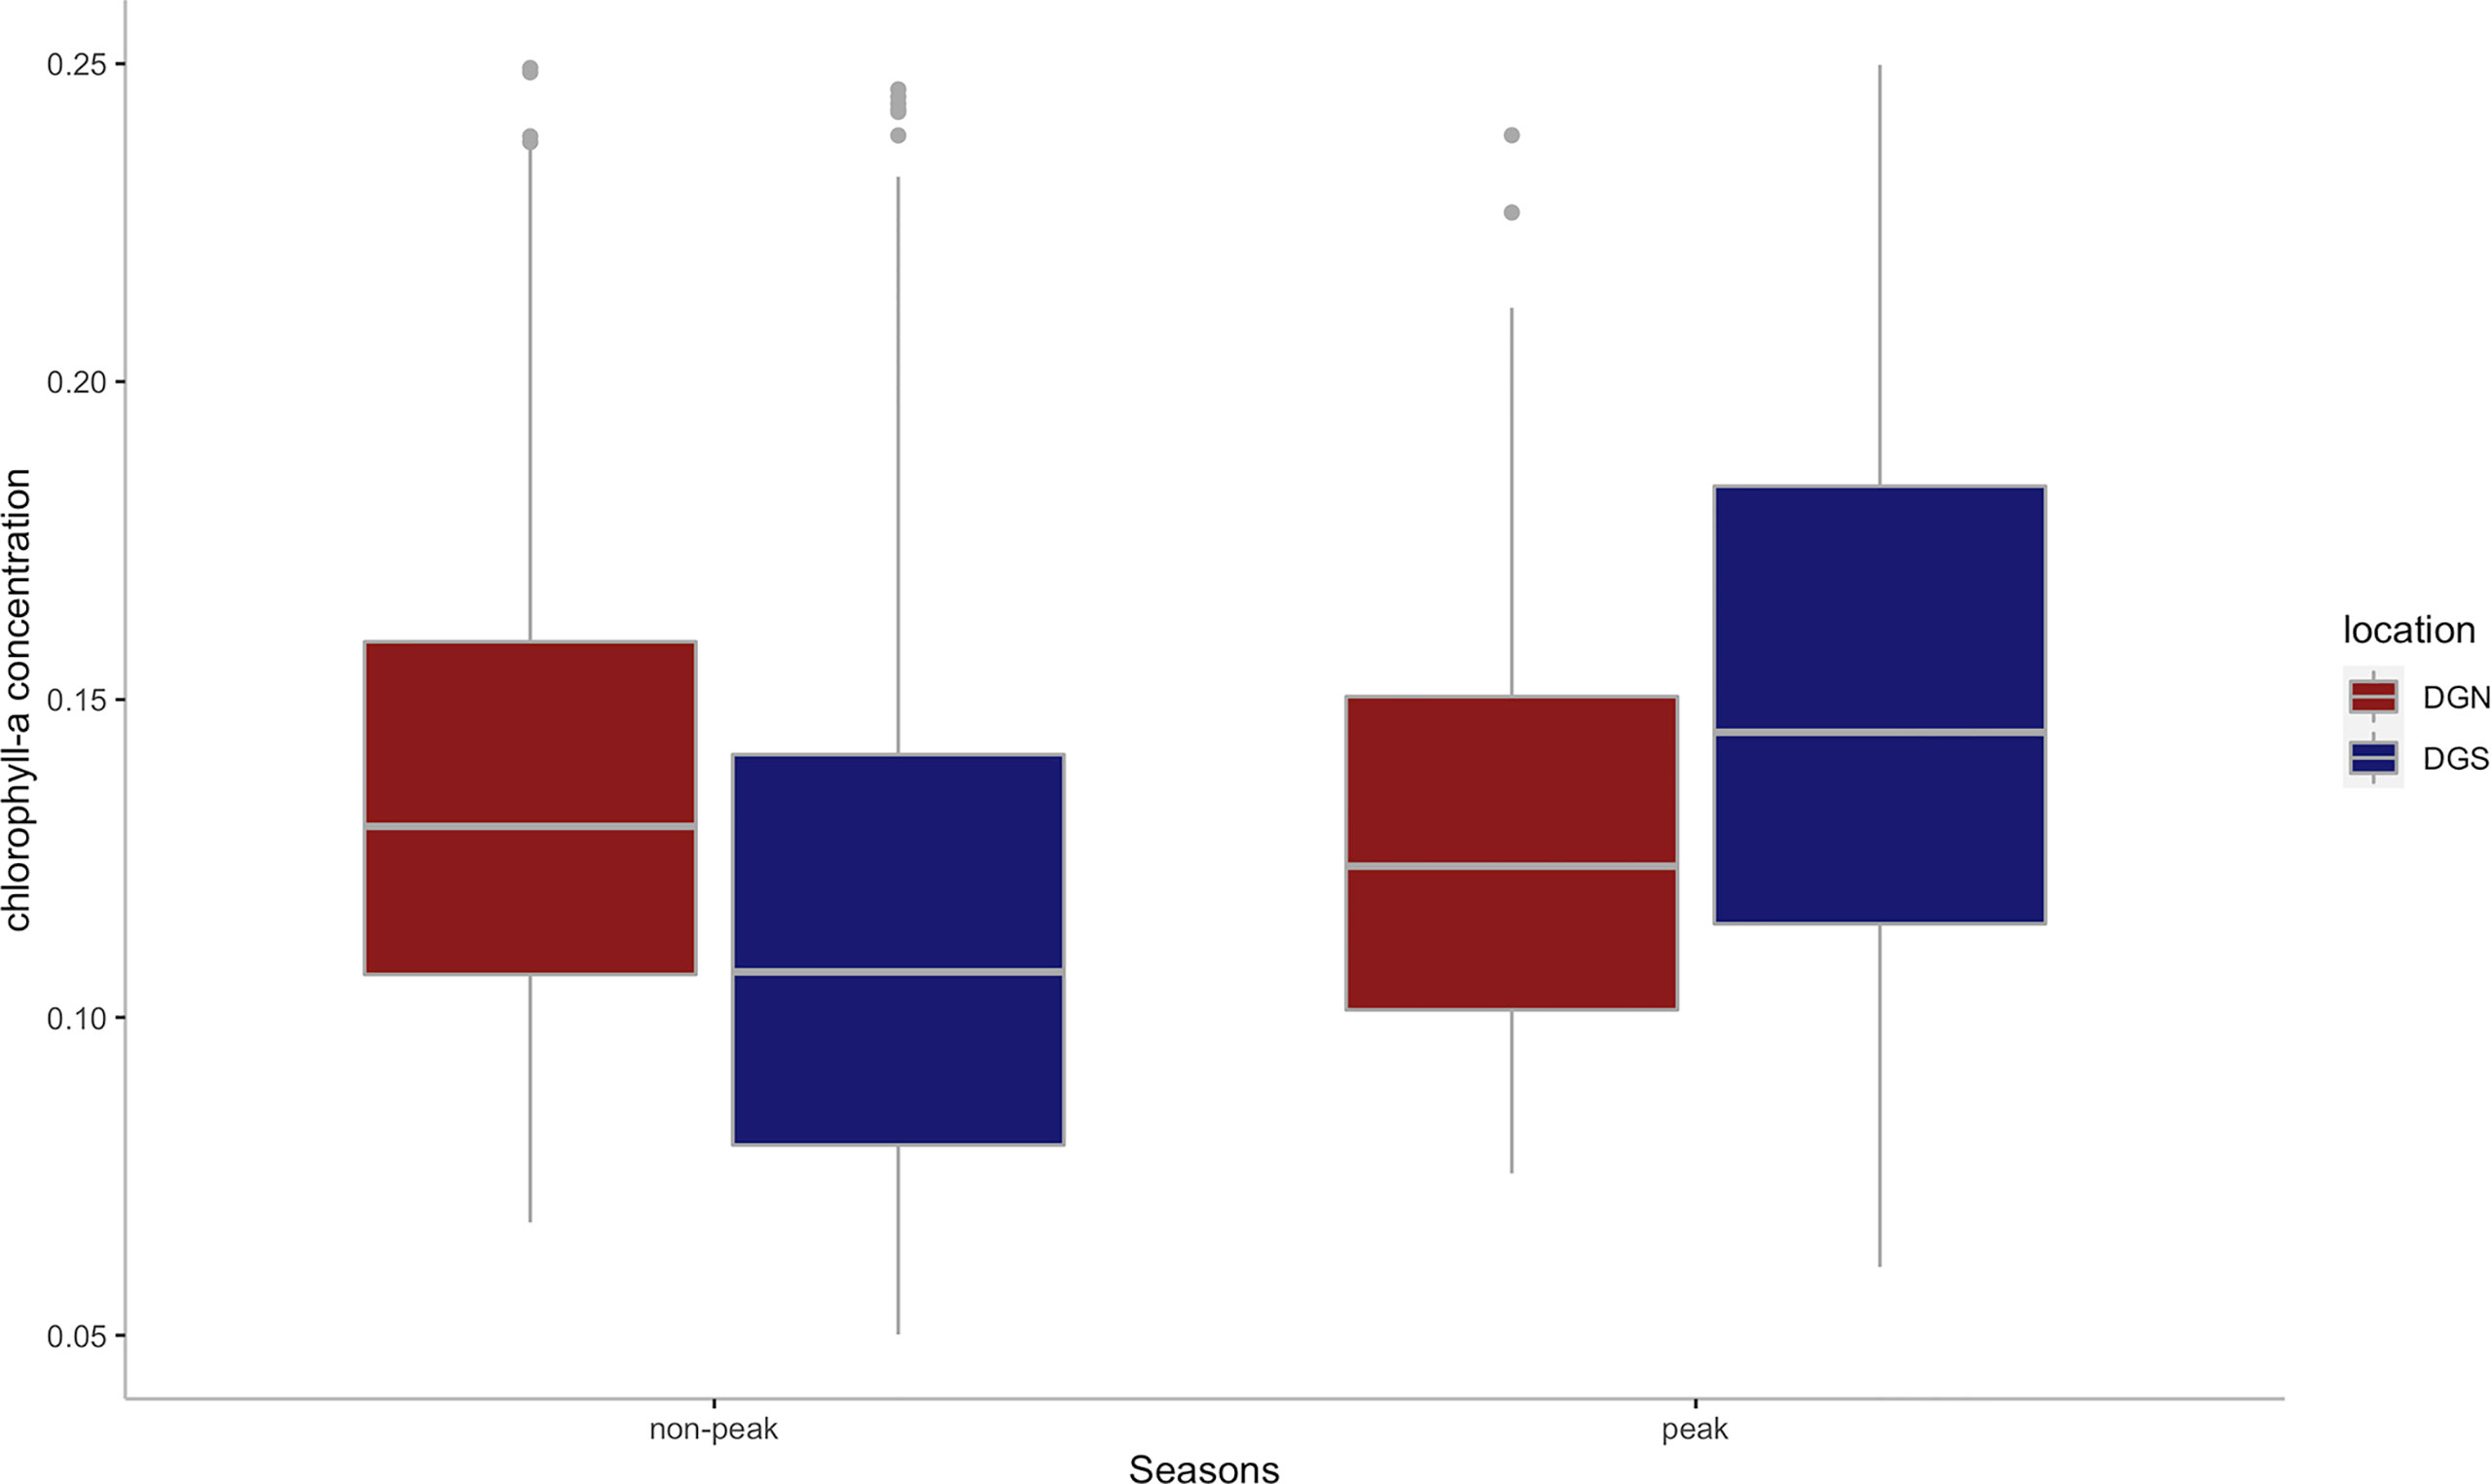
Figure 7 Boxplot of the mean chlorophyll-a concentration(mg/m3) for DGS (n = 13 from 2002 to 2014) and DGN (n = 18 from 2002 to 2019) during the corresponding peak seasons and non-peak seasons. Boxes represent interquartile ranges (IQR); solid white lines represent medians; black lines encompass data range 1.5*IQR below and above IQR; dots represent potential outliers.
4 Discussion
This study provides insights into the association between environmental variation and long-term patterns of Chagos whale phenology. Whale presence data are almost continuous at the two acoustically independent sites over 18 years (January 2002 – December 2019) and 13 years (January 2002 – February 2014), which covers episodes of rapid ocean warming throughout the Southern Hemisphere oceans. We found that the number of songs per day had increasing trends at both sites throughout the years. This study also suggests that Chagos whales may be feeding at the DGS site, in association with nutrients provided by the upwelling effect in the positive IOD phase. In addition, we found that the Chagos whales were arriving at their potential feeding ground earlier in the year in recent times (Figure 8).
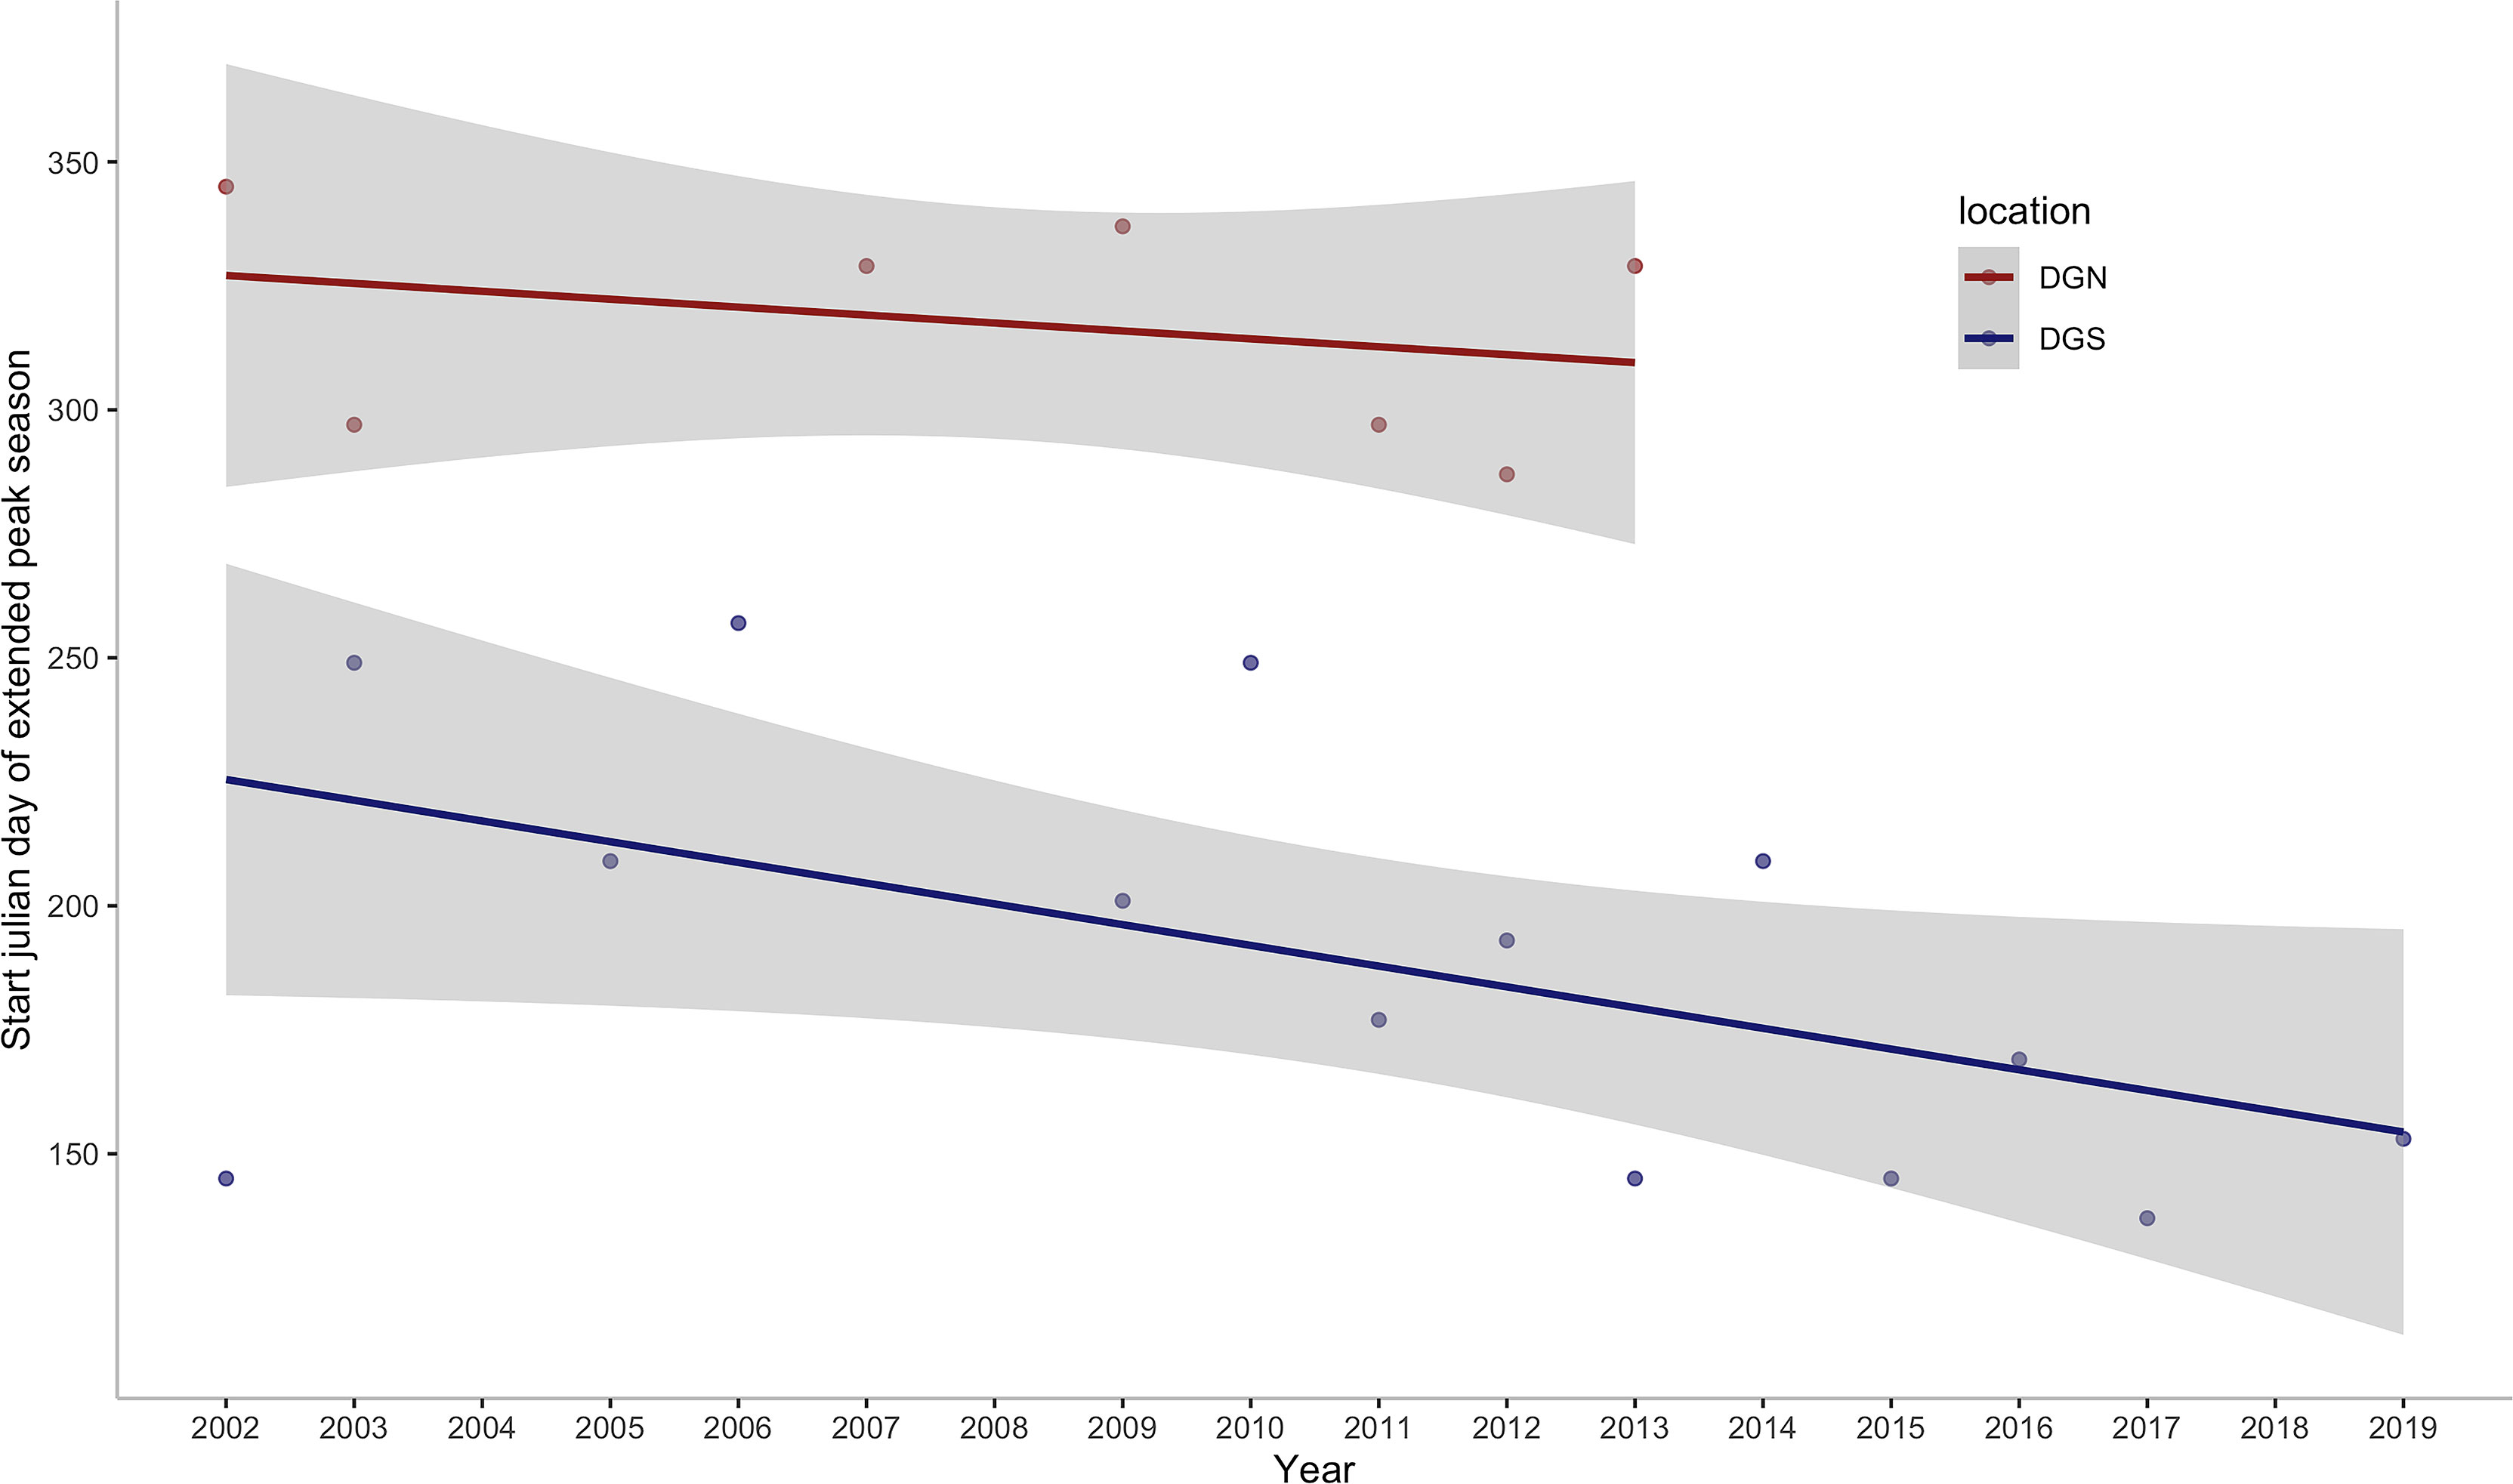
Figure 8 Annual change in the start julian day of the first extended peak season per year off Diego Garcia at the DGN site where the linear trend has a slope of -1.6 days/year (sample size is too small to calculate a p-value) and DGS site where the linear trend has a slope of -4.2 days/year with corresponding ρ of -0.53 and p -value of 0.05. ρ is the spearman coefficient of the start julian day of the first peak season with year.
4.1 Overall Trends and Interannual Difference in the Number of Chagos Whale Songs
The Chagos whales are present near Diego Garcia each year across the entire study period, with over five songs per hour detected at both sites, as also shown in Leroy et al. (2021). Peaks in different seasons were identified at both sites for almost every year (except for 2008, where the least number of Chagos songs were detected at each station). This suggests that the tropical Indian Ocean is a crucial habitat for this population of whales. The central Indian Ocean is a complex marine system with rich cetacean fauna (Anderson et al., 2012). Distinct blue whale acoustic groups are observed and produce more song types than in any other oceanic region (McDonald et al., 2006; Samaran et al., 2013). At Diego Garcia, besides the best-described Antarctic blue whale (McDonald et al., 2006), there have been at least four other pygmy blue whale populations (B. m. brevicauda or B. m. indica) detected from acoustic recordings, including the Sri Lankan/Northern Indian Ocean, the Madagascan/Central Indian Ocean, the Australian/Southeastern Indian Ocean and the Arabian sea/Northwestern Indian Ocean (NWIO) (Stafford et al., 2004; Stafford et al., 2011; Samaran et al., 2013; Double et al., 2014; Leroy et al., 2016; Leroy et al., 2018; Cerchio et al., 2020). Cerchio et al. (2020) recorded NWIO songs at the DGS and DGN sites over the 2010 – 2013 period. They observed considerably fewer songs and peak seasons than Chagos songs identified in this study; for instance, in 2010 NWIO songs were only recorded in May at the DGS site while we recorded Chagos song all year with two extended peak seasons at the same site. This provides further evidence that the central Indian Ocean is a crucial habitat of the Chagos whale population and Chagos whales are likely one of the most abundant populations in this area.
This study shows that the number of Chagos whales’ songs has increased over time. A 7.8% increase in song numbers was observed on the southeastern side of the Chagos-Laccadive Ridge, while songs increased by 12.6% on the northwestern side. Changes in acoustic presence could, to some extent, reflect changes in the number of whales in a given area (Charif et al., 2020). The values are within the range of population trends in other blue whale species (i.e., Antarctic blue whales 7%, Branch et al., 2004) and other baleen whales (i.e., 12% humpback whales, Wedekin et al., 2017; 4-5% eastern North Pacific fin whales, Zerbini et al., 2006), and are much higher than North Atlantic right whale (i.e., 2.8% from 1980 to 2010, decline post-2010, Pace et al., 2017). Acoustic data is not a reliable source to estimate the abundance of whale population because of the unknown distance that whale songs travel, but relative densities from the number of songs recorded can be inferred (Branch et al., 2007).
4.2 Correlation Between the Number of Whale Songs Detected and Environmental Factors
Although the DGN and DGS sites are close, they are acoustically independent due to the existence of Chagos-Laccadive Ridge. The Chagos Bank acts as a natural acoustic barrier and sounds produced on either side of the Chagos Bank are unlikely to be detected on the other side (Pulli and Upton, 2001). Clear seasonal patterns in Chagos whale presence were identified throughout the entire study period (Leroy et al., 2021). The relationship we predicted matches with the condition presented by the 18-year data from the DGS site as there were more whale songs detected when there were more food and lower temperature; while at the DGN site, more whales were present when there were less food and higher temperature. Chagos whales were more frequently detected at the DGN site between December and May (average SST: DGN site: 28.85°C; DGS site: 28.92°C), while most extended peak seasons of whale presence at the SE site were between June and November, in the cooler season (average SST: DGN site: 28.01°C; DGS site: 27.53°C). The mean and minimum SST tended to increase at both sites, although it increased at higher rates in the DGS site compared to in the DGN site.
Chlorophyll-a (a proxy for krill, the whales’ main prey) has an influence on whale presence. As we found that Chagos whales were present at the DGS site at times with higher chlorophyll-a concentrations, it is possible that Chagos whales use this region seasonally to feed. The correlation between chlorophyll-a and whale acoustic presence is stronger at the DGS site than at the DGN site.
It is therefore likely that whales are feeding in the vicinity of the DGS site at the Chagos-Laccadive ridge because chlorophyll-a and whale acoustic presence correlated positively. Chagos whale presence is negatively correlated with chlorophyll-a in the DGN, suggesting they are not feeding substantially at or near the DGN site.
Indian Ocean Dipole (IOD) was correlated with Chagos whale presence. At the DGS site, IOD and Chagos whale acoustic presence were correlated positively, whereas at the DGN site, IOD and Chagos whale acoustic presence were correlated negatively. The existence of Chagos-Laccadive ridge makes the two sites acoustically independent, and the effect of IOD may be different between sites. Chagos whales were more likely to be detected at the DGS site during positive IOD phases. During positive IOD phases, cooler SST is recorded at the DGS site and upwelling events may occur (Saji et al., 1999). It is likely that the cold upwelling water brings nutrients that may influence the presence of Chagos whales. The negative correlation between IOD and Chagos whale presence at the DGN site suggests a higher whale abundance during the negative IOD phase, in association with cooler water and upwelling (Figure 9). Similar patterns were found in Sri Lankan pygmy blue whales where they fed in the Arabia Sea off the coast of Somalia during the period of intense upwelling of the monsoon season (Anderson et al., 2012).
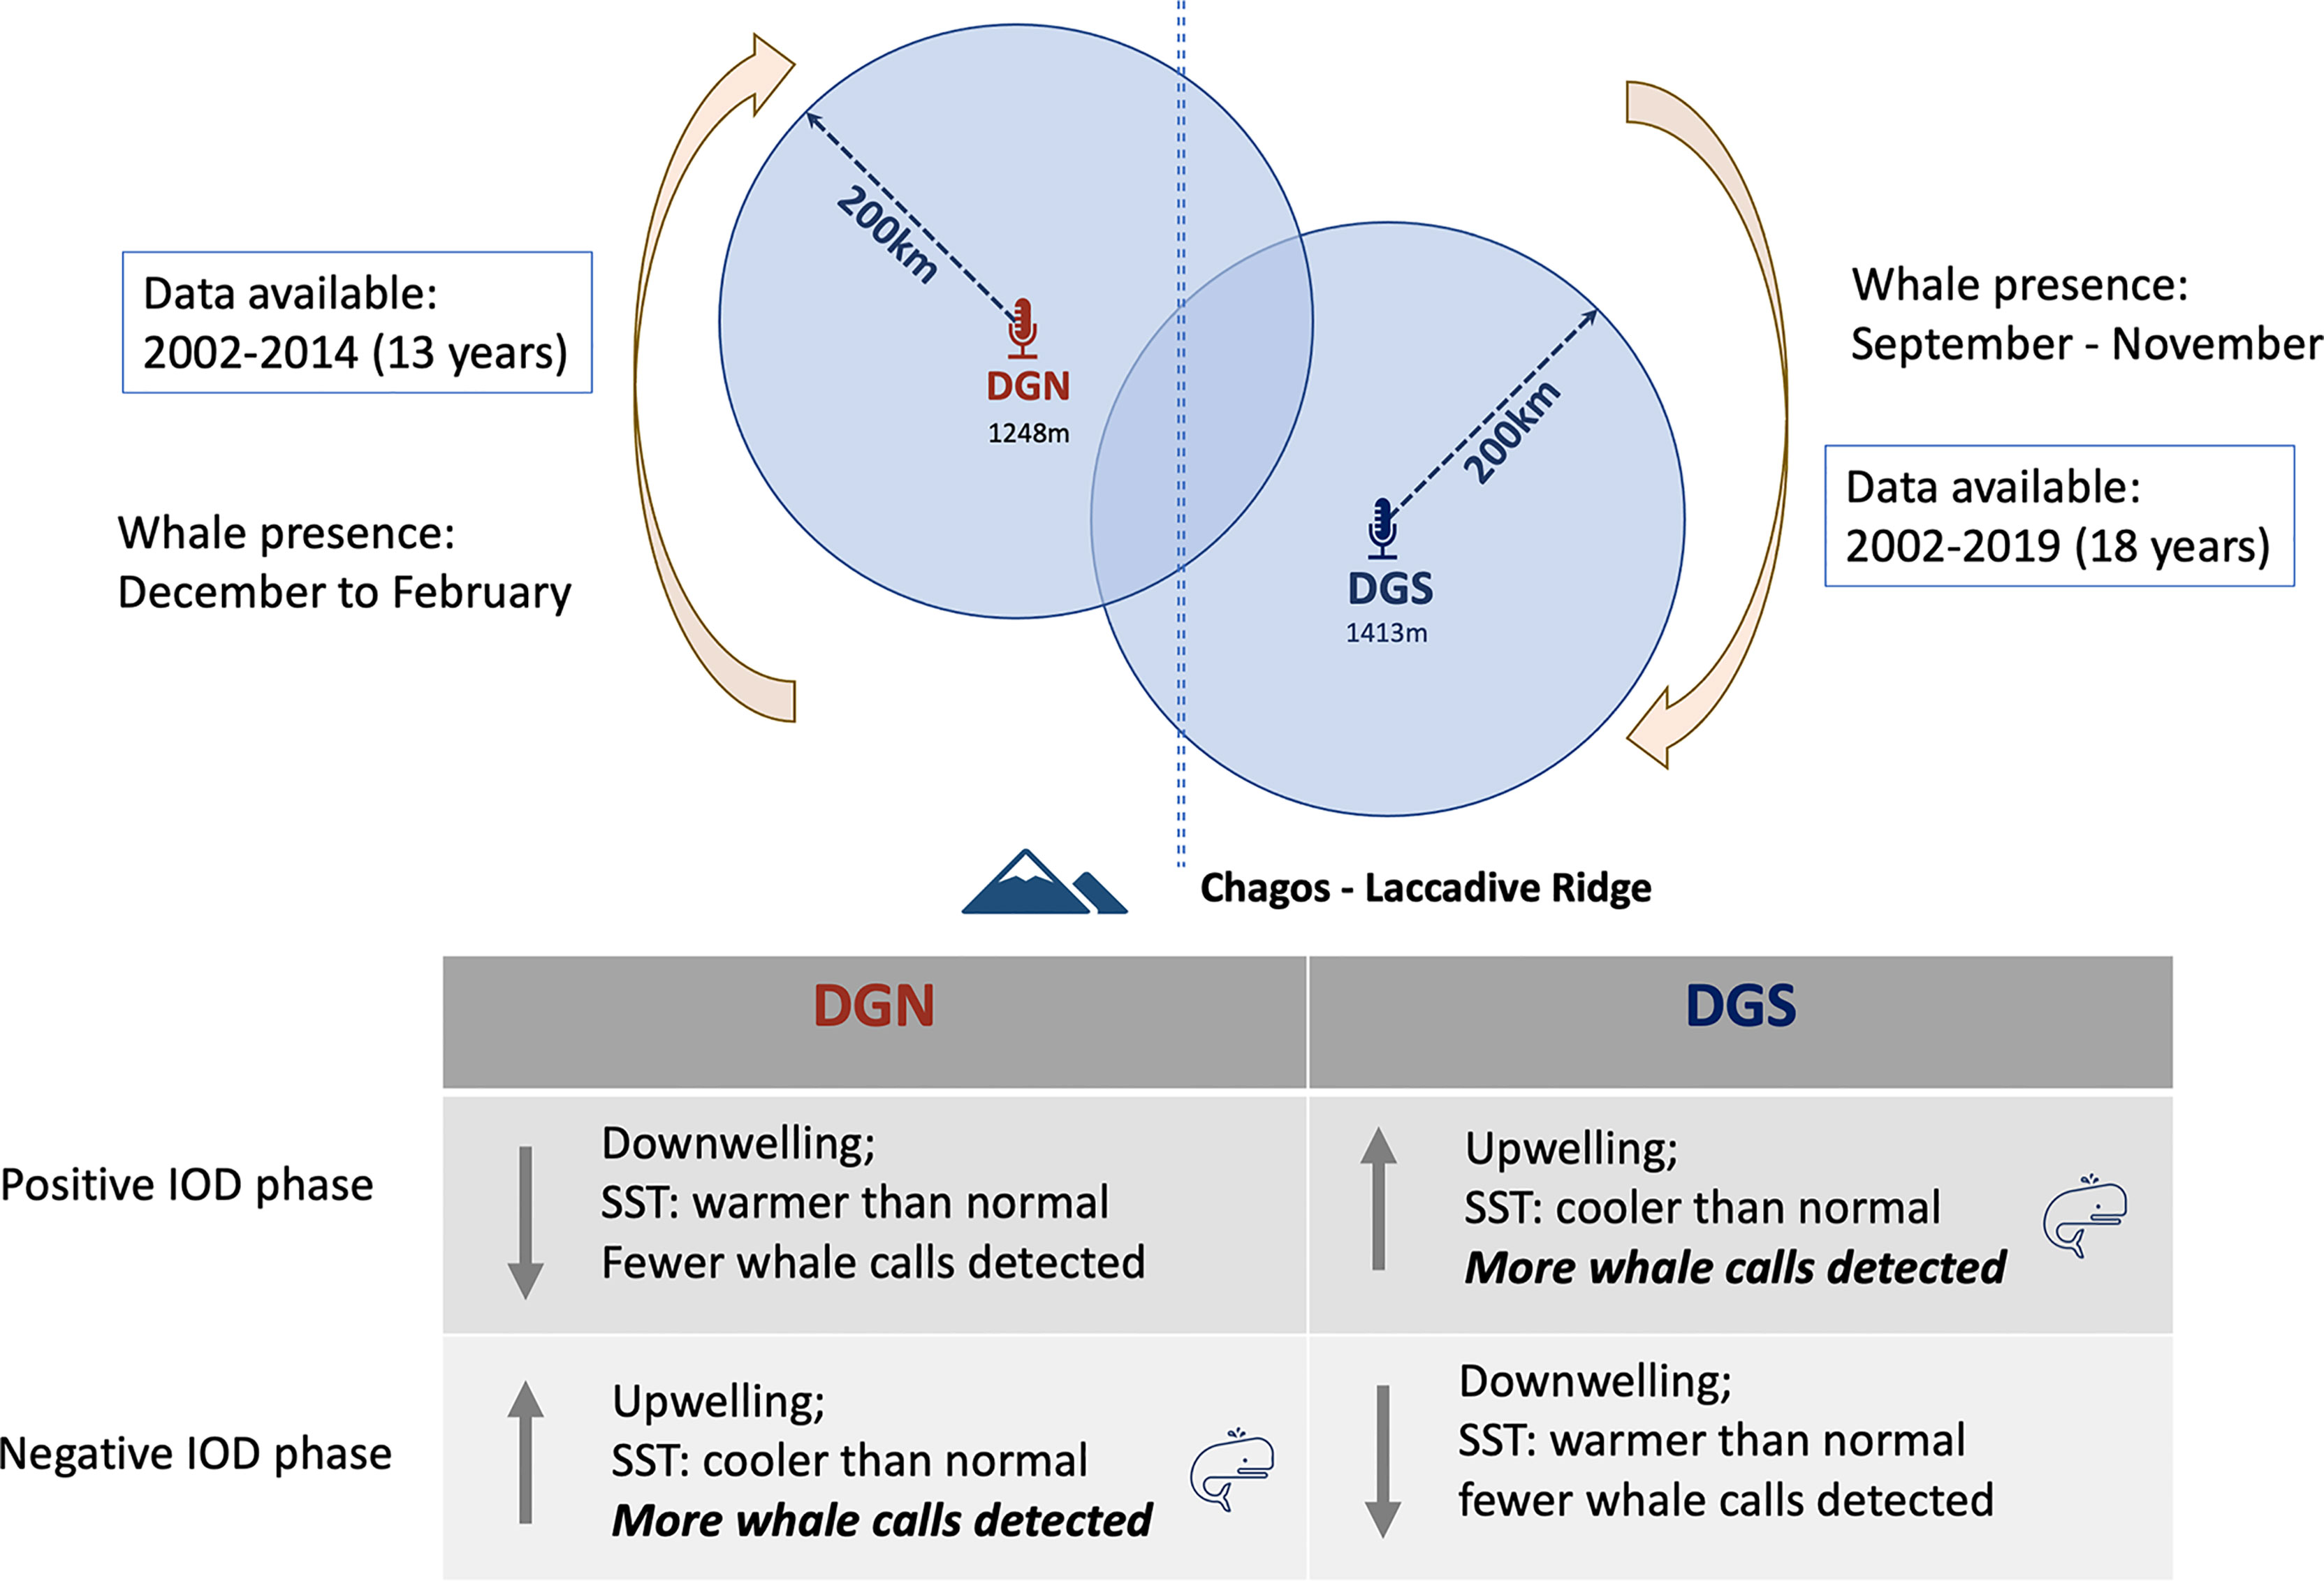
Figure 9 Conceptual figure of the relationship between Indian Ocean Dipole (IOD) and whale song detected at DGN and DGS. Positive and negative IOD phases influence in the Indian Ocean were described by Saji et al., 1999.
In addition, ENSO was correlated to whale songs detected, but the influence was not as strong as the IOD. It may be because Diego Garcia is in the central Indian Ocean while ENSO has a stronger influence in the Pacific Ocean.
4.3 Extended Peak Seasons of the Chagos Whale Songs
This study shows that Chagos whales stay near the southeastern side of Diego Garcia, potentially to feed in the vicinity of the highly productive zones, during the cooler seasons (June to November). Pygmy blue whale song detection has interannual differences, peaking in activity between August and October at DGS and between November and February at DGN, suggesting the area may represent a natural migratory corridor between the north and south of Diego Garcia. After March, they may disperse as far north as the Laccadive Sea off Sri Lanka or as far south as Kimberley region of Australia (Leroy et al., 2021). The migration of Chagos whales was proposed to be in a clockwise pattern across the equatorial Indian Ocean (Leroy et al., 2021). Unlike the Chagos blue whales, other blue whales migrate north-south so that their distribution spans across latitudes (Branch et al., 2007). For example, Antarctic blue whales are frequently found south of 70°S in the austral summer where they feed, while in the winter they migrate to low latitudes further north to calve and mate (Double et al., 2014; Balcazar et al., 2015). This study showed that Chagos whales are most frequently present from September to November at the DGS site, and they move to DGN site and stay there from December to February. In line with preliminary reports of occurrence of the Chagos whale songs (Sousa and Harris, 2015; Leroy et al., 2021), this study suggest Chagos whales may have a different migration pattern, rather than moving north-south, as the other blue whales do, that instead they migrate from east-to-west.
This study shows that Chagos whales are recorded in the tropical central Indian Ocean year-round. Not all whales migrate, as Širović et al. (2004) recorded Antarctic blue whales songs year-round in the Southern Ocean, near the Antarctic Peninsula. Tripovich et al. (2015) also found blue whale songs all year round in southern Australian waters off Portland, South Australia. The proportion of the blue whale population that migrates remains unclear. We found that Chagos whales were present year-round however their occurrence was highly seasonal. Further study of the acoustic presence of Chagos whales in further north or south (e.g., Sri Lanka and Kimberley) could reveal if Chagos whales have long-term habitats other than central Indian Ocean.
Chagos whales tended to arrive earlier at the DGS site each year in the study. The extended peak season at the DGS site starting time shifted from around September to May (Except for the year 2002, the starting time of the extended peak season was May on the DGS). Former studies suggest that blue whales are arriving earlier at their feeding area, and the starting time of the peak season is correlated with colder SST anomalies of the previous seasons in Southern California (Szesciorka et al., 2020). Ramp et al. (2015) show that the humpback whales and fin whales were arriving at their feeding ground earlier from 1984 to 2010. Our analysis reveals that the Chagos whales are likely to arrive at their feeding ground earlier.
It is important we understand how the long-term warming of the tropical Indian Ocean (Levitus et al., 2009; Xue et al., 2012) is influencing its marine life; given this region has warmed faster than the equivalent tropical Pacific and Atlantic and that the warming is accelerating (Rayner, 2003). Although it is difficult to sustain long-term monitoring studies in remote regions, like the central tropical Indian Ocean, this study demonstrated how continuous multiyear acoustic surveillance reveals that Chagos whales change the timing of their migration from year to year, and that local and oceanic environmental conditions may be implicated. The migration pattern of the pygmy blue whales is poorly known in the Indian Ocean (Branch et al., 2007). Understanding the migration pattern helps model the distribution of these whales and assists the prediction of whale presences into the future. It can also benefit conservation managers to develop conservation strategies for wildlife protection (i.e., establishment of marine protected area). Further study of the Chagos whales’ movement will provide insights on how environmental changes influence marine life.
Data Availability Statement
The raw data supporting the conclusions of this article will be made available by the authors, without undue reservation.
Ethics Statement
Ethical review and approval was not required for the animal study because the acoustic data was used.
Author Contributions
JH and TR conceived the project and designed methodology. EL provided acoustic detection data. JH and TR analysed the data; JH and TR led the writing and GT and EL contributed to editing and gave final approval for publication.
Funding
Funding was provided by the Winnifred Scott Foundation.
Author Disclaimer
The findings and conclusion in this manuscript are those of the authors and do not necessarily represent the views of the CTBTO.
Conflict of Interest
The authors declare that the research was conducted in the absence of any commercial or financial relationships that could be construed as a potential conflict of interest.
Publisher’s Note
All claims expressed in this article are solely those of the authors and do not necessarily represent those of their affiliated organizations, or those of the publisher, the editors and the reviewers. Any product that may be evaluated in this article, or claim that may be made by its manufacturer, is not guaranteed or endorsed by the publisher.
Acknowledgments
Hydroacoustic data was made available via a Virtual Data Exploitation Centre contract with the Comprehensive Test Ban Treaty Organization (CTBTO). We thank Anant Mathur for his suggestion on statistics. We would also like to thank mammal lab, especially Anna Lewis for providing comments on the draft manuscript.
Supplementary Material
The Supplementary Material for this article can be found online at: https://www.frontiersin.org/articles/10.3389/fmars.2022.843875/full#supplementary-material
Supplementary Figure 1 | Scatter plots of the Chagos whale acoustic presence (%) (defined as the percentage of hours when whale songs were detected, see Material and Methods section) during each eight-day period and their corresponding environmental factors: chlorophyll-a concentration (mg/m3); SST (°C); SOI; and DMI for the south-eastern (DGS) site (red) and north-western (DGN) site (blue). The red and blue lines indicate their binomial relationships.
References
Allen K. R. (1971). Relation Between Production and Biomass. J. Fish. Res. Board Canada 28 (10), 1573–1581. doi: 10.1139/f71-236
Anderson R. C., Branch T. A., Alagiyawadu A., Baldwin R., Marsac F. (2012). Seasonal Distribution, Movements and Taxonomic Status of Blue Whales (Balaenoptera Musculus) in the Northern Indian Ocean. J. Cetacean Res. Manage. 12 (2), 203–218.
Arkhipkin A. I., Middleton D. A. J., Sirota A. M., Grzebielec R. (2004). The Effect of Falkland Current Inflows on Offshore Ontogenetic Migrations of the Squid Loligo Gahi on the Southern Shelf of the Falkland Islands. Estuar. Coast. Shelf Sci. 60 (1), 11–22. doi: 10.1016/j.ecss.2003.11.016
Balcazar N. E., Tripovich J. S., Klinck H., Nieukirk S. L., Mellinger D. K., Dziak R. P., et al. (2015). Calls Reveal Population Structure of Blue Whales Across the Southeast Indian Ocean and the Southwest Pacific Ocean. J. Mammal. 96 (6), 1184–1193. doi: 10.1093/jmammal/gyv126
Bates D., Maechle M., Bolker B., Walker S., Christensen R., Singmann H. (2021) Lme4: Linear Mixed-Effects Models Using 'Eigen' and S4. Available at: https://cran.r-project.org/web/packages/lme4/index.html.
Belkin I. M. (2009). Rapid Warming of Large Marine Ecosystems. Prog. Oceanogr. 81 (1-4), 207–213. doi: 10.1016/j.pocean.2009.04.011
Branch T. A., Stafford K. M., Palacios D. M., Allison C., Bannister J. L., Burton C. L. K., et al. (2007). Past and Present Distribution, Densities and Movements of Blue Whales Balaenoptera Musculus in the Southern Hemisphere and Northern Indian Ocean. Mammal. Rev. 37 (2), 116–175. doi: 10.1111/j.1365-2907.2007.00106.x
Branch T. A., Matsuoka K., Miyashita T. (2004). Evidence For Increases In Antarctic Blue Whales Based On Bayesian Modelling. Mar Mamm Sci, 20 (4), 726–54. doi: 10.1111/j.1748-7692.2004.tb01190.x
Bryndum-Buchholz A., Tittensor D. P., Blanchard J. L., Cheung W. W. L., Coll M., Galbraith E. D., et al. (2019). Twenty-First-Century Climate Change Impacts on Marine Animal Biomass and Ecosystem Structure Across Ocean Basins. Global Change Biol. 25 (2), 459–472. doi: 10.1111/gcb.14512
Cai W., Santoso A., Wang G., Weller E., Wu L., Ashok K., et al. (2014). Increased Frequency of Extreme Indian Ocean Dipole Events Due to Greenhouse Warming. Nature 510 (7504), 254–258. doi: 10.1038/nature13327
Cai W., Santoso A., Wang G., Yeh S.-W., An S.-I., Cobb K. M., et al. (2015). ENSO and Greenhouse Warming. Nat. Climate Change 5 (9), 849–859. doi: 10.1038/nclimate2743
Cerchio S., Willson A., Leroy E., Muirhead C., Al Harthi S., Baldwin R., et al. (2020). A New Blue Whale Song-Type Described for the Arabian Sea and Western Indian Ocean. Endangered Species Res. 43, 495–515. doi: 10.3354/esr01096
Charif R. A., Shiu Y., Muirhead C. A., Clark C. W., Parks S. E., Rice A. N. (2020). Phenological Changes in North Atlantic Right Whale Habitat Use in Massachusetts Bay. Global Change Biol. 26 (2), 734–745. doi: 10.1111/gcb.14867
Davis G. E., Baumgartner M. F., Corkeron P. J., Bell J., Berchok C., Bonnell J. M., et al. (2020). Exploring Movement Patterns and Changing Distributions of Baleen Whales in the Western North Atlantic Using a Decade of Passive Acoustic Data. Global Change Biol. 26 (9), 4812–4840. doi: 10.1111/gcb.15191
Derville S., Torres L. G., Albertson R., Andrews O., Baker C. S., Carzon P., et al. (2019). Whales in Warming Water: Assessing Breeding Habitat Diversity and Adaptability in Oceania's Changing Climate. Global Change Biol. 25 (4), 1466–1481. doi: 10.1111/gcb.14563
Double M. C., Andrews-Goff V., Jenner K. C. S., Jenner M.-N., Laverick S. M., Branch T. A., et al. (2014). Migratory Movements of Pygmy Blue Whales (Balaenoptera Musculus Brevicauda) Between Australia and Indonesia as Revealed by Satellite Telemetry. Plos One 9, 4. doi: 10.1371/journal.pone.0093578
Forrest J., Miller-Rushing A. J. (2010). Toward a Synthetic Understanding of the Role of Phenology in Ecology and Evolution. Philos. Trans. R. Soc. B: Biol. Sci. 365 (1555), 3101–3112. doi: 10.1098/rstb.2010.0145
Gibson R., Atkinson R., Gordon J., Editors T., In F., Learmonth J., et al. (2007). Potential Effects Of Climate Change On Marine Mammals. Oceanography and Marine Biology 44, 431–464. doi: 10.1201/9781420006391.ch8
Gnanadesikan G. E., Pearse W. D., Shaw A. K. (2017). Evolution of Mammalian Migrations for Refuge, Breeding, and Food. Ecol. Evol. 7 (15), 5891–5900. doi: 10.1002/ece3.3120
Hanson J. (2001). Initial Analysis of Data From the New Diego Garcia Hydroacoustic Station 12. 23rd Seismic Research Review, Jackson Hole, WY, Department of Energy, USA
Han W., Vialard J., McPhaden M. J., Lee T., Masumoto Y., Feng M., et al. (2014). Indian Ocean Decadal Variability: A Review. Bull. Am. Meteorol. Soc. 95 (11), 1679–1703. doi: 10.1175/bams-d-13-00028.1
Hiddink J. (2003). Modelling the Adaptive Value of Intertidal Migration and Nursery Use in the Bivalve Macoma Balthica. Mar. Ecol. Prog. Ser. 252, 173–185. doi: 10.3354/meps252173
Horton T. W., Holdaway R. N., Zerbini A. N., Hauser N., Garrigue C., Andriolo A., et al. (2011). Straight as an Arrow: Humpback Whales Swim Constant Course Tracks During Long-Distance Migration. Biol. Lett. 7 (5), 674–679. doi: 10.1098/rsbl.2011.0279
IPCC (2021). “Climate Change 2022,” in Impacts, Adaptation and Vulnerability. Cambridge University Press, Cambridge, United Kingdom and New York, NY, USA. Available at: http://www.ipcc.ch.
Jayakumar A., Vialard J., Lengaigne M., Gnanaseelan C., McCreary J. P., Praveen Kumar B. (2011). Processes Controlling the Surface Temperature Signature of the Madden–Julian Oscillation in the Thermocline Ridge of the Indian Ocean. Climate Dynamics 37 (11-12), 2217–2234. doi: 10.1007/s00382-010-0953-5
Keller S., Valls M., Hidalgo M., Quetglas A. (2014). Influence of Environmental Parameters on the Life-History and Population Dynamics of Cuttlefish Sepia Officinalis in the Western Mediterranean. Estuar. Coast. Shelf Sci. 145, 31–40. doi: 10.1016/j.ecss.2014.04.016
Leroy E. C., Royer J.-Y., Alling A., Maslen B., Rogers T. L. (2021). Multiple Pygmy Blue Whale Acoustic Populations in the Indian Ocean: Whale Song Identifies a Possible New Population. Sci. Rep. 11 (1), 8762. doi: 10.1038/s41598-021-88062-5
Leroy E. C., Samaran F., Bonnel J., Royer J.-Y. (2016). Seasonal and Diel Vocalization Patterns of Antarctic Blue Whale (Balaenoptera Musculus Intermedia) in the Southern Indian Ocean: A Multi-Year and Multi-Site Study. PloS One 11 (11), e0163587. doi: 10.1371/journal.pone.0163587
Leroy E., Samaran F., Stafford K., Bonnel J., Royer J. (2018). Broad-Scale Study of the Seasonal and Geographic Occurrence of Blue and Fin Whales in the Southern Indian Ocean. Endangered Species Res. 37, 289–300. doi: 10.3354/esr00927
Levitus S., Antonov J. I., Boyer T. P., Locarnini R. A., Garcia H. E., Mishonov A. V., et al (2009). Global Ocean Heat Content 1955-2008 in Light of Recently Revealed instrumentation problems. Geophys Res Lett, 36 (7), L07608. doi: 10.1029/2008gl037155
McDonald M., Hildebrand J., Mesnick S. (2006). Biogeographic Characterisation of Blue Whale Song Worldwide: Using Song to Identify Populations. J. Cetacean Res. Manage. 8, 2006.
Miller D. D., Ota Y., Sumaila U. R., Cisneros-Montemayor A. M., Cheung W. W. L. (2018). Adaptation Strategies to Climate Change in Marine Systems. Global Change Biol. 24 (1), e1–e14. doi: 10.1111/gcb.13829
Pace R. M., Corkeron P. J., Kraus S. D. (2017). State-Space Mark-Recapture Estimates Reveal a Recent Decline in Abundance of North Atlantic Right Whales. Ecol. Evol. 7 (21), 8730–8741. doi: 10.1002/ece3.3406
Perry D., Staveley T., Deyanova D., Baden S., Dupont S., Hernroth B., et al. (2019). Global Environmental Changes Negatively Impact Temperate Seagrass Ecosystems. Ecosphere 10 (12), e02986. doi: 10.1002/ecs2.2986
Poloczanska E. S., Brown C. J., Sydeman W. J., Kiessling W., Schoeman D. S., Moore P. J., et al. (2013). Global Imprint of Climate Change on Marine Life. Nat. Climate Change 3 (10), 919–925. doi: 10.1038/nclimate1958
Pulli J., Upton Z. (2001). Hydroacoustic Blockage at Diego Garcia: Models and Observations. 21st Seismic Research Symposium, Las Vegas, NV, Department of Defense, USA
Ramp C., Delarue J., Palsbøll P. J., Sears R., Hammond P. S. (2015). Adapting to a Warmer Ocean—Seasonal Shift of Baleen Whale Movements Over Three Decades. PloS One 10 (3), e0121374. doi: 10.1371/journal.pone.0121374
Rayner N. A. (2003). Global Analyses of Sea Surface Temperature, Sea Ice, and Night Marine Air Temperature Since the Late Nineteenth Century. J Geophys Res, 108 (D14), 4407. doi: 10.1029/2002jd002670
Saji N. H., Goswami B. N., Vinayachandran P. N., Yamagata T. (1999). A Dipole Mode in the Tropical Indian Ocean. Nature 401 (6751), 360–363. doi: 10.1038/43854
Samaran F., Stafford K., Branch T., Gedamke J., Royer J.-Y., Dziak R., et al. (2013). Seasonal and Geographic Variation of Southern Blue Whale Subspecies in the Indian Ocean. PloS One 8 (8), e71561. doi: 10.1371/journal.pone.0071561
Schall E., Thomisch K., Boebel O., Gerlach G., Mangia Woods S., El-Gabbas A., et al. (2021). Multi-Year Presence of Humpback Whales in the Atlantic Sector of the Southern Ocean But Not During El Niño. Commun. Biol. 4 (1), 790. doi: 10.1038/s42003-021-02332-6
Shaw A. K. (2016). Drivers of Animal Migration and Implications in Changing Environments. Evol. Ecol. 30 (6), 991–1007. doi: 10.1007/s10682-016-9860-5
Širović A., Hildebrand J. A., Wiggins S. M., McDonald M. A., Moore S. E., Thiele D. (2004). Seasonality of Blue and Fin Whale Calls and the Influence of Sea Ice in the Western Antarctic Peninsula. Deep Sea Res. Part II: Topical Stud. Oceanogr. 51 (17-19), 2327–2344. doi: 10.1016/j.dsr2.2004.08.005
Sousa A. G., Harris D. (2015). Description and Seasonal Detection of Two Potential Whale Calls Recorded in the Indian Ocean. J. Acoust. Soc. America 138 (3), 1379–1388. doi: 10.1121/1.4928719
Stafford K. M., Bohnenstiehl D. R., Tolstoy M., Chapp E., Mellinger D. K., Moore S. E. (2004). Antarctic-Type Blue Whale Calls Recorded at Low Latitudes in the Indian and Eastern Pacific Oceans. Deep-Sea Res. Part I Oceanogr. Res. Papers 51 (10), 1337–1346. doi: 10.1016/j.dsr.2004.05.007
Stafford K., Chapp E., Bohnenstiel D., Tolstoy M. (2011). Seasonal Detection of Three Types of “Pygmy” Blue Whale Calls in the Indian Ocean. Mar. Mammal. Sci. 27 (4), 828–840. doi: 10.1111/j.1748-7692.2010.00437.x
Szesciorka A. R., Ballance L. T., Širović A., Rice A., Ohman M. D., Hildebrand J. A., et al. (2020). Timing is Everything: Drivers of Interannual Variability in Blue Whale Migration. Sci. Rep. 10 (1), 7710. doi: 10.1038/s41598-020-64855-y
Thomas P. O., Reeves R. R., Brownell R. L. (2016). Status of the World's Baleen Whales. Mar. Mammal. Sci. 32 (2), 682–734. doi: 10.1111/mms.12281
Tripovich J. S., Klinck H., Nieukirk S. L., Adams T., Mellinger D. K., Balcazar N. E., et al. (2015). Temporal Segregation of the Australian and Antarctic Blue Whale Call Types (Balaenoptera Musculus Spp.). J. Mammal. 96 (3), 603–610. doi: 10.1093/jmammal/gyv065
Wedekin L. L., Engel M. H., Andriolo A., Prado P. I., Zerbini A. N., Marcondes M. M. C., et al. (2017). Running Fast in the Slow Lane: Rapid Population Growth of Humpback Whales After Exploitation. Mar. Ecol. Prog. Ser. 575, 195–206. doi: 10.3354/meps12211
Xue Y., Balmaseda M. A., Boyer T., Ferry N., Good S., Ishikawa I., et al., (2012). A Comparative Analysis of Upper-Ocean Heat Content Variability from an Ensemble of Operational Ocean Reanalyses. J Clim, 25 (20), 6905–29. doi: 10.1175/jcli-d-11-00542.1
Yasuhara M., Danovaro R. (2016). Temperature Impacts on Deep-Sea Biodiversity. Biol. Rev. 91 (2), 275–287. doi: 10.1111/brv.12169
Keywords: baleen whale, long-term change, climate change, interannual variability, environmental drivers, Indian Ocean Dipole (IOD), El Nino Southern Oscillation (ENSO), sea surface temperatures
Citation: Huang JL, Leroy EC, Truong G and Rogers TL (2022) Changes of Oceanic Conditions Drive Chagos Whale Migration Patterns in the Central Indian Ocean. Front. Mar. Sci. 9:843875. doi: 10.3389/fmars.2022.843875
Received: 27 December 2021; Accepted: 26 May 2022;
Published: 23 June 2022.
Edited by:
Olaf Meynecke, Griffith University, AustraliaReviewed by:
Jennifer Allen, Griffith University, AustraliaPeter Corkeron, New England Aquarium, United States
Copyright © 2022 Huang, Leroy, Truong and Rogers. This is an open-access article distributed under the terms of the Creative Commons Attribution License (CC BY). The use, distribution or reproduction in other forums is permitted, provided the original author(s) and the copyright owner(s) are credited and that the original publication in this journal is cited, in accordance with accepted academic practice. No use, distribution or reproduction is permitted which does not comply with these terms.
*Correspondence: Tracey L. Rogers, t.rogers@unsw.edu.au